Article

Understanding the Response of Wheat-Chickpea Intercropping to Nitrogen Fertilization Using Agro-Ecological Competitive Indices under Contrasting Pedoclimatic Conditions

1
Ecole Nationale Supérieure Agronomique (ES1603), Laboratoire d’Amélioration Intégrative des Productions Végétales (C2711100), Département de Productions Végétales, Avenue Hassane Badi, El Harrach, Algiers 16200, Algeria
2
Department of Agrobiotechnology, Peoples’ Friendship University of Russia (RUDN University), 6 Miklukho-Maklaya Street, 117198 Moscow, Russia
3
UMR SELMET, INRAE, 34000 Montpellier, France
*
Author to whom correspondence should be addressed.
Agronomy 2021, 11(6), 1225; https://doi.org/10.3390/agronomy11061225
Submission received: 10 April 2021 / Revised: 5 May 2021 / Accepted: 19 May 2021 / Published: 17 June 2021
(This article belongs to the Special Issue Biological Nitrogen Fixation Technology in Sustainable Agroecosystem)

Abstract

:
Wheat–chickpea intercrops are not well studied, despite the importance of these two species in increasing agricultural profitability and ensuring nutritional and food security. The present study aims to assess the intercropping arable system’s services under contrasting field management and climate conditions. Simultaneously, this assessment focuses on the most agronomic and ecological indices widely used in the literature. Durum wheat (Triticum turgidum durum L.cv. VITRON) and chickpea (Cicer arietinum L.cv. FLIP 90/13 C) were cultivated, both in sole crop and intercrop during the 2018/2019 growing season. A field experiment was carried out under controlled conditions at three contrasting pedoclimatic sites and under three levels of N fertilization. Both grain and N yield of mixture crop were significantly higher (+11%) when chickpea and durum wheat were grown together under either low or moderate N application. Soil N availability as compared to the critical level increased by more than 19% from flowering to harvest stage for intercropped wheat under low N application (N-30 and N-60), while it decreased significantly for intercropped chickpea. In rich N soils and under low rainfall conditions (site 1 and 3), intercropping was generally more advantageous for yield (+14%), N yield (+23%), and land use (103 and 119.5% for grain and N yield, respectively) only with reduced N fertilization as assessed using both land equivalent ratio (LER) and land-use efficiency (LUE). Competition dominance was directly affected by changes in climatic conditions over sites; intercropped wheat was more competitive than their respective chickpea under low rainfall conditions. These findings illustrate the crucial role of competitive index assessment in intercropping to promise a robust method for crop N and yield diagnosis during fertilization decision-making.

1. Introduction

Intercropping is the cultivation of different crops in the same field and at least for a part of their growing season. This system represents the primary planting arrangement of nature itself. However, the mechanization of agriculture and cheap fossil fuel availability in the mid-20th century resulted in a decreased prevalence of the practice. Enticed by the short-term benefits and modern machinery, industrialized nations drifted from intercropping in exchange for streamlined monocultures [1], but this does not seem to be a sustainable system, as fossil fuels tend to run out and are non-renewable. Moreover, the global demand for agricultural and food production is constantly growing [2]. Additionally, modern agricultural practices receive criticism due to their destructive effects by impacting ecosystem services and climate stability [3]. To address these challenges of agricultural food production, novel system production favors species diversification over space (i.e., legumes–cereals intercropping system) to promote agro-ecosystem services and resilience to external perturbations, agro-environmental and socio-economic changes [4]. Legumes–cereals intercropping systems are considered to be one of the most efficient cropping systems that can (i) enhance resource use efficiency (especially water and N); (ii) increase resilience to abiotic stresses such as drought; and (iii) control weeds, pests, and diseases without the use of pesticides [5]. Thanks to the legume N2 fixation, the intercropped cereals are less reliant on N fertilizers than their respective in monoculture. As a result, legumes–cereals intercrops form part of the solution for reducing N fertilizers application, particularly under low N soil conditions [6].
N is considered the main limiting factor after the water deficit in agriculture. N fertilization can provide a sufficient N supply for the crop to achieve potential yield allowed by the actual climatic conditions [7]. However, crop productivity and quality have been slowly improved in the most of world agro-ecosystems over recent decades, despite the overuse of nutrient fertilizer, especially N fertilizers [8]. Excessive N application by farmers may be related to (i) N fertilizers prices that are relatively cheap; (ii) overestimation of the amount of required N fertilizer relative to the desirable yield by farmers; and (iii) crop yield losses due to climate change, in particular the changes in temperature and precipitation. In turn, this could be attributed to increasing use of agricultural inputs, including N fertilizers [9].
This could have drastic consequences on the environment by the pollution of water tables by nitrate leaching. When considering climate change, N fertilizer cost should be evaluated in terms of CO2 equivalent released into the atmosphere by fertilizer factories, and the emission of N2O from cropping systems should also be included [10]. Intercropping could solve these problems as the cereals–legumes mixture has shown agronomic and ecological advantages. The legume fixes the N2 thanks to the rhizobia–root nodule symbiosis, which gives the cereal enough N to finish its cycle with minimizing N fertilizer use. This could contribute to improve crop N use efficiency and limit excessive/overuse of N from fertilization.
Several factors can affect crop growth and yield in mixed crop, particularly planting ratio, spatial arrangement, plant density, cultivar, and competition between mixture components [11]. Competition is one of the main factors that significantly affect both growth and yield of intercropped species as compared to monoculture [12]. High yields are achieved with intercropping when the interspecific competition is lower than intra-specific competition [13]. The assessment of competition and agronomic advantages of intercropping in most studies was conducted using intercropping indices such as land equivalent ratio (LER), relative crowding coefficient (K or RCC), and competitive ratio (CR). In this research study, we used the NNI (nitrogen nutrition index) as a centered tool for assessing the intercropping system in additions to those indices. Moreover, some work has been done on wheat–chickpea intercropping, but it is still a little bit compared to other legumes–cereals intercropping. According to the recent literature, little is known about the intercropping indices assessment under different N fertilizer levels applied in contrasting fields in terms of pedoclimatic conditions.
This study focuses on the agro-ecological diagnosis of the durum wheat and chickpea crop, which have a strategic place in food production system. The main objective of this research is to assess the dynamic change in agro-ecological indicators (i.e., yield, land use, and crop N use efficiency) because of the combined effect by N fertilizer rate and intercropping system. We hypothesize that due to biological N2 fixation by intercropped chickpea in low N soil and water availability, yield and N use efficiency by intercropped durum wheat may be higher than their counterparts in sole cropping under low N application.
To provide better decisions that can help farmers optimize land use and N application in either monocropping or intercropping systems, this study has three sub-objectives: (i) to assess durum wheat–chickpea intercrops in terms of agronomic advantages by calculating indices such as LER, ATER (area time equivalent ratio), and LUE; (ii) to evaluate the efficiency in N use by each cropping system and identify the optimal fertilization rate; and (iii) to highlight the competitiveness between both intercropped species by estimating REI (Relative Efficiency Index), CR, and RCC indices.

2. Materials and Methods

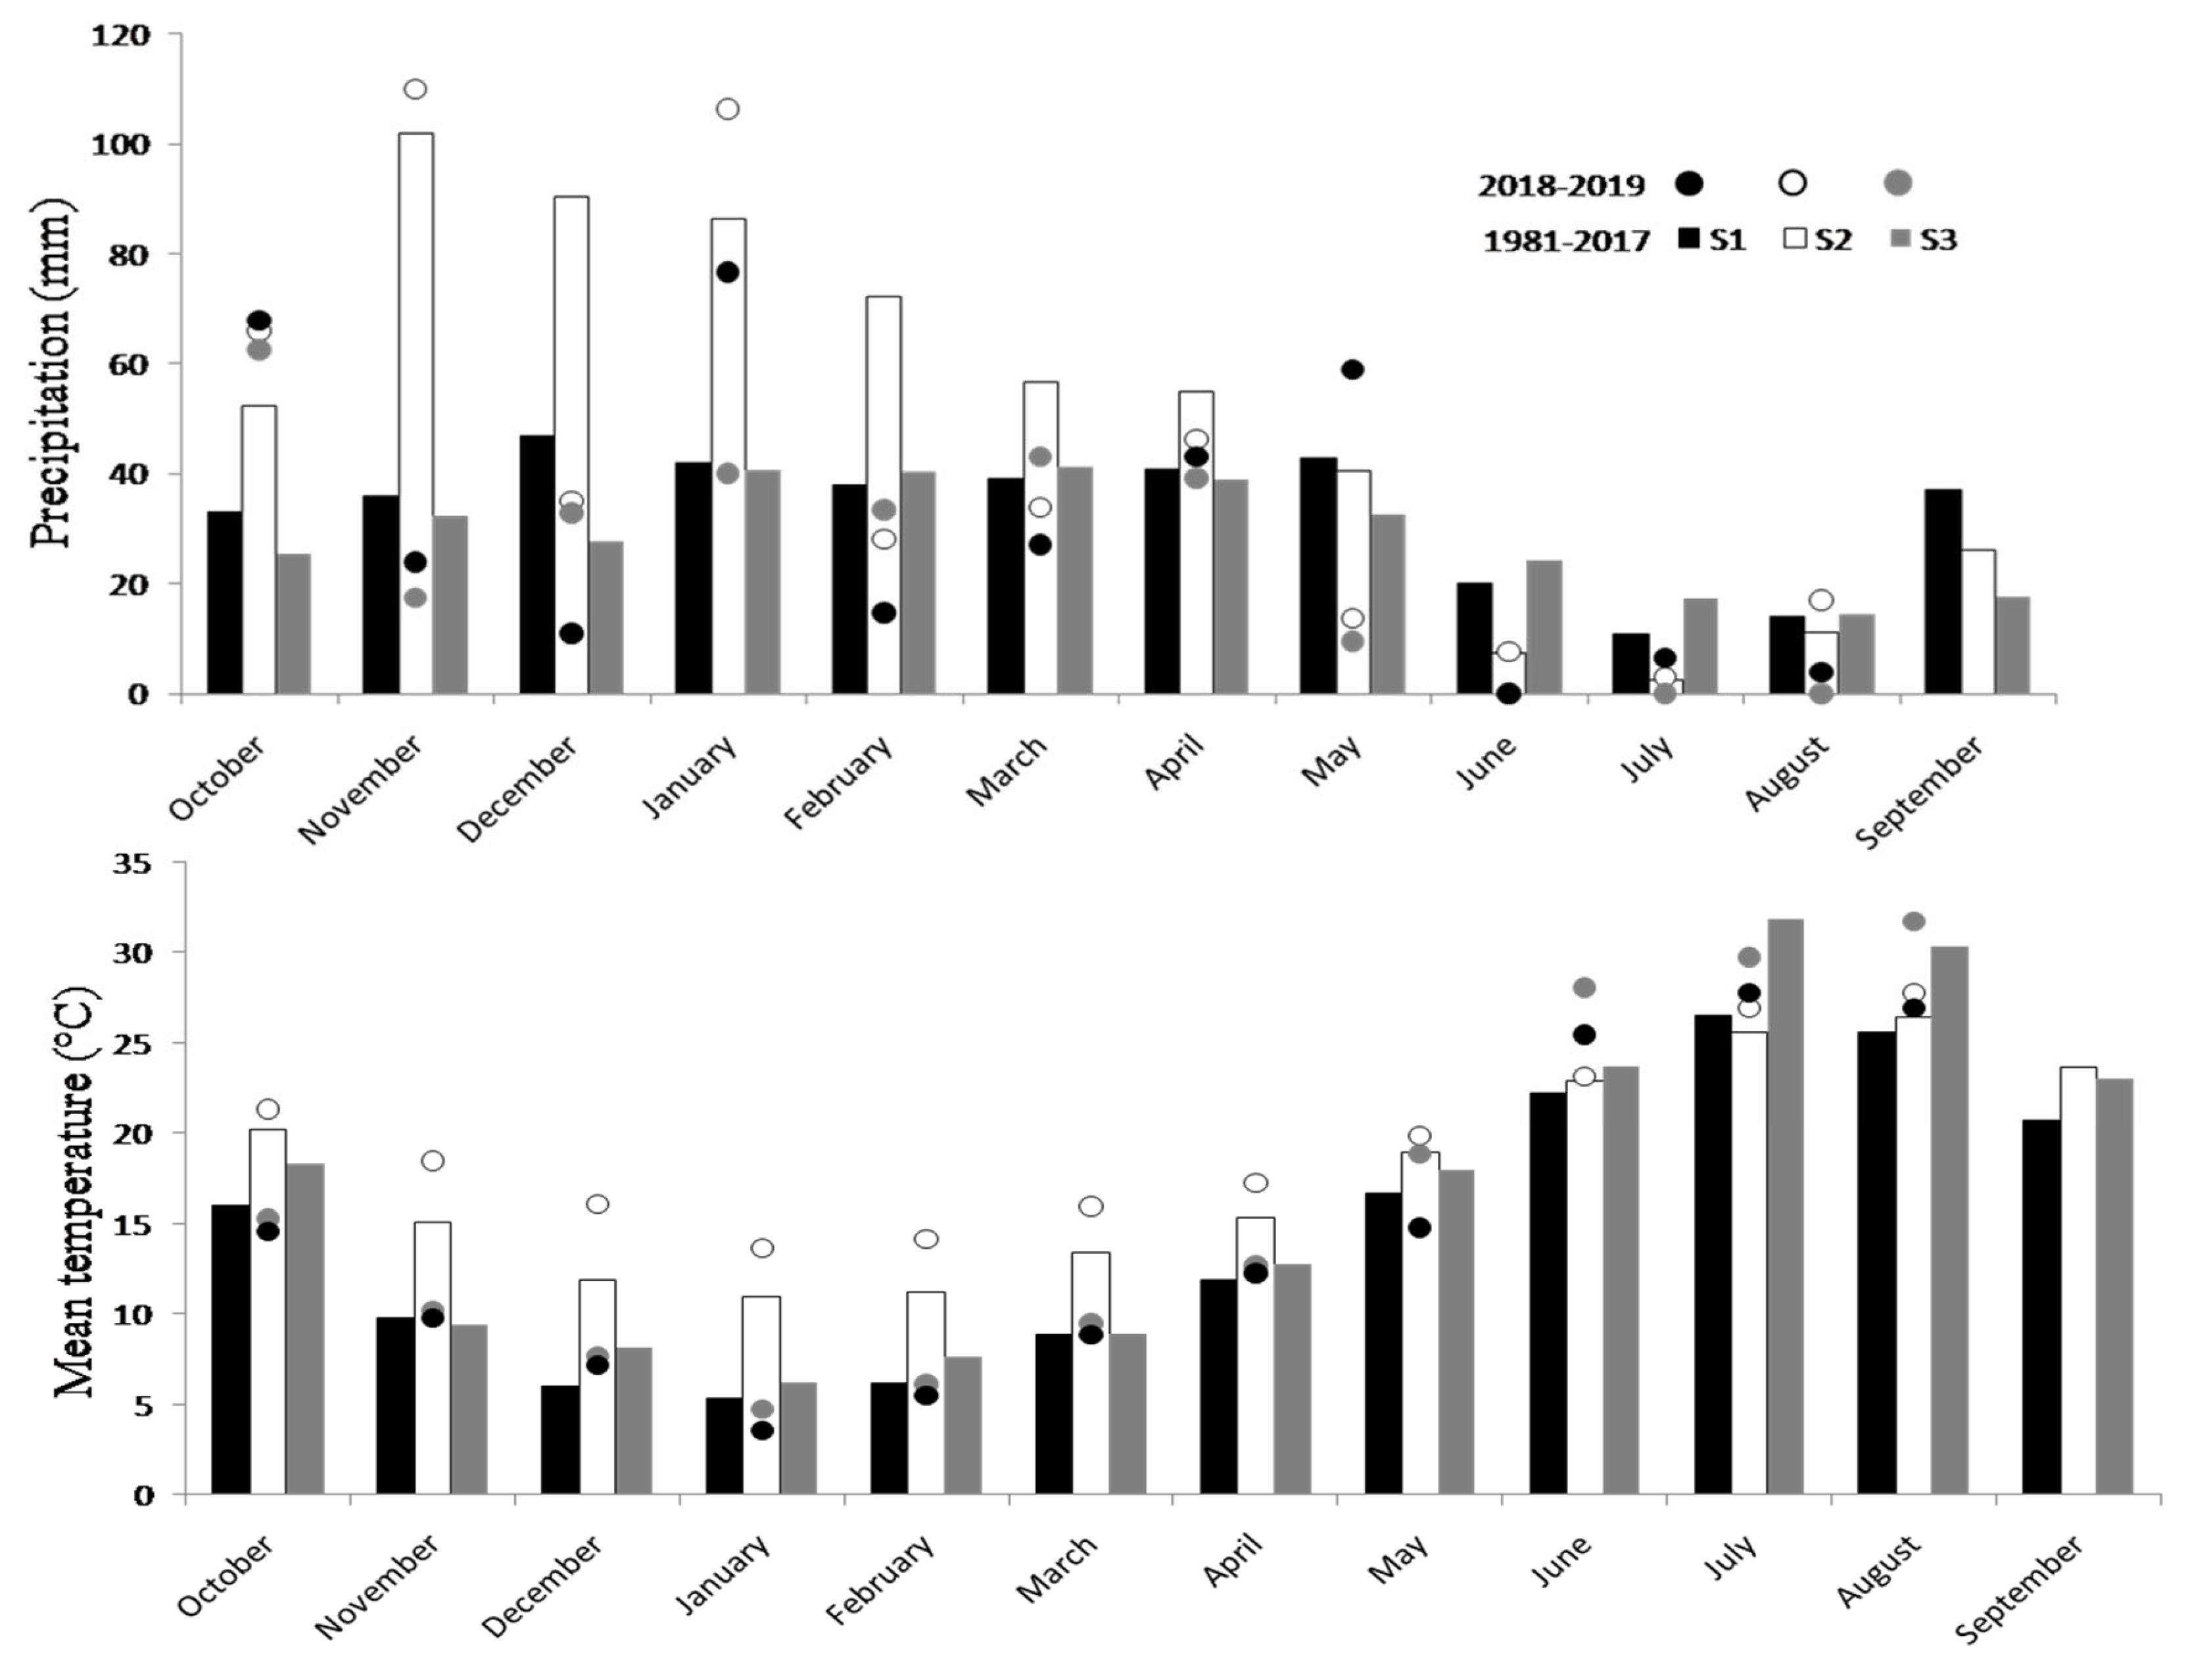
2.1. Experimental Site and Pedoclimatic Conditions

This study was carried out during the growing season from December 2018 to June 2019, under field conditions in three experimental sites: S2 is situated in the Oued Smar region, northeast of Algiers (36°42′ N, 3°09′ E). The S1 and the S3 are situated respectively in the north (36°06′ N, 5°20′ E) and the south (35°53′ N, 5°39′ E) of the Sétif region.
In Figure 1, we can see that for S2, the sum of precipitation during the growing season was 270.7 mm, the highest and the lowest precipitation was noted in January and June, respectively (106.5 mm and 7.5 mm). The temperatures ranged from 13.7 °C to 23.2 °C, with the highest temperature noted in June and the lowest in January (27.72 °C and 9.57 °C, respectively). The annual rainfall noted in S1 and S3 was respectively 231.9 mm and 198.47 mm. Temperatures varied for both sites from 3.6 °C and 4.77 °C, respectively in January up to 25.5 °C and 25.2 °C in June.
Figure 1 also shows monthly mean values of both precipitations and temperatures observed over the period 1981–2017. We noticed the same pattern with the repartition of temperature and precipitation within 1 year, but with overall lesser precipitations and higher temperatures; this may be linked to climate change and the year’s dryness.
The physical and chemical soil properties of each studied site (Table 1) were significantly different among sites, except for the loam rate. The results showed that the clay proportion (from 42.5% to 56.5%) was higher for all soils from studied sites compared to both loam (from 34.8 to 35.8%) and sand (from 8.4 to 21.7%) proportions. Soil pH ranged from 7.90 to 8.38 and was much more alkaline in the Sétif experiment field sites (S1 and S3). The soil in S1 and S3 was also classified as a calcareous soil with a significant highest content of CaCO3 (from 20.6 to 21.9%) as compared to S2 (1.1%). Both N available (NH4 + NO3) and total N content were also significantly differed between field sites. The greater N content was observed in S3 (2.4 g kg−1) and the lowest N content (1.4 g kg−1) was measured in both S1 and S2. The same trends were found for soil organic matter, total P and P available content within a significant difference among the three studied sites (Table 1).

2.2. Cropping and Field Plot Design

The study was carried out with one chickpea cultivar (Cicer arietinum L.cv. FLIP 90/13 C) and one durum wheat cultivar (Triticum turgidum durum L.cv. VITRON) that are commonly cultivated by Algerian farmers. The performed experimental design (split-plot) was divided into three blocks, each block divided into nine plots (nine treatments). Both cropping systems and N fertilizer rate treatments were combined in each plot. Three levels were tested from each studied factor: sole cropped durum wheat, sole cropped chickpea, and intercropping chickpea–durum wheat. For N fertilizer treatment, three levels were chosen; 30-, 60-, and 100-units ha−1 (Named N-30, N-60, and N-100). Each treatment (plot) was composed of three replicate plots with an area of 25 m2 for each one. The total experiment area covered 1311 m2 including borders area. The plant density was chosen according to the local standard cropping practices. There was a total of 300 plants per m² for sole durum wheat, 30 plants per m² for sole chickpea, and 150 and 18 plants for intercropped durum wheat and chickpea, respectively. The row ratio was 1:1. The two species were sown row by row in intercropped plots. The inter-row distance was 17 cm for sole cropped durum wheat, while it was 30 cm in both sole chickpea and the intercrop plots. The experiment was conducted under rainfed conditions for all experiment sites without irrigation and weed treatment.

2.3. Plant and Soil Sampling and Measurements

During the crop cycle, soil and plant samples were taken during three sampling periods corresponding to sowing, flowering (150 days after sowing (DAS) for S1 and S3 and 137 DAS for S2), and harvest stage (167 DAS for S1 and S3 and 177 DAS for the S2) from cropping cycle. Three sub-replicates (0.25 m2 quadrat) were chosen in each plot replicate, in which all plants were harvested and then separated from their roots at the cotyledonary node. Plant biomass and grain yield were dried for 24 h at 105 °C, and weighed before and after each operation.
Physico-chemical analysis of the soils from each site were performed through standard methods. N content in both soil and plant sample was determined by Kjeldahl method [14]. The soil pH was measured in the soil suspension with deionized water (soil:water ratio = 1:2.5) with a pH meter [15]. The well-known Olsen method was used for P availability measurement, while the total soil P content was determined using Malachite green procedure, after mixed digestion by both perchloric and nitric acids [16]. Organic matter in the soil was measured with the Anne method [17], while the calcium carbonate (CaCO3) proportion in the soil was measured by measuring the CO2 volume according to the Horton and Newson method [18]. Total biomass (N-biomass) and grain N uptake (N yield) in t ha−1 was estimated by multiplying total biomass and grain yield by their respective N content rates. The N seed average content was subtracted from the whole biomass and grain N content.

2.4. Calculation

To assess and evaluate chickpea–durum wheat intercrops, we used competitive indices within the common formulation that is reported in the literature. Land Equivalent Ratio (LER) indicates yield advantage in intercrop as compared to monocropping system under similar unit area between the two systems (Equation (1)).
LERab = Yab/Yaa + Yba/Ybb
Yaa and Ybb are the yields in the sole crop for species a and b. Moreover, Yab and Yba are the yields in intercropping for species a and b, respectively. If LERab is >1, there is an advantage in intercrop [19].
LER is currently the most common index used in intercropping assessment. In this study, the LER values were estimated for all treatments to better assess the crop performance in terms of grain and N yield. Area time equivalent ratio: ATER was developed by Hiebsch et al. [20] to consider the cycle duration of both intercropped species (Equation (2)). ATER is considered to be a more realistic index than LER where crop cycle period is not the same among crop a and crop b.
ATER = (ATERa + ATERb)
ATERa = Yab/Yaa × Ta/Ti
ATERb = Yba/Ybb × Tb/Ti
Ta is the duration of the crop cycle of the crop a, Tb corresponds to the duration of the crop cycle of the crop b, and Ti of the intercropping cycle.
Land-use efficiency: LUE is a calculation based on LER and ATER that permits a more precise estimation about land-use efficiency; it was calculated according to the Mason et al., equation [21] (Equation (5)):
LUE = (LER + ATER)/2
Relative crowding coefficient: RCC or K is calculated for each species in the intercrop, which represents the relative dominance of one component of the intercrop over the other one. The calculation of RCC was given in Equation (6) [22]:
K = Kab + Kba
Kab = Yab × Zba/[(YaaYab) × Zab]
Kba = Yba × Zaa/[(YbbYba) × Zba]
Zab corresponds to the ratio of species a to species b in intercropping and Zba to the opposite ratio. Moreover, Kab and Kba are the relative crowding coefficient of each crop in intercrops.
Competitive ratio: CR is a competitive index that considers individual LER and the mixture proportion in the intercrop. CR was calculated according to Equations (9) and (10) [23]:
CRa= (LERa/LERb) × (Zab/Zba)
CRb= (LERb/LERa) × (Zba/Zab)
Relative Efficiency Index: REI is calculated to compare the relative performance in dry matter accumulation of the intercrop components over a time interval (t1 and t2). The REI calculation was done within Equation (11) [24].
REI = REIa/REIb
REIa = DMa t1/DMa t2
REIb = DMb t1/DMb t2
DMa and DMb are the total aboveground (dry matter) accumulated by species a and b, respectively. The REIa and REIb refer to the proportional change of both species in terms of total dry matter. The NNI is calculated by the ratio (Equation (14)) between the actual crop N (Na) and the critical N (Nc) uptake. Na estimation corresponds to actual crop biomass Wa, while Nc was defined as the minimum N uptake for the maximum biomass accumulation (Equation (15)).
NNI = Na/Nc
Nc = ac W b−1
with ac being the critical plant N concentration for W = 1 t ha−1, The ac and b coefficients were determined (3.4 and 0.37 for durum wheat and 5.1 and 0.32 for Chickpea, respectively) by Plènet and Lemaire [25].

2.5. Statistical Analysis

The data were tested for homogeneity of variance before statistical analysis. All treatment effects (i.e., cropping system, N fertilizer levels and cropping system×N fertilizer levels) on all measured variables and calculated indices were tested using factorial analysis of variance (ANOVA) at a significance of p-value = 0.05. Tukey’s test was performed to identify whether the difference between mean values where treatments significantly affect variables. The statistical analyses were performed using Statistica 8 for Windows.

3. Results

3.1. Grain and N Yield

For most treatment, both grain N yields were significantly affected by cropping system, N fertilizer and cropping×N fertilizer treatment in the three studied sites (Table 2). Grain yield range goes from 0.54 t ha−1 in N-30 treatment for intercropped wheat in S1 to 6.95t ha−1 for N-100 in S3 for the sole wheat crop. Chickpea grain yield values varied from 0.21 t ha for the N-100 rate in intercropped plots of S3 to 2.43 t ha−1 for the monocropped chickpea under N-60 treatment in S3.
The grain yield of mixture crop was significantly increased (+29%) in intercropped plots in S2 and under low N fertilizer (N-30 and N-60) conditions, while it decreased (−38%) in the Sétif experiment sites (S1 and S3). We note higher grain yields in N-60 rate for all cropping treatment, except for wheat cultivated in sole cropping, in which N-100 rate was given the higher grain yields (Table 2). In the case of N yield, monocropping significantly increases the N uptake by grain crop as compared to intercropping. By contrast, for both chickpea and durum wheat respectively grown in S1 and S3, N yield was greater (+31 and +55% for chickpea and wheat, respectively) in intercropping than sole crop, and more precisely under the low N fertilizer treatment (N-30). In terms of mixture crop, both grain and N yield uptake by mixed species were significantly increased under S2 and S3 conditions as compared to those from monocropping, where a more pronounced increase (+46%) was found in S3 in both low and moderate N application rate (Table 2).
The opposite trend was observed in S1 with decreasing of grain or N yield by intercropping for both chickpea and durum wheat crop.

3.2. Nitrogen Nutrition Index and Soil-Crop N Status

The NNI values for cultivated chickpea and wheat as sole crop and intercrops are shown in Table 3. In all field-experiment sites, NNI was greater than 1 for only chickpea grown as intercrops under all N fertilizer rates and during only flowering stage. This indicates an optimum N condition for growth in intercropped plots as compared to soil N critical level. Regardless of ANOVA results, NNI values were affected significantly by the interaction crop×N level in the case of durum wheat, except during harvest stage in S2. However, no significant effect was observed for chickpea, except in S2 and S3 during flowering and harvest time, respectively (Table 3).
During harvest period, NNI values were significantly less than 1 for chickpea in most of the sole cropped plots and N application rates. At the flowering stage, N soil availability for intercropped chickpea was greater than the N critical status (NNI = 1) by more than 67% under low and moderate N application (N-30 and N60), except for N-30 applied in S3 (Table 3). According to NNI values, the high N soil availability at harvest time was observed under moderate N fertilizer level for both cropping systems, and which represent more than 75% of the N critical level. In the case of durum wheat, for both flowering and harvest time, NNI values were lower than 1 in all cropping, sites and N fertilizers level treatments, except for wheat grown as intercrops in S2 and S3 and under moderate N application (NNI:1.13 and 1.66, respectively for S2 and S3 at harvest period). Passing from flowering to harvest stage of durum wheat crop, NNI values indicate that N soil availability were significantly increased in both mono and intercropped plots, while this increase was more pronounced under intercropping and low N application conditions (N-30 and N-60 rates).

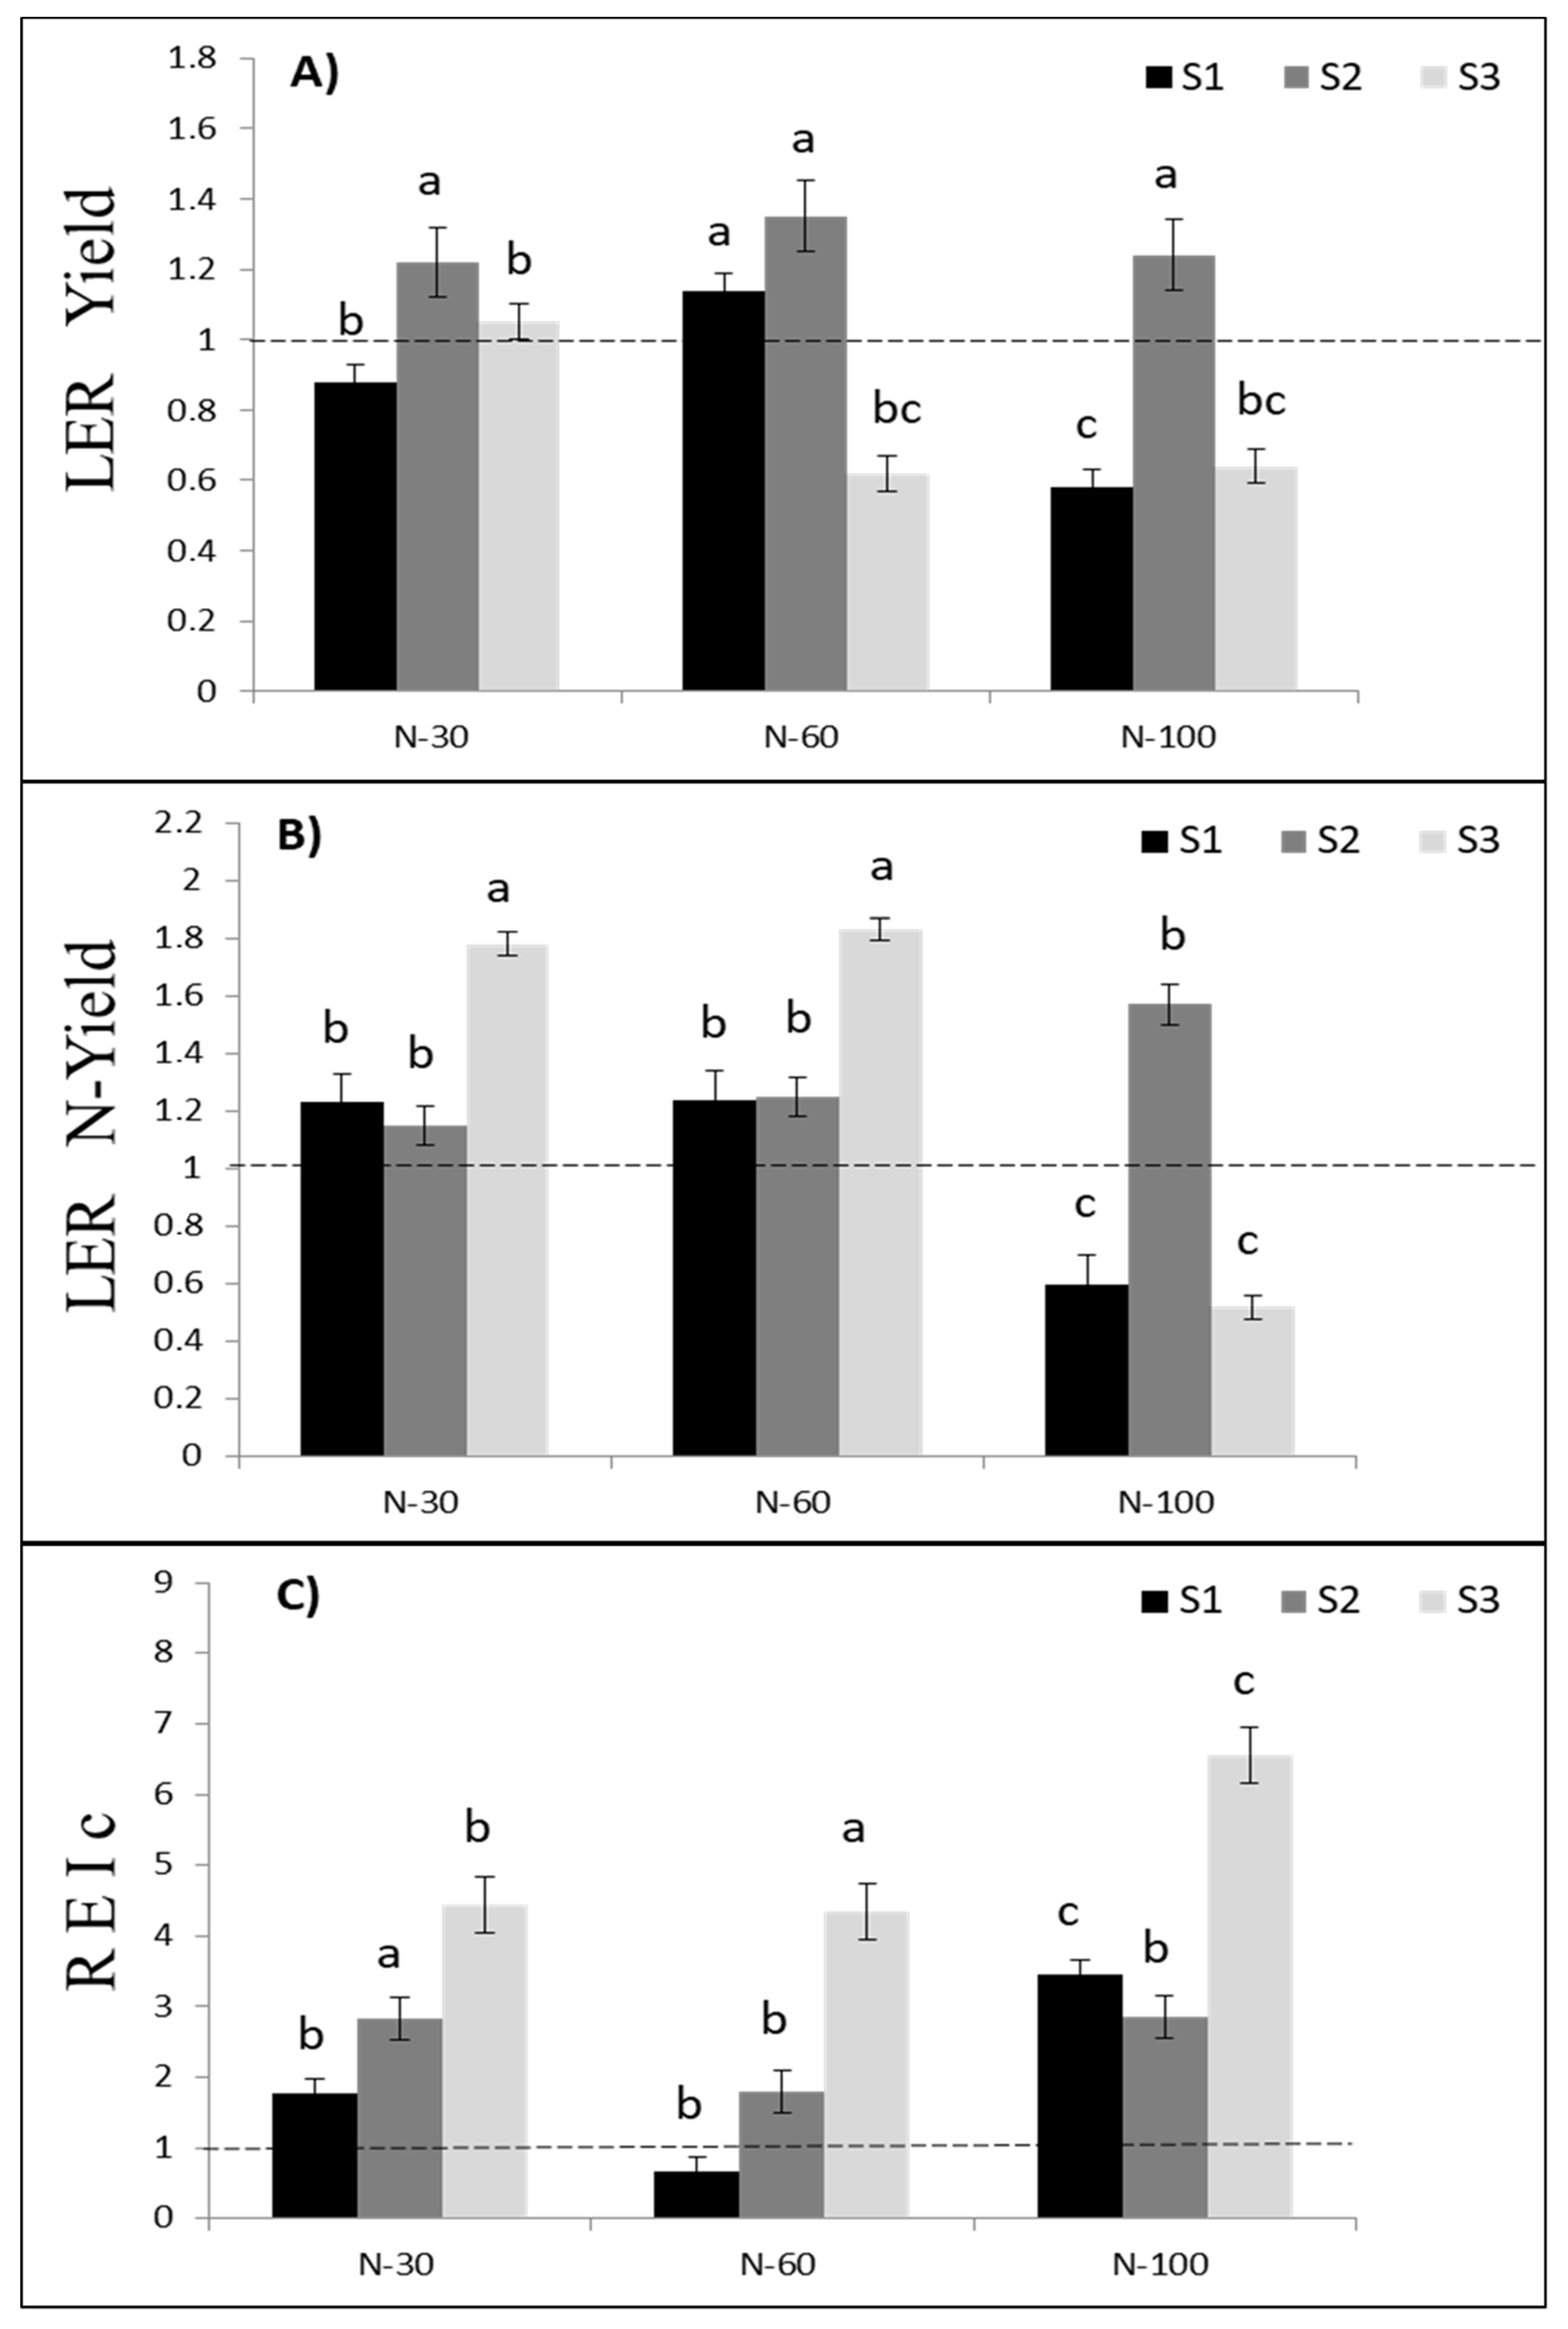
3.3. Land Equivalent Ratio and Radiation Efficiency Index

According to the results reported in Figure 2 LER values were significantly affected by site×N level treatment for both grain and N yield. Intercropping advantage (LER > 1) was only confirmed under moderate N in S1 (+14%) and low N application in S2 (+5%).
However, in low N soil and under high rainfed conditions (S2), intercropping chickpea–wheat was significantly advantageous in terms of grain yield under the three levels of N fertilizer. This last intercrop advantage was more pronounced (+35%) with moderate N application (Figure 2). The same trend was observed for LERNyield but with a significant intercropping advantage in S1 and S3 for both low N and moderate N levels. Moreover, REI values were also significantly affected by site×N level treatment. The greater values were observed under high N application, while the lowest REI values were found under moderate N application in all experiment sites. The S3 noted the highest values of REI as compared to S1 and S2, in which REI was significantly increased by 50.90% under N-100 application compared to N-60 level (Table 4).

3.4. Area Time Equivalent Ratio and Land-Use Efficiency

According to Table 4, significant differences were found for all measured ATER values (i.e., grain and N yield) under site×N level treatment. In terms of copping period duration, intercropping advantage on both yield and N yield was confirmed under moderate and low N application in S1 and S2, respectively and under all N application rates in S2. The highest values of ATER in terms of yield were recorded in S2 indicating an advantage (18%) of intercropping over sole cropping system. The same trend was found for N yield where the greater intercropping advantage (19%) was significantly recorded in S2 under moderate and high N application (Table 4). Moreover, intercropping system was more efficient in land-use efficiency (LUE) only in terms of yield component. This was observed under moderate and low N application in S1 and S3, respectively. For N yield component, chickpea–wheat intercropping was more efficient in both moderate and low N in both S1 and S3. Under S2 conditions, the better land-use efficiency in terms of grain and N yield was confirmed in intercropping as compared to sole cropping under all N application rates.
For grain yield component, the highest efficiency in use of land by intercrops was recorded in S2 (126.5%) within moderate N application, while it was observed in S3 (142%) under low N application for N yield component (Table 4).

3.5. Relative Crowding Coefficient

Table 5 shows the calculated values of K at the three N application rates in each experiment site. In all site×N level treatments, wheat appeared to be dominant (kwheat > 1) in S2 and S3 when N is applied at moderate and low rates.
For chickpea, the dominance was observed in S1 under low N level, but it was greater at moderate N application where K was in maximum (kchickpea = 4.97). The trend observed for K chickpea in S2 was similar to that obtained in S3 but under all applied N fertilizer rates. Conversely, chickpea was dominated by intercropped durum wheat at the three levels of N fertilizer in S3 conditions where kchickpea values were significantly below than 1. In terms of the product of both Kwheat and Kchickpea, yield advantage (k > 1) of intercropping was confirmed only under moderate N application in S1 and under all applied N rates in S2. However, intercropping indicates yield disadvantage under S3 conditions at the three levels of N application (Table 5).

3.6. Competitive Ratio

To better understand competitive relationship between intercropped wheat and chickpea, Table 6 indicates all competitive ratios for grain and N yield of each species. Competitivity between chickpea and wheat was significantly varied by the combined effect of both site and N level treatment. Chickpea was more competitive for grain yield than wheat in S1 and S2 and particularly extra-competitive (RC = 3.13) in S1 under moderate N application. In contrast, durum wheat was more competitive than chickpea only under S3 conditions where their competitivity was more pronounced (CR = 3.38) with low N application (Table 6). The same trend was also observed for the competition on N acquisition by intercropped species in the three studied sites. Furthermore, durum wheat presents the highest level of competition on N acquisition (CR varied from 7.27 to 10.13) when it was intercropped with chickpea in S3.

4. Discussion

Arable crop diversification in same-space farming (i.e., intercropping legumes-cereales) is considered to be a resilient and sustaible practice to boost agro-ecosystem services [4,26]. Overall, our results indicate that there is a significant increase in yield of mixed chickpea–wheat by intercropping under both low N soil and high rainfed conditions. N acquisition by intercropped species was greater than that in monocropping particulary under low rainfed sites (Table 2). Thus, yield and N yield improvement were confirmed within either low (N-30) or moderate (N-60) N application. These interesting findings agree with these made recently at field scale on legumes–cereals intercrops but not under different pedoclimatic settings where clear evidence for the advantages of intercropping is lacking [2,27]. Among the combined effect between N application rates and constrating pedoclimatic zones, the principal novelty of this research paper was to analyze interspesific competition and facilitation (i.e., N acquisition and crop yield) proceses between chickpea and wheat cultivated in a sole crop and intercropping system. This assessment was performed by analysis of the most agro-ecological indicators related to the intercropping system thanks to NNI and intercropping index calculation.
The calculated values of NNI among all combined cropping system × N level treatments indicate an original finding regarding N nutrition for intercropped species. NNI for chickpea was greater than 1 only in intercropping at flowering stage, while it was lower than 1 in both cropping systems during harvest time (Table 3). This finding was systematically demonstrated under low and moderate N application in all experiment sites. In an organic cropping system without N fertilization, NNI for intercropped legumes (i.e., common bean and fava bean) and cereals (i.e., maize and durum wheat) was greater than 1 in intercropping [28,29].
Regardless of old and recent literature, NNI assessment in an intercropping system was only studied by these two last papers, and it was never performed under N application conditions. This could help both farmers and researchers in planning cropping system design (i.e., wheat and chickpea) based on either N fertilization or water managment. NNI values were also greater than 1 for intercropped wheat under moderate N application but conversely with intercropped chickpea. This was observed at the harvest period. Previous research has reported that flowering is the main phenological stage in which legumes fix the maximum amount of N through biological N2 fixation [30,31]. These authors also confirm that high N availability significantly decreases N fixation by legumes. These findings agree with our results performed on intercropping legumes–cereals under N application management. Enhancing N soil availability (NNI > 1) as compared to critical N level (NNI = 1) for both intercropped chickpea and wheat, respectively during flowering and harvest stage, demostrate the opportunity for complementary N use between the two species. This could contribute to improve N use effeciency by intercropped wheat cultivated under either high N soil input (low rainfed condition S3) or low N soil input (high rainfed condition S2).
The results of this study showed through the LER index (Figure 2) a significant advantage of wheat–chickpea intercropping as compared to monocropping. This advantage was prounced for both grain and N yield as a consequence of improving N use efficiency by intercropped species where N fertilizer is applied at either low or moderate rates. Our results on intercropping advantage in terms of grain yield were in line with recent research studies performed on arable mixture crops [32]. The observed disadvantage of intercropping under high N application (N-100) under low rainfed conditions (S1 and S3) is probably due to water deficits that reduce N demand as a consequence of growth. In contrast, intercropping advantage was confirmed under the higest rate (N-100) of N application in S2 where intercropping was practiced under high rainfed conditions (Figure 2). N absorption by roots is systematicly controlled by water availability [33], while decreasing N demand by crop from N fertilizers is significantly associated with a decrease of growth rate as a result of water shortage [34]. Furthermore, REI calculation provided an opportunity to better assess proportional growth of both intercropped species over a period of their cropping cycle.
REI walues were greater than 1 in each site×N level combination, except under moderate N application in S1. However, the higest values of REI were clearly observed in S3 (Figure 2) indicating a fast and robust growth of intercropped chickpea compared to chickpea grown as intercrop. This may be due to harsh weather conditions (i.e., high temperature, frost in winter days, and very low temperature) which are responsible for limiting chickpea germination during the sowing period. Intercropped wheat is less sensitive to this climate constraint compared to chickpea. This wheat advantage on grain yield is significantly reflected by CR index calculation (Table 6), where wheat CRyield and CRN yield are higher then those respectively for chickpea in S3, which indicates that wheat was more competitive than chickpea. A contrasting trend was obtained for both species intercropped in S1 and S2.
The competitive abilities of intercropped species is systematically controlled by climate and soil components. Research study reported that aggressivity and specific competition between intercropped legumes and cereals are more prounced under low nutrients and water availability [35,36]. In the case of our study, competition rate was not affected by nutrient resource availability (i.e., N fertilizers) but it was strongly changed by the combined effect of pedoclimatic conditions and N aplication rate. These results disagree with those reported by Yu et al. [37,38] which confirms a significant effect of N fertilizer on LER and competition for below and aboveground resources in the intercropping system. According to K (RCC) calculation (Table 5), competitive dominance of chickpea was greater than wheat only in low N soil sites (S1 and S2), while it was lower than that of intercropped wheat in S3 (high N soil). These last findings provided by competition indices (i.e., REI, CR and K) agree with those obtained for NNI and LER. This could be explained by facilitation (grain and N yield) and competitive dominance mechanisms that resulted from the positive interaction between intercropped species more precisesly in S1 and S2 (low N soil availability with moderate and high rainfed condition). However, in S3 conditions (low rainfed and high N soil availability) both grain and N yield gain was potentially related to both competition dominance and complementarity effect. These results are in line with the major findings reported by the recent research paper of Li et al. [39], while our field-experiment conditions provide more clarification and novel insight in terms of N fertilization and pedoclimatic factors driving both grain and N yield advange in chickpea–wheat intercropping.
In this study, ATER calculation provided the opportunity to better check and confirm LER values regardless of cropping time of each intercropped species. ATER was strongly correlated with LER for either monocropping or intercropping in all studied sites. This could be due to the smal difference (15 days) in time of cropping cycle of both intercropped species. Recent field research has reported a significant difference between ATER and LER under gourd–cassava and maize–peanut intercropping [36,40]. Furthermore, all calculated indices in intercrops were significantly linked to LUE index, indicating a strong coherence between yielding and N acquisition gain. Intercropping was more efficient in land use than monocropping, especialy under low and moderate N application for intercropped plots that receive either moderate (S1) or low rainfull (S3).
The major finding of this field research demonstrates that arable intercropping is a promising practice for agro-ecological intensification of both chickpea and durum wheat cultivated in either low N or water inputs. The results reported in this study could be considered to be the first assessment of intercropping response to N application under different pedoclimatic conditions. The effective use of the main results from this research study will be an interesting challenge to design optimized intercropping systems that are productive and efficient in use of N and water ressources.

5. Conclusions

Most of the results reported in this field investigation are considered to be the first original findings on the agro-ecological assessment of chickpea–durum wheat intercropping system, using calculated indices. The principal novelty performed in this study concerns the integrative diagnosis (i.e., biomass, yield, N yield, and growth dynamic) of the N status in intercropping under contrasting pedoclimatic and N fertilization conditions. Results indicate two conditions that make intercropping advantageous. The first, which is linked to nitrogen input, shows that the system performs better when the nitrogen is high enough to maximize N2 symbiotic fixation while also contributing to the cereal crop nutrition. Second, chickpea must be the most dominant crop component, as long as this dominance is moderated. The interspecific competition between chickpea and durum wheat was directly affected by changes in either climatic or N fertilizer conditions over sites. Intercropped cereal was more competitive than its respective legume under both low rainfall and N application conditions. However, the estimation of economic indices will complete and improve the intercrop advantage assessment, in particular when agronomic advantages are not correlated with economic benefit.

Author Contributions

O.K.: Manuscript writing, data collection, plant and soil sampling and laboratory analysis. M.S. and B.Z.: Data calculation and statistical analysis. M.I.K. and A.B.: contributions partially in data collection and plant and soil analysis. R.Y.-N. and W.O.: General lecture and revision of manuscript sentences and the major revision. M.L.: Methodology formulation, the manuscript writing, revision, and supervision, field management, and data collection and corresponding author. All authors have read and agreed to the published version of the manuscript.

Funding

The authors received financial support from the Directorate General of Scientific Research and Technological Development (DGRSDT-MESRS) within the framework of ARIMNET2-SEMIARID project call (Kherif O and Latati M., data collection, organization, and analysis). This work was partially funded by the PRIMA Foundation, call 2019-Section 1—GA n.X “Research-based participatory approaches for adopting Conservation Agriculture in the Mediterranean Area—CAMA” project. This work was also funded by the PRFU project (D04N01ES160320190001) run by the Algerian Ministry of Higher Education and Scientific Research (M. Latati., Research work planification). This paper has been supported by the RUDN University Strategic Academic Leadership Program.

Conflicts of Interest

The authors declare no conflict of interest.

References

  1. Glaze-Corcoran, S.; Hashemi, M.; Saghpour, A.; Jahnazad, E.; Afshar, R.K.; Liu, X.; Herbert, S.J. Understanding intercropping to improve agricultural resiliency and environmental sustainability. Adv. Agron. 2020, 162, 199–256. [Google Scholar]
  2. Latati, M.; Dokukin, P.; Aouiche, A.; Rebouh, N.Y.; Takouachet, R.; Hafnaoui, E.; Hamdani, F.Z.; Bacha, F.; Ounane, S.M. Species interactions improve above-ground biomass and land use efficiency in intercropped wheat and chickpea under low soil inputs. Agronomy 2019, 9, 765. [Google Scholar] [CrossRef] [Green Version]
  3. Loreau, M.; Sapijanskas, J.; Isbell, F.; Hector, A. Niche and fitness differences relate the maintenance of diversity to ecosystem function: Comment. Ecology 2012, 93, 1482–1487. [Google Scholar] [PubMed] [Green Version]
  4. Kherif, O.; Keskes, M.I.; Pansu, M.; Ouaret, W.; Rebouh, Y.N.; Dokukin, P.; Kucher, D.; Latati, M. Agroecological modeling of nitrogen and carbon transfers between decomposer micro-organisms, plant symbionts, soil and atmosphere in an intercropping system. Ecol. Model. 2021, 440, 109390. [Google Scholar] [CrossRef]
  5. Peoples, M.B.; Hauggaard-Nielsen, H.; Huguenin-Elie, O.; Jensen, E.S.; Justes, E.; Williams, M. The contributions of legumes to reducing the environmental risk of agricultural production. In Agroecosystem Diversity; Academic Press: Cambridge, UK, 2019; pp. 123–143. [Google Scholar] [CrossRef]
  6. Louarn, G.; Bedoussac, L.; Gaudio, N.; Journet, E.P.; Moreau, D.; Jensen, E.S.; Justes, E. Plant nitrogen nutrition status in intercrops– a review of concepts and methods. Eur. J. Agron. 2021, 124, 126229. [Google Scholar] [CrossRef]
  7. Lemaire, G.; Meynard, J.M. Use of the nitrogen nutrition index for analysis ofagronomical data. In Diagnosis on the Nitrogen Status in Crops; Lemaire, G., Ed.; Springer: Berlin/Heidelberg, Germany, 1997; pp. 45–55. [Google Scholar]
  8. Cai, J.; Xia, X.; Chen, H.; Wang, T.; Zhang, H. Decomposition of Fertilizer Use Intensity and Its Environmental Risk in China’s Grain Production Process. Sustainability 2018, 10, 498. [Google Scholar] [CrossRef] [Green Version]
  9. Wehmeye, H.; De Guia, A.H.; Connor, M. Reduction of Fertilizer Use in South China—Impacts and Implications on Smallholder Rice Farmers. Sustainability 2020, 12, 2240. [Google Scholar] [CrossRef] [Green Version]
  10. Lemaire, G.; Jeuffroy, M.H.; Gastal, F. Diagnosis tool for plant and crop N status in vegetative stage Theory and practices for crop N management. Eur. J. Agron. 2008, 28, 614–624. [Google Scholar] [CrossRef]
  11. Rezaei-Chianeh, E.; Dabbagh, M.N.A.; Shakiba, M.R.; Ghassemi-Golezani, K.; Aharizad, S.; Shekari, F. Intercropping of maize (Zea mays L.) and faba bean (Vicia faba L.) at different plant population densities. Afr. J. Agric. Res. 2011, 6, 1786–1793. [Google Scholar]
  12. Caballero, R.; Goicoechea, E.L.; Hernaiz, P.J. Forage yields and quality of common vetch and oat sown at varying seeding ratios and seeding rates of vetch. Field Crop. Res. 1995, 41, 135–140. [Google Scholar] [CrossRef]
  13. Zhang, J.; Smith, D.L.; Liu, W.G.; Chen, X.F.; Yang, W.Y. Effects of shade and drought stress on soybean hormones and yield of main-stem and branch. Afr. J. Biotechnol. 2011, 10, 14392–14398. [Google Scholar]
  14. Lynch, J.M.; Barbano, D.M. Kjeldahl nitrogen analysis as a reference method for protein determination in dairy products. J. AOAC Int. 1999, 82, 1389–1398. [Google Scholar] [CrossRef] [PubMed] [Green Version]
  15. Shen, A.L.; Li, X.Y.; Kanamori, T.; Arao, T. Effect of long-term application of compost on some chemical properties of wheat rhizosphere and non-rhizosphere soils. Pedosphere 1996, 6, 355–363. [Google Scholar]
  16. Valizadeh, G.R.; Rengel, Z.; Rate, A.W. Response of wheat genotypes efficient in P utilization and genotypes responsive to P fertilisation to different P banding depths and watering regimes. Aust. J. Agric. Res. 2003, 54, 59–65. [Google Scholar] [CrossRef]
  17. McBratney, A.B.; Odeh, I.O.A.; Bishop, T.F.A.; Dunbar, M.S.; Shatar, T.M. An overview of pedometric techniques for use in soil survey. Geoderma 2000, 97, 293–327. [Google Scholar] [CrossRef]
  18. Leo, M.W.M. Determination of soil carbonates by a rapidegasometric method. J. Agric. Food Chem. 1963, 11, 452–455. [Google Scholar] [CrossRef]
  19. Mead, R.; Willey, R.W. The concept of a ‘land equivalent ratio’ and advantages in yields from intercropping. Exp. Agric. 1980, 16, 217–228. [Google Scholar]
  20. Hiebsch, C.K.; McCollum, R.E. Area X Time Equivalency Ratio: A method for evaluating the productivity of intercrops. Agron. J. 1987, 79, 15–22. [Google Scholar] [CrossRef]
  21. Mason, S.C.; Leihner, D.E.; Vorst, J.J. Cassava-Cowpea and Cassava-Peanut Intercropping. I. Yield and Land Use Efficiency. Agron. J. 1986, 78, 43–46. [Google Scholar] [CrossRef]
  22. De Wit, C.T. On competition. Versl. Landbouw-Kundige Onderz. 1960, 66, 1–28. [Google Scholar]
  23. Willey, R.W.; Rao, M.R. A competitive ratio for quantifying competition between intercrops. Exp. Agric. 1980, 16, 117–125. [Google Scholar] [CrossRef]
  24. Connolly, J.; Wayne, P.; Murray, R. Time course of plant interactions in experimental mixtures of annuals: Density, frequency and nutrient effects. Oecologia 1990, 82, 513–526. [Google Scholar] [CrossRef] [PubMed]
  25. Plénet, D.; Lemaire, G. Relationships between dynamics of nitrogen uptake and dry matter accumulation in maize crops. Determ. Crit. N Concentration. Plant Soil 2000, 216, 65–82. [Google Scholar]
  26. Daryanto, S.; Jacinthe, P.A.; Fuab, B.; Zhao, W.; Wang, L. Valuing the ecosystem services of cover crops: Barriers and pathways forward. Agric. Ecosyst. Environ. 2019, 270, 76–78. [Google Scholar] [CrossRef]
  27. Abdulahi, A.; Nassab, A.D.M.; Nasrolahzadeh, S.; Salmasi, S.Z.; Pourdad, S.S. Evaluation of Wheat-Chickpea Intercrops as Influenced by Nitrogen and Weed Management. Am. J. Agric. Biol. Sci. 2012, 7, 447–460. [Google Scholar] [CrossRef] [Green Version]
  28. Latati, M.; Bargaz, A.; Belarbi, B.; Lazali, M.; Benlahrech, S.; Tellah, S.; Kaci, G.; Drevon, J.J.; Ounane, S.M. The intercropping common bean with maize improves the rhizobial efficiency, resource use and grain yield under low phosphorus availability. Eur. J. Agron. 2016, 72, 80–90. [Google Scholar] [CrossRef]
  29. Kaci, G.; Blavet, D.; Benlahrech, S.; Kouakoua, E.; Couderc, P.; Deleporte, P.; Desclaux, D.; Latati, M.; Pansu, M.; Drevon, D.; et al. The effect of intercropping on the efficiency of faba bean –rhizobial symbiosis and durum wheat soil-nitrogen acquisition in a Mediterranean agroecosystem. Plant. Soil Environ. 2018, 64, 138–146. [Google Scholar]
  30. Yong, T.; Chen, P.; Dong, Q.; Du, Q.; Yang, F.; Wang, X.; Liu, W.; Yang, W. Optimized nitrogen application methods to improve nitrogen use efficiency and nodule nitrogen fixation in a maize-soybean relay intercropping system. J. Integr. Agric. 2018, 17, 60345–60352. [Google Scholar] [CrossRef]
  31. Latati, M.; Blavet, D.; Alkama, N.; Laoufi, H.; Drevon, J.J.; Gérard, F.; Pansu, M.; Ounane, S.M. The intercropping cowpea-maize improves soil phosphorus availability and maize yields in an alkaline soil. Plant Soil 2014, 85, 181–191. [Google Scholar] [CrossRef]
  32. Song, Y.N.; Zhang, F.S.; Marschner, P.; Fan, F.L.; Gao, H.M.; Bao, X.G.; Sun, J.H.; Li, L. Effect of intercropping on crop yield and chemical and microbiological properties in rhizosphere of wheat (Triticumaestivum, L.), maize (Zeamays, L.), and faba bean (Viciafaba L.). Biol. Fert. Soil 2007, 43, 565–574. [Google Scholar] [CrossRef]
  33. Gonzalez-Dugo, V.; Durand, J.L.; Gastal, F.; Picon-Cochard, C. Short-term response of the nitrogen nutrition status of tall fescue and Italian ryegrass swards under water deficit. Aust. J. Agric. Res. 2005, 56, 1269–1276. [Google Scholar] [CrossRef]
  34. Gonzalez-Dugo, V.; Durand, J.L.; Gastal, F. Water deficit and nitrogen nutrition of crops. A Review. Agron. Sustain. Dev. 2010, 30, 529–544. [Google Scholar] [CrossRef] [Green Version]
  35. Zhang, G.; Yang, Z.; Dong, S. Interspecific competitiveness affects the total biomass yield in an alfalfa and corn intercropping system. Field Crop. Res. 2011, 124, 66–73. [Google Scholar] [CrossRef]
  36. Doubi, B.T.S.; Kouassi, K.I.; Kouakou, K.L.; Koffi, K.K.; Baudoin, J.-P.; Zoro, B.I.A. Existing competitive indices in the intercropping system of Manihot esculenta Crantz and Lagenaria siceraria (Molina) Standley. J. Plant Interact. 2016, 11, 178–185. [Google Scholar] [CrossRef] [Green Version]
  37. Yu, Y.; Stomph, T.-J.; Makowski, D.; Van der Werf, W. Temporal niche differentiation increases the land equivalent ratio of annual intercrops: A meta-analysis. Field Crop. Res. 2015, 184, 133–144. [Google Scholar] [CrossRef]
  38. Yu, Y.; Stomph, T.J.; Makowski, D.; Zhang, L.Z.; van der Werf, W. A meta-analysis of relative crop yields in cereal/legume mixtures suggests options for management. Field Crop. Res. 2016, 198, 269–279. [Google Scholar] [CrossRef] [Green Version]
  39. Li, C.; Hoffland, E.; Kuyper, T.W.; Yu, Y.; Li, H.; Zhang, C.; Zhanga, F.; Werf, W.V.D. Yield gain, complementarity and competitive dominance in intercropping in China: A meta-analysis of drivers of yield gain using additive partitioning. Eur. J. Agron. 2020, 113, 125987. [Google Scholar] [CrossRef]
  40. Wang, W.; Bai, W.; Sun, Z.; Zhang, D.; Zhang, Y.; Wang, R.; Evers, J.B.; Stomph, T.J.; Werf, W.V.D.; Feng, C.; et al. Does reduced intraspecific competition of the dominant species in intercrops allow for a higher population density? Food Energy Secur. 2021, 10, 285–298. [Google Scholar] [CrossRef]
Figure 1. Monthly temperatures and precipitation over the 2018–2019 seasons and the mean values noted over the period from 1981 to 2017 for the three experimental sites.
Agronomy 11 01225 g001
Figure 2. LER (for yield: A and N yield: B) and REI (C) values (total dry aboveground) calculated under different site×N level treatments and during harvest stage. Bars with the different letters compare site and N level treatments and are significantly different at p < 0.05.
Agronomy 11 01225 g002
Table 1. Physical and chemical soil properties of the experimental sites S1. S2 and S3. Values represent the mean of 6 replicates ± SE (standard errors).
SitesClay (%)Loam (%)Sand (%)CaCO3 (%)OM (%)Total N
(g kg−1)
Available N
(mg kg−1)
Total P
(mg kg−1)
Available P
(mg kg−1)
pH
S142.5 ± 1 b35.8 ± 1.2 a21.7 ± 1 a21.9 ± 0.8 a1.2 ± 0.1 b1.4 ± 0.1 b22.9 ± 1.3 b283.8 ± 20.4 b9.32 ± 0.3 b8.38 ± 0.08 a
S256.5 ± 1.4 a35.2 ± 1.4 a8.4 ± 0.7 b1.1 ± 0.1 b1.8 ± 0.2 a1.4 ± 0.1 b9 ± 0.7 c155.6 ± 4.1 c13 ± 0.7 a7.9 ± 0.1 b
S349.2 ± 1.7 c34.8 ± 1.9 a16 ± 3.3 a20.6 ± 0.5 a1.9 ± 0.1 a2.4 ± 0.2 a35.8 ± 1.6 a387.3 ± 10.1 a5.37 ± 0.5 c8.30 ± 0.07 a b
p-Value≤0.0010.90.01≤0.0010.004≤0.001≤0.001≤0.001≤0.0010.02
Within a column, different letters denote significant difference at p < 0.05.
Table 2. Grain yield and nitrogen yield uptake by chickpea, durum wheat, and crop mixture under different crop×N level treatments.
SiteCropN LevelChickpeaN Yield (Kg ha−1)Durum WheatN Yield (Kg ha−1)Crop MixtureN Yield (Kg ha−1)
Grain Yield (t ha−1)Grain Yield (t ha−1)GrainYield (t ha−1)
Sole cropN-300.34 ± 0.02 c7.81 ± 0.5 c2.09 ± 0.1 b93.55 ± 4.1 b1.21 ± 0.06 b50.67 ± 2.7 bc
N-600.97 ± 0.1 a32.65 ± 2.2 a3.01 ± 0.5 ab75.96 ± 5.3 b1.99 ± 0.2 a54.34 ± 4.3 b
N-1000.71 ± 0.1 ab19.52 ± 2.1 b3.25 ± 0.11 a121.11 ± 4.2 a1.96 ± 0.08 a70.31 ± 3.1 a
S1IntercropN-300.23 ± 0.03 d10.27 ± 0.3 bc0.54 ± 0.05 c23.41 ± 2.5 c0.75 ± 0.07 b33.71 ± 2.4 c
N-600.65 ± 0.1 b23.33 ± 3.4 a b0.60 ± 0.04 c13.37 ± 1.03 c1.26 ± 0.1 b36.8 ± 3.4 bc
N-1000.21 ± 0.04 d7.97 ± 1.6 c0.94 ± 0.05 c28.52 ± 1.4 c1.14 ± 0.04 b36.1 ± 1.4 bc
p-ValueCrop≤0.0010.02≤0.001≤0.001≤0.001≤0.001
N level≤0.001≤0.001≤0.01≤0.001≤0.001≤0.001
Crop×N level0.130.040.11≤0.0010.37≤0.01
Sole cropN-300.92 ± 0.1 b20.91 ± 2.3 bc3.82 ± 0.3 b58.94 ± 3.1 ab2.37 ± 0.1 c39.92 ± 2.1 c
N-601.53 ± 0.1 a48.08 ± 2.7 a4.46 ± 0.2 ab71.97 ± 2.4 a3 ± 0.2 b60.03 ± 2.5 b
N-1000.95 ± 0.02 b24.58 ± 0.6 bc4.80 ± 0.2 a68.61 ± 1.3 a2.87 ± 0.1 bc46.60 ± 1.7 bc
S2IntercropN-300.61 ± 0.08 b12.28 ± 1.3 c2.05 ± 0.06 c31.51 ± 0.8 d2.65 ± 0.04 bc43.80 ± 0.9 c
N-601.09 ± 0.05 a25.59 ± 1.2 b2.79 ± 0.08 c51.25 ± 1.2 b3.88 ± 0.2 a76.84 ± 2.5 a
N-1000.78 ± 0.07 b26.27 ± 2.6 b2.02 ± 0.1 c43.88 ± 2.3 c2.79 ± 0.07 bc70.16 ± 2.9 ab
p-ValueCrop≤0.01≤0.001≤0.001≤0.001≤0.01≤0.001
N level≤0.001≤0.001≤0.01≤0.001≤0.001≤0.001
Crop×N level0.52≤0.010.020.62≤0.010.02
Sole cropN-302.16 ± 0.08 a48.44 ± 1.8 a5.47 ± 0.8 ab40.89 ± 3.6 d3.82 ± 0.3 b44.67 ± 2.7 c
N-602.43 ± 0.2 a36.98 ± 2.3 b6.82 ± 0.07 a76.44 ± 0.8 c4.63 ± 0.2 ab56.71 ± 2.5 bc
N-1001.11 ± 0.05 b22.94 ± 1 c6.95 ± 0.4 a97.35 ± 4.3 b4.04 ± 0.1 ab60.17 ± 2.3 bc
S3IntercropN-300.36 ± 0.02 c7.13 ± 1.1 d3.21 ± 0.3 c64.57 ± 3.6 cd3.57 ± 0.2 b71.70 ± 1.5 b
N-600.48 ± 0.01 c6.11 ± 0.8 d4.45 ± 0.2 b105.35 ± 32 a4.93 ± 0.3 a111.12 ± 2.1 a
N-1000.27 ± 0.02 d3.54 ± 0.6 d3.27 ± 0.3 c44.27 ± 2.1 d3.54 ± 0.08 b47.81 ± 1.3 c
p-ValueCrop≤0.001≤0.001≤0.0010.270.60≤0.001
N level≤0.01≤0.0010.18≤0.001≤0.001≤0.001
Crop×N level0.02≤0.0010.04≤0.0010.36≤0.001
Within a column, different letters denote significant difference at p < 0.05.
Table 3. NNI values calculated under different treatments during both flowering and harvest stages.
SitesCropN LevelChickpeaNNI HarvestDurum WheatNNI Harvest
NNIFloweringNNIFlowering
Sole cropN-300.48 ± 0.01 c0.58 ± 0.02 bc0.79 ± 0.02 b0.58 ± 0.01 bc
N-600.83 ± 0.04 b1.07 ± 0.005 a0.33 ± 0.01 d0.45 ± 0.03 c
N-1000.79 ± 0.08 b0.86 ± 0.06 ab0.78 ± 0.08 b0.96 ± 0.05 a
S1IntercropN-301.74 ± 0.1 a0.43 ± 0.01 c0.28 ± 0.002 d0.79 ± 0.08 ab
N-601.82 ± 0.08 a0.76 ± 0.05 b0.95 ± 0.08 a0.49 ± 0.05 bc
N-1001.55 ± 0.02 a0.42 ± 0.03 c0.58 ± 0.02 c0.52 ± 0.02 bc
p-ValueCrop≤0.001≤0.0010.550.28
N level≤0.01≤0.0010.120.03
Crop×N level0.280.17≤0.001≤0.001
Sole cropN-300.61 ± 0.04 c0.47 ± 0.02 b0.42 ± 0.02 bc0.60 ± 0.03 c
N-600.86 ± 0.09 b0.92 ± 0.05 a0.49 ± 0.03 bc0.69 ± 0.03 b
N-1000.69 ± 0.06 c0.47 ± 0.03 b0.97 ± 0.03 a0.98 ± 0.1 b
S2IntercropN-301.87 ± 0.09 a0.63 ± 0.05 ab0.37 ± 0.01 c0.68 ± 0.05 b
N-601.68 ± 0.1 ab0.75 ± 0.04 ab0.95 ± 0.04 a1.13 ± 0.09 a
N-1001.39 ± 0.08 b0.51 ± 0.03 b0.56 ± 0.02 b0.79 ± 0.07 b
p-ValueCrop≤0.0010.880.22≤0.001
N level0.57≤0.0010.04≤0.001
Crop×N level0.450.040.030.62
Sole cropN-300.32 ± 0.04 d0.71 ± 0.01 a0.90 ± 0.1 a0.42 ± 0.02 c
N-600.82 ± 0.01 bc0.79 ± 0.08 a0.51 ± 0.06 b0.77 ± 0.01 bc
N-1000.80 ± 0.08 bc0.54 ± 0.05 a0.84 ± 0.02 a0.80 ± 0.03 b
S3IntercropN-300.50 ± 0.009 c0.43 ± 0.02 a0.53 ± 0.03 b1.05 ± 0.1 b
N-601.80 ± 0.08 a0.75 ± 0.05 a0.92 ± 0.04 a1.66 ± 0.05 a
N-1001.05 ± 0.04 b0.68 ± 0.07 a0.96 ± 0.09 a0.93 ± 0.08 b
p-ValueCrop≤0.0010.440.95≤0.001
N level≤0.0010.130.40≤0.001
Crop×N level≤0.0010.15≤0.01≤0.001
Within a column, different letters denote significant difference at p < 0.05.
Table 4. ATER and LUE values calculated on yield and nitrogen uptake under different site×N level treatments and during harvest stage.
SiteN LevelATERyieldATERNLUEyield (%)LUEN (%)
N-300.83 ± 0.07 b1.16 ± 0.2 a85.5 ± 9.03 abc119.5 ± 15.88 ab
S1N-601.07 ± 0.05 ab1.17 ± 0.1 a110.5 ± 5.81 ab120.5 ± 13.59 ab
N-1000.54 ± 0.003 c0.58 ± 0.03 c56 ± 0.52 c59 ± 2.62 bc
N-301.09 ± 0.08 ab1.09 ± 0.1 b115.5 ± 15.4 ab112 ± 14.26 abc
S2N-601.18 ± 0.06 a1.19 ± 0.1 a126.5 ± 8.53 a122 ± 7.35 a
N-1001.17 ± 0.1 a1.17 ± 0.04 a120.5 ± 14.55 a137 ± 7.04 a
N-301.01 ± 0.06 b1.06 ± 0.09 b103 ± 6.3 abc142 ± 10.67 a
S3N-600.67 ± 0.1 c0.96 ± 0.1 b64.5 ± 15.63 bc139.5 ± 23.93 a
N-1000.66 ± 0.02 c0.51 ± 0.01 c65 ± 1.9 bc51.5 ± 2.19 c
47-ValueSite≤0.001≤0.01≤0.0010.10
N level0.04≤0.0010.04≤0.001
Site×N level≤0.010.020.02≤0.01
Within a column, different letters denote significant difference at p < 0.05.
Table 5. K values calculated on yield component under different site×N level treatments and during harvest stage.
SitesN LevelK WheatK ChickpeaK
N-300.28 ± 0.03 b1.48 ± 0.43 ab0.43 ± 0.16 c
S1N-600.33 ± 0.05 b4.97 ± 0.12 a1.66 ± 0.18 bc
N-1000.41 ± 0.05 b0.41 ± 0.05 b0.17 ± 0.005 c
N-301.31 ± 0.26 ab4.71 ± 1.11 a5.92 ± 0.23 a
S2N-601.94 ± 0.57 a1.93 ± 0.45 ab4.02 ± 1.98 ab
N-1000.75 ± 0.14 ab3.02 ± 1.26 ab1.93 ± 0.52 bc
N-301.16 ± 0.39 ab0.13 ± 0.06 b0.12 ± 0.02 c
S3N-601.10 ± 0.35 ab0.28 ± 0.11 b0.39 ± 0.26 c
N-1000.95 ± 0.2 ab0.34 ± 0.3405 b0.30 ± 0.04 c
p-ValueSite≤0.01≤0.001≤0.001
N level0.170.100.02
Site×N level0.20≤0.010.02
Within a column, different letters denote significant difference at p < 0.05.
Table 6. CR values (grain yield and N yield) relative to chickpea and durum wheat calculated on yield and N uptake under different site×N level treatments and during harvest stage.
SitesN levelCR-YieldChickpeaCR-YieldDurumwheatCR-NChickpeaCR-NDurumwheat
N-302.46 ± 0.2 ab0.41 ± 0.03 c3.92 ± 0.3 a0.25 ± 0.0017 d
S1N-603.13 ± 0.3 a0.32 ± 0.03 c2.91 ± 0.47 ab0.36 ± 0.069 d
N-1001.03 ± 0.08 bc1.03 ± 0.19 bc1.94 ± 0.3 bc0.53 ± 0.08 d
N-301.25 ± 0.4 bc0.86 ± 1.77 c1.13 ± 0.21 cde0.95 ± 0.2 d
S2N-601.17 ± 0.16 bc0.88 ± 0.11 bc1.76 ± 0.1 cde1.35 ± 1.67 d
N-1002.28 ± 0.75 ab0.52 ± 0.13 c1.68 ± 0.57 bcd0.72 ± 0.18 d
N-300.3 ± 0.01 c3.38 ± 0.22 a0.09 ± 0.004 e10.13 ± 0.42 a
S3N-600.6 ± 0.07 c1.7 ± 0.2 bc0.13 ± 0.004 c7.27 ± 0.22 b
N-1000.53 ± 0.18 c2.42 ± 0.82 ab0.4 ± 0.16 de3.33 ± 1.02 c
p-ValueSite≤0.001≤0.001≤0.001≤0.001
N level0.340.090.17≤0.001
Site×N level≤0.001≤0.05≤0.001≤0.001
Within a column, different letters denote significant difference at p < 0.05.
Publisher’s Note: MDPI stays neutral with regard to jurisdictional claims in published maps and institutional affiliations.

