
Study on the Pricing of Water Rights Transaction between Irrigation Water Users Based on Cooperative Game in China

1
School of Water Resources Science and Engineering, University of Zhengzhou, Zhengzhou 450001, China
2
Yellow River Institute of Hydraulic Research, Yellow River Conservancy Commission, Zhengzhou 450003, China
3
Henan Key Laboratory of Ecological Environment Protection and Restoration of Yellow River Basin, Zhengzhou 450003, China
*
Author to whom correspondence should be addressed.
Water 2021, 13(12), 1672; https://doi.org/10.3390/w13121672
Submission received: 19 April 2021
/
Revised: 31 May 2021
/
Accepted: 10 June 2021
/
Published: 16 June 2021
(This article belongs to the Special Issue Improving Water Use Efficiency and Agricultural Productivity of Crop Systems)
Abstract
:China’s water rights transaction is still in the initial stage of development. There is no systematic pricing method for water rights transactions between farmers. This paper puts forward a pricing model of water rights transactions among farmers in water-deficient areas. The price of water rights transaction consists of cost price and earnings price. The earnings price is determined by studying the crop water production function, calculating the crop’s marginal benefit of the two parties, and combining the Cooperative Game Theory. Finally, the pricing model was applied to the water rights transactions among the farmers of Hetao Irrigation District of Bayannaoer City, Inner Mongolia Autonomous Region. Results showed that under the A4 trading strategy, the overall income increased without losing the interests of any farmer. The increasing income of the three farmer households N1, N2, and N3 after the alliance was 8.14 thousand dollars, 4.66 thousand dollars, and 20.33 thousand dollars, respectively, and the water rights transaction prices of N3 and N1, N2 were respectively 0.485 $/m3, 0.565 $/m3. It is estimated that the model can provide a scientific basis for water rights trading between farmers and the efficient use of water resources.
1. Introduction
With the increase of water demand, the conflict between water supply and water demand has become increasingly acute. The efficient allocation and sustainable use of water resources are attracting more and more attention from water users, especially in arid or semi-arid areas [1], and people have been advocating for a market-based approach to resolve the problem of water allocation [2]. Water rights transactions can optimize the allocation of water resources and promote water conservation in irrigated areas [3,4]. Due to the large amount of water consumption, there is a great potential for water conservation in irrigated areas. Water rights transactions can help alleviate the imbalance between water supply and water demand, and improve the water use efficiency and economic benefits, thereby improving the economic productivity of water [5]. Due to the uncertainty of climate, the water rights transactions of water users also helps to improve the economic stability of irrigation districts [6]. Therefore, the study of water rights transactions is of great significance to the sustainable use of water resources and economic and social development.
At present, about 70% of the world’s fresh water is used for agriculture [7]. As irrigation areas continue to expand, the water demand for irrigation continues to increase [8], which itself will lead to frequent occurrence of water rights transaction. For instance, water is used for agricultural irrigation in most areas of China, and some farmers reduce their water consumption, trading the saved water by reducing the planting proportion of high-water-consuming crops [9]. Chile has become a leading country in the world in terms of water law and water management methods, where the water rights are treated as private property and can be sold as commodities [10]. In Australia, the water rights transaction is divided into temporary water rights transaction and permanent water rights transaction, when the water rights are sold.
Water rights transactions are mostly carried out within the agricultural system or between agriculture and industry. Many studies have shown that water rights transactions can optimize the allocation of farmers’ water consumption, making both the irrigation district management sector and the water users themselves able to obtain more benefits [11,12]. Besides, the transfer of water from the agricultural sector to urban sector can reduce the cost of urban water conservancy, improve the efficiency of agricultural water, and increase revenue of the agricultural sector [13,14]. Yue et al. [15] established a water rights transaction model based on interval programming, and found that the water use efficiency of each region had been significantly improved after the water rights transaction.
Most of the research focuses on the returns of water rights transactions and water use efficiency, while a small number of studies focuses on the pricing of water rights transactions and their formation mechanism. Cost orientation is the end point emphasized by the pricing of water rights transactions in the past [16]. Some scholars have considered the influencing factors of transaction price from other aspects. By introducing the econometric model to 80 farmers participating in the auction, Deng & Xu [17] analyzed the determinants of water rights transaction price, and revealed the real price of water. Tian et al. [18] studied the influence of the comprehensive reform of agricultural water price on the formation of water right transaction price, and advocated that the precision subsidy and water conservancy incentive mechanism for agricultural water use have great impacts on the total cost of water rights transactions, which could greatly reduce their price. Michelsen et al. [19] studied the determinants and trends of water rights market prices, which are often attributed to the reliability of water supply (statutory priorities and hydrological conditions), location of supply and purpose of use.
It can be seen from the above that a water rights transaction needs to be carried out extensively, but there is no systematic, fair, and reasonable pricing method for them. Game theory has a good prospect in transaction pricing, including non-cooperative game theory and cooperative game theory, the former only pursuing the maximization of personal benefits, while the cooperative game theory first seeks to maximize the overall interests of the region, and then divides the interests reasonably to achieve greater self-interest. Wu et al. [20], from the perspective of cooperative game, studied the pricing method of the secondary water right trading market and believed that the determination of secondary water right trading price is a process in which both parties in the game share water right premium and transfer premium. Liu et al. [21], on the other hand, established the Nash–Bargains cooperative pricing model between the government and water companies to solve the equilibrium water price space in water right trade.
This paper studied the pricing model of water rights transactions between farmers. The transaction price was composed of cost price and earnings price, with emphasis on earnings price. The rest of the paper was arranged as follows. The marginal benefit of crops was calculated through the production function, and then the irrigation quotas of crops were optimized to obtain the income of farmers and the amount of tradable water under different schemes. Then the Shapely value method of Cooperative Game Theory was used to redistribute the income of farmers in different alliances. Finally, the transaction price under different alliance decisions could be calculated. This model conducted different kinds of alliances based on the optimization of irrigation quotas and calculated the corresponding transaction prices, taking into account the overall benefits of farmers and reasonable distribution among them, and provided a basis for the pricing of water rights transactions among multiple participants.
2. Materials and Methods
2.1. Study Area and Data Sources
2.1.1. Study Area
The Hetao Irrigation District is located in Bayannaoer City in the western part of Inner Mongolia. It is a large-scale irrigation area in the middle reaches of the Yellow River. It includes the five sub-irrigation areas of Shenwu sub-irrigation area, Yichang sub-irrigation area, Yongji sub-irrigation area, Jiefangzha sub-irrigation area, and Wulate sub-irrigation area (Figure 1). The Shenwu sub-irrigation area is at the westernmost part of the Hetao irrigation area. It directs irrigation from the diversion canal to the Yellow River. The Irrigation area of Shenwu sub-irrigation area is 96 hm2. There are 476 canals that directly divert water for farmlands irrigation in the irrigation district, and we use Hehaoqishe canal as an example for this research.
2.1.2. Data Sources
A field survey of farmers in the Hehaoqishe canal irrigation area of Shenwu Irrigation Area in Hetao Irrigation District found that there are 3 farmers in the Hehaoqishe Canal Irrigation area. The 3 farmers are named N1, N2, N3, respectively, and the water rights transaction analysis is performed among the three farmers. The three farmers, among which, N1 plants wheat with a planting area of 40.0 hm2, N2 plants maize with a planting area of 22 hm2, and N3 plants cotton with a planting area of 34 hm2. The prices of wheat, corn, and cotton crops are based on local market prices—namely, wheat = 0.264 $/kg, corn = 0.300 $/kg, and cotton = 2.331 $/kg. The initial water right is allocated mainly based on the principle of fairness, referring to Table 1.
Constant term of water production function can directly refer to the empirical values or be determined by regression analysis based on experimental data. This paper refers to Han et al. [22] (Table 2).
Due to the water production constants a, b, and c being determined by scholars who study China’s Yellow River irrigation area, the irrigated area is calculated mu (a unit of China’s metered area). hm2 = 15 mu.
2.2. Methodology
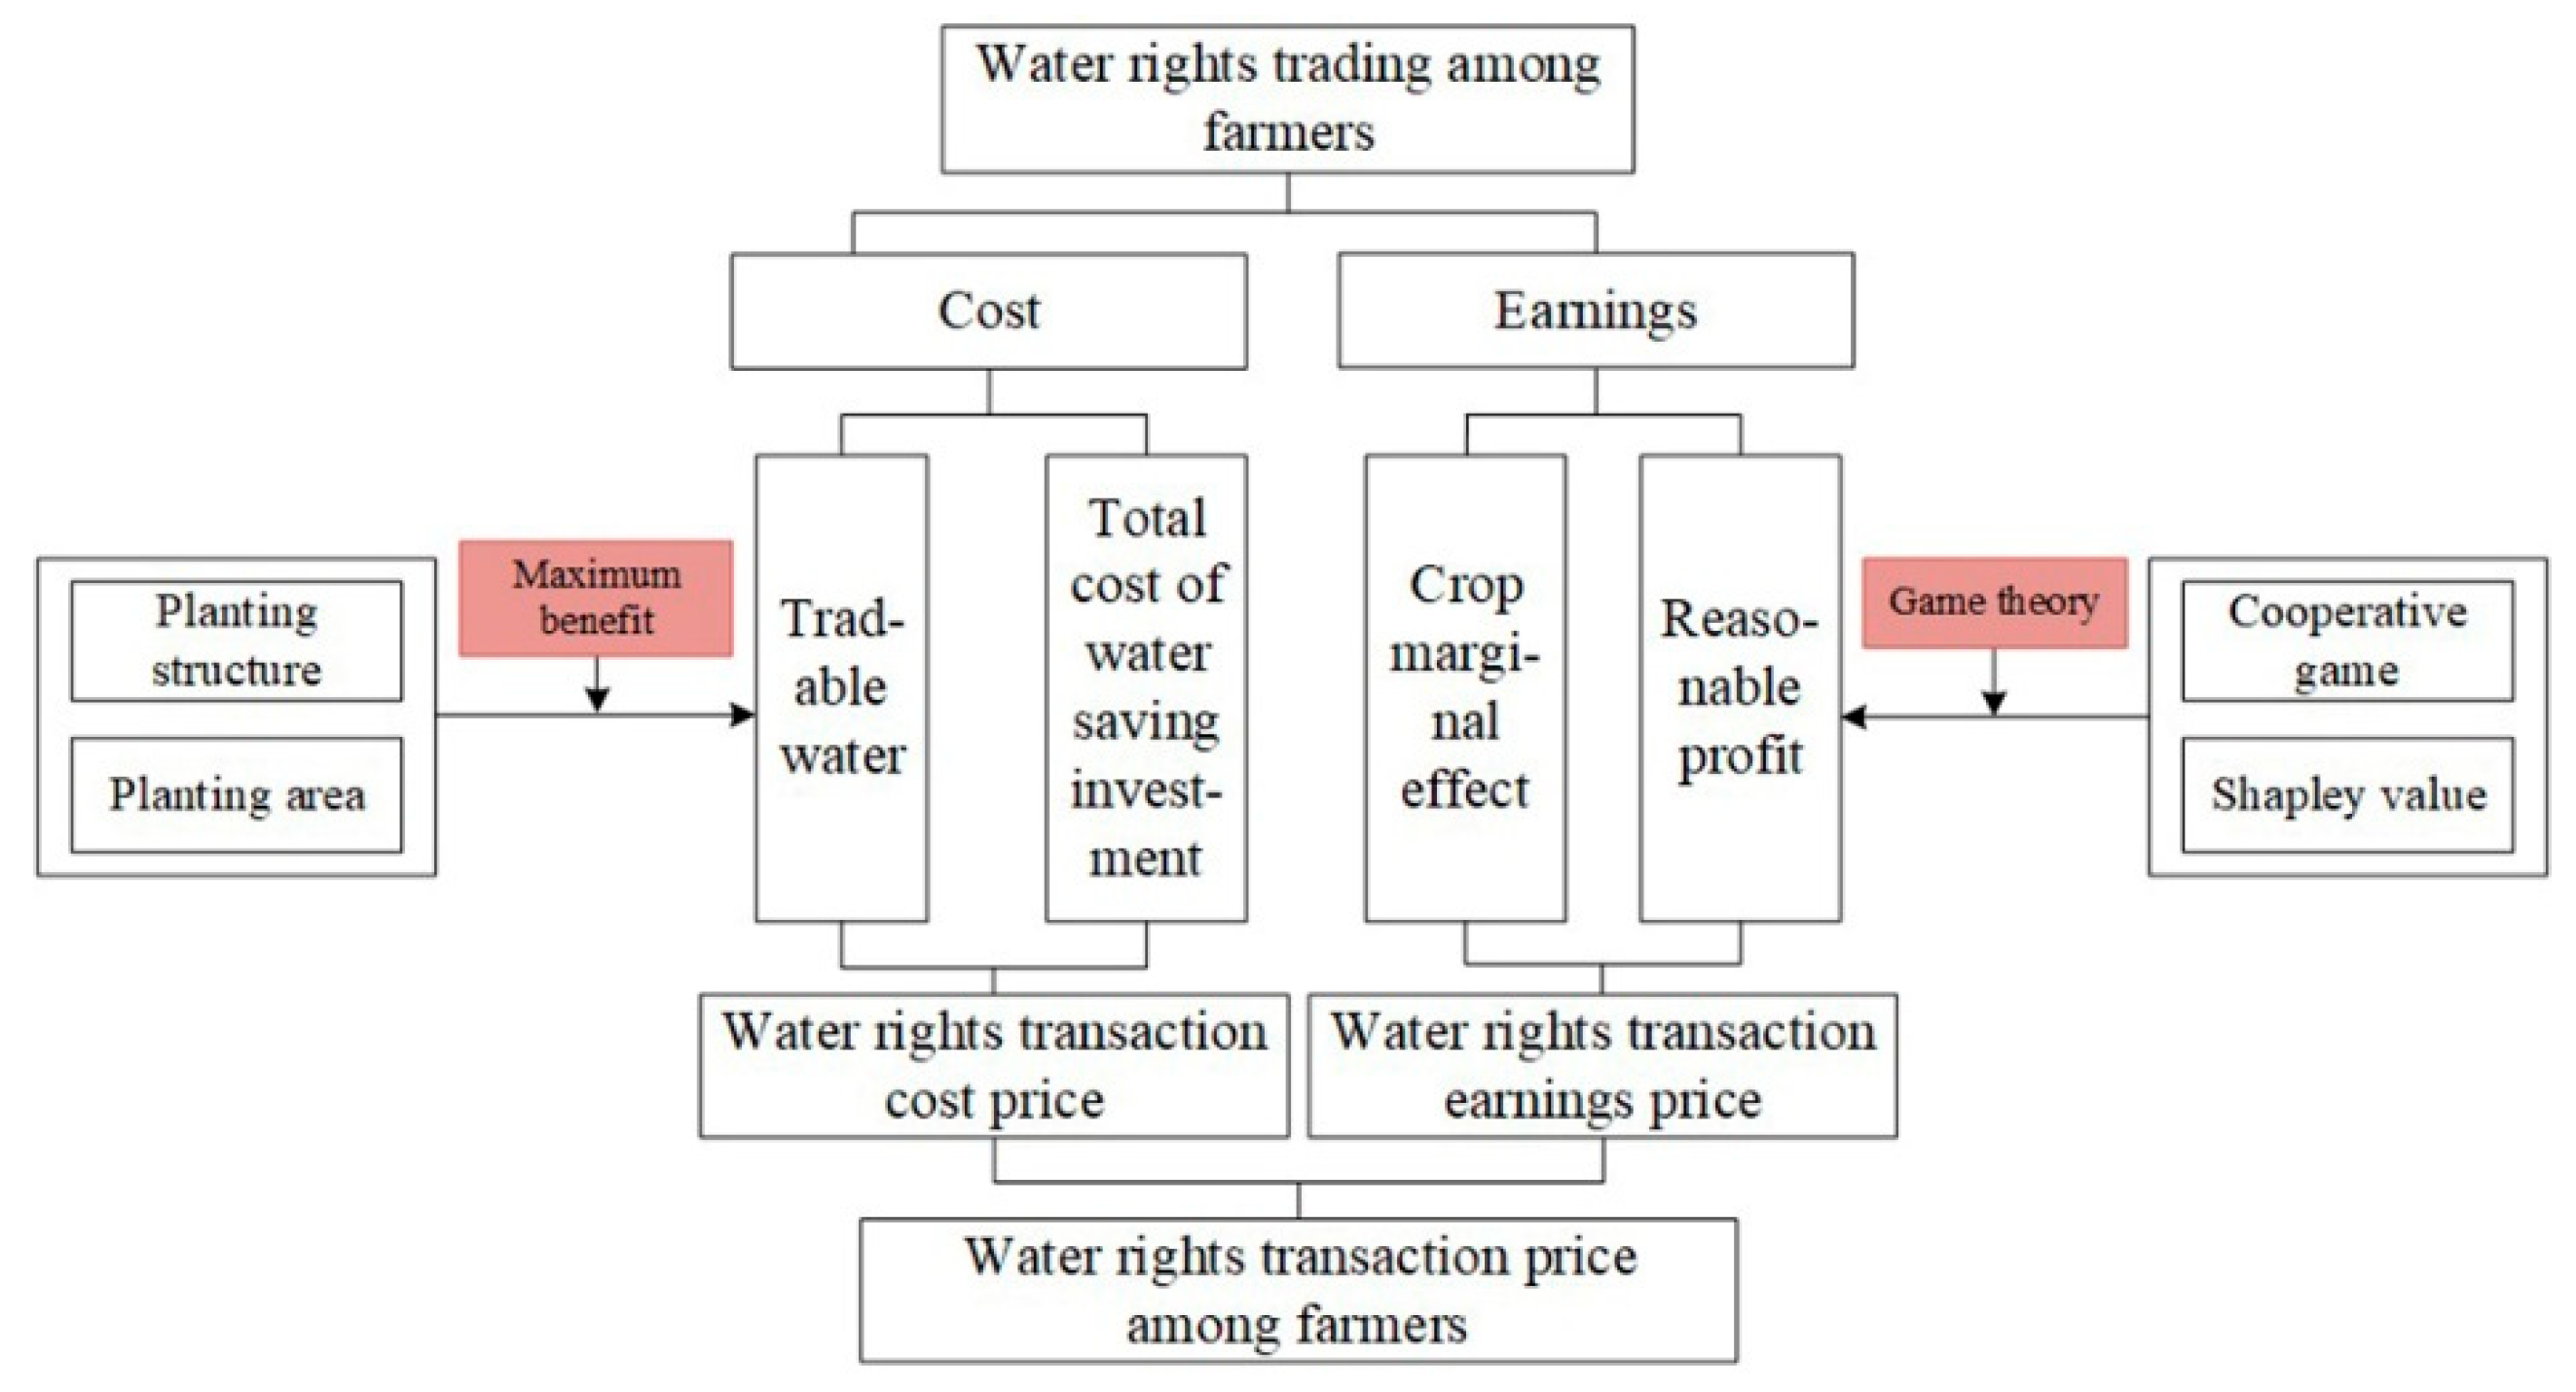
The methodology herein is to calculate the economic irrigation quota of crops based on the water needed in the process of crop irrigation, figure out the marginal benefits of crops, finally determine the amount of water rights traded between farmers, and calculate the price of water rights transactions between farmers. The price model of water rights transaction among farmers is shown in Figure 2.
2.2.1. Cost Price of Water Conservation in the Water Rights Transaction between Farmers
Farmers invest in water conservation measures at the field scale to achieve the goal of saving water. Water conservation measures mainly include agronomic water conservation measures and adjustment of planting structure (no cost), among which the agronomic water conservation measures include straw mulching, plastic membrane mulching, field adjustment, and land leveling. The formula for calculating the cost price of water rights transactions is as follows:
where, is the cost price of water rights transaction ($/m3); is the total costs for water conservation ($); is the tradable water volume (104 m3).
According to the characteristics of farmers’ water conservation measures in the water shortage areas of China, water conservation is mainly realized by adjusting the planting structure.
2.2.2. Earnings Price of Water Rights Transaction among Farmers Based on the Production Function of Crop Water and Cooperative Game Theory
The earnings price refers to the reasonable return obtained by the seller during the water right transaction, and is calculated by the difference of marginal benefits of crops from both sides of the transaction, as well as the reasonable return coefficient. The marginal benefit of crop refers to the net earnings brought to production by adding a unit of water under other unchanged conditions. Because the magnitude of the difference of marginal benefits is generally large, it is necessary to set a reasonable return coefficient to reduce it. The formula for calculating the specific earnings price is:
where, is the earnings price of water rights transaction ($/m3); is the reasonable return coefficient of the water rights transaction; is the benefits after the alliance of crop ($/m3); is the benefit after the optimization of crop ($/m3).
Marginal Benefit of Crops
The functional relationship between crop yield and input of agricultural resources is called agricultural production function. On the premise that the input of other agricultural resources remains unchanged, the input and periodical allocation of water as a variable resource are different, therefore the crop yields are different. And they can be linked by quantitative functional relationship, which is called crop water production function [22]. Therefore, in order to analyze the earnings price of water rights transactions, the crop water production function is introduced by this paper.
The crop water production function is known as follows:
where, is the yield of crop (kg/mu); is the irrigation quota of crop (m3/mu).
where, is the value of crop ($/mu); is the market price of crop ($/kg).
The marginal benefit of crop could be got through the derivation of Formula (4):
where, is the marginal benefit of crop ($/m3).
where, is the revenue of crop (thousand dollars); is the irrigated area of crop (mu).
Determination of Reasonable Return Coefficient of Water Rights Transaction Based on Game Theory
For the water rights transaction among farmers, the surplus water is transferred to the farmers who need water based on the potential of water conservation in agriculture. During the transaction the two sides, considering their own interests, play a game in the form of alliance and cooperation to increase their own benefits and the benefits of the whole society, this is called Cooperative Game [23]. According to the Cooperative Game analysis, the Shapley value is introduced to distribute the profits among the members of the alliance, which reflects the contribution difference of each member to the overall objectives of the alliance [24]. There may be one or more decisions in the water rights transaction for farmers to form different alliances. Each decision corresponds to a certain amount of profit, which is the game between the members of the alliance.
The method of Shapley value is a way to solve the revenue distribution problem of multi person cooperation according to the contribution degree of each alliance member. The Shapley value is defined as follows:
(1) Let set , if as any subset of (any kind of cooperation among person) corresponds to a real value function and satisfied the following:
Then is called the cooperative strategy of person, is the eigenfunction of the strategy, and is the revenue of cooperation .
(2) If regarding as the distribution vector of cooperative alliance, in which indicates the deserved distribution of member from the cooperative strategy , the Shapley value of the revenue distribution among the members of the alliance under the cooperation is:
where
is the weighting factor; is the revenue of subset ; is the remaining revenue of subset after removing ; is the number of members in the alliance; is the number of members in the game.
The reasonable return coefficient is determined through Shapley value, crop revenue and tradable water volume as follows:
where, is the reasonable return coefficient of transaction between N1 and N2; is the revenue of crop (thousand dollars); is the revenue of crop (thousand dollars); is the revenue of alliance N1 and N2 (thousand dollars).
2.2.3. Tradable Water Volume
The amount of water requirement by different water users is also different. Therefore, the initial allocation of water rights based on the principle of fairness may not be the optimal allocation of water resources. That is to say, there may be differences between the optimal water consumption of each farmer and the actual allocation of water. In order to determine the optimal water consumption of each farmer and the water allocation scheme among farmers with maximum overall benefits, the optimal allocation of water resources among farmers should be studied in accordance with the principle of supply-decided demand.
According to the principle of supply-decided demand, the following optimization models can be established to calculate the irrigation quota with the maximum overall economic benefits of the irrigation district:
Objective function:
Constraint condition:
where is the irrigation quota of farmer (m3/hm2); is the initial irrigation quota of farmer (m3/hm2).
The objective function is a quadratic function. Only when the derivative of the crop return function is 0 can the total benefit of the farmer be maximized (require the marginal benefits of each farmer to be equal): i.e.,
The optimal allocation of water for each crop can be calculated. Then, the difference between the initial water rights of each user and the above optimal allocation of water should theoretically be the tradable water volume between farmers, thus realizing the optimal allocation of water resources under the condition of maximum overall benefits.
The adjustment of planting structure makes the crop irrigation quota change accordingly. Then the formula for calculating the water-saving amount by planting structure adjustment is as follows:
where is the water-saved volume by planting structure adjustment (104 m3); and are the water consumptions of the irrigation district before and after the adjustment (104 m3); is the area of adjustment (hm2); and are the comprehensive net irrigation quotas of the farmland before and after the adjustment (m3/hm2); is the water use coefficient in the irrigation.
To summarize, the tradable water volume among farmers is:
where is the tradable water volume (104 m3); is the initial water allocation of farmer (104 m3); is the optimal irrigation quota of farmer (m3/hm2).
2.2.4. Comprehensive Pricing
In summary, the price of water rights transaction should include cost price and earnings price. In view of the characteristics and current situation of water rights transaction among farmers in irrigation districts in China, the comprehensive pricing model for water rights transaction among farmers is as follows:
where is the price for water rights transaction ($/m3).
3. Results
3.1. The Relationship Between Irrigation Water Volume and Marginal Benefit
Use Formula (3) to construct the water production function of wheat, corn, and cotton according to the constant items a, b, and c of the water production function. The actual prices of crops in the local market are used—namely, wheat = 0.264 $/kg, corn = 0.300 $/kg and cotton = 2.331 $/kg. Calculate the economic irrigation quota of wheat, corn, and cotton by Formula (4) and obtain the marginal benefits of wheat, corn and cotton based on Formula (5).
According to Formulas (3)–(5) to calculate the yield, output value, and marginal benefit of wheat, corn, and cotton and obtain the functional relationship between irrigation quota and marginal benefit. By using the trial method, the functional relationship between the total irrigation water and the marginal benefit of crops is established. Assuming that different marginal benefits can reach different irrigation quotas, the functional relationship between total irrigation water and marginal benefits can be derived. Given the actual amount of irrigation water, the marginal benefit of crops with maximum overall benefits can be obtained.
When the marginal benefit is 0, the irrigation quota of wheat, maize and cotton is respectively 4951 m3/hm2, 4648 m3/hm2, 6119 m3/hm2, and the total water for irrigation is 508,300 m3.
When the marginal benefit is 2, the irrigation quota of wheat, maize, and cotton is, respectively, 3467 m3/hm2, 3638 m3/hm2, 5707 m3/hm2, and the total water for irrigation is 412,800 m3.
Equation (5) shows a linear relationship between marginal benefit and water consumption. When irrigation quotas of wheat, corn, and cotton are optimized at the same time, the relationship between the total water for irrigation and the marginal benefit is expressed as:
In that way, when the total water for irrigation is 400,000 m3, the integral marginal benefit is 0.353 $/m3.
3.2. Tradeable Water Volume Among Farmers
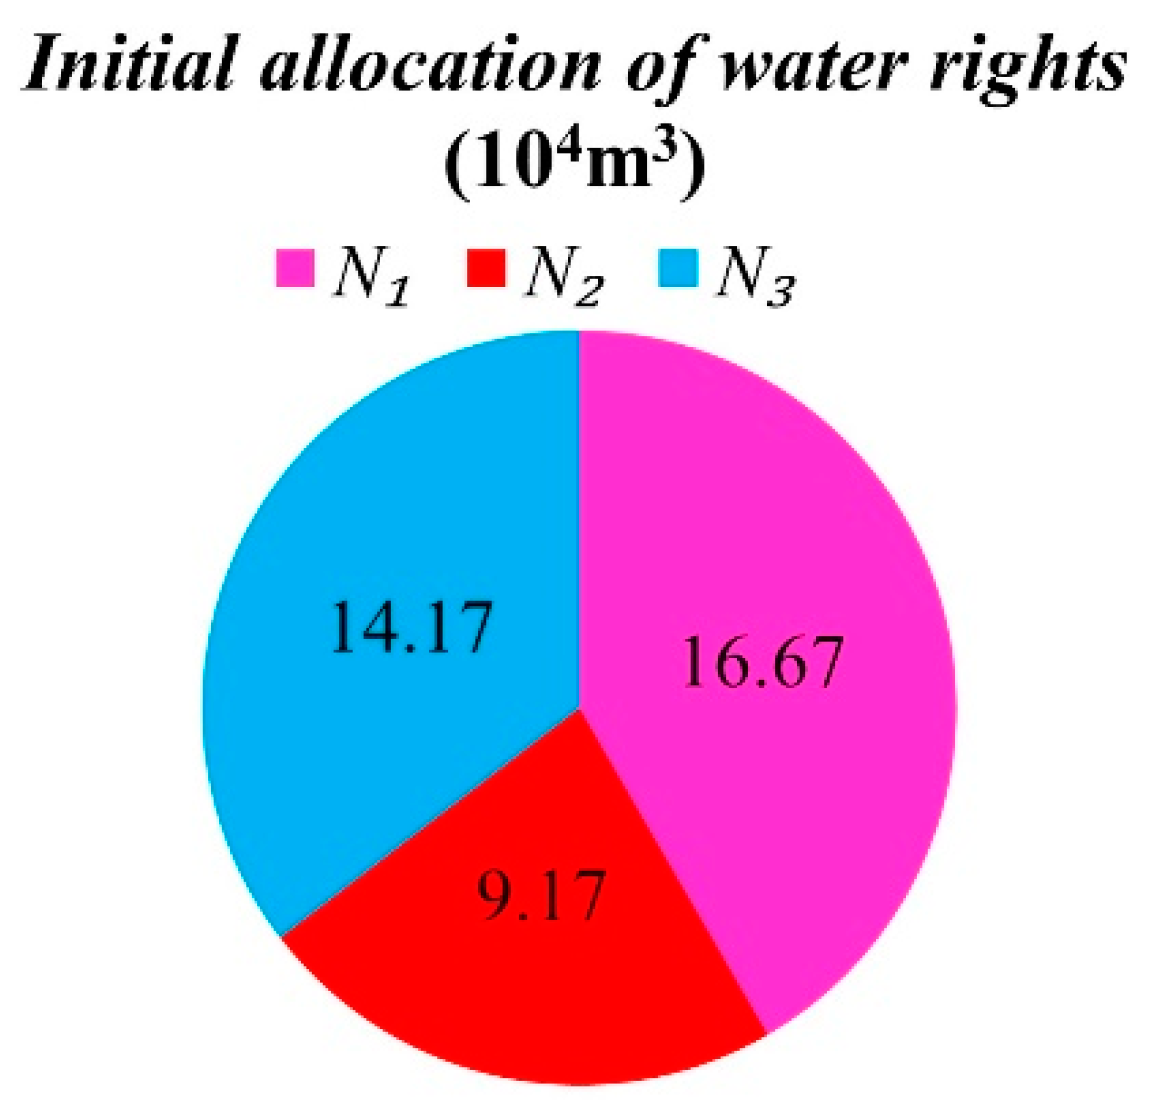
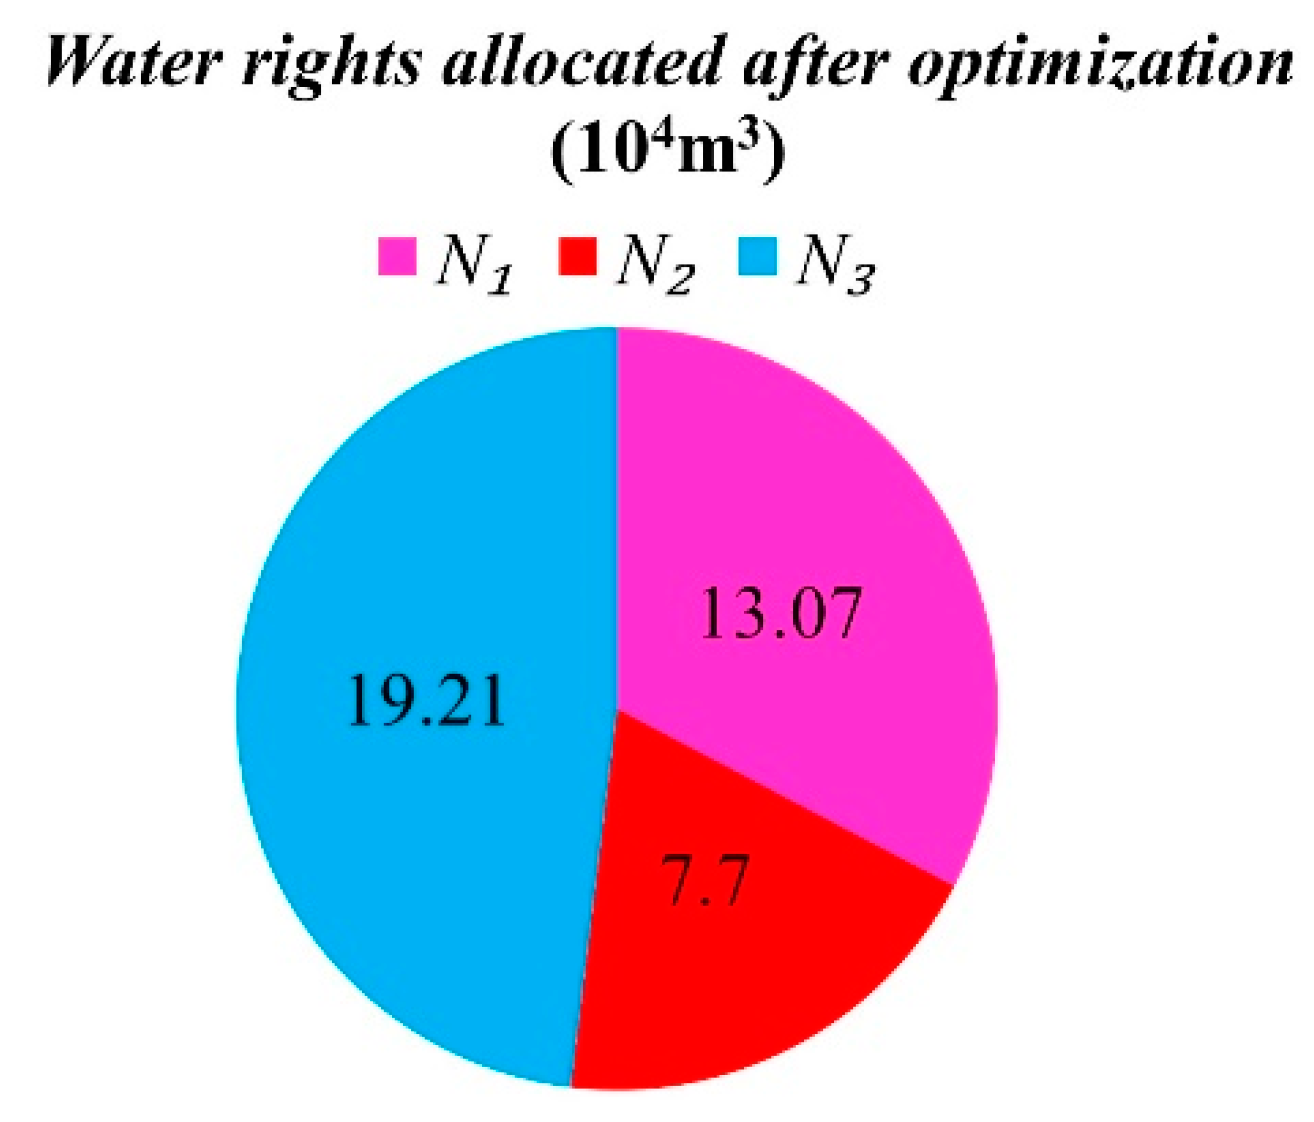
The total amount of irrigation water allocated to the three farmers by the Hehaoqishe Canal in the Shenwu irrigation area is 400,000 m3, while the marginal benefit is 0.353 $/m3 by Formula (16); under the optimization of marginal benefits, the irrigation quota allocated to farmers has changed to a certain extent. According to the equal marginal benefits, the economic irrigation quotas for farmers N1, N2, and N3 to grow wheat, corn, and cotton are calculated by Formula (5) to be 3267 m3/hm2, 3502 m3/hm2, and 5651 m3/hm2, respectively. The comparison between irrigation quota after optimization and irrigation quota before optimization is shown in Table 3. After farmers N1, N2, and N3 are optimized according to the economic irrigation quota at the same time, the amount of water required by the three farmers will change compared with the water corresponding to the initial water rights. Among them, the amount of water required by farmers N1 and N2 decreased, and the amount of water required by farmers N3 increased. After that, the water required by farmers N3 accounted for about 50% of the total irrigation water, as shown in Figure 3 and Figure 4.
Irrigation is carried out according to the economic irrigation quota, the water required by farmers N1, N2, and N3 are 130,700 m3, 77,000 m3, and 192,100 m3, respectively. The initial water allocated by farmers are 166,700 m3, 91,700 m3, and 141,700 m3, respectively. Therefore, the surplus water of farmers N1 and N2 is 36,000 m3 and 14,700 m3, while the water shortage of farmers N3 is 50,700 m3. The water saved by farmers N1 and N2 can be traded with farmer N3. The above results are based on a situation where the irrigation quotas of three crops are optimized at the same time; similarly, when only wheat and cotton are optimized, the tradeable water volume is 47,600 m3, and when only corn and cotton are optimized, the tradeable water volume is 36,500 m3.
3.3. Farmers’ Income Calculation Results
- (1)
- Farmers’ income after optimizing irrigation quota
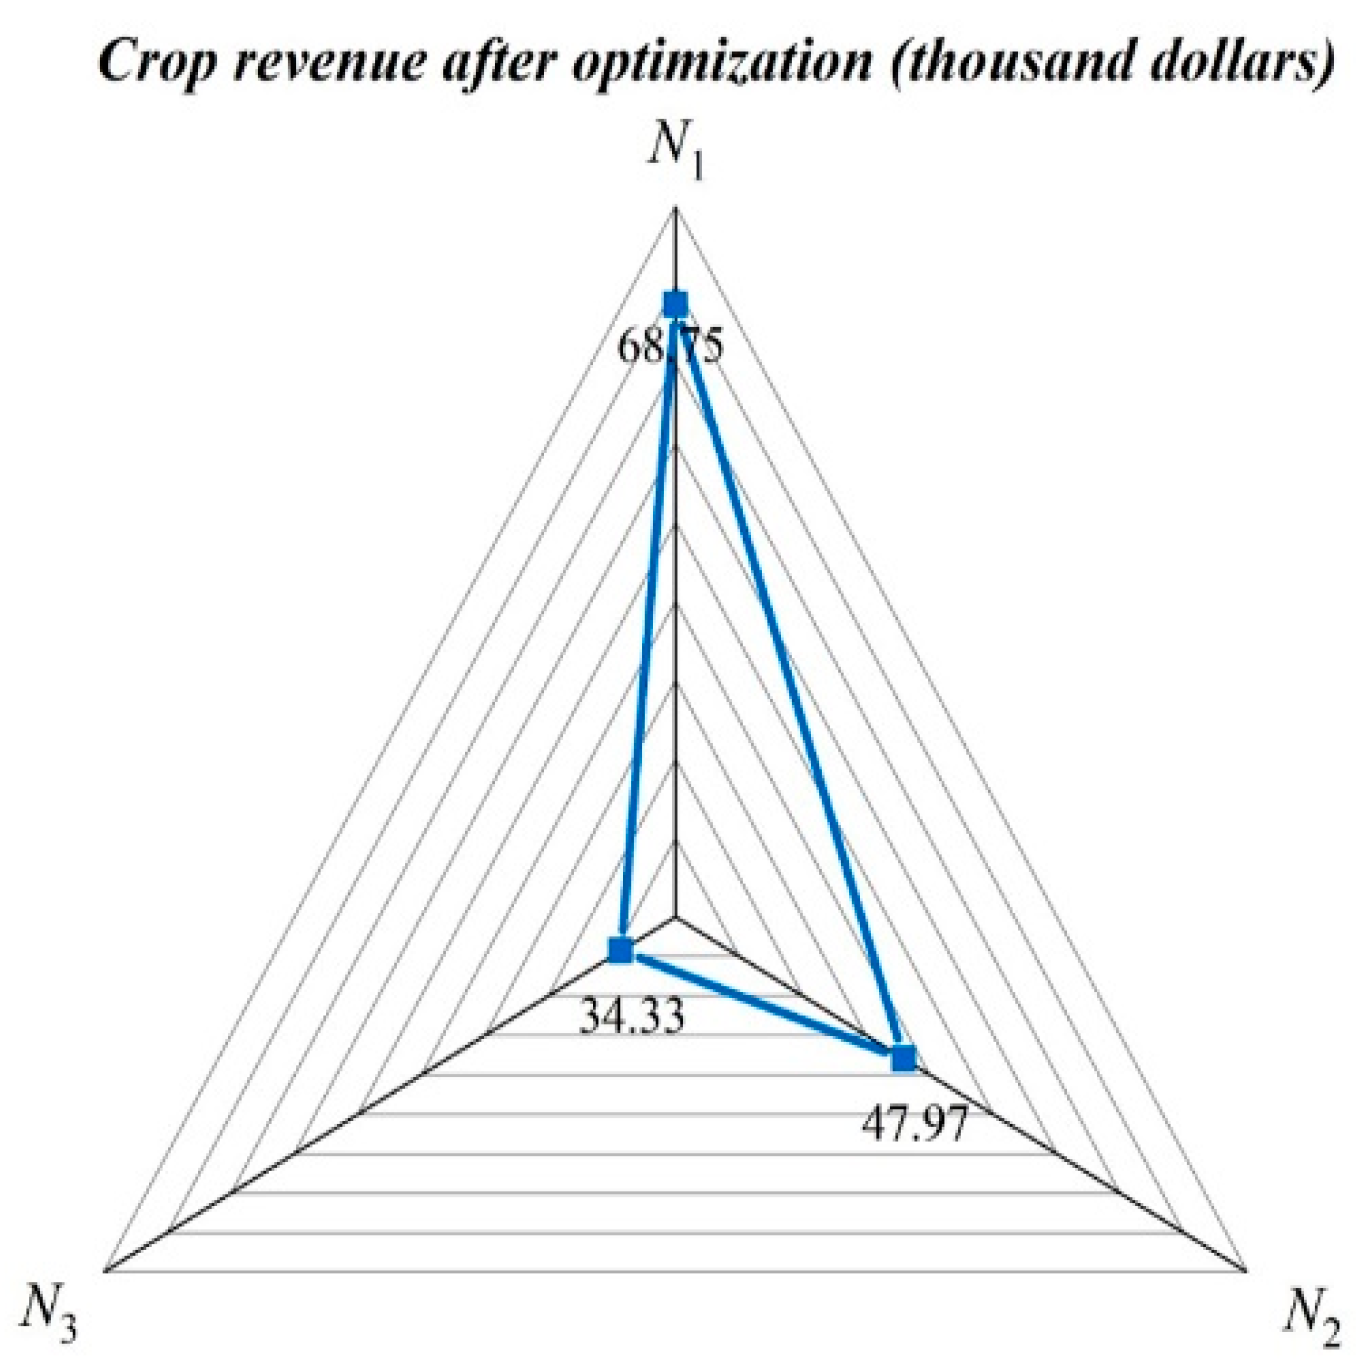
Using the data collected in the actual survey in Table 1, according to Formulas (3)–(6), the income of each farmer before optimization can be calculated; for example, the income of farmer N1 is 68.75 thousand dollars. And then according to Formulas (11), (12) and (16), the income of farmers after optimizing irrigation quotas under different crop combinations are calculated; for example, the income of is 134.37 thousand dollars. See Table 4 and Table 5 for details.
- (2)
- Redistribution of farmers’ income based on Shapely Value
Using the Shapley value leads to a fair and reasonable distribution of total revenue. According to this method, N1 is in alliance with others as a member of the game, and the income distributions are shown in Table 6 and Table 7.
According to Table 6, Table 7, and Formulas (8)–(10), when two players are in alliance, the revenue distribution of N1 is 84.40 thousand dollars, and the revenue distribution of N3 is 49.98 thousand dollars. Similarly, if N3 participate as a player, the revenue distribution of N3 and N2 could be calculated as 46.56 thousand dollars and 60.14 thousand dollars respectively. when three players are in alliance, the revenue distribution of N1 is 76.89 thousand dollars. In the same manner, the revenue distribution of N2 and N3 could be calculated as 52.63 thousand dollars and 54.64 thousand dollars, respectively. At this time, the income per hectare of farmers N1, N2, and N3 are 1.92, 2.39, and 1.61 thousand $/hm2, respectively. The calculation results are shown in Table 7.
According to the above analysis, the following revenue strategies of the game model of water rights transactions is established: N3 does not buy water rights from N1 and N2 (A1); N3 buys water rights from N2 but not from N1 (A2); N3 buys water rights from N1 but not from N2 (A3); N3 buys water rights from both N1 and N2 (A4). See Figure 5.
3.4. Water Rights Transaction Price
Since the water-saving project investment is not involved in the calculations of this paper, the different optimization schemes and the income of the farmers N1, N2, and N3 under different alliance decisions are obtained from the calculated Table 6 and Figure 5 directly according to the formula to calculate the transaction under the different scheme price, as shown in Table 8.
It can be seen from the calculation results that compared with the optimization of the economic irrigation quota, the income after the alliance under the A2 decision increases by 26.90 thousand dollars, the water rights transaction price from N2 to N3 is 0.737 $/m3, and the income after the alliance under the A3 decision increases by 29.39 thousand dollars. The water rights transaction price from N1 to N3 is 0.617 $/m3, and the income after the alliance under the A4 decision increases by 25.76 thousand dollars. The water rights transaction price from N1 to N3 is 0.485 $/m3, and the water rights transaction price from N2 to N3 is 0.565 $/m3.
4. Discussion
4.1. Income Analysis Among Farmers
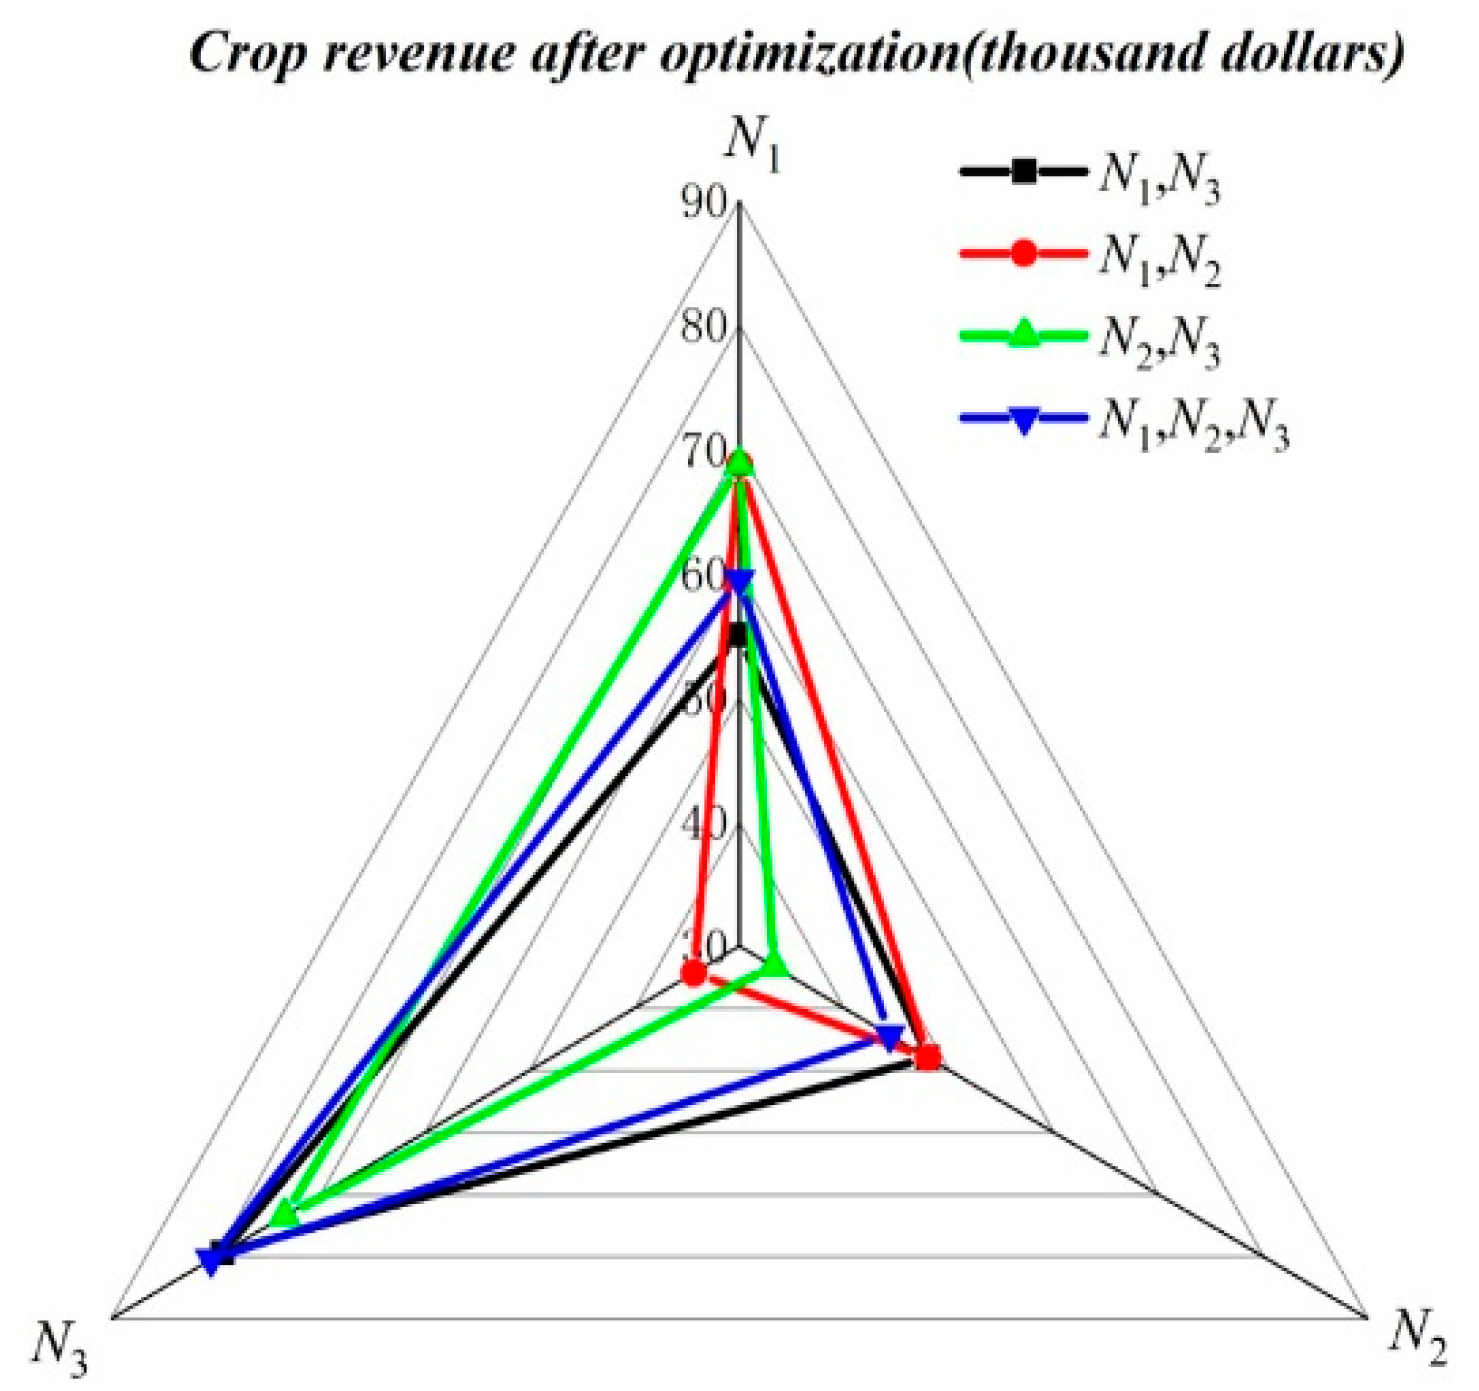
Analyzing the optimization schemes M1, M2, and M3, under each scheme the overall income of farmers increases, mainly because it supplements the irrigation water demand of farmers N3, thereby increasing the overall income. However, there are also losses in the optimization process of some farmers’ interests; the crop revenue before and after the optimization of irrigation quota for each farmer without any cost of water rights transaction can be obtained, as shown in Figure 6 and Figure 7.
It can be seen from the Figure that after using the economic irrigation quota to optimize the irrigation water consumption of farmers, the total income of farmers N1 and N3 under the optimization scheme M1 reached 134.37 thousand dollars; compared with the total income before optimization, the total income increase by 31.30 thousand dollars, the income of the farmer N3 increased significantly after the optimization, and the income of the farmer N3 was increased by 45.03 thousand dollars before the optimization, but the income of the farmer N1 was, however, lost; similarly, after implementing the optimization plan M2, the income of farmer N3 increased, but the income of farmer N2 was lost; when the optimization plan M3 was implemented, the overall income of the farmers was the largest, reaching 184.16 thousand dollars, and the crop incomes of N1, N2, and N3 were 59.44 thousand dollars, 44.32 thousand dollars, and 80.42 thousand dollars, respectively. At this time, the income of the farmers N3 also became largest, which is an increase of 46.09 thousand dollars compared to the previous one, but this would inevitably lose the income of farmers N1 and N2.
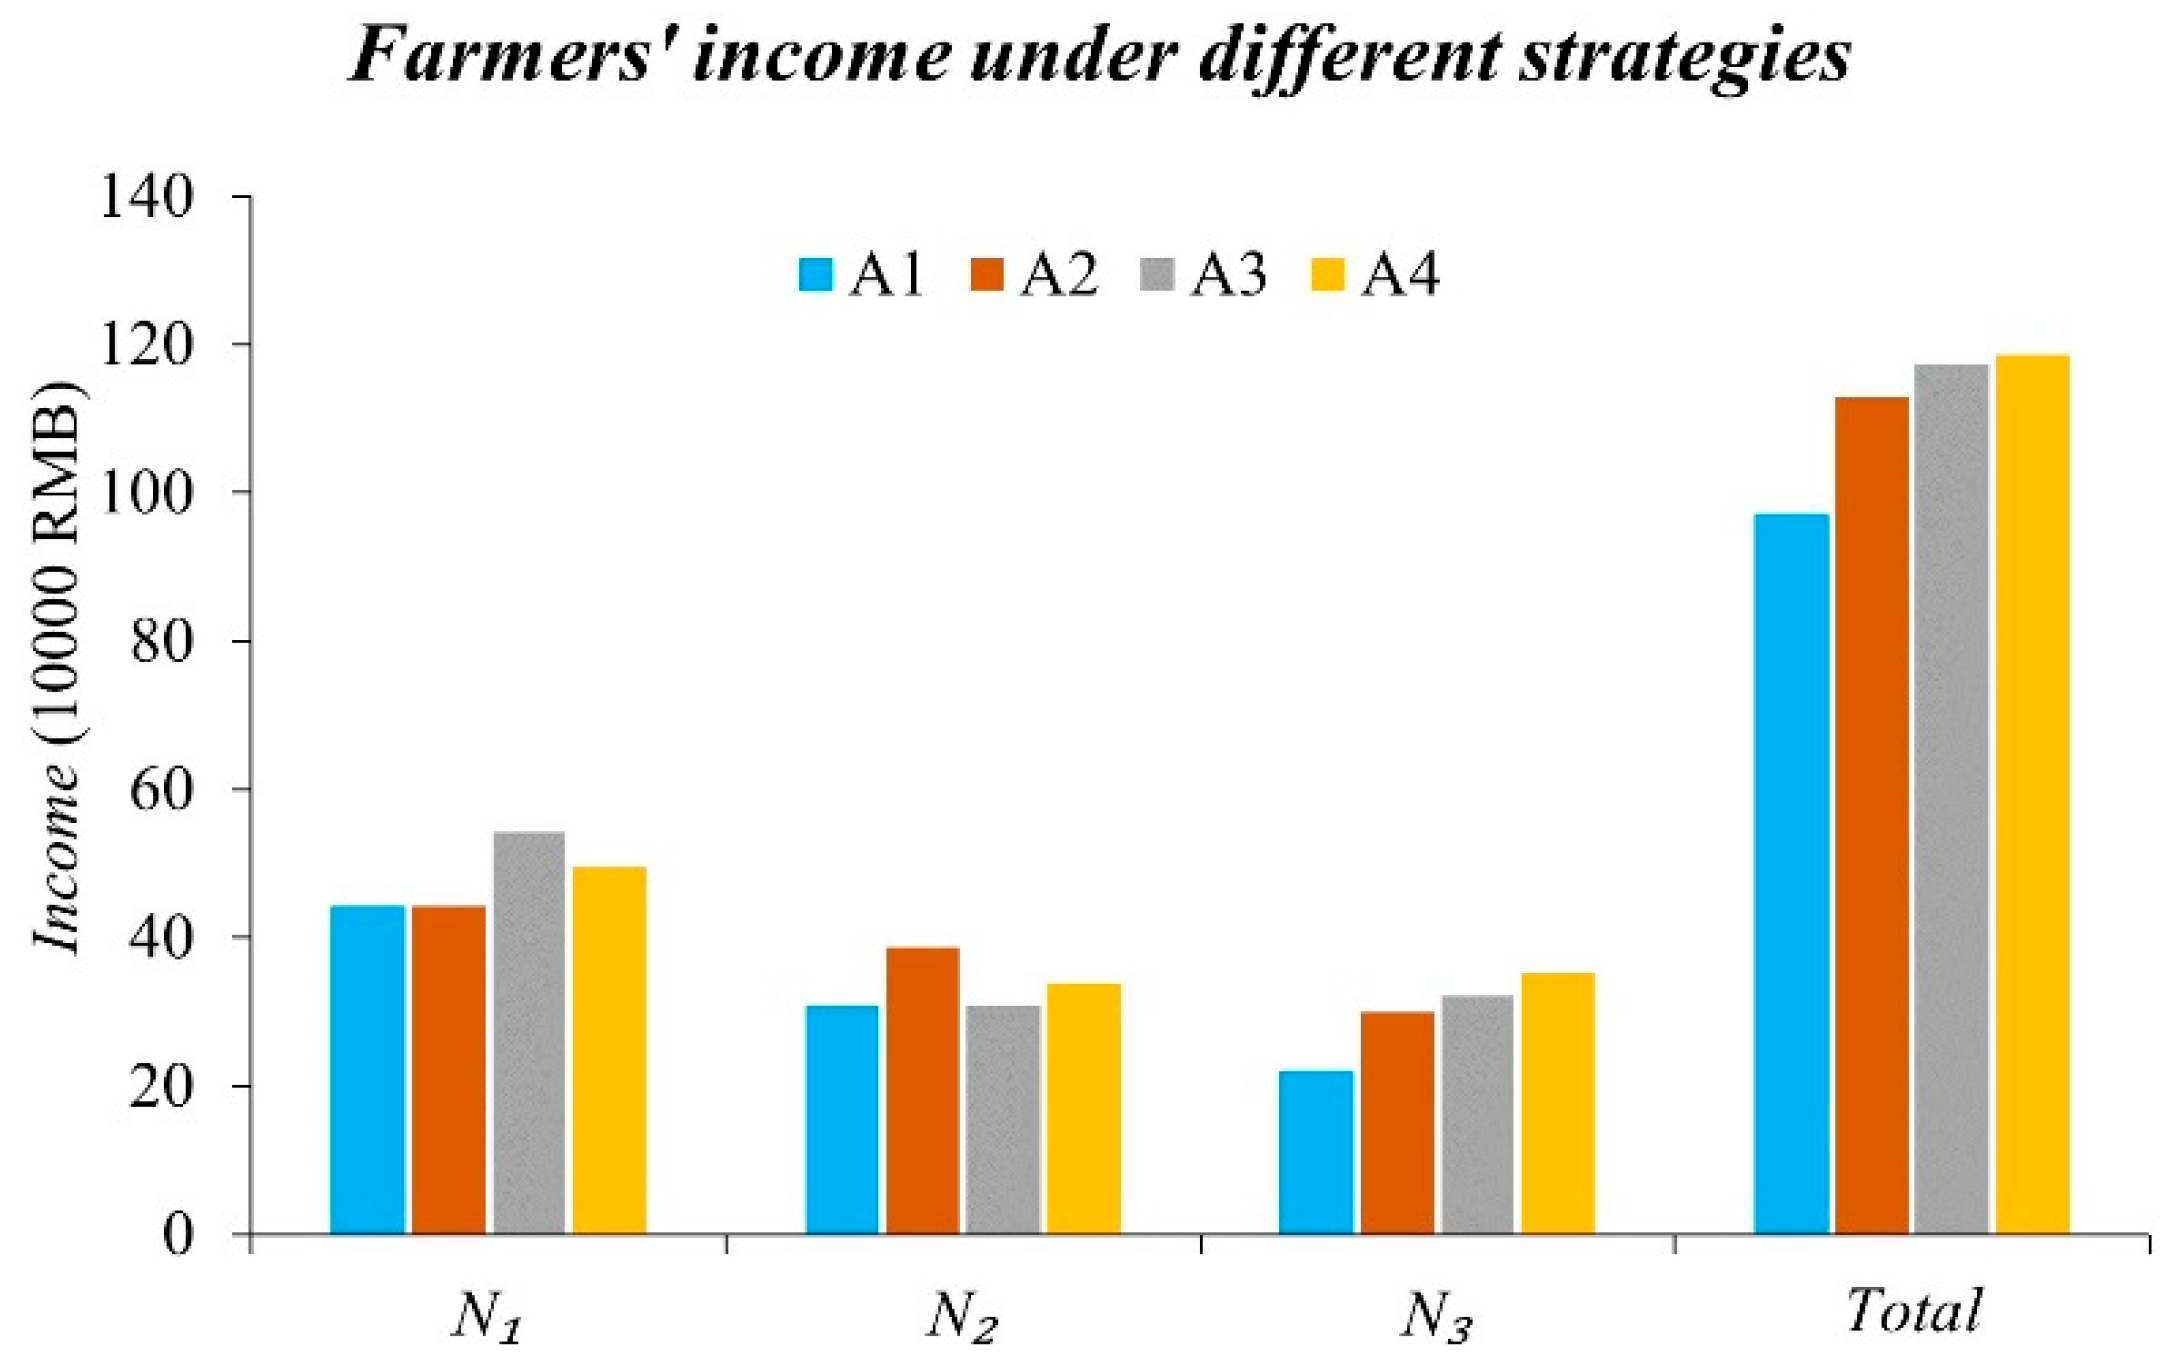
After the implementation of the alliance decision A1~A4, the overall income of farmers also changed relatively, and there is no water rights transaction between farmers under the A1 strategy; the income of N3, N1 and N2 are 34.33 thousand dollars, 68.75 thousand dollars and 47.97 thousand dollars, respectively, Under the A2 strategy, N3 and N2 conduct water rights trading, the income of N3 and N2 is 46.56 thousand dollars and 60.14 thousand dollars, respectively. Compared to previous to the water rights transaction, the income increased by 12.23 thousand dollars and 12.17 thousand dollars; under the A3 strategy, N3 and N1 conducted water rights trading, and the income of N3 and N1 was 49.98 thousand dollars and 84.40 thousand dollars, respectively; compared with before the water rights transaction, the income increased by 15.65 thousand dollars and 15.65 thousand dollars; under the A4 strategy, N3 conducted water rights transactions with N1 and N2, respectively, the income of N3, N1, and N2 are 54.65 thousand dollars, 76.89 thousand dollars, and 52.63 thousand dollars, respectively; compared with before the water rights transaction, the income increased by 20.33 thousand dollars, 8.14 thousand dollars, and 4.66 thousand dollars. At this time, the income per hectare of farmers N1, N2, and N3 were 1.92, 2.39, and 1.61 thousand $/hm2, respectively, which are 11.6%, 9.6%, and 59.4% higher than that before the water rights transaction. The benefits after the alliance show that when there are only two farmers who trade in water rights, the farmers who have not joined do not get the benefits. When the three farmers trade, they all get benefits as a whole. Compared with the non-alliance in different alliance decisions, the overall income increased without losing the interests of any farmer. Therefore, in the decision-making process of the alliance, by adjusting the distribution of benefits among farmers, a certain amount of compensation is given to farmers who suffer economic losses, and the corresponding compensation responsibilities are assumed for farmers whose profits increase, so as to achieve the greatest overall economic benefit.
4.2. Analysis on the Price of Water Rights Transaction among Farmers
The water rights that can be traded among farmers come from water-saving projects or the amount of water saved after optimizing irrigation quotas. In this paper, through the optimization of irrigation quota and marginal benefit, the tradable water volume among different farmers is obtained. Before optimization, the initial water rights of farmers N1, N2 and N3 are 166,700 m3, 91,700 m3 and 141,700 m3, respectively, while after optimization, the water rights of farmers are 130,700 m3, 77,000 m3 and 192,100 m3, respectively. When the optimized plan M1 was implemented, the farmer N1 can trade 47,600 m3 of water rights to the farmer N3. When the optimized plan M2 was implemented, the farmer N2 could trade 36,500 m3 of water rights to the farmer N3. When the optimized plan M3 was implemented, the farmers N1 and N2 could trade water rights to Farmer N3 respectively trades water rights of 36,000 m3 and 14,700 m3, as shown in Figure 8. After the optimization of water saving, the water consumption of farmers N1 and N2 was reduced compared with the initial allocation of water rights, and the remaining water could be traded to other water demand farmers N3.
Driven by different optimization schemes and alliance schemes, the amount of water that can be traded between farmers was different, and the benefits under different schemes were different, resulting in different prices for water rights transactions under different schemes. The transaction price of water rights between farmers was also affected by the value of water resources, water saving costs, and market crop sales prices. This paper uses cooperative game theory to introduce Shapley value to establish the alliance relationship between farmers, and then determine the price of water rights transaction among farmers. Through model calculation, it was found that the price of water rights transaction was closely related to optimization and farmers’ income before and after the alliance. For example, when farmers N2 and N3 trade, the optimized income of N2 and N3 are 34.17 thousand dollars and 34.33 thousand dollars, respectively. The income of N2 and N3 after alliance is 60.25 thousand dollars and 46.56 thousand dollars, respectively, and the water rights transaction price is 0.737 $/m3, and when farmers N1, N2, and N3 jointly establish an alliance relationship, the water rights transaction price is the lowest, and the water rights transaction price was 0.485 $/m3, and the water rights transaction price was 0.565 $/m3.
Based on the production function and game theory, this paper constructed a water rights transaction price model between farmers. In the model, the maximum marginal benefit of crops is considered to calculate the water rights allocated by farmers. The economic irrigation quota is used as an optimization method for the allocation of water rights between farmers. The right allocation obtained the tradable amount of water rights among farmers, and establishes decision-making schemes under different farmers’ alliances based on game theory, calculates the overall benefits of different decisions, and seeks the maximum benefits of the overall farmers after the alliance. For example, in this article, the overall income of the three farmers after the alliance is 184.16 thousand dollars, which is higher than the income of the non-alliance by 33.13 thousand dollars. At that time, the price of water rights transactions between farmers was relatively low. In this study, multiple farmers were used as the research object, and the total income of water rights distribution, water rights transactions, and different alliances between multiple farmers was analyzed, which broke through the limitations of individual farmers’ research. In the research process, because the alliance discussed under the alliance was the largest overall benefit, it couldn’t guarantee the maximum benefit of each farmer, so this scheme was suitable for the overall decision-making in the process of irrigation management. In future research, farmers’ willingness factors may also be added to the calculation process of the model, and farmers can then choose not to participate in the alliance after their interests are harmed.
4.3. Limitation
This paper only considers the pricing of water rights transaction between farmers by cooperative game theory under the current national production policy and the current agricultural planting structure. In the future, how to distribute the income after the change of planting structure and the adjustment of national policies will be the next research direction.
5. Conclusions
- (1)
- Economically determined irrigation quotas and crop planting patterns can be used to optimize the allocation of water for each crop. If the initial allocation of water rights is inconsistent with the optimal allocation of water, the difference should theoretically be the volume of water to be traded.
- (2)
- The pricing model of water rights transaction proposed in this paper includes cost price and earnings price. The model is not only suitable for water rights transaction between farmers in water-deficient areas, but also suitable for water rights transaction between different industries in water-deficient areas.
- (3)
- The total revenue distribution based on the Shapley value method makes the revenue distribution under each alliance fairer and more reasonable, and the water rights pricing should also be acceptable to farmers, as undertaking a transaction will improve their income.
- (4)
- A reasonable price can encourage transactions, thereby improving the efficiency of the water rights market. The consideration of the earnings price makes the determined price closer to the real value of water resources, and has important theoretical significance for improving the water rights transaction price theory.
- (5)
- This paper mainly focuses on the study of water rights transaction between one buyer and two sellers, providing a basis for future transactions between multiple buyers and multiple sellers.
- (6)
- Because the price of water rights transaction is affected by many factors such as economy, society, and environment, the study of this paper on the price of water rights transaction based on the production function and Game Theory is only a theoretical discussion. In the practical work, it is necessary to determine the final price and tradable water volume of water right transaction based on this theory and considering various factors comprehensively, for example, the bargaining power of both parties to water rights transactions, supply and demand factors, and crop market prices.
Author Contributions
Conceptualization, methodology and funding acquisition, X.G. Writing—original draft preparation, Q.D. Formal analysis and data curation, W.Z. Writing—review, B.W. All authors have read and agreed to the published version of the manuscript.
Funding
This research was funded by the National Natural Science Foundation of China (51979119), by the Special Fund for Basic Scientific Research of the Yellow River Institute of Hydraulic Research (HKY-JBYW-2020-17) and the Basic R&D Special Fund of Central Government for Non-profit Research Institutes.
Institutional Review Board Statement
It is not applicable for this study not involving humans or animals.
Informed Consent Statement
It is not applicable for this study not involving humans.
Data Availability Statement
The data that supports the findings of this study are available in this article.
Conflicts of Interest
The authors declare no conflict of interest.
References
- Zhu, Y.H.; Luo, P.P.; Zhang, S.; Sun, B. Spatiotemporal Analysis of Hydrological Variations and Their Impacts on Vegetation in Semiarid Areas from Multiple Satellite Data. Remote Sens. 2020, 12, 4177. [Google Scholar] [CrossRef]
- Luo, P.P.; Sun, Y.T.; Wang, S.T.; Wang, S.; Lyu, J.; Zhou, M.; Nagakami, K.; Takara, K.; Nover, D. Historical Assessment and Future Sustainability Challenges of Egyptian Water Resources Management. J. Clean. Prod. 2020, 263, 121154. [Google Scholar] [CrossRef]
- Yoo, J.; Simonit, S.; Connors, J.P.; Maliszewski, P.J.; Kinzig, A.P.; Perrings, C. The Value of Agricultural Water Rights in Agricultural Properties in Thepathof Development. Ecol. Econ. 2013, 91, 57–68. [Google Scholar] [CrossRef]
- Rey, D.; Garrido, A.; Calatrava, J. An Innovative Option Contract for Allocating Water in Inter-Basin Transfers: The Case of the Tagus-Segura Transfer in Spain. Water Resour. Manag. 2016, 30, 1165–1182. [Google Scholar] [CrossRef] [Green Version]
- Blanco, M.; Viladrichgrau, M. The Introduction of a Water Rights Trading Scheme in the Segre Basin and the Contribution of Reused Irrigation Water. Itea Inf. Tec. Econ. Ag. 2014, 110, 374–399. [Google Scholar] [CrossRef] [Green Version]
- Rosegrant, M.W.; Ringler, C.; Zhu, T. Water Markets as an Adaptive Response to Climate Change. Glob. Issues Water Policy 2014, 11, 35–55. [Google Scholar] [CrossRef]
- Lu, Q.E.; Luo, P.P.; Yu, W.Q.; Zhang, S.P.; Wang, G.Y.; Zhu, X.; Gao, F.; Zhou, M.M.; Lv, J.Q.; Ren, B.M. Research Progress of Urban Rainwater Utilization. Water Resour. Prot. 2021, 2, 1–10. (In Chinese) [Google Scholar]
- Luo, P.P.; Mu, D.R.; Xue, H.; Duc-Ngo, T.; Dang-Dinh, K.; Takara, K.; Nover, D.; Schladow, G. Flood Inundation Assessment for the Hanoi Central Area, Vietnam under Historical and Extreme Rainfall Conditions. Sci. Total. Environ. 2018, 8, 12623. [Google Scholar] [CrossRef] [PubMed]
- Cao, X.; Wang, Y.B.; Wu, P.T.; Zhao, X.N.; Wang, J. An Evaluation of the Water Utilization and Grain Production of Irrigated and Rain-Fed Croplands in China. Sci. Total Environ. 2015, 529, 10–20. [Google Scholar] [CrossRef] [PubMed]
- Bekchanov, M.; Bhaduri, A.; Ringler, C. Potential Gains from Water Rights Trading in the Aral Sea Basin. Agric. Water Manag. 2015, 152, 41–56. [Google Scholar] [CrossRef]
- Li, Y.P.; Liu, J.; Huang, G.H. A Hybrid Fuzzy-Stochastic Programming Method for Water Trading within an Agricultural System. Agric. Syst. 2014, 123, 71–83. [Google Scholar] [CrossRef]
- Wang, Y.B.; Liu, D.; Cao, X.C.; Yang, Z.Y.; Song, J.F.; Chen, D.Y.; Sun, S.K. Agricultural Water Rights Trading and Virtual Water Export Compensation Coupling Model: A Case Study of an Irrigation District in China. Agric. Water Manag. 2017, 180, 99–106. [Google Scholar] [CrossRef]
- Shao, D.G.; Wu, Z.; Gu, W.Q.; Chen, S. Water Use Right Trading Model of Irrigation Area Based on Supply-Demand Relation and Production Function. Hydraul. Eng. 2017, 48, 61–69. [Google Scholar] [CrossRef]
- Zhu, T.; Marques, G.F.; Lund, J.R. Hydroeconomic Optimization of Integrated Water Management and Transfers under Stochastic Surface Water Supply. Water Resour. Res. 2015, 51, 3568–3587. [Google Scholar] [CrossRef]
- Yue, G.; Fu, Q.; Zhao, K.; Li, T.X. Research on water Rights Trading Model Based on Interval Programming. J. Northeast Agric. Univ. 2016, 3, 102–108. (In Chinese) [Google Scholar] [CrossRef]
- Li, W. Analysis on the Present Situation, Shortages and Measures of Water Right Trading Price Formation Mechanism. Mod. Econ. Inf. 2020, 10, 156–158. [Google Scholar]
- Deng, X.H.; Xu, Z.M. A Laboratory Study of Auctions for Water Rights Transactions in Inland River Basin: A Case Study of Irrigation Areas of Heihe River Basin. Acta Ecol. Sin. 2012, 2, 1587–1595. (In Chinese) [Google Scholar] [CrossRef] [Green Version]
- Tian, G.L.; Gui, S.W.; Wei, D.; Shuai, M.D. A Study on the Influence of Comprehensive Reform of Agricultural Water Price on the Price of Water Rights in the Process of Transaction. Price Theory Pract. 2017, 2, 66–69. (In Chinese) [Google Scholar]
- Michelsen, A.M.; Person, P.; Young, R.A.; Michelse, A.M. Determinants and Trends in Water Right Market Prices. In Water Policy and Management: Solving the Problems, Proceedings of the 21st Annual Conference, Water Resources Planning and Management Division, Denver, CO, USA, 23–26 May 1994; American Society of Civil Engineers: Reston, VA, USA, 1994; pp. 165–168. Available online: Library.wrds.uwyo.edu/wrp/94-32/94-32.pdf (accessed on 18 April 2021).
- Wu, F.P.; Cheng, M.B. Research on the Pricing Method of Secondary Water Rights Trading Market Based on Cooperative Game Perspective. Price Theory Pract. 2018, 5, 43–46. [Google Scholar]
- Liu, G.; Yang, L.; Shi, Y.B.; Fang, Z.; Wang, S. An Empirical Study on the Two-tier Dynamic Game Pricing Mechanism of Water Rights Transaction under Quasi-market Conditions. China Popul. Resour. Environ. 2017, 27, 151–159. [Google Scholar]
- Han, Z.Q.; Zhang, X.H.; Tong, H.J.; Wang, L.P. Application Research of Crop Water Production Function in the Yellow River Basin. Yellow River 1994, 11, 45–49. (In Chinese) [Google Scholar]
- Yin, Y.S.; Meng, L.J. Alliance Game Analysis of “Win-Win” Outcomes in Water Rights Trading. Water Resour. Econ. 2008, 26, 14–15. (In Chinese) [Google Scholar]
- Do, K.H.P. Special Issue on Game Theory and Water Resource. Manag. Water Econ. Policy 2019, 1802005, 1–6. [Google Scholar] [CrossRef]
Figure 1.
Irrigation district map.

Figure 2.
The price model diagram of water rights transaction among farmers.

Figure 3.
Initial allocation of water rights.

Figure 4.
Water rights allocated after optimization.

Figure 5.
Revenue matrix of the Game Model of water rights transaction under different alliances.

Figure 6.
Crop revenue before optimization.

Figure 7.
Crop revenue after optimization.

Figure 8.
The tradable water volume among irrigation water users under the optimized scheme M3.


Table 1.
Total irrigation water for crops and the initial water rights.
| Farmer | Crop | Total Water (104 m3) | Irrigation Water Use Coefficient | Total Water for Irrigation (104 m3) | Initial Water Rights (104 m3) | Initial Irrigation Quota (m3/hm2) | Crop Price ($/kg) |
|---|---|---|---|---|---|---|---|
| N1 | Wheat | 57 | 0.7 | 40 | 16.67 9.17 14.17 | 4168 4168 4168 | 0.264 |
| N2 | Maize | 0.300 | |||||
| N3 | Cotton | 2.331 |
Table 2.
Coefficients of water production function of crops.
| Crop | Constant Term of Water Production Function | ||
|---|---|---|---|
| a | b | c | |
| Wheat | −0.0059474 | 3.9260908 | −197.94 |
| Maize | −0.0077347 | 4.7880120 | −248.42 |
| Cotton | −0.0024283 | 1.9811347 | −334.08 |
Table 3.
Changes before and after optimization of irrigation quota among farmers.
| Farmer | Crop | Initial Irrigation Quota (m3/hm2) | Initial Allocation of Water (Ten Thousand m3) | Optimized Economic Irrigation Quota (m3/hm2) | Water Demand after Optimization (Ten Thousand m3) | Water Savings (Ten Thousand m3) |
|---|---|---|---|---|---|---|
| N1 | wheat | 4168 | 16.67 | 3267 | 13.07 | 3.6 |
| N2 | corn | 4168 | 9.17 | 3502 | 7.7 | +1.47 |
| N3 | cotton | 4168 | 14.17 | 5651 | 19.21 | −5.07 |
Note: ”+” indicates the amount that can be reduced, “−” indicates the amount that needs to be increased.
Table 4.
Revenue before and after optimization plan M3.
| Farmer | Revenue before Optimization (Thousand Dollars) | Revenue after Optimization (Thousand Dollars) | Revenue Per Unit Area before Optimization (1000 $/hm2) | Revenue Per Unit Area after Optimization (1000 $/hm2) |
|---|---|---|---|---|
| N1 | 68.75 | 59.44 | 1.72 | 1.49 |
| N2 | 47.97 | 44.32 | 2.18 | 2.01 |
| N3 | 34.33 | 80.40 | 1.01 | 2.36 |
Table 5.
Total revenue for each alliance form.
| No. | Alliance Form | Revenue |
|---|---|---|
| 1 | 68.75 | |
| 2 | 47.97 | |
| 3 | 34.33 | |
| 4 | 116.72 | |
| 5 | 134.37 | |
| 6 | 106.64 | |
| 7 | 184.16 |
Unit: thousand dollars.
Table 6.
Revenue distribution of farmer an under two players alliance.
| S | ||
|---|---|---|
| υ(S) | 68.75 | 134.37 |
| υ(S\{M}) | 0 | 34.33 |
| υ(s) − υ(S\{M}) | 68.75 | 100.04 |
| |S| | 1 | 2 |
| w(|S|) | 1/2 | 1/2 |
| w(|S|)[υ(s) − υ(S\{M})] | 34.37 | 50.02 |
Unit: thousand dollars.
Table 7.
Revenue distribution of farmer an under three players alliance.
| S | ||||
|---|---|---|---|---|
| υ(S) | 68.75 | 116.72 | 134.37 | 184.16 |
| υ(S\{M}) | 0 | 47.97 | 34.33 | 106.64 |
| υ(s) − υ(S\{M}) | 68.75 | 68.75 | 100.04 | 77.52 |
| |S| | 1 | 2 | 2 | 3 |
| w(|S|) | 1/3 | 1/6 | 1/6 | 1/3 |
| w(|S|)[υ(s) − υ(S\{M})] | 22.92 | 11.46 | 16.67 | 25.84 |
Unit: thousand dollars.
Table 8.
Water rights trading price under Strategy.
| Strategy | Tradable Water (104 m3) | Revenue under Alliances (Thousand Dollars) | Crop Revenue after Optimization (Thousand Dollars) | Increase Revenue Value (Thousand Dollars) | Pricing of Water Rights Transactions ($/m3) | |||||
|---|---|---|---|---|---|---|---|---|---|---|
| N1 | N2 | |||||||||
| A1 | - | - | - | - | - | - | - | - | - | - |
| A2 | 0 | +3.65 | 0 | 60.14 | - | 33.24 | - | +26.9 | - | 0.737 |
| A3 | +4.76 | 0 | 84.40 | 0 | 55.01 | - | +29.39 | 0.617 | - | |
| A4 | +3.60 | +1.47 | 76.89 | 52.63 | 59.44 | 44.32 | +17.45 | +8.31 | 0.485 | 0.565 |
Note: In the tradable water volume, “+” means the amount of water that can be sold, “-” means the amount of water that needs to be purchased and the RMB that needs to be paid for the purchase of water rights.
Publisher’s Note: MDPI stays neutral with regard to jurisdictional claims in published maps and institutional affiliations. |
© 2021 by the authors. Licensee MDPI, Basel, Switzerland. This article is an open access article distributed under the terms and conditions of the Creative Commons Attribution (CC BY) license (https://creativecommons.org/licenses/by/4.0/).
Share and Cite
MDPI and ACS Style
Guan, X.; Du, Q.; Zhang, W.; Wang, B. Study on the Pricing of Water Rights Transaction between Irrigation Water Users Based on Cooperative Game in China. Water 2021, 13, 1672. https://doi.org/10.3390/w13121672
AMA Style
Guan X, Du Q, Zhang W, Wang B. Study on the Pricing of Water Rights Transaction between Irrigation Water Users Based on Cooperative Game in China. Water. 2021; 13(12):1672. https://doi.org/10.3390/w13121672
Chicago/Turabian StyleGuan, Xinjian, Qiongying Du, Wenge Zhang, and Baoyong Wang. 2021. "Study on the Pricing of Water Rights Transaction between Irrigation Water Users Based on Cooperative Game in China" Water 13, no. 12: 1672. https://doi.org/10.3390/w13121672
Note that from the first issue of 2016, this journal uses article numbers instead of page numbers. See further details here.