
Modelled Quantification of Different Sources of Nitrogen Inefficiency in Semi-Arid Cropping Systems


Department of Animal, Plant and Soil Sciences, 5 Ring Road, La Trobe University, Bundoora 3086, Australia
*
Author to whom correspondence should be addressed.
Agronomy 2021, 11(6), 1222; https://doi.org/10.3390/agronomy11061222
Submission received: 27 April 2021
/
Revised: 10 June 2021
/
Accepted: 10 June 2021
/
Published: 16 June 2021
(This article belongs to the Section Soil and Plant Nutrition)
Abstract
:Most dryland grain growers in Australia retain all or most of their crop residues to protect the soil from erosion and to improve water conservation but retaining stubbles with a high carbon-to-nitrogen (C:N) ratio can affect N availability to crops. A simulation experiment was conducted to investigate the effects of N fertilizer application rate and residue retention on soil N dynamics. The simulation used seven N fertilizer application rates (0, 25, 50, 75, 100, 150 and 200 kg N ha−1) to wheat (Triticum aestivum) over 27 years (1990–2016) at four locations across a gradient in annual rainfall in Victoria, Australia. Nitrogen immobilization, denitrification and N leaching loss were predicted and collectively defined as sources of N inefficiency. When residues were retained, immobilization was predicted to be the biggest source of inefficiency at all simulated sites at N application rates currently used by growers. Leaching became a bigger source of inefficiency at one site with low soil water-holding capacity, but only at N rates much higher than would currently be commercially applied, resulting in high levels of nitrate (NO3−) accumulating in the soil. Denitrification was an appreciable source of inefficiency at higher rainfall sites. Further research is necessary to evaluate strategies to minimize immobilization of N in semi-arid cropping systems.
1. Introduction
World population and food demand will both continue to increase in the next three decades, at least. Fischer and Connor [1] conclude that staple grain crop yields need to increase by 1.1% p.a. relative to 2010 levels to meet increasing demand, but future yield gains must be supported with environmentally appropriate inputs of plant nutrients [2].
Nitrogen (N) is an essential macro-nutrient for plant growth and a key agricultural input that has been increasingly used in food production since the invention of the Haber-Bosch process to reduce atmospheric N2 gas to reactive forms of N [3]. Nitrogen is also the most limiting nutrient for non-leguminous crop production in most agricultural areas in the world. Rapid increases in global yields achieved over the last half-century have been supported by large increases in the application of N fertilizers [2]. However, N can be lost easily from the soil-plant system.
Semi-arid and arid lands comprise one-third of the global land area and are extensively used for agricultural production. Wheat (Triticum aestivum) is grown in Australia in climates that range from subtropical to semi-arid Mediterranean, with the majority being produced in the semi-arid Mediterranean regions of the states of Western Australia, South Australia and Victoria and the semi-arid temperate regions of southern New South Wales.
Hochman and Horan [4] estimate that 40% of the substantial gap between farm yield and water-limited potential yield that exists in Australia is due to N deficiency, indicating that higher applications are required to achieve potential yields. As crop yield is now reliant on fertilizer N, which is costly and can be detrimental to the environment, it is vital to use fertilizers as efficiently as possible. A better understanding of the inefficiencies associated with N fertilizer application is therefore essential to increase N-use efficiency (NUE) and yield.
The efficiency with which N is used for crop production can be defined and measured in different ways that have been well described by Good et al. [5]. The numerator in most definitions of NUE is either total above-ground shoot dry weight or grain yield, but the denominator varies to suit the purpose and context of specific studies. In all indices, poor efficiency of N is either a result of cycling or loss mechanisms in the soil environment such as immobilization, leaching, volatilization and denitrification or inefficiency within the plant such as poor N uptake or transfer to grain [6]. In this study, we refer only to the cycling and loss mechanisms which represent long-term unavailability (immobilization) or loss (leaching, volatilization, denitrification) from the soil-plant system and define these collectively as sources of N inefficiency as they reduce NUE by most accepted definitions. These are detailed below.
Ammonia volatilization is a chemical process that occurs at the soil surface when ammonium (NH4) from urea is converted to ammonia gas (NH3). As most of the cropping areas in southern Australia are non-irrigated, farmers are dependent on rainfall to move surface-applied fertilizers into the soil where these are safe from being volatilized [7].
Denitrification is an anaerobic respiratory process performed by many bacterial species [8]. It mostly occurs in waterlogged conditions when bacteria must use oxygen from sources such as nitrate, thereby converting N-containing molecules to gaseous forms. Heavy rainfall after mineralization provides conditions that favour denitrification.
Nitrogen can also be lost from the root zone of annual crops through leaching [9]. This is influenced by the amount and pattern of rainfall relative to evapotranspiration and soil plant-available water capacity. Excessive N fertilization causes the accumulation of mineral N in soil, largely in the form of nitrate, which can be readily leached.
Nitrogen immobilization is defined as the transformation of inorganic N forms such as nitrate, ammonia and ammonium into organic forms which are not available to plants [10]. This process is undertaken by heterotrophic soil microorganisms that use carbon from plant residues for energy but require N to form their cellular structures. When these organisms die and begin to decompose, they form the humus fraction of soil organic matter (SOM). The balance between N immobilization and mineralization is dependent on the C:N ratio of the organic material added to the soil. Residues with a high C:N ratio, such as those of cereals (~80:1), immobilize more N than residues with a low C:N ratio, such as those of legume crops (~25:1) [11]. Environmental factors including soil temperature, soil water content and drying and rewetting events also greatly influence immobilization and mineralisation rates [12]. The net balance between N mineralization and immobilization determines how much N becomes available for crops during the growing season. The mismatch between the timing of N mineralization and the time of peak crop demand is likely a key factor for low NUE [13].
The duration of N immobilization and the time of N release may substantially reduce plant-available N [14]. Immobilization during crop growth represents intraspecific competition between plants and microorganisms for mineral N. Microorganisms outcompete plants for mineral N, particularly at low N concentrations [15]. The short lifecycle of microorganisms means that immobilized N is re-mineralized, whereas the longer lifecycle of most plants ensures a unidirectional flow of N which allows plants to compete over the longer term. However, if immobilization induces crop N deficiency during periods of growth critical to yield due to soil mineral N being insufficient to meet plant demand, then yields will be reduced [16]. The addition of wheat straw to topsoil has been shown to result in 5 months of net immobilization, and N accumulation and yield of wheat decreased as a result [17]. Immobilization of N by retention and incorporation of wheat and rice residues has been shown to depress both wheat and rice yields (3.7 and 4.5 t/ha, respectively) compared to residue removal (4.1 and 5.6 t/ha) [18].
The time taken for immobilized fertilizer N to become available for crop production also has economic implications. The half-life of immobilized N is estimated to be decades [19], meaning that the return on investment from yield increases due to re-mineralized N from fertilizer would be greatly diminished by discounting to allow for the time-dependent value of cash. In summary, the advantages and disadvantages of immobilization in farming systems reflect the dilemma that soil organic matter is primarily useful for crop production when it is being mineralized, but immobilization is the ‘fee’ required to build this resource, which comes at a cost to crop production [20]. Unlike the other sources of inefficiency described above, immobilization does not represent a complete loss of N from the soil-plant system and it is currently difficult to understand if immobilization is positive or negative in farming systems over years or decades. Whilst immobilization has been demonstrated to reduce crop yields and NUE, it can also prevent N losses via leaching, denitrification and volatilization by storing N in less mobile forms [21]. Immobilization is also necessary for the accumulation of soil organic matter and storage of soil organic carbon due to the stoichiometric relationship between C and N in soil organic matter [22]. Whilst the accumulation of soil organic matter can offset anthropogenic carbon emissions, its primary role in crop production is the provision of N from mineralization [23] and this function can be partially substituted by applications of N fertilizer [24].
Since 1990, most of Australia’s wheat has been produced in no-till farming systems with all crop residues (stubble) retained [25]. Crop residues are a source of organic C for soil microorganisms and increase microbial activity, resulting in N immobilization [26]. Immobilized N is not lost from the plant-soil system and has no negative offsite environmental consequences. However, the half-life of immobilized N can be up to decades, making it an important source of inefficiency from a crop production perspective [19].
Knowledge of sources of N inefficiency is necessary to develop strategies to reduce losses of N, maximise NUE and ultimately increase crop yield [27]. To achieve this, quantification and understanding of the relative importance of the different sources of N-fertilizer inefficiency in different environments are required. Most studies in south-east Australia were conducted prior to the widespread adoption of no-till and stubble retention during the 1990s and 2000s [25] and recent changes in rainfall pattern [28]. Many of these studies were also conducted at higher-rainfall sites, not representative of the low-rainfall environment that comprises most of the Australian cropping belt [19].
Cropping systems models, which are able to simulate crop growth and soil N processes accurately, can be a useful tool to understand and improve management in farming systems. Simulation allows simultaneous evaluation of all sources of N inefficiency, conducted over many sites and seasons, and imposition of experimental treatments to assess the impact on production and environmental losses. Here we use the Agricultural Production Systems sIMulator (APSIM) [29] to quantify sources of N inefficiency across a rainfall gradient and a range of fertiliser N inputs in modern farming systems with and without stubble retention in Mediterranean southeast Australia. APSIM is the most extensively validated crop production model available for the environment of interest. We hypothesise that a) denitrification and leaching will become greater sources of inefficiency at the higher rainfall sites and at higher rates of N fertiliser application and b) immobilisation will be greater in all treatments where stubble is retained.
2. Materials and Methods
We applied the Agricultural Production Systems sIMulator (APSIM), which is based on a set of biophysical modules that simulate biological and physical processes in farming systems [29], to quantify the relative importance of immobilization, denitrification and leaching as sources of N inefficiency in wheat-based farming systems in southeast Australia. We conducted point-based simulations over 27 years at four locations in the state of Victoria across a rainfall gradient, with two residue treatments (with and without retention of crop residues) and seven fertiliser N rates to capture interactions between site and seasons, and how residue retention influences N cycling. Results are considered in terms of sources of N for crop production (mineral N at sowing, net in-crop mineralization) and temporary (immobilization) and permanent (offtake in grain, offtake in removed stubble, leaching and denitrification) inefficiency or loss of N from the soil-plant system.
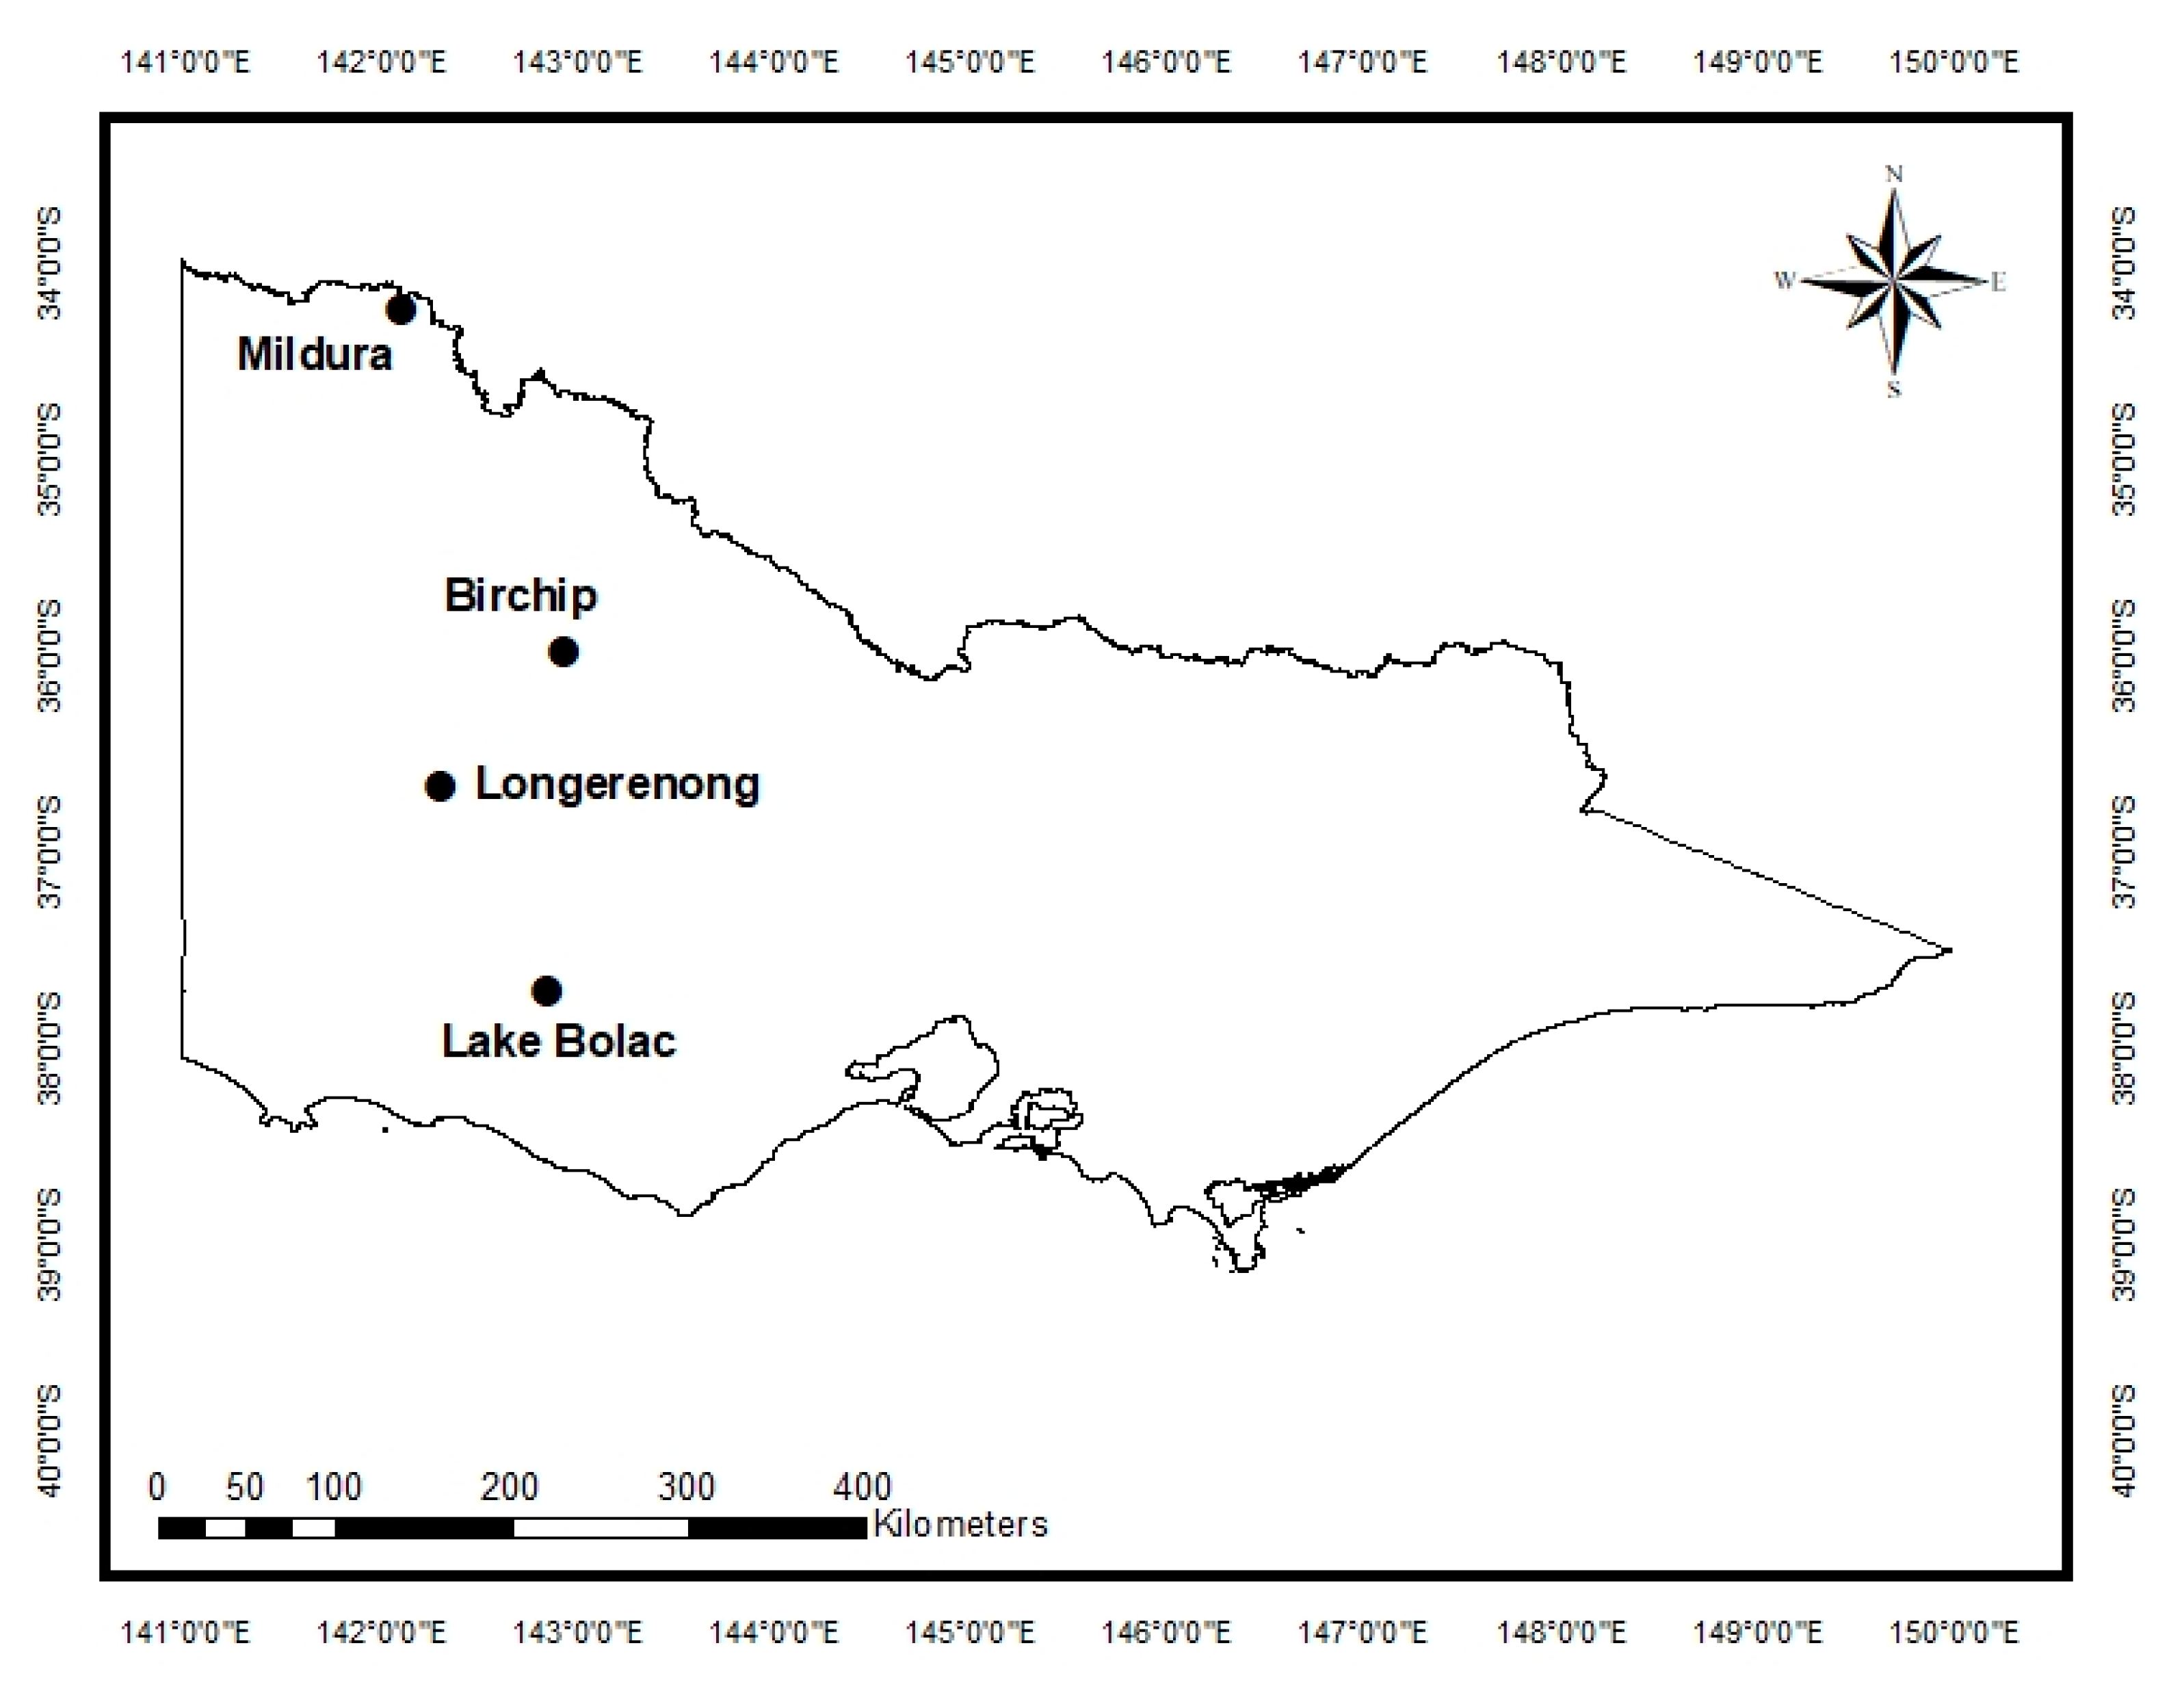
APSIM 7.9 [29] was used to model soil water, N dynamics and crop growth. We considered four different sites (Mildura, Birchip, Longerenong and Lake Bolac [30]) which are located in the state of Victoria and vary in soil type and the amount of annual rainfall they receive (Figure 1, Table 1).
The APSIM modules used in the study were NWHEAT, SOILWAT, SOILN, RESIDUE and MANAGER. These modules are described on the APSIM website (www.apsim.info, accessed on 7 June 2021) and are well-validated for wheat growth and development [31] and the simulation of soil water and N dynamics [32,33]. The ability of APSIM to simulate N cycling and losses has been specifically validated against field data for leaching [31] and denitrification [33,34], and numerous studies have demonstrated its relevance to commercial crops in southeast Australia [35,36,37].
Crop production was simulated from 1 January 1980 until 31 December 2016 and the first ten years of the simulation were discarded to remove effects of model initialisation. The time period used for analysis (1990–2016) coincides with the break-point in water-limited potential yields identified by Hochman and Horan [4]. Climate data for each location were obtained from the SILO website: (https://longpaddock.qld.gov.au/silo/ accessed on 11 June 2021).
Parameters used for simulation included: the fertilizer type (urea-N), which was applied at sowing at all sites; the sowing date (1 May); wheat variety (early–mid cultivar which uses based-cultivar parameters with vernalization, and photoperiod sensitivity adjusted to 1.5 and 3.0 respectively); row spacing (250 mm); and plant population (150 plants/m2). Treatments in the simulation experiment were seven N rates (0, 25, 50, 75, 100, 150 and 200 kg N ha−1) and two stubble treatments (retained and removed) which were applied in factorial combination. In the stubble-removed systems, surface organic matter was reset to 0 kg ha−1 on 1 January in each year of the simulation. During the entire simulation period, soil N and soil water variables were not reset. This approach allows legacy effects of different N fertilizer rates to impact results in the following years [38]. In the retained treatment, stubble accumulated and was only reduced through natural decay but 70% of all residues were incorporated at sowing each year to represent levels of incorporation of no-till seeding equipment [39]. The soil types were selected from APSoil to be representative of each region and the maximum soil depth for each site was 1.3 m (Table 1).
Outputs from APSIM and the period over which they were obtained are described in Table 2. Mineral N as nitrate was calculated at sowing in APSIM. Net N mineralization was calculated as the annual (1 January to 31 December) N mineralization from soil organic matter pools, plus N mineralization from surface residues, minus N immobilization from both soil organic matter pools and surface residues. APSIM allows the estimated loss of (NO3−) through denitrification and leaching to be calculated but it does not predict N loss by (NH3) volatilization. Loss of N by volatilization was therefore not calculated in this study.
3. Results
3.1. Mineral N at Sowing and Net in-Crop N Mineralization
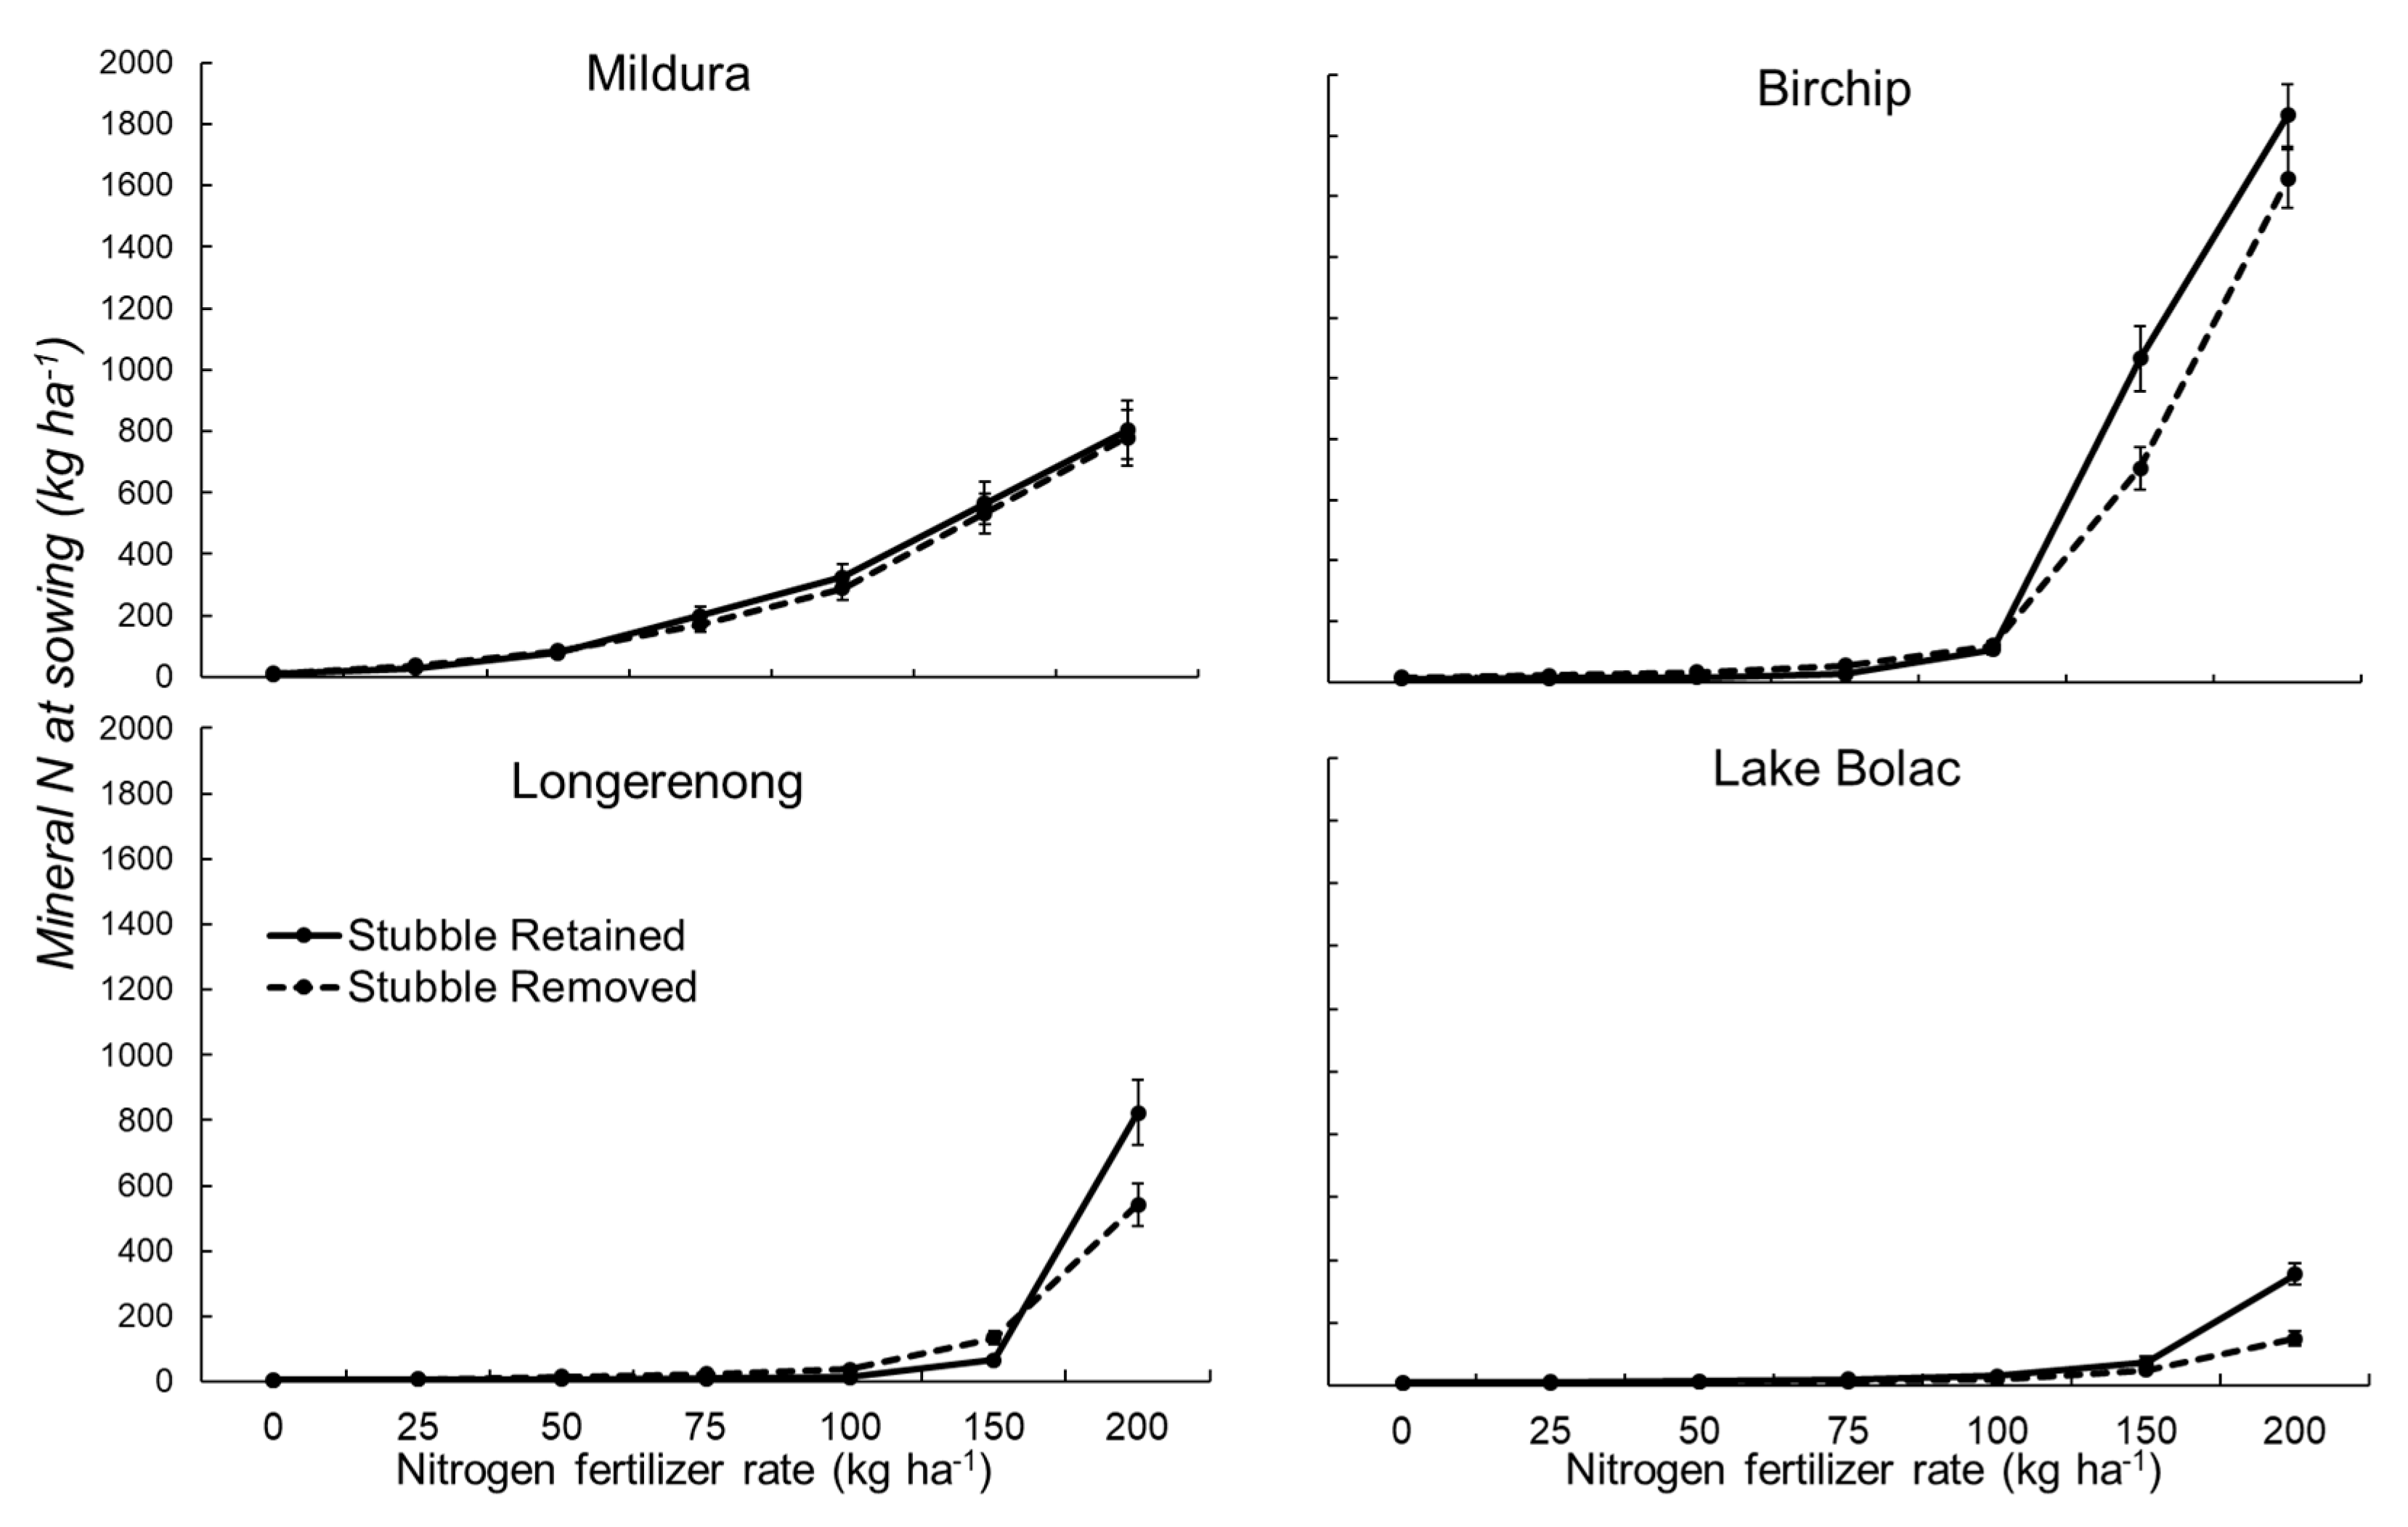
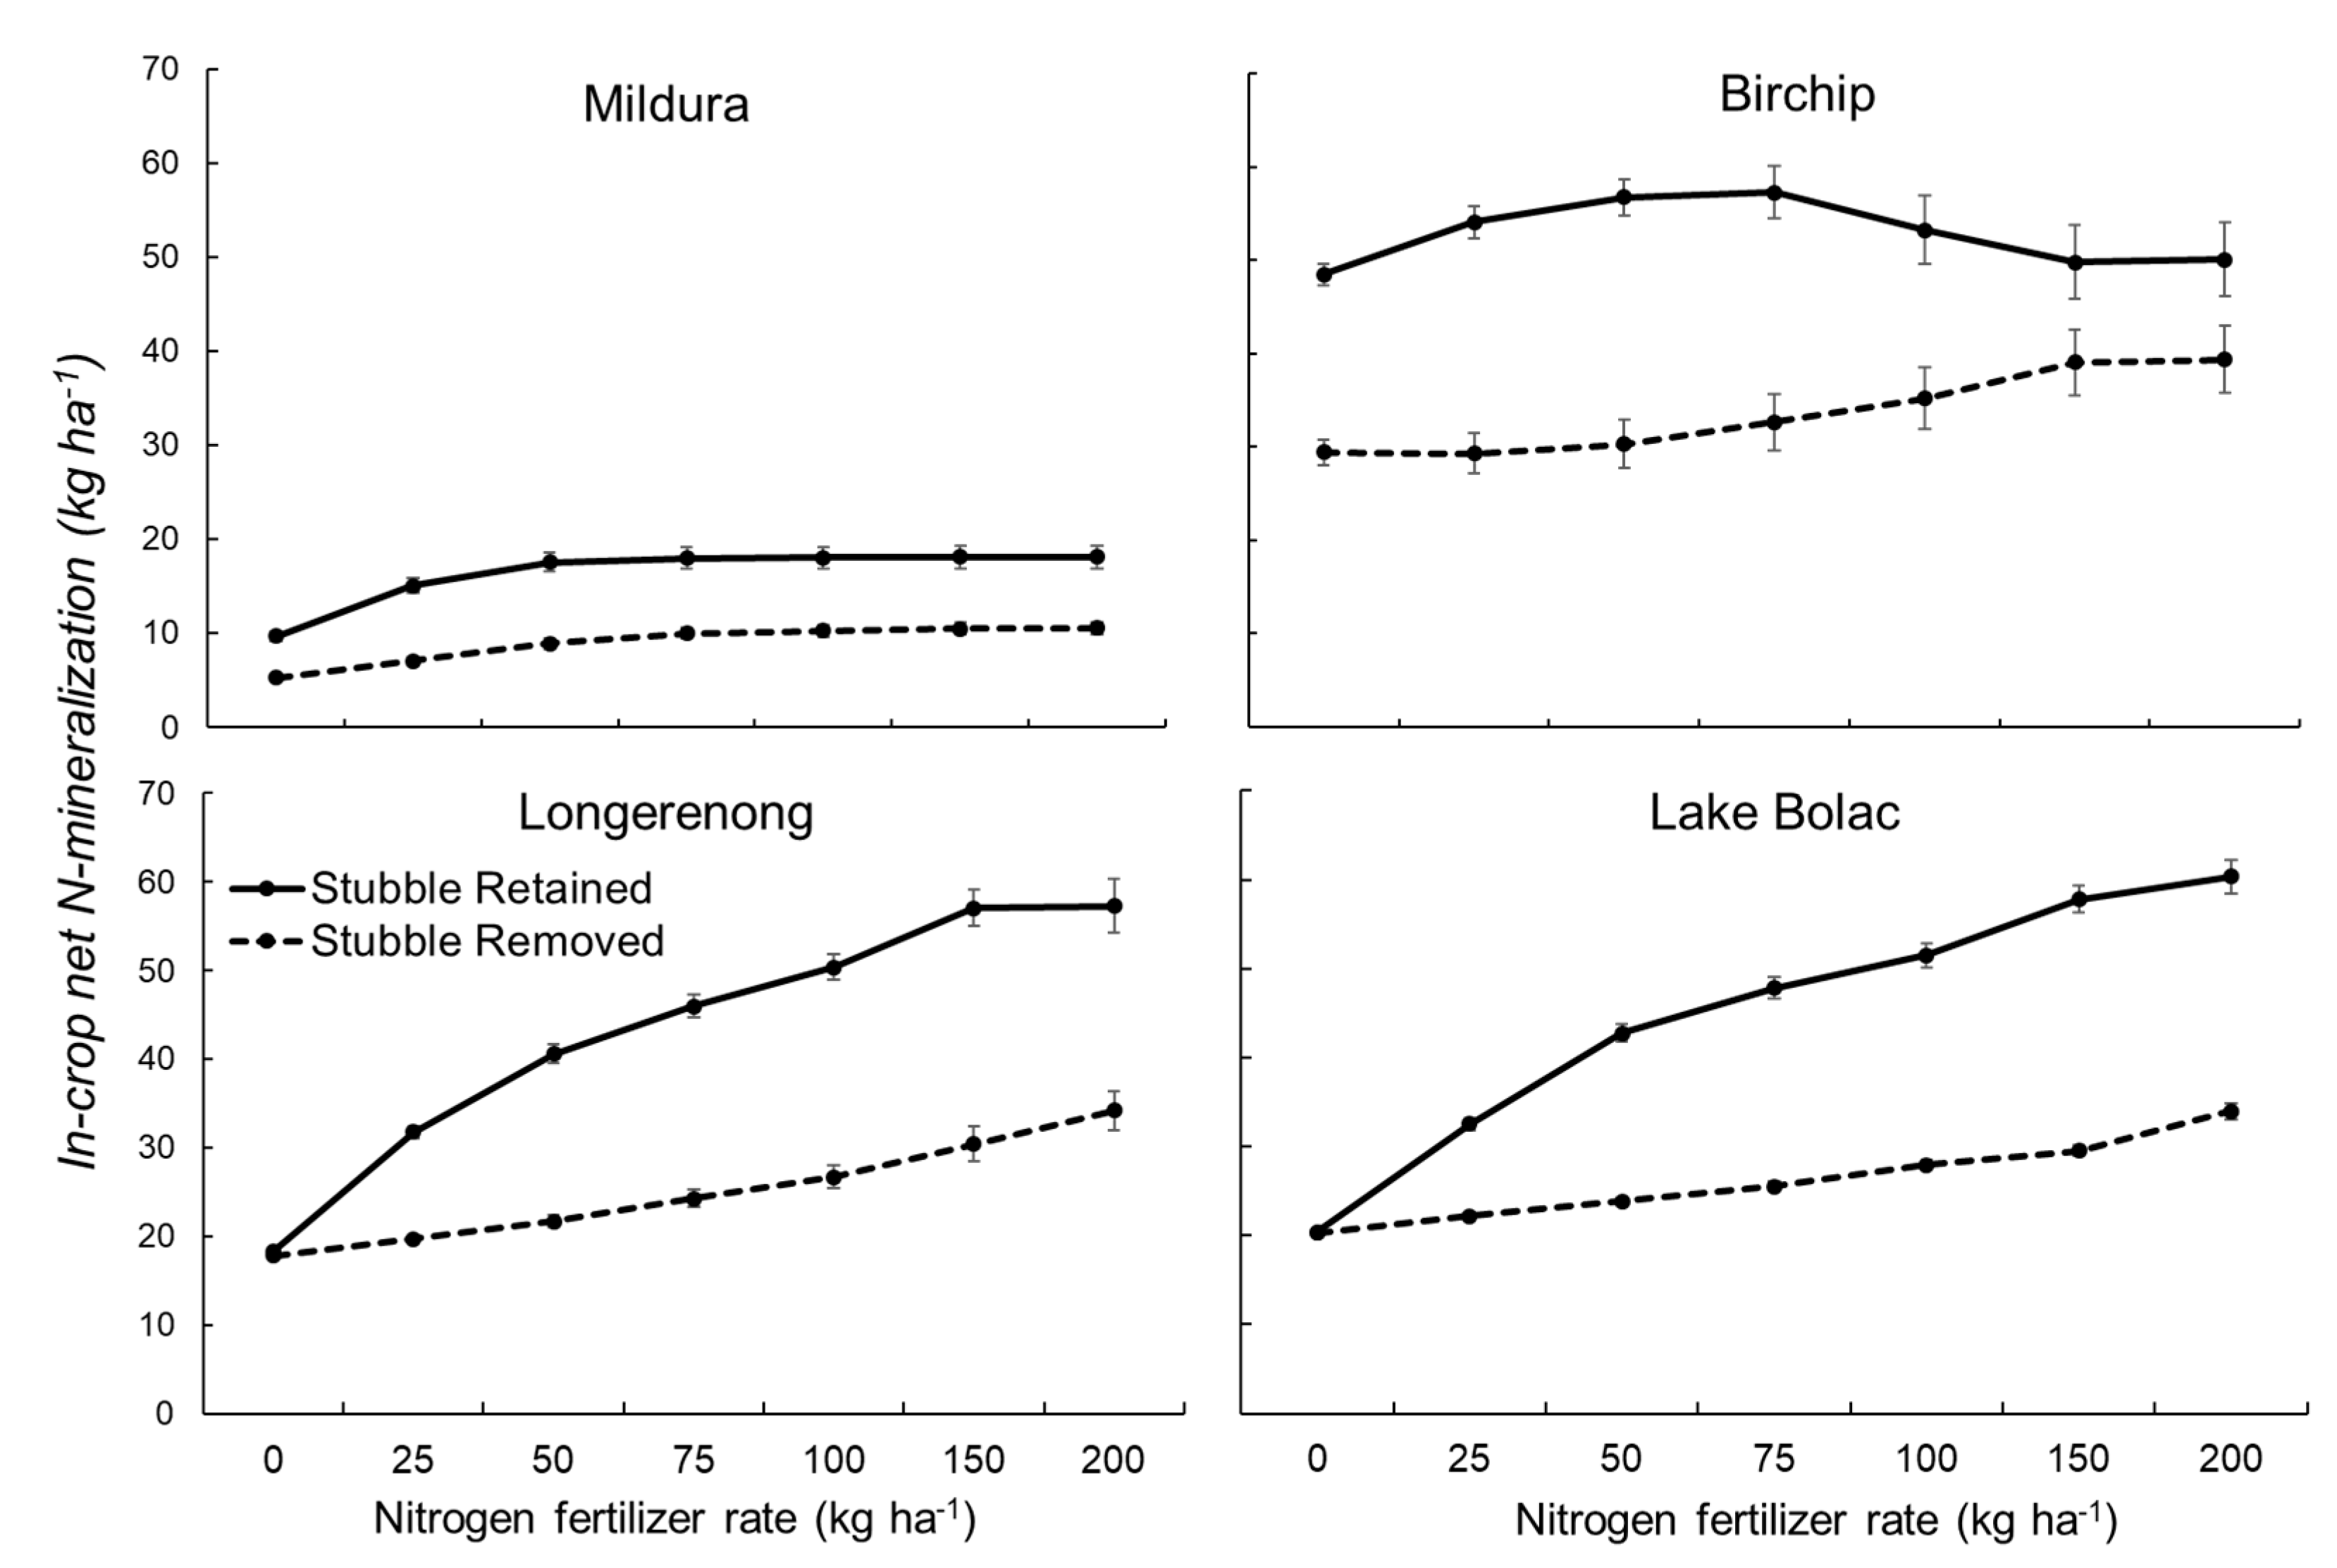
Increasing rates of N fertilizer increased mineral N at sowing (Figure 2) and net in-crop N mineralization (Figure 3), both of which are important sources of N for crop production. In the case of N at sowing, there was a threshold level of fertilizer application at each site above which increases were rapid and large. This coincided with N balance becoming positive (Figure 4). Stubble retention had a small positive effect on the concentration of mineral N in the soil at Birchip, Longerenong and Lake Bolac at higher rates of N application. Stubble retention increased net in-crop N mineralization at all sites.
3.2. Immobilization
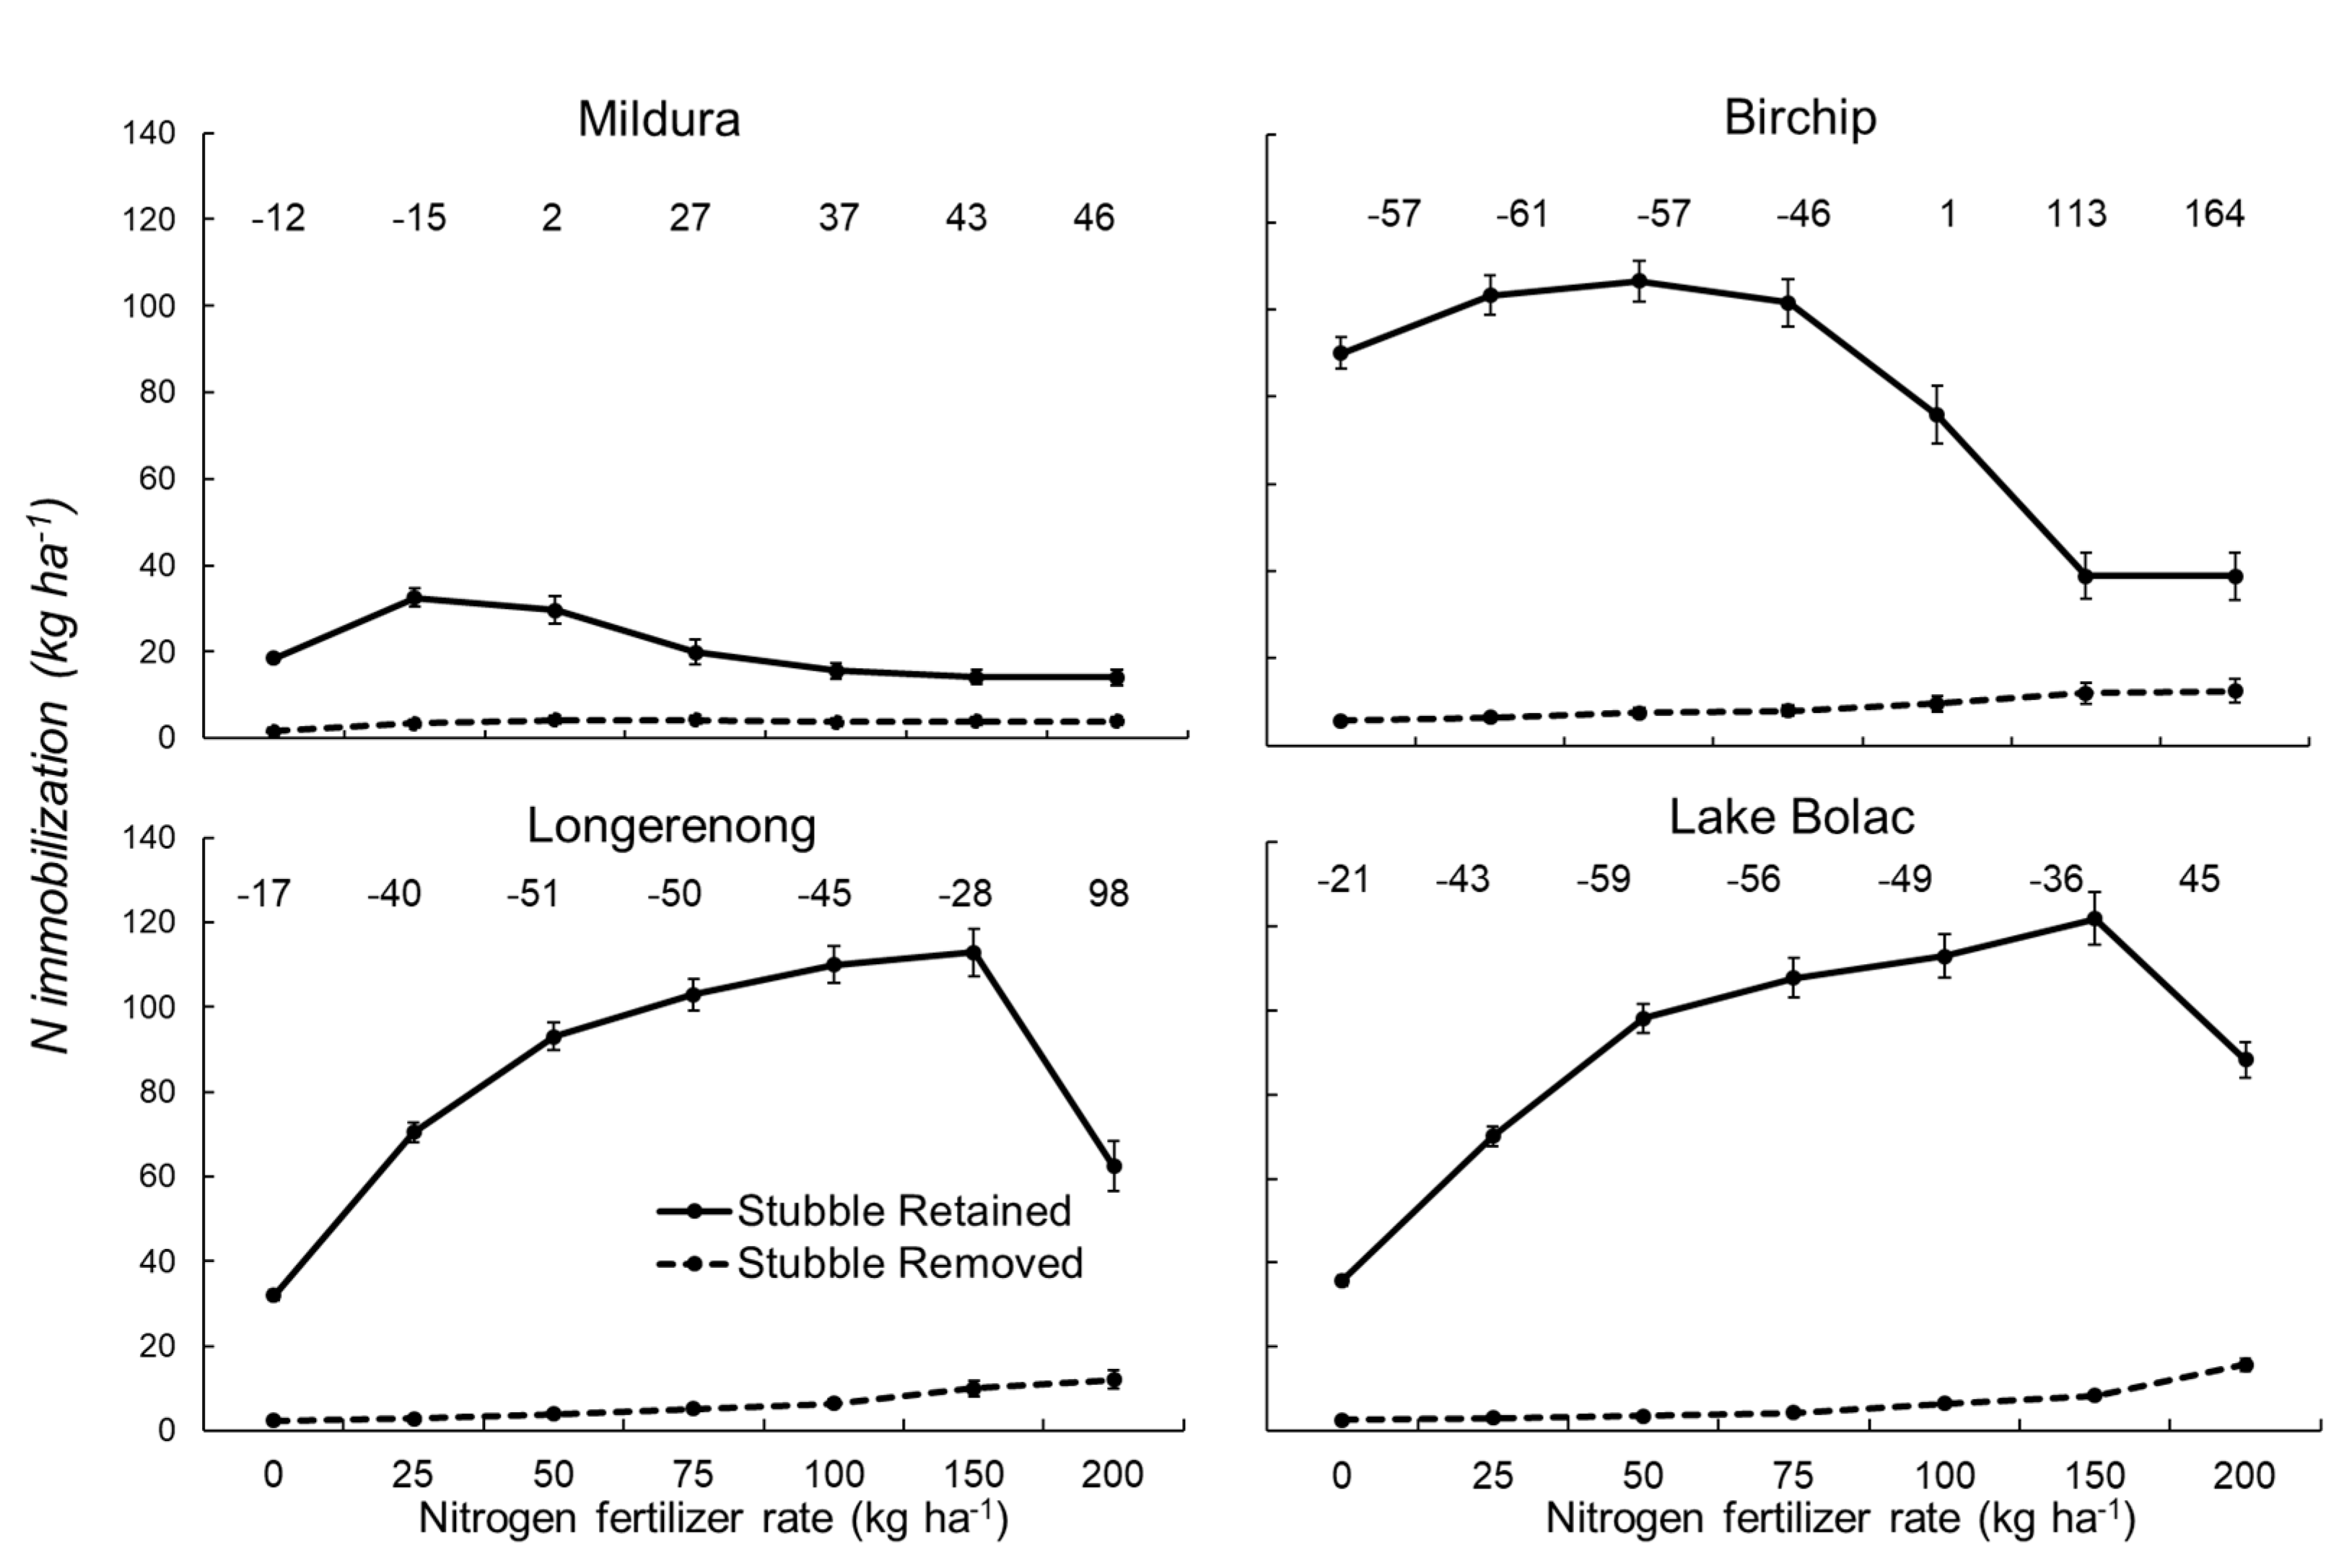
Figure 4 shows changes in mean annual immobilization at the four sites with increasing N fertilizer rates, as well as changes to the soil N balance (N inputs minus N loss from offtake in grain, leaching and denitrification) for the stubble-retained system. Retaining stubble increased N immobilization substantially at all sites but this varied with N rate. Where stubble was retained, N immobilization initially increased with higher N rates due to increasing carbon inputs as stubble biomass increased. However, it started to decline after a level of N input that coincided with the attainment of a neutral N balance (N inputs equal N offtake in grain, denitrification and leaching). Neutral N balance was reached at fertilizer rates of approximately 50 kg N ha−1 at Mildura, 75 kg N ha−1 at Birchip and 200 kg N ha−1 per year at Lake Bolac and Longerenong. This was associated with a decline in C:N ratios of stubble once N inputs exceeded outputs (data not shown). Where residues were removed, N immobilization increased with increasing N rates, but at a much lower level than seen when stubble was retained.
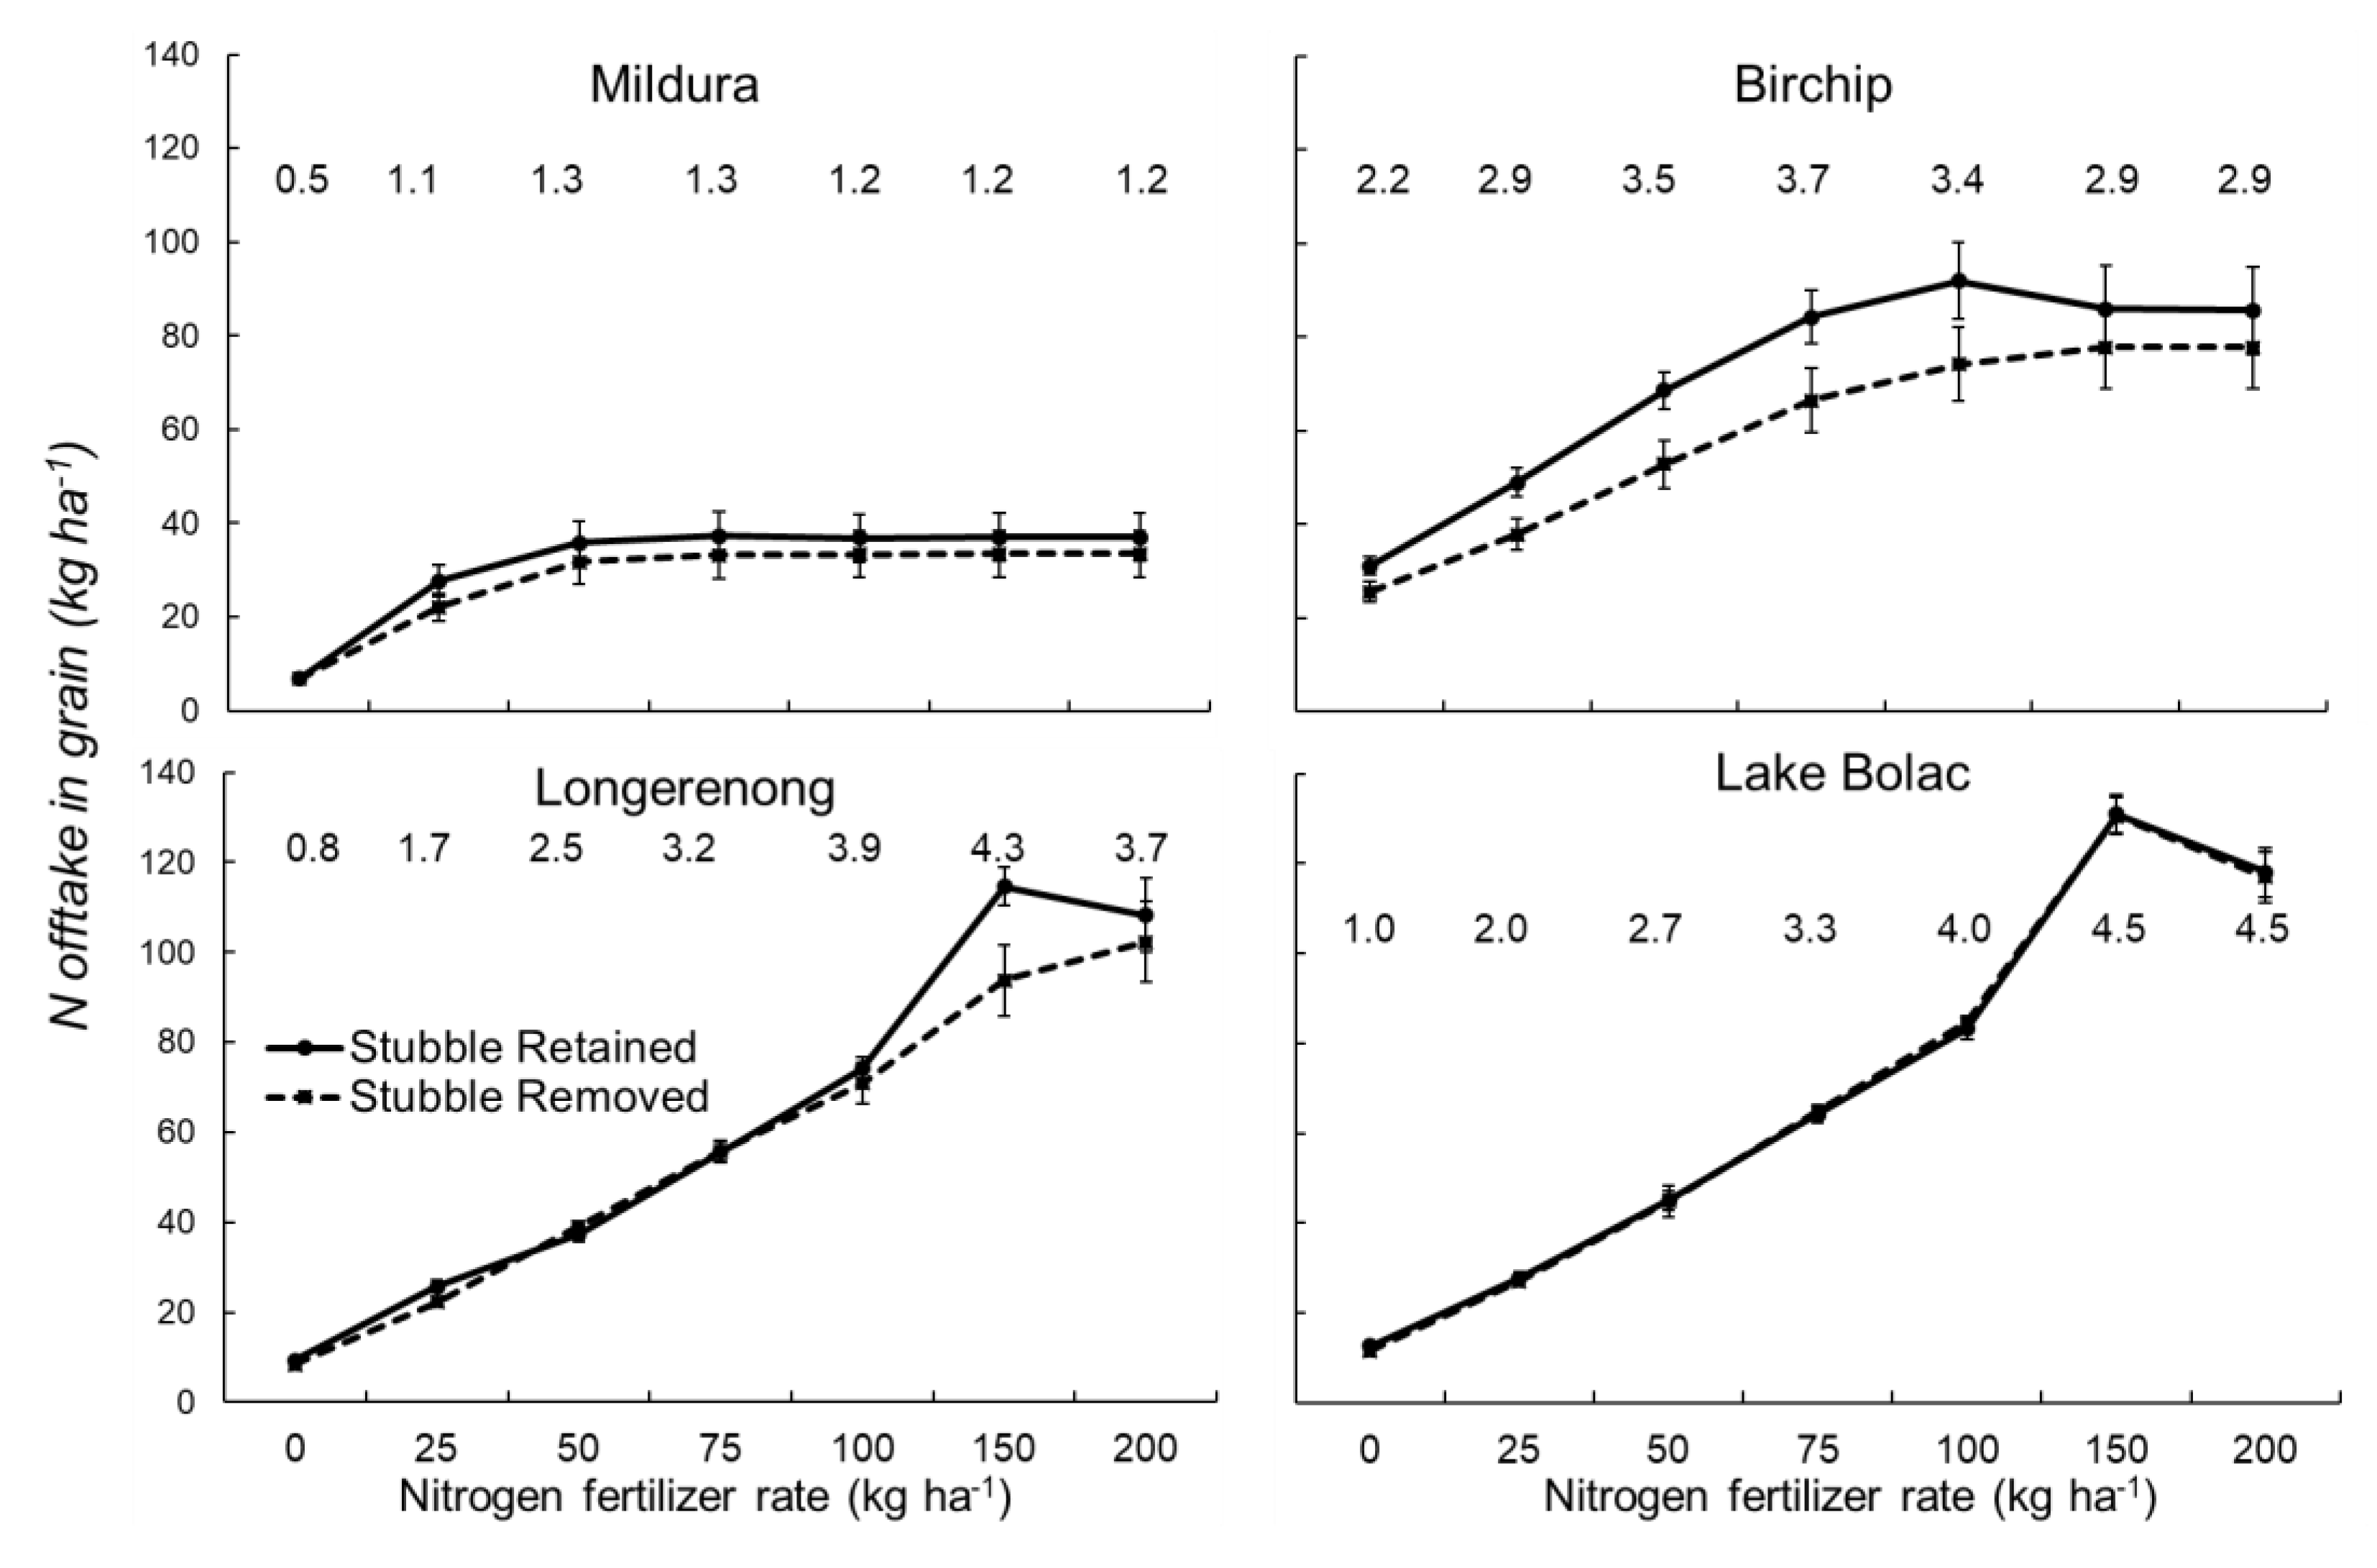
3.3. N Offtake in Grain
Grain N offtake increased with increasing N fertilizer rate to 50 kg ha−1 at Mildura, 100 kg ha−1 at Birchip and 150 kg ha−1 at the other two sites (Figure 5). These thresholds generally corresponded to the maximum grain yield at each site. Compared to other sites, Mildura had the lowest grain N offtake, reflecting the lower yield. Stubble retention did not significantly influence grain N offtake except at Birchip where grain N offtake was generally higher in the stubble retained than removed treatment. At all sites, seasonal variation in grain offtake increased (wider standard error bars) with increasing N rates as yields approach water-limited potential and climate-induced variability in yield is expressed.
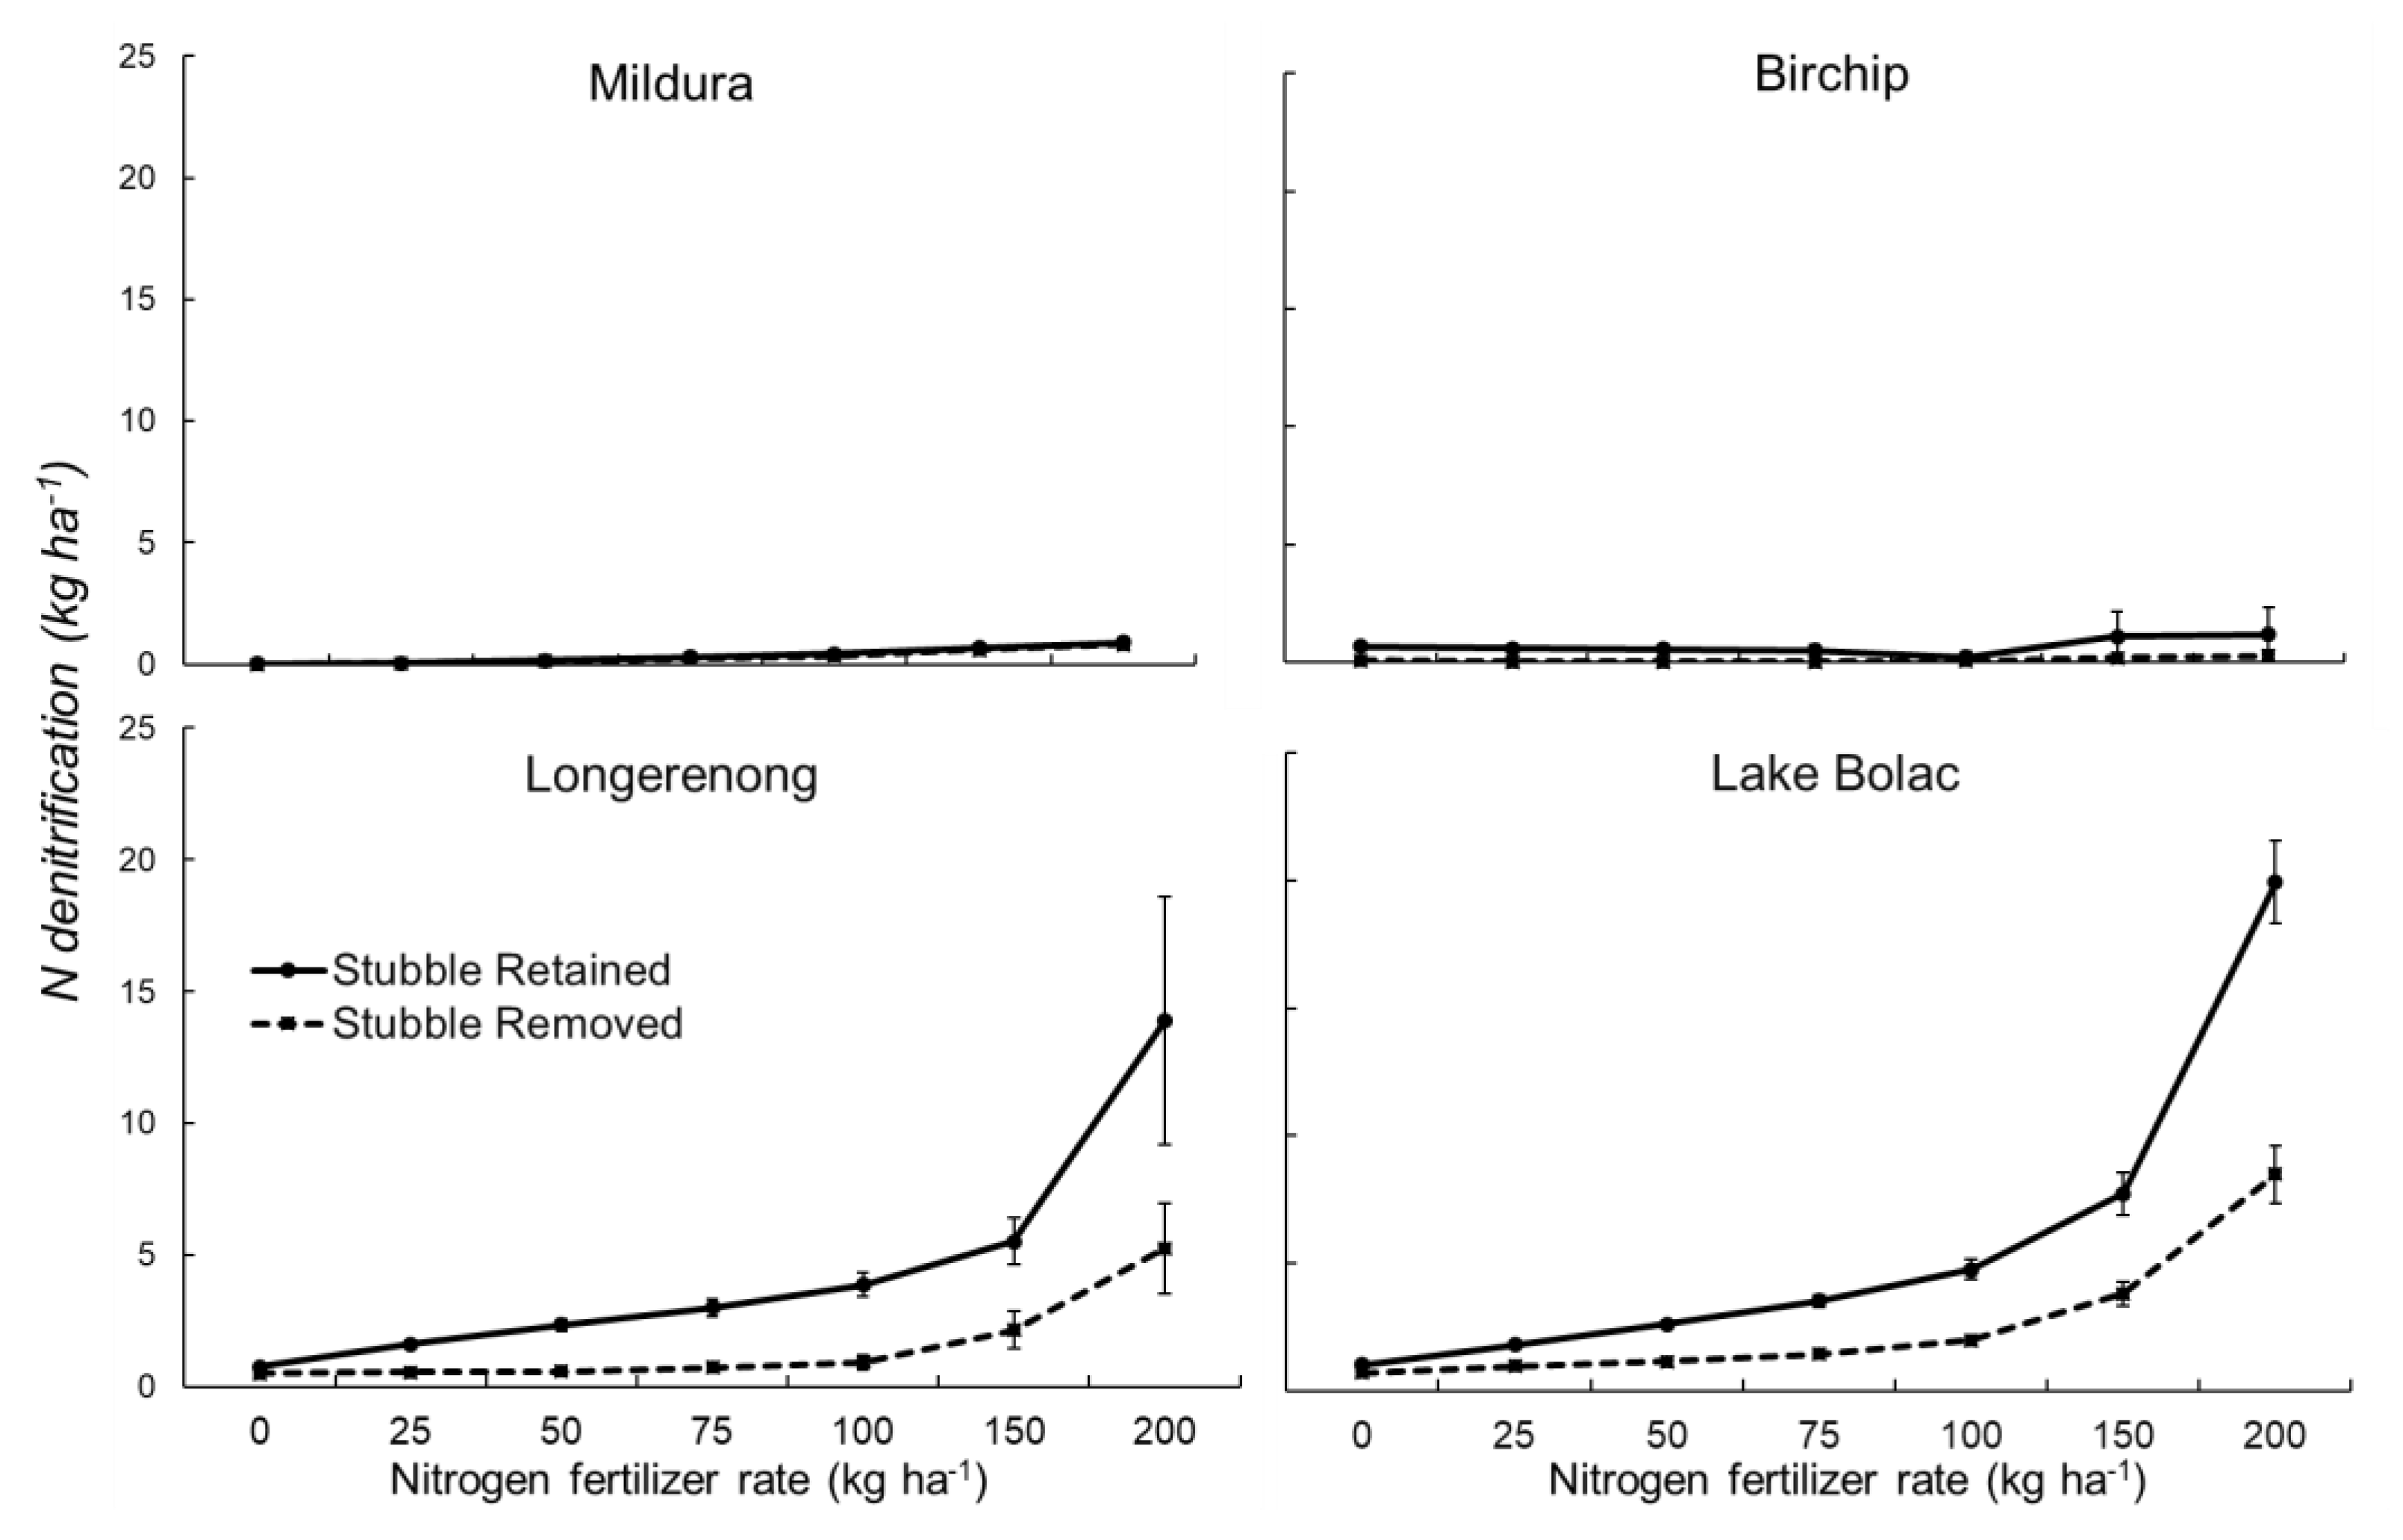
3.4. Denitrification
Annual denitrification generally increased with increasing N rate (Figure 6). At the lower rainfall sites of Mildura and Birchip, annual denitrification was insignificant (below 2 kg ha−1) for both retained and removed stubble systems at all N rates. At the higher rainfall sites of Longerenong and Lake Bolac, denitrification became appreciable at higher N rates and was higher in the stubble retained than removed treatments.
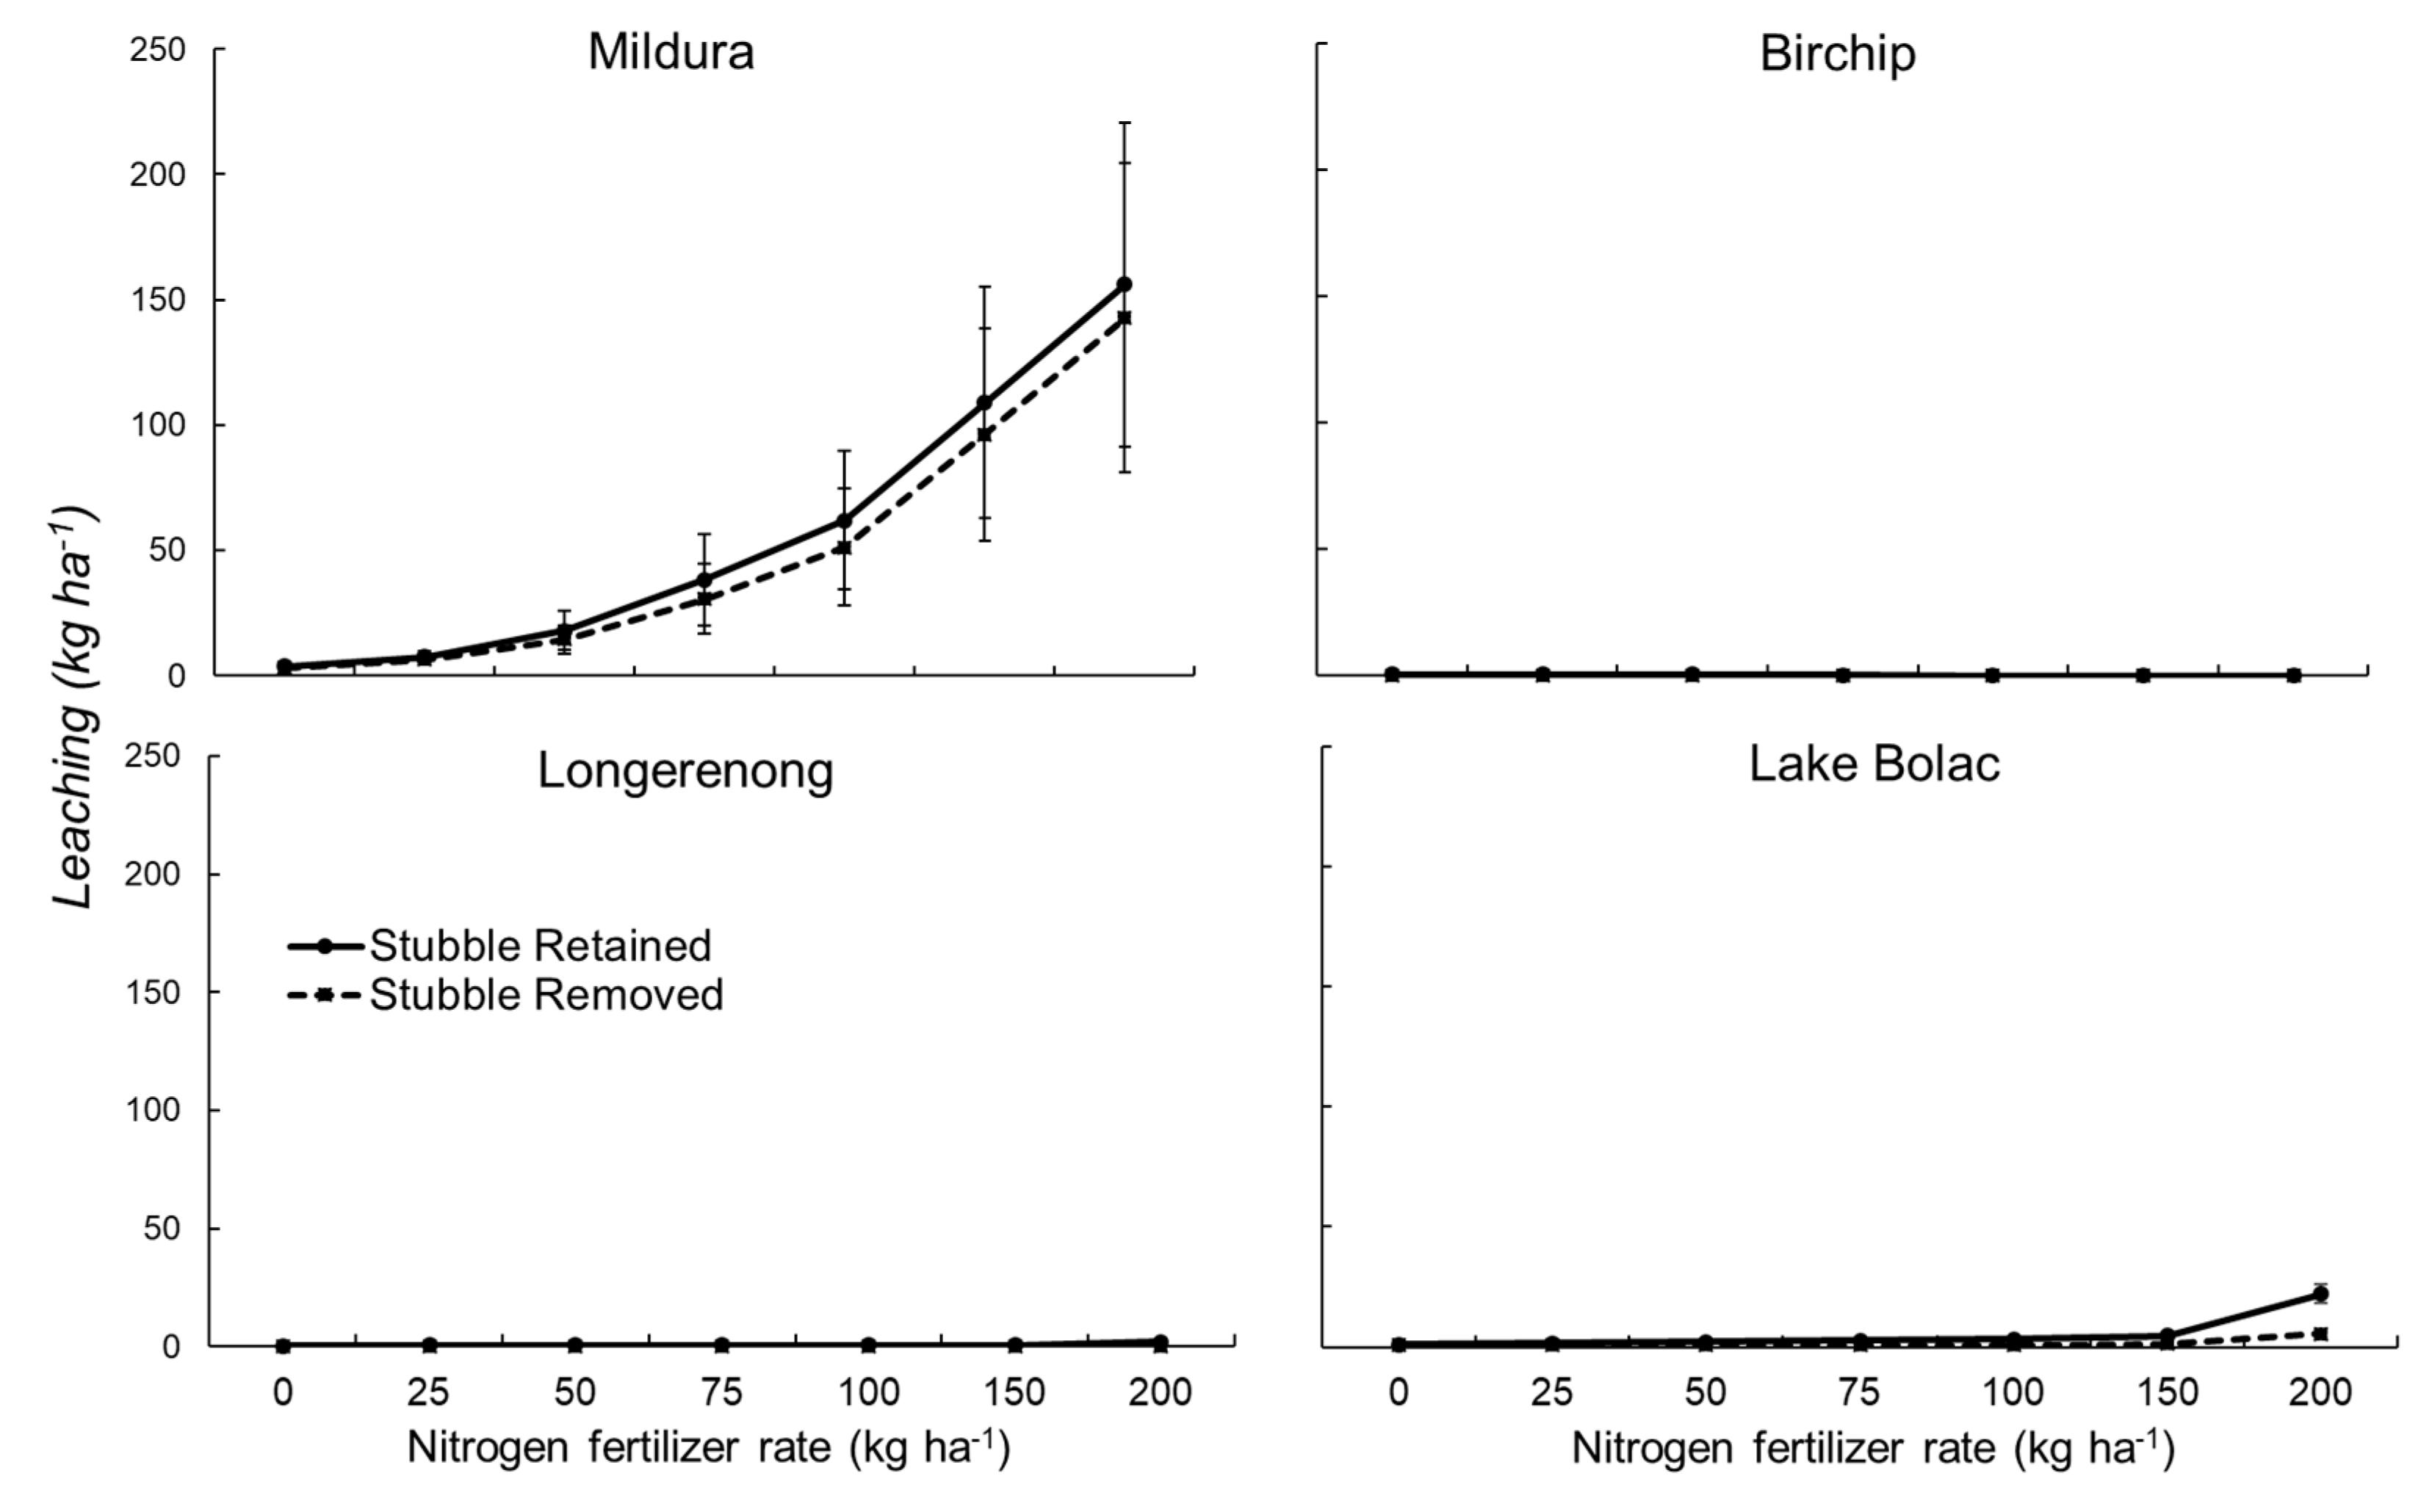
3.5. Nitrate Leaching
There was no difference in nitrate leaching between stubble retained and removed treatments at any site (Figure 7). Although rainfall at Mildura was very low, leaching loss was the highest at this site compared to other sites. This was due to low water-limited yield at this site and thus low offtake of N in grain which resulted in large amounts of mineral N (mainly nitrate, data not shown) accumulating in the soil (Figure 2). This nitrate was susceptible to leaching during episodic events of high soil moisture, exacerbated by the sandy and thus low plant-available water capacity soil at this site (Table 1).
3.6. N Remaining in Crop Residues
The four sites displayed different patterns of N remaining in crop residues in response to N fertilizer rates (Figure 8), which are only shown for the removed stubble treatment. No increase in residue N was observed with N rates larger than 75 kg N ha−1 at Mildura and 150 kg N ha−1 at Birchip. Residue N continued to respond positively up to the highest rate at Longerenong and Lake Bolac where water supply was not as limiting to plant growth. In the case of the stubble removed treatment, N content of crop residues quantifies the permanent loss of N from the soil-plant system due to the removal of crop residues, whereas in stubble-retained treatments, N in residues remains indirectly available to future crops through mineralization (data not shown).
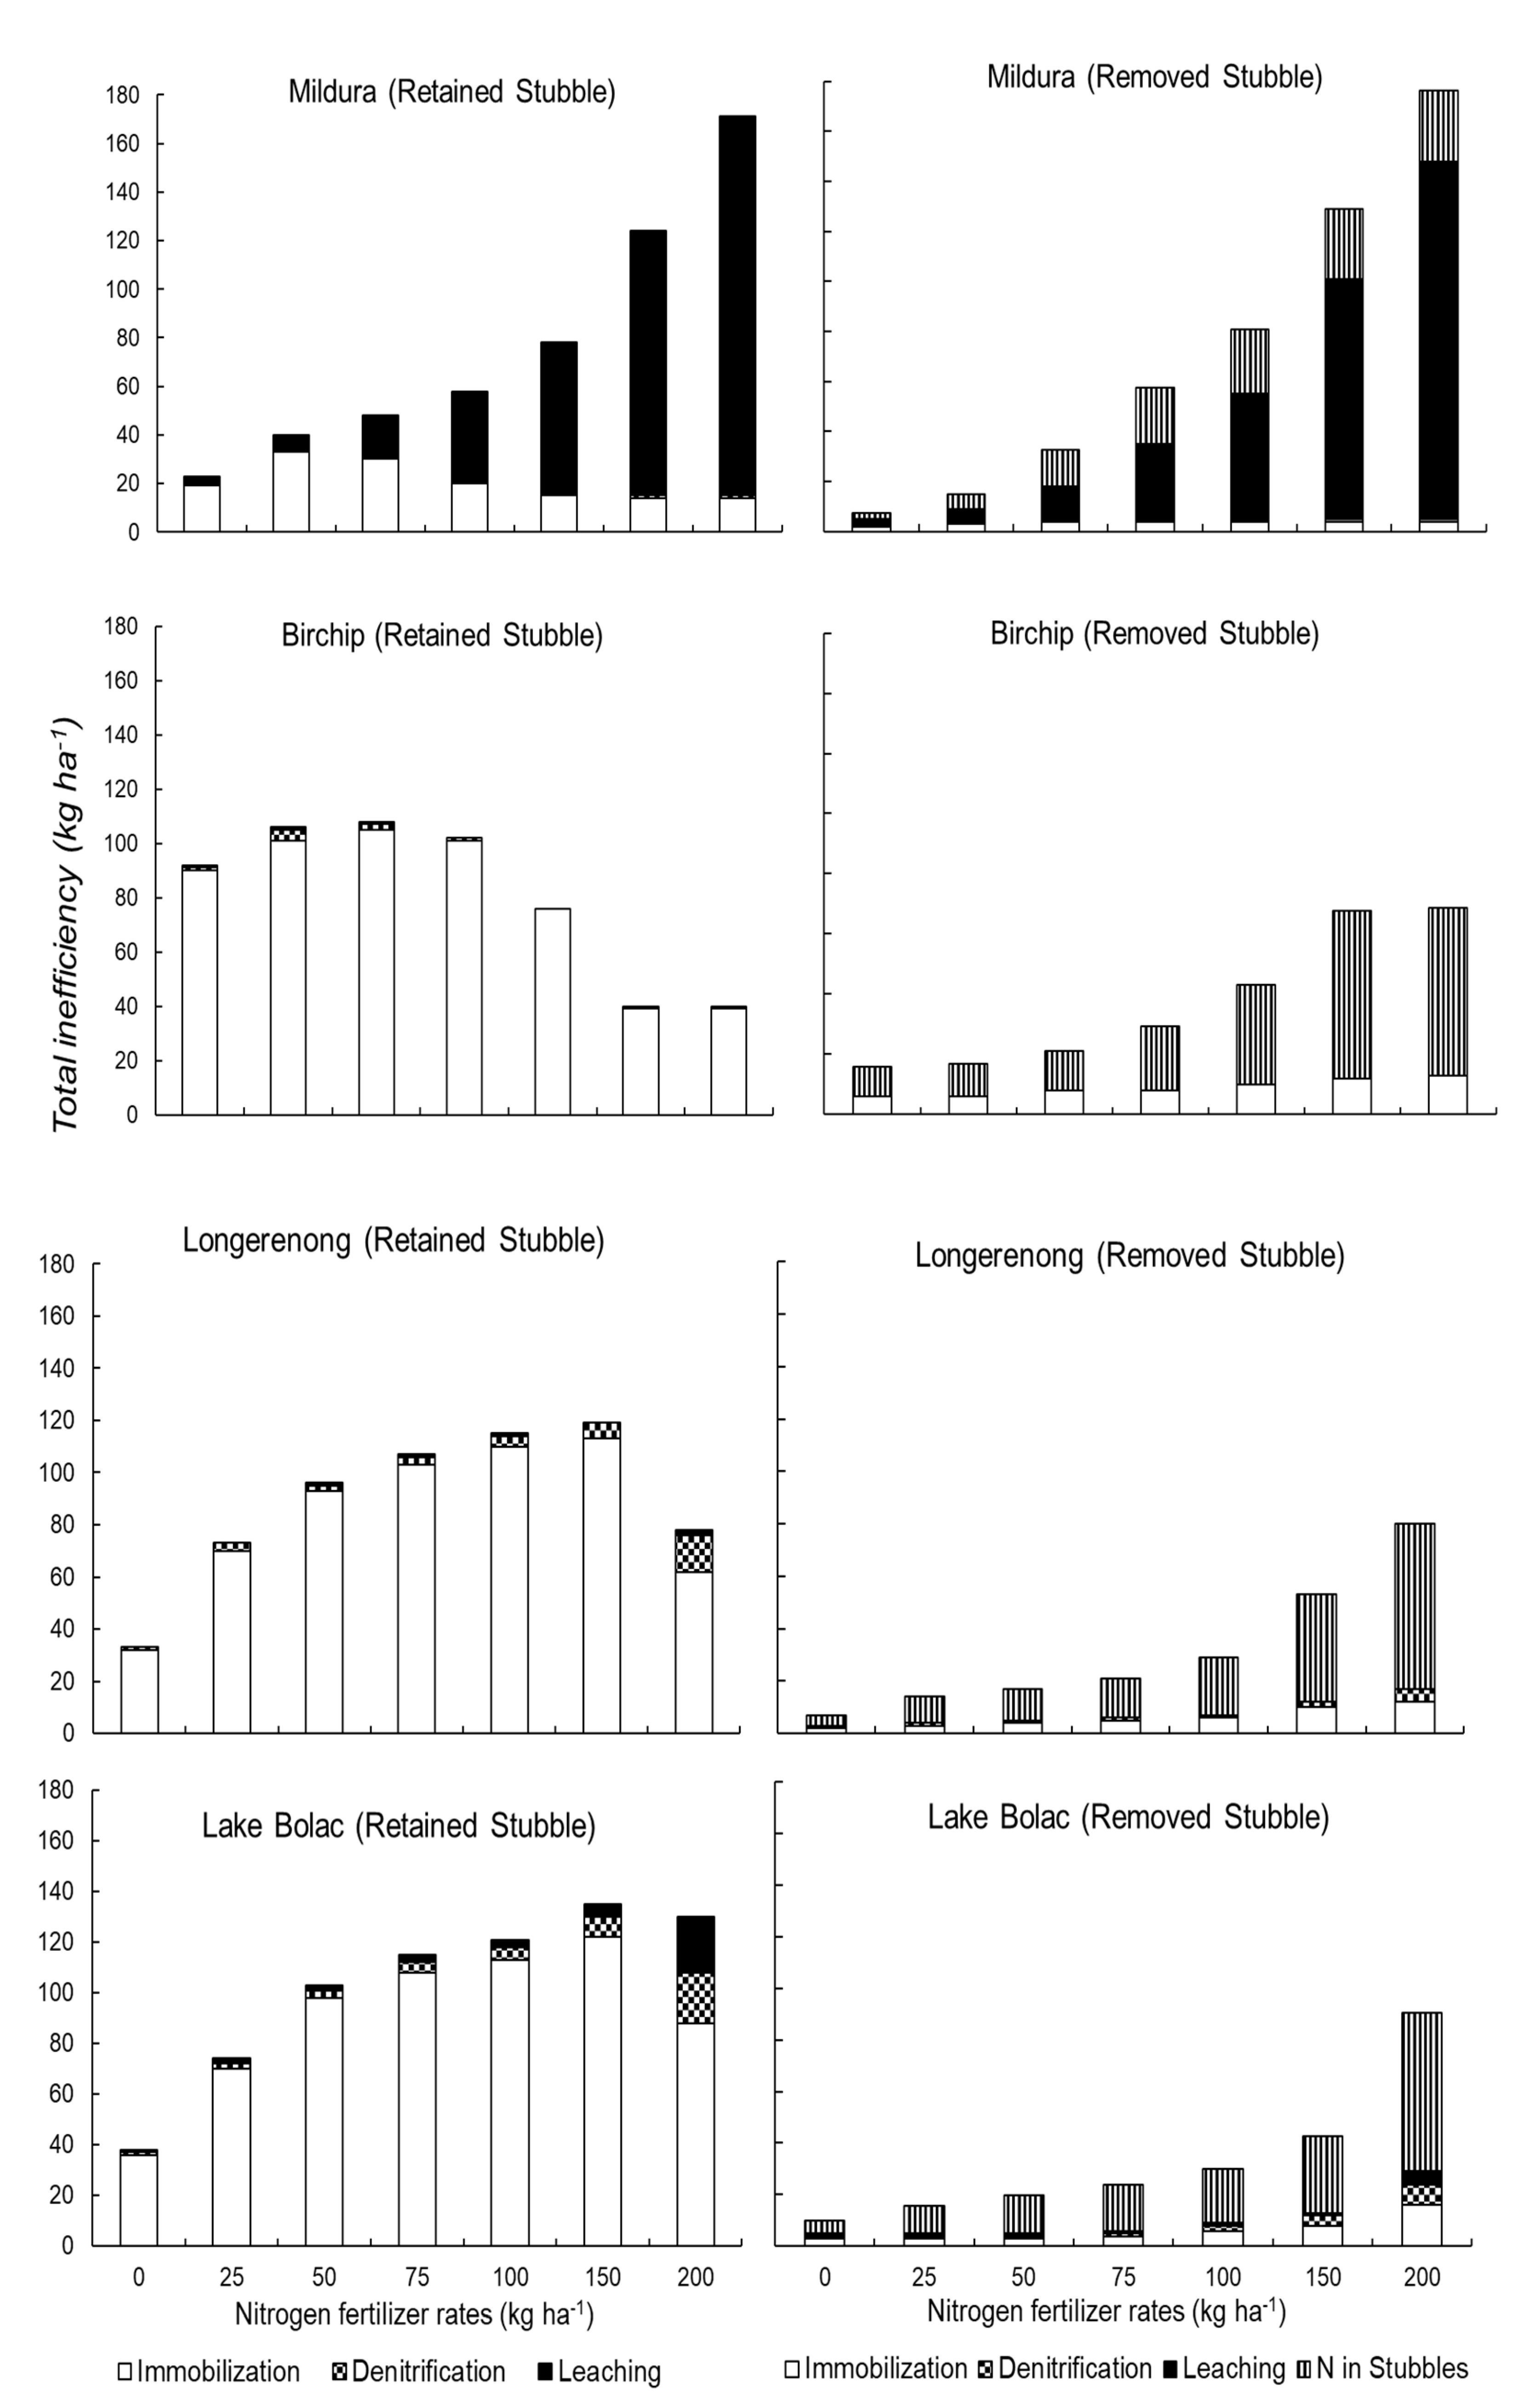
3.7. Total N-Inefficiency in Residue Retained and Removed Systems
Figure 8 shows the relative magnitudes of all sources of inefficiency in both residues retained and removed treatments at four simulation sites. Nitrogen immobilization was the largest source of inefficiency at all sites when stubble was retained except Mildura, where nitrate leaching was the largest source of inefficiency in both retained and removed stubble systems. Residue removal was the greatest source of N loss in stubble-removed systems at Birchip, Longerenong and Lake Bolac at all N rates.
4. Discussion
This study provides new insights relating to sources of N inefficiency in semi-arid cropping systems with retained residues. Crop N balance was changed substantially by both stubble and N treatments but the nature of this change was different in each rainfall x soil type environment. The greatest source of N inefficiency in stubble retained treatments was immobilization at most N rates and simulated sites.
Immobilization does not represent a complete loss of N from the soil-plant system, as opposed to leaching and denitrification. It is also the counterpoint of mineralization and our results show that treatments with higher levels of immobilization also have higher levels of mineralization (Figure 3 and Figure 4). However, it is the temporal dynamics of immobilization combined with seasonal patterns of crop growth that can make it detrimental from a production perspective and a considerable source of inefficiency [40].
Given that N immobilization is the biggest source of inefficiency in semi-arid cereal cropping systems with retained stubble, fertilizer NUE will be increased by management strategies that reduce immobilization. This could be achieved via improved synchronization of N availability with crop N demand through a combination of N fertilizer placement and timing of application. The risk of losing N when fertilizer is all applied at sowing is high due to low crop N uptake during the early stages of growth. Nitrate from fertilizer applied during this time is vulnerable to loss by leaching, denitrification and particularly immobilization [19].
During vegetative growth, crop plants are not large enough to compete with microbial immobilizers and most N immobilization occurs at this stage [41]. Immobilization and other losses may be reduced by deferring N fertilizer applications to coincide with the period of rapid crop uptake, the beginning of which coincides with the start of stem elongation. Field experiments have shown that, in environments similar to Lake Bolac [42] and Longerenong [43], deferring N application to early stem elongation could increase plant recovery of 15N-labelled fertilizer in comparison to applications at sowing, assumed to be due to a reduction in losses. Immobilization of N fertilizer is greatest during early growth and crops use N most efficiently when N is applied at stem elongation [44,45,46,47].
The placement of fertilizer N below the surface layer of soil and away from residues with a high C:N ratio can also increase N availability and plant uptake by decreasing immobilization [48]. Banding N fertilizer can also provide greater NUE than broadcasting by reducing N losses from volatilization and holding N as ammonium for longer, which reduces losses from leaching and denitrification [49]. Deep banding allows crops to recover more fertilizer N than broadcasting, particularly under early-season drought when deep placed N is more accessible to plants [50,51,52]. There is currently little adoption of mid-row banding in western Victoria and this practice has the potential to improve NUE in the region [53].
There is also evidence that grain crop species differ in their ability to compete with microbes for soil N. For instance, levels of soil mineral N are significantly higher after canola in comparison to cereals [54] and one of the reasons for this is reduced microbial immobilization of N [55]. Microbial populations in the canola rhizosphere are relatively low, resulting in less N immobilization in comparison to continuous wheat [56]. Growers in semi-arid environments could reduce immobilization by growing more N-competitive species, such as canola, in situations where immobilization is likely to be high e.g., following high yielding cereal crops with large stubble loads.
The low levels of loss due to leaching and denitrification across all environments at rates of fertilizer likely to be used by growers (<50 kg N ha−1 in the case of Mildura) found in this study are consistent with other experimental and simulation findings across similar rainfall gradients [33,42,43]. The higher denitrification in the stubble-retained treatments reflects that the denitrification rate generally increases when more C is available [57]. Crop residues also increase the supply of energy available to denitrifying organisms which stimulates denitrification in a stubble-retained system under anerobic conditions [58]. Higher denitrification at Longerenong and Lake Bolac is due to a combination of climate and soil factors. Soils with high clay content and low porosity are prone to waterlogging and therefore anaerobic conditions [59]. Soil surface textures were sand and sandy clay loam at Mildura and Birchip, respectively, and clay and clay loam at Longerenong and Lake Bolac. Denitrification was not induced by higher soil nitrate concentration at Mildura and Birchip, suggesting that these environments have inherently low denitrification. Leaching losses increased rapidly with increasing N rate at Mildura. The potential of N loss through leaching increases when nitrate accumulates, as happened at this site due to lower offtake in grain. Furthermore, this site has sandy soil with a low water-holding capacity (Table 1) which increases susceptibility to leaching [60,61]. However, at levels of N fertilization likely to be used by growers in this environment (<50 kg N ha−1), N losses due to leaching were modest.
5. Conclusions
This study has shown that N fertilization and retention of stubble significantly affects N dynamics of crop production systems in the southeast of Australia. Our results suggest that immobilization of fertilizer N is by far the largest source of N inefficiency in stubble-retained cropping systems in Victoria at levels of N input currently used by farmers. Losses of leaching and denitrification tend to be low but vary with the site. At the lower-yielding site of Mildura, which had a sandy soil with low plant-available water capacity, losses of N were observed at high fertiliser rates due to leaching, caused by increased accumulation of soil nitrate due to the low offtake of N in grain. Denitrification became appreciable at higher rainfall sites with heavier textured soils when stubble was retained and N applications increased. Management strategies that seek to reduce immobilization of fertilizer N (e.g., deferred N applications and mid-row banding) should be experimentally evaluated for their capacity to increase NUE and their suitability for on-farm adoption.
Author Contributions
Conceptualization, N.N. and J.H.; methodology, N.N., J.H. and D.C.; formal analysis, N.N.; investigation, N.N.; data curation, N.N.; writing—original draft preparation, N.N.; writing—review and editing, D.C., J.H and C.T.; visualization, N.N, J.H, C.T.; supervision, J.H. and C.T.; funding acquisition, J.H. All authors have read and agreed to the published version of the manuscript.
Funding
This research was funded by La Trobe University through its graduate research program.
Institutional Review Board Statement
Not applicable.
Informed Consent Statement
Not applicable.
Acknowledgments
The authors would like to thank John Webb and Fiona Glover (La Trobe University) for providing the Victoria boundary for use in Figure 1 and John Kirkegaard (CSIRO) for providing comments on an early version of the manuscript.
Conflicts of Interest
The authors declare no conflict of interest.
References
- Fischer, R.; Connor, D. Issues for cropping and agricultural science in the next 20 years. Field Crop. Res. 2018, 222, 121–142. [Google Scholar] [CrossRef]
- Tilman, D. Global environmental impacts of agricultural expansion: The need for sustainable and efficient practices. Proc. Natl. Acad. Sci. USA 1999, 96, 5995–6000. [Google Scholar] [CrossRef] [Green Version]
- Lemaire, G.; de Faccio Carvalho, P.C.; Kronberg, S.; Recous, S. C-N-P decoupling processes linked to arable cropping management system in relation with intensification of production. In Agroecosystem Diversity: Reconciling Contemporary Agriculture and Environmental Quality; Maragioglio, N., Ed.; Academic Press: Cambridge, MA, USA, 2018; pp. 35–49. [Google Scholar]
- Hochman, Z.; Horan, H. Causes of wheat yield gaps and opportunities to advance the water-limited yield frontier in Australia. Field Crop. Res. 2018, 228, 20–30. [Google Scholar] [CrossRef]
- Good, A.G.; Shrawat, A.K.; Muench, D.G. Can less yield more? Is reducing nutrient input into the environment compatible with maintaining crop production? Trends Plant Sci. 2004, 9, 597–605. [Google Scholar] [CrossRef]
- Udvardi, M.; Below, F.E.; Castellano, M.J.; Eagle, A.J.; Giller, K.E.; Ladha, J.K.; Liu, X.; Maaz, T.M.; Nova-Franco, B.; Raghuram, N.; et al. A Research Road Map for Responsible Use of Agricultural Nitrogen. Front. Sustain. Food Syst. 2021, 5. [Google Scholar] [CrossRef]
- Turner, D.A.; Edis, R.E.; Chen, D.; Freney, J.R.; Denmead, O.T. Ammonia volatilization from nitrogen fertilizers applied to cereals in two cropping areas of southern Australia. Nutr. Cycl. Agroecosyst. 2012, 93, 113–126. [Google Scholar] [CrossRef]
- van Spanning, R.J.M.; Richardson, D.J.; Ferguson, S.J. Chapter 1—Introduction to the Biochemistry and Molecular Biology of Denitrification. In Biology of the Nitrogen Cycle; Bothe, H., Ferguson, S.J., Newton, W.E., Eds.; Elsevier: Amsterdam, The Netherlands, 2007; pp. 3–20. [Google Scholar]
- Aulakh, M.S.; Malhi, S.S. Interactions of nitrogen with other nutrients and water: Effect on crop yield and quality, nutrient use efficiency, carbon sequestration, and environmental pollution. Adv. Agron. 2005, 86, 341–409. [Google Scholar]
- Zagal, E.; Persson, J. Immobilization and remineralization of nitrate during glucose decomposition at four rates of nitrogen addition. Soil Biol. Biochem. 1994, 26, 1313–1321. [Google Scholar] [CrossRef]
- Moritsuka, N.; Yanai, J.; Mori, K.; Kosaki, T. Biotic and abiotic processes of nitrogen immobilization in the soil-residue interface. Soil Biol. Biochem. 2004, 36, 1141–1148. [Google Scholar] [CrossRef]
- Stanford, G.; Epstein, E. Nitrogen mineralization-water relations in soils. Soil Sci. Soc. Am. J. 1974, 38, 103–107. [Google Scholar] [CrossRef]
- Diacono, M.; Baldivieso-Freitas, P.; Serra, F.X.S. Nitrogen Utilization in a Cereal-Legume Rotation Managed with Sustainable Agricultural Practices. Agronomy 2019, 9, 113. [Google Scholar] [CrossRef] [Green Version]
- Christensen, B.T. Wheat and barley straw decomposition under field conditions: Effect of soil type and plant cover on weight loss, nitrogen and potassium content. Soil Biol. Biochem. 1985, 17, 691–697. [Google Scholar] [CrossRef]
- Kuzyakov, Y.; Xu, X. Competition between roots and microorganisms for nitrogen: Mechanisms and ecological relevance. New Phytol. 2013, 198, 656–669. [Google Scholar] [CrossRef]
- Kumar, K.; Goh, K.M. Crop residues and management practices: Effects on soil quality, soil nitrogen dynamics, crop yield and nitrogen recovery. Adv. Agron. 1999, 68, 197–319. [Google Scholar]
- Ichir, L.L.; Ismaili, M. Decomposition et dynamique de l’azote de residus de ble et impact sur les stades de croissance du ble. Comptes Rendus Biol. 2002, 325, 597–604. [Google Scholar] [CrossRef]
- Beri, V.; Sidhu, B.; Bahl, G.; Bhat, A. Nitrogen and phosphorus transformations as affected by crop residue management practices and their influence on crop yield. Soil Use Manag. 1995, 11, 51–54. [Google Scholar] [CrossRef]
- Angus, J.F.; Grace, P.R. Nitrogen balance in Australia and nitrogen use efficiency on Australian farms. Soil Res. 2017, 55, 435–450. [Google Scholar] [CrossRef]
- Janzen, H.H. The soil carbon dilemma: Shall we hoard it or use it? Soil Biol. Biochem. 2006, 38, 419–424. [Google Scholar] [CrossRef]
- Thomsen, I.K.; Christensen, B.T. Cropping system and residue management effects on nitrate leaching and crop yields. Agric. Ecosyst. Environ. 1998, 68, 73–84. [Google Scholar] [CrossRef]
- Kirkby, C.A.; Richardson, A.E.; Wade, L.J.; Passioura, J.B.; Batten, G.D.; Blanchard, C.; Kirkegaard, J.A. Nutrient availability limits carbon sequestration in arable soils. Soil Biol. Biochem. 2014, 68, 402–409. [Google Scholar] [CrossRef]
- Schjønning, P.; Jensen, J.L.; Bruun, S.; Christensen, B.T.; Munkholm, L.J.; Oelofse, M.; Baby, S.; Knudsen, L. Chapter Two—The Role of Soil Organic Matter for Maintaining Crop Yields: Evidence for a Renewed Conceptual Basis. Adv. Agron. 2018, 150, 35–79. [Google Scholar]
- Oldfield, E.E.; Wood, S.A.; Bradford, M.A. Direct evidence using a controlled greenhouse study for threshold effects of soil organic matter on crop growth. Ecol. Appl. 2020, 30, e02073. [Google Scholar] [CrossRef] [PubMed]
- Llewellyn, R.S.; D’Emden, F.H.; Kuehne, G. Extensive use of no-tillage in grain growing regions of Australia. Field Crop. Res. 2012, 132, 204–212. [Google Scholar] [CrossRef]
- Doran, J.W. Soil microbial and biochemical changes associated with reduced tillage. Soil Sci. Soc. Am. J. 1980, 44, 765–771. [Google Scholar] [CrossRef]
- Bacon, P.; Freney, J. Nitrogen loss from different tillage systems and the effect on cereal grain yield. Fertil. Res. 1989, 20, 59–66. [Google Scholar] [CrossRef]
- Cai, W.; Cowan, T.; Thatcher, M. Rainfall reductions over Southern Hemisphere semi-arid regions: The role of subtropical dry zone expansion. Sci. Rep. 2012, 2, 702. [Google Scholar] [CrossRef] [Green Version]
- Holzworth, D.P.; Huth, N.I.; deVoil, P.G.; Zurcher, E.J.; Herrmann, N.I.; McLean, G.; Chenu, K.; van Oosterom, E.J.; Snow, V.; Murphy, C.; et al. APSIM—Evolution towards a new generation of agricultural systems simulation. Environ. Model. Softw. 2014, 62, 327–350. [Google Scholar] [CrossRef]
- Meier, E.A.; Hunt, J.R.; Hochman, Z. Evaluation of nitrogen bank, a soil nitrogen management strategy for sustainably closing wheat yield gaps. Field Crop. Res. 2021, 261, 108017. [Google Scholar] [CrossRef]
- Asseng, S.; Keating, B.A.; Fillery, I.R.P.; Gregory, P.J.; Bowden, J.W.; Turner, N.C.; Palta, J.A.; Abrecht, D.G. Performance of the APSIM-wheat model in Western Australia. Field Crop. Res. 1998, 57, 163–179. [Google Scholar] [CrossRef]
- Probert, M.; Dimes, J.; Keating, B.; Dalal, R.; Strong, W. APSIM’s water and nitrogen modules and simulation of the dynamics of water and nitrogen in fallow systems. Agric. Syst. 1998, 56, 1–28. [Google Scholar] [CrossRef]
- Smith, C.J.; Hunt, J.R.; Wang, E.; Macdonald, B.C.T.; Xing, H.; Denmead, O.T.; Zeglin, S.; Zhao, Z. Using fertiliser to maintain soil inorganic nitrogen can increase dryland wheat yield with little environmental cost. Agric. Ecosyst. Environ. 2019, 286, 106644. [Google Scholar] [CrossRef]
- Mielenz, H.; Thorburn, P.J.; Harris, R.H.; Officer, S.J.; Li, G.; Schwenke, G.D.; Grace, P.R. Nitrous oxide emissions from grain production systems across a wide range of environmental conditions in eastern Australia. Soil Res. 2016, 54, 659–674. [Google Scholar] [CrossRef] [Green Version]
- Carberry, P.; Hochman, Z.; Hunt, J.; Dalgliesh, N.; McCown, R.; Whish, J.; Robertson, M.; Foale, M.; Poulton, P.; Van Rees, H. Re-inventing model-based decision support with Australian dryland farmers. 3. Relevance of APSIM to commercial crops. Crop Pasture Sci. 2009, 60, 1044–1056. [Google Scholar] [CrossRef] [Green Version]
- Hochman, Z.; Van Rees, H.; Carberry, P.; Hunt, J.; McCown, R.; Gartmann, A.; Holzworth, D.; Van Rees, S.; Dalgliesh, N.; Long, W. Re-inventing model-based decision support with Australian dryland farmers. 4. Yield Prophet® helps farmers monitor and manage crops in a variable climate. Crop Pasture Sci. 2009, 60, 1057–1070. [Google Scholar] [CrossRef] [Green Version]
- van Rees, H.; McClelland, T.; Hochman, Z.; Carberry, P.; Hunt, J.; Huth, N.; Holzworth, D. Leading farmers in South East Australia have closed the exploitable wheat yield gap: Prospects for further improvement. Field Crop. Res. 2014, 164, 1–11. [Google Scholar] [CrossRef]
- Sultan, B.; Guan, K.; Kouressy, M.; Biasutti, M.; Piani, C.; Hammer, G.; McLean, G.; Lobell, D.B. Robust features of future climate change impacts on sorghum yields in West Africa. Environ. Res. Lett. 2014, 9, 104006. [Google Scholar] [CrossRef]
- Lobb, D.; Jorgensen, S.; Fath, B. Soil movement by tillage and other agricultural practices. Ecol. Eng. 2008, 4, 3295–3303. [Google Scholar]
- Recous, S.; Robin, D.; Darwis, D.; Mary, B. Soil inorganic N availability: Effect on maize residue decomposition. Soil Biol. Biochem. 1995, 27, 1529–1538. [Google Scholar] [CrossRef]
- Barłóg, P.; Grzebisz, W. Effect of timing and nitrogen fertilizer application on winter oilseed rape (Brassica napus L.). II. Nitrogen uptake dynamics and fertilizer efficiency. J. Agron. Crop Sci. 2004, 190, 314–323. [Google Scholar] [CrossRef]
- Harris, R.H.; Armstrong, R.D.; Wallace, A.J.; Belyaeva, O.N. Effect of nitrogen fertiliser management on soil mineral nitrogen, nitrous oxide losses, yield and nitrogen uptake of wheat growing in waterlogging-prone soils of south-eastern Australia. Soil Res. 2016, 54, 619–633. [Google Scholar] [CrossRef] [Green Version]
- Wallace, A.J.; Armstrong, R.D.; Grace, P.R.; Scheer, C.; Partington, D.L. Nitrogen use efficiency of 15N urea applied to wheat based on fertiliser timing and use of inhibitors. Nutr. Cycl. Agroecosyst. 2020, 116, 41–56. [Google Scholar] [CrossRef] [Green Version]
- Blankenau, K.; Olfs, H.-W.; Kuhlmann, H. Effect of microbial nitrogen immobilization during the growth period on the availability of nitrogen fertilizer for winter cereals. Biol. Fertil. Soils 2000, 32, 157–165. [Google Scholar] [CrossRef]
- Tran, T.S.; Tremblay, G. Recovery of 15N-labeled fertilizer by spring bread wheat at different N rates and application times. Can. J. Soil Sci. 2000, 80, 533–539. [Google Scholar] [CrossRef] [Green Version]
- Sowers, K.E.; Pan, W.L.; Miller, B.C.; Smith, J.L. Nitrogen Use Efficiency of Split Nitrogen Applications in Soft White Winter Wheat. Agron. J. 1994, 86, 942–948. [Google Scholar] [CrossRef]
- López-Bellido, L.; López-Bellido, R.J.; Redondo, R. Nitrogen efficiency in wheat under rainfed Mediterranean conditions as affected by split nitrogen application. Field Crop. Res. 2005, 94, 86–97. [Google Scholar] [CrossRef]
- Sharpe, R.; Harper, L.; Giddens, J.; Langdale, G. Nitrogen use efficiency and nitrogen budget for conservation tilled wheat. Soil Sci. Soc. Am. J. 1988, 52, 1394–1398. [Google Scholar] [CrossRef]
- Lemke, R.; Mooleki, S.; Malhi, S.; Lafond, G.; Brandt, S.; Shoenau, J.; Wang, H.; Thavarajah, D.; Hultgreen, G.; May, W. Effect of fertilizer nitrogen management and phosphorus placement on canola production under varied conditions in Saskatchewan. Can. J. Plant Sci. 2009, 89, 29–48. [Google Scholar] [CrossRef]
- Malhi, S.; Nyborg, M. Methods of placement for increasing the efficiency of N fertilizers applied in the fall 1. Agron. J. 1985, 77, 27–32. [Google Scholar] [CrossRef]
- Hartman, M.; Nyborg, M. Effect of early growing season moisture stress on barley utilization of broadcast-incorporated and deep-banded urea. Can. J. Soil Sci. 1989, 69, 381–389. [Google Scholar] [CrossRef]
- Rao, S.C.; Dao, T.H. Nitrogen placement and tillage effects on dry matter and nitrogen accumulation and redistribution in winter wheat. Agron. J. 1996, 88, 365–371. [Google Scholar] [CrossRef]
- Wallace, A.J.; Nuttall, J.; Henry, F.; Clarke, G.; Marsh, J. Mid-Row Banding Nitrogen Fertiliser in-Season: Improving Nitrogen Use Efficiency of Cropping Systems of Southern Australia; Victorian Department of Agriculture: Melbourne, Australia, 2017. [Google Scholar]
- Ryan, M.H.; Kirkegaard, J.A.; Angus, J.F. Brassica crops stimulate soil mineral N accumulation. Soil Res. 2006, 44, 367–377. [Google Scholar] [CrossRef]
- Brown, P.D.; Morra, M.J. Brassicaceae tissues as inhibitors of nitrification in soil. J. Agric. Food Chem. 2009, 57, 7706–7711. [Google Scholar] [CrossRef]
- McKenzie, R.; Dormaar, J.; Schaalje, G.; Stewart, J. Chemical and biochemical changes in the rhizospheres of wheat and canola. Can. J. Soil Sci. 1995, 75, 439–447. [Google Scholar] [CrossRef]
- Lalisse-Grundmann, G.; Brunel, B.; Chalamet, A. Denitrification in a cultivated soil: Optimal glucose and nitrate concentrations. Soil Biol. Biochem. 1988, 20, 839–844. [Google Scholar] [CrossRef]
- Aulakh, M.; Rennie, D.; Paul, E.A. The Influence of Plant Residues on Denitrification Rates in Conventional and Zero Tilled Soils 1. Soil Sci. Soc. Am. J. 1984, 48, 790–794. [Google Scholar] [CrossRef] [Green Version]
- Palta, M.M.; Ehrenfeld, J.G.; Groffman, P.M. “Hotspots” and “hot moments” of denitrification in urban brownfield wetlands. Ecosystems 2014, 17, 1121–1137. [Google Scholar] [CrossRef]
- Shepherd, M.A.; Bennett, G. Nutrient leaching losses from a sandy soil in lysimeters. Commun. Soil Sci. Plant Anal. 1998, 29, 931–946. [Google Scholar] [CrossRef]
- Asseng, S.; Milroy, S.P.; Poole, M.L. Systems analysis of wheat production on low water-holding soils in a Mediterranean-type environment I. Yield potential and quality. Field Crop. Res. 2008, 105, 97–106. [Google Scholar] [CrossRef]
Figure 1.
The location of simulated sites in Victoria, Australia.

Figure 2.
Effects of N application rate and stubble retention (retained vs. removed) on the mean (1990–2016) mineral N at sowing in the soil profile (0–130 cm) at four sites. Error bars represent ± standard error of the mean of the years of the simulation.
Figure 2.
Effects of N application rate and stubble retention (retained vs. removed) on the mean (1990–2016) mineral N at sowing in the soil profile (0–130 cm) at four sites. Error bars represent ± standard error of the mean of the years of the simulation.

Figure 3.
Effects of N application rate and stubble retention (retained vs. removed) on mean (1990–2016) net in-crop N mineralization. Error bars represent ± standard error of the mean over the years of the simulation.
Figure 3.
Effects of N application rate and stubble retention (retained vs. removed) on mean (1990–2016) net in-crop N mineralization. Error bars represent ± standard error of the mean over the years of the simulation.

Figure 4.
Effects of N application rate and stubble retention (retained vs. removed) on the mean (1990–2016) annual N immobilization at four field sites to 130 cm depth. Error bars represent ± standard error of the mean over the years of the simulation. Numbers at the top of the graphs are the N balance (fertilizer input minus offtake in grain, leaching and denitrification) in kg ha−1 of the retained treatment.

Figure 5.
Effects of N application rate and stubble retention (retained vs. removed) on the mean (1990–2016) N offtake in grain at four field sites. Error bars represent ± standard error of the mean over the years of the simulation. Numbers at the top of the graphs are the average grain yield (t/ha) of the retained treatment.

Figure 6.
Effects of N application rate and stubble retention (retained vs. removed) on mean (1990–2016) annual denitrification at four field sites. Error bars represent ± standard error of the mean over the years of the simulation.
Figure 6.
Effects of N application rate and stubble retention (retained vs. removed) on mean (1990–2016) annual denitrification at four field sites. Error bars represent ± standard error of the mean over the years of the simulation.

Figure 7.
Effects of N application rate and stubble retention (retained vs. removed) on the mean (1990–2016) N leaching at four field sites. Error bars represent ± standard error of the mean over the years of the simulation.
Figure 7.
Effects of N application rate and stubble retention (retained vs. removed) on the mean (1990–2016) N leaching at four field sites. Error bars represent ± standard error of the mean over the years of the simulation.

Figure 8.
Total N inefficiency sources at different N rates with retained and removed stubble.


Table 1.
Details of meteorological stations and soil types used at each site for the period of 1990–2017.
Table 1.
Details of meteorological stations and soil types used at each site for the period of 1990–2017.
| Sites | Station Number | Station Name | Latitude | Longitude | Average Annual Rainfall (mm) | Average Minimum Temperature (°C) | Average Maximum Temperature (°C) | APSoil Number * | Plant Available Water (PAW) Capacity | Organic Carbon (OC) % (0–10 cm) |
|---|---|---|---|---|---|---|---|---|---|---|
| Mildura | 076031 | Mildura Airport | 34.24° S | 142.09° E | 283 | 11.0 | 24.6 | 1097 | 68 | 0.41 |
| Birchip | 077088 | Birchip Cropping Group | 35.99° S | 142.92° E | 325 | 8.6 | 30.3 | 573 | 255 | 1.5 |
| Longerenong | 079028 | Longerenong | 36.67° S | 142.30° E | 384 | 7.8 | 21.6 | 1008 | 348 | 1.3 |
| Lake Bolac | 089016 | Lake Bolac (Post office) | 37.71° S | 142.84° E | 547 | 7.7 | 20.2 | 914 | 163 | 0.65 |
* A full list of soil properties is available for corresponding APSoil numbers at https://www.apsim.info/apsim-model/apsoil/ (accessed on 7 June 2021).
Table 2.
Output variables from APSIM and the seasonal timing at which they were obtained or the period of calculation. All soil variables are summed over the maximum rooting depth of the soil (1.3 m).
Table 2.
Output variables from APSIM and the seasonal timing at which they were obtained or the period of calculation. All soil variables are summed over the maximum rooting depth of the soil (1.3 m).
| Output Variable | APSIM Output Terms | Period of Calculation |
|---|---|---|
| Mineral N (kg ha−1) | nh4() + no3() | Instantaneous (sowing) |
| Net mineralization (kg ha−1) | annual_min + dlt_n_min_res | Annually and from sowing to harvest (in-crop) |
| N offtake in grain (kg ha−1) | grain_n | Instantaneous (harvest) |
| N remaining in Residues (kg ha−1) | N_uptake_stover | Instantaneous (harvest) |
| N immobilization (kg ha−1) | annual_n_min_res | Annually |
| Denitrification (kg ha−1) | annual_no3_dnit | Annually |
| N leaching (kg ha−1) | annual_leach_no3 | Annually |
Publisher’s Note: MDPI stays neutral with regard to jurisdictional claims in published maps and institutional affiliations. |
© 2021 by the authors. Licensee MDPI, Basel, Switzerland. This article is an open access article distributed under the terms and conditions of the Creative Commons Attribution (CC BY) license (https://creativecommons.org/licenses/by/4.0/).
Share and Cite
MDPI and ACS Style
Nasrollahi, N.; Hunt, J.; Tang, C.; Cann, D. Modelled Quantification of Different Sources of Nitrogen Inefficiency in Semi-Arid Cropping Systems. Agronomy 2021, 11, 1222. https://doi.org/10.3390/agronomy11061222
AMA Style
Nasrollahi N, Hunt J, Tang C, Cann D. Modelled Quantification of Different Sources of Nitrogen Inefficiency in Semi-Arid Cropping Systems. Agronomy. 2021; 11(6):1222. https://doi.org/10.3390/agronomy11061222
Chicago/Turabian StyleNasrollahi, Niloufar, James Hunt, Caixian Tang, and David Cann. 2021. "Modelled Quantification of Different Sources of Nitrogen Inefficiency in Semi-Arid Cropping Systems" Agronomy 11, no. 6: 1222. https://doi.org/10.3390/agronomy11061222
Note that from the first issue of 2016, this journal uses article numbers instead of page numbers. See further details here.