Analysis and Forecast of the Number of Deaths, Recovered Cases, and Confirmed Cases From COVID-19 for the Top Four Affected Countries Using Kalman Filter
 Abdullah Ali H. Ahmadini1
  Muhammad Naeem2,3
  Muhammad Aamir2* Raimi Dewan4,5 Shokrya Saleh A. Alshqaq1 Wali Khan Mashwani3
- 1Department of Mathematics, College of Science, Jazan University, Jazan, Saudi Arabia
- 2Department of Statistics, Abdul Wali Khan University Mardan, Mardan, Pakistan
- 3Institute of Numerical Sciences, Kohat University of Science and Technology, Kohat, Pakistan
- 4Institute of Electronics and Telecommunications of Rennes, University of Rennes 1, Rennes, France
- 5School of Biomedical Engineering and Health Sciences, Universiti Teknologi Malaysia, Johor Bahru, Malaysia
COVID-19 is a virus that spread globally, causing severe health complications and substantial economic impact in various parts of the world. The COVID-19 forecast on infections is significant and crucial information that will help in executing policies and effectively reducing the daily cases. Filtering techniques are important ways to model dynamic structures because they provide good valuations over the recursive Bayesian updates. Kalman filters, one of the filtering techniques, are useful in the studying of contagious infections. Kalman filter algorithm performs an important role in the development of actual and comprehensive approaches to inhibit, learn, react, and reduce spreadable disorder outbreaks in people. The purpose of this paper is to forecast COVID-19 infections using the Kalman filter method. The Kalman filter (KF) was applied for the four most affected countries, namely the United States, India, Brazil, and Russia. Based on the results obtained, the KF method is capable of keeping track of the real COVID-19 data in nearly all scenarios. Kalman filters in the archetype background implement and produce decent COVID-19 predictions. The results of the KF method support the decision-making process for short-term strategies in handling the COVID-19 outbreak.
Introduction
The new disease COVID-19 case was first reported in Wuhan, China. COVID-19 cases are increasing across the world, imposing severe risk to the global health community. In late 2019, a case of COVID-19 was identified in Wuhan, where it later spread to various cities around China before causing outbreaks in 24 nations outside China. The daily increase in the number of confirmed cases has extended to 34,598 on February 8, 2020. The authors Al-qaness et al. [1] estimated and predicted the number of cases over the subsequent 10 days to the confirmed cases in China with a new prediction model. Similarly, the authors Anastassopoulou et al. [2] have proposed a model to forecast and analyze the COVID-19 disease outbreak for the Hubei province from January 11, 2020 to February 10, 2020. The authors estimated the key epidemiology factors, i.e., the ratios of the number of deaths and recovery cases with a 90% confidence interval as a foundation for the susceptible infected recovered dead (SIRD) model. Based on the reported model, the new confirmed cases that have been forecasted with an upper bound of 700,000 were 140,000 by February 29, 2020. Similarly, the number of forecasted deaths by February 29, 2020, was 32,000, which surpass this figure. The model also shows that the fatality cases are decreasing with time. The main contributing factor is drastic and effective measures that were taken in Hubei, a province in China, to contain further outbreaks. By February 24, 2020, COVID-19 had claimed 2,600 lives, which is more than the model had predicted. Since then, it has created serious risk to the global community. The authors proposed a conceptual model for Wuhan cases subject to the governmental planning and personal communicative responses, like extension in holidays, quarantine, hospitalization, and travel restrictions. The authors claimed that the model successfully captured the COVID-19 trend effectively which can pass through on sympathetic drifts of the outbreak [3]. In the same way, the authors developed a mathematical model for COVID-19 transmission in Wuhan and analytically probed the effects of lockdown and medical resources. The authors divided the population into five groups, namely Susceptible, Exposed, Infected, Confirmed, and Removed cases, denoted by S, E, I, Q, and R respectively. Their results showed that the later lockdown in Wuhan will have an effect on other Chinese cities as well as on the world [4].
Tian et al. [5]; in their study, studied the COVID-19 pandemic transmission control measures for the first 50 days. The authors found an association between the shutdown of Wuhan city and the arrival of COVID-19 in other cities. In addition, based on their results, other factors like on the banning of public transport, entertainment places, and other public gatherings were shown to reduce and limit the number of cases. The authors Li et al. [6] developed the SEIQR difference equation model to study the COVID-19 pandemic for the Shanxi Province. The authors found, based on their results, that if the lockdown in the city of Wuhan was earlier then the new cases would be fewer. The SEIR type model introduced by the authors in [7] analyzed the recovery period and age structure of the population. Moreover, the authors found that the lockdown depends on the specific structure of the population. To study the epidemic spreading among the population Wang et al. [8] developed a novel model for COVID-19 based on two-layered multiplex networks. In this study, there are two layers used: the upper layer and the lower layer. The upper layer represents the awareness transmission of the pandemic whereas the lower layer represents the spreading of the epidemic. Furthermore, for the lower layer, the SIR (Susceptible-Infected-Recovered) model is used. On March 5, 2020, a total number of 95,333 confirmed cases were recorded. Evaluating the efficacy of actions is significant to measure spread that may occur to newer regions to apprehend the initial outbreak. Therefore, the authors in [9] developed a new method and pooled the transmitted SARS-COV-12 mathematical model with four datasets from inside and outside of Wuhan. The authors predicted the spread of COVID-19 in Wuhan based on data from December 2019 and February 2020. Based on the finding, it was found that 50% of COVID-19 infection was from the locals.
The countries most affected by COVID-19 are China, along with other European countries.
The United States of America is the country with the highest number of COVID-19 cases, surpassing South Korea with a total number of 33,500 cases recorded on 23 March. By 2nd April, the total number of cases recorded was more than 240,000 with 5,800 deaths. Similarly, India is the second worst affected country in the world by COVID-19. It can be seen that the spread of the virus is coming from people coming in and out from India. More than 5,400 deaths were recorded on March 23, 2020 with more than 105,000 confirmed cases. In European countries, France, Russia, and the United Kingdom are the most affected. Similarly, 112,000 confirmed cases and 1,100 deaths were recoded for Brazil, Germany, and China, which account for 10% of global cases.
Based on the described data, the global spread of COVID-19 can be estimated, and efficient predictions can be yielded using the Kalman filter method. Shaman and Karspeck [10] developed a prediction model which was founded on the collective modification of Kalman filter aimed on the periodic occurrences of influenza. Furthermore, the authors have used collective adjustment Kalman filter analyzing susceptible-infected-recovered-susceptible and influenza-like illness by proposing weekly predictions for periodic influenza infection.
This class of models is called the state-space model. This technique is mostly used for smoothing and forecasting time series data. Observed and unobserved data are two components that make up the state-space models. Kalman filter algorithm is generally used for prediction. For uni-variate data in a time series, the structural time series models are state-space models. In state-space architecture, we considered three primary areas. The filtering estimates the existing values of the state based on past and current values, the smoothing a posteriori form of estimation estimates the past observations of the state given the values, and the prediction estimates the forecasting values of the state. The author Aslam [11] used the Kalman filter with Autoregressive Integrated Moving Average (ARIMA) models for the daily cases, deaths, and recoveries of the COVID-19 pandemic for Pakistan. The Kalman filters algorithm estimates the unknown variables based on a collection of measurements taken over time that include noise and other inaccuracies. This approximation is more precise than those based solely on a single calculation. The State-space model uses in time series models and handles missing values. Moreover, for fitting the state-space model, both univariate and multivariate can be used.
Literature Review
The worldwide impact of COVID-19 is based on the accurate prediction of confirmed cases along with the number of recoveries and deaths. Based on the findings, the authors had claimed a rapid increase in the COVID-19 outbreak which could be a worldwide concern, but it could be controlled by imposing travel restrictions and creating awareness of COVID-19. In the coming year, 40–70% of the global population might be infected according to a Harvard Professor [12]. The authors Al-qaness et al. [1] proposed an optimization method to forecast COVID-19 infection confirmed cases in China. By February 8, 2020, the confirmed cases surged day by day and stretched to 34,598. They have developed a new prediction model which can estimate and predict the number of definite cases for the next consecutive 10 days prior to the confirmed cases in China. The authors used a salp swarm algorithm to improve the adaptive neuro-fuzzy inference system employing better flower pollution algorithms. The FPASSA-ANFIS model revealed a better performance with respect to other existing methods in terms of Root Mean Squared Relative Error (RMSRE), Mean Absolute Percentage Error (MAPE), and
COVID-19 has spread all over the world and badly hit the United States, India, France, and China. Fanelli and Piazza [16] proposed a method to study and forecast the COVID-19 pandemic in France, India, and China. According to their study, the recovery rate of COVID-19 infection is almost similar among the three countries. The number of confirmed cases in India was 10–20% on March 21, 2020 with the death rate of 4–8%. The death rate in China appears smaller than India i.e., 1–3%. Though India has more cases and deaths than the other two countries, it also has drastically changed the curve of infected as well as mortality rate. Similarly, the COVID-19 spread progression has been studied by Li et al. [17]. They released the official data with the corresponding model, as it is shown that error exhibited by the cure is relatively small. It also shows an onward forecast and recessive inference of the widespread condition, and the study has supported relevant nations to make decisions to handle the outbreak effectively.
To obtain chronological data, the prediction algorithms are used to sort correct results to take full advantage of a possible gain or avoid prospective loss. The authors Ullah et al. [18] proposed an artificial neural network-based learning module that can help to increase the forecast accuracy of the Kalman filter algorithm. Based on the findings, the authors concluded that about 4.41–11.19% is better performed by Kalman filter through the learning module with the help of root mean squared error as compared to the conventional Kalman filter algorithm.
In several countries, substantial economic problems and stark health problems can be caused by cyclical influenza. The author Zhang [19] used Particle filter and Kalman filter to predict and find the short trend of influenza. Furthermore, the authors analyzed both real data of influenza and synthetic data. It was found that the filtering methods performed well. In the same way, the authors Singh et al. [20] used the Kalman filter for short-term prediction to predict the COVID-19 outbreak for India. Moreover, the authors stated that the Kalman filter is not good for long-term prediction. The Kalman filter gives good results due to its practice and optimality.
Data Description and Methods
Data
In this study, the daily data of death cases for the United States, India, Brazil, and Russia are 852, 2,624, 2,914, and 390 respectively. Similarly, the number of daily confirmed cases for the United States, India, Brazil, and Russia are 62,399, 346,786, 69,105, and 8,717, respectively. The number of daily recovered cases for the United States is 61,547. The number of recovered cases for India, Brazil, and Russia is 219,838, 55,302, and 9,291 respectively, based on the report from January 22, 2020 to April 22, 2021, which is available online on the GitHub site. We perform data processing including the conversion of data format from cumulative to daily basis. This repository is for a COVID-19 visual dashboard operated by Johns Hopkins University Centre Systems Science and Engineering (JHU CSSE). They have aggregated data from sources like WHO, WorldoMeters, BNO News, Washington State Department of Health, and many more. Based on this data, we tried to forecast the key epidemiological parameters, i.e., the number of upcoming daily deaths confirmed and recovered cases for 15 days. In addition, the ratio between the top four countries for the number of deaths and recovered cases can be obtained. The COVID-19 cases have surged throughout the world and the extent of COVID-19 poses a severe risk to global health and prompted the World Health Organization (WHO) to declare the epidemic outbreak a global issue.
Kalman filter is capable of forecasting the global extent of COVID-19 with efficient predictions founded on described statistics. In 1960, it was found by Rudolf Emil Kalman who initially intended to resolve the problem of navigation in one of his projects (Apollo). Since then, it has found many uses in recent technology like vehicle control, direction finding, mainframe visualization’s body tracking, route optimization, econometrics, and time series analysis. Due to the recursive algorithm, Kalman filter uses time-series measurements along with time that contains the statistical sound to estimate unknown variables.
Kalman Filter Algorithms
Consider an equitably common state space model with the following description and notations [21]. Let
where
The Kalman Filter
The equations of Kalman filter using trivial notational deviations are typical in some textbooks; for detail please refer [21–26] to name merely a few. We replicate those equations at this time, by means of repetitive reference in the outcome.
It calculates the vector of state; at time t it is covariance matrix with data obtainable at time
Suppose
The Eqs 5–8 are used to compose a Kalman filter. By switching Eq. 5 in (6) and Eq. 7 in Eq. 8, we obtained a single set equation linking
The equations of the filter, i.e., Eqs 6, 8, spread the state covariance matrix to describe a covariance filter (CF). The corresponding equations which circulate the matrix
Conventional transcript of the calculations building up the Kalman filter into mainframe code is forthright. The aforementioned equation shortly observed, however, that the subsequent programs agonized after a mathematical uncertainty, an example of which is shown by Bucy and Joseph [27]. Specifically, accumulation of fluctuating argument inaccuracies in Eq. 8 could finally yield non-normal or non-positive
The Kalman filter can be represented in more simple ways. The Kalman filter aims to forecast the state X ∈ Rn of a discrete-time dependent process that is measured by linear stochastic difference equation:
here X denotes the matrix and it shows the relation between the states of the previous and the current time step. In the same way, Y is another matrix that shows the relation between input and state function.
The measurement
The random variable Vi denotes the noise process and mi denotes the measurement noise. These two variables are supposed to be independent of each other by normal probability distributions.
In the above equations, P and C are the process noise covariance matrix and measurement noise covariance matrix respectively. X is
The Kalman filter ensures estimation of a procedure through a kind of response regulator: the filter forecasts the procedure state by some stage then receives the response in the system of measurements. Hence, the Kalman filter algorithm can be distributed into two portions i.e., time equation and measurements equations or prediction phase and feedback phase.
The prediction equation is,
The feedback equation is,
here in all these above equations,
Results and Discussions
We have considered the deaths, confirmed cases, and recovered cases from the COVID-19 datasets for the top four countries, namely the United States, India, Brazil, and Russia. The dataset is loaded to R environment, fit Kalman filter model for daily deaths, recovered cases, and confirmed cases of COVID-19 for the four countries. The results were obtained in terms of measurement error tools, namely mean error (ME), root mean square error (RMSE), and mean absolute error (MAE), from the Kalman filter method. The evaluation measurement tools are given in Table 1. The final models are selected to have high accuracy and low error rate with the help of tuning parameters of filtered and smoothed method and are presented in Table 2. In each case, the final models predict the COVID-19 outbreak for the next 15 days in the four countries. The results obtained using the Kalman filter algorithms suggest that those countries which have increased the daily confirmed cases and daily number of deaths can take the necessary steps to control and reduce the current COVID-19 outbreak. This algorithm process and catches the best estimate from the data that are noisy. In addition, it is easy to implement in any statistical software. Thus, it will help each country to know about the future status of the COVID-19 virus using this algorithm and aid in their policy making. These policies could include lockdown or closure of public parks and other entertainment.
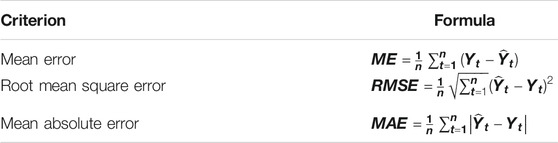
TABLE. 1. Evaluation measurement tools.
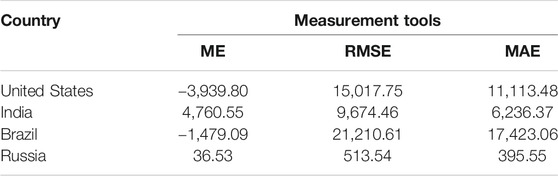
TABLE 2. Number of daily confirmed cases of the United States, India, Brazil, and Russia.
In Table 2, the ME value of the daily confirmed cases for the United States, India, Brazil, and Russia are −3,939.80, 4,760.55, −1,479.09, and 36.53, respectively. Similarly, the RMSE for the United States, India, Brazil, and Russia is 15,017.75, 9,674.46, 21,210.61, and 513.54, respectively. The United States, India, and Brazil MAE value is 11,113.48, 6,236.37, and 17,423.06 respectively, while for Russia it is 395.55.
Table 3 shows the ME, RMSE, and MAE of the daily death cases for the United States, India, Brazil, and Russia. The ME values for the United States, India, Brazil, and Russia are −41.0, 76.54, 26.65, and −6.60, respectively. Similarly, the RMSE value for the United States, India, Brazil, and Russia are 611.27, 156.27, 794.90, and 47.10, respectively. While the MAE is 442.97, 80.98, and 618.74, 38.24, for the United States, India, and Brazil, Russia, respectively.
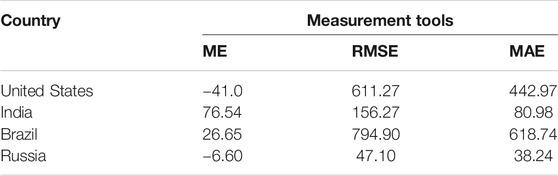
TABLE 3. Number of daily death cases in the United States, India, Brazil, and Russia.
In Table 4, the value of the ME of the number of daily recovered cases for the United States, India, Brazil, and Russia are −3,832.44, −3,489.04, 300.89, and −36.60, respectively. While the RMSE is 1,660.05, 8,175.37, 29,591, and 2,189.47 for the United States, India, Brazil, and Russia, respectively. The United States, India, Brazil, and Russia MAE is 12,600.01, 4,615.98, 23,216.98, and 1,763.20, respectively.
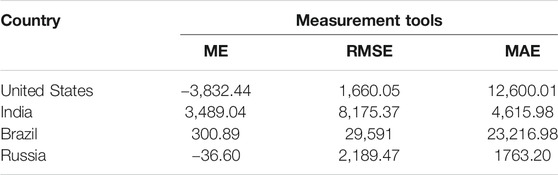
TABLE 4. Number of daily recovered cases of the United States, India, Brazil, and Russia.
In Table 5, the minimum values and the maximum values for the United States, India, Brazil, and Russia are 0, and 300,310, 346,786, 100,158, and 29,499 respectively. While the first and third quartile for the United States, India, Brazil, and Russia is 57,766, 3,942, 8,456, 5,064, and 79,404, 52,509, 49,863, and 14,867 respectively. In the same way, the mean and median for the United States, India, Brazil, and Russia is 70,004, 36,347, 31,153, 10,265 and 50,393, 19,906, 28,323, and 8,576 respectively.
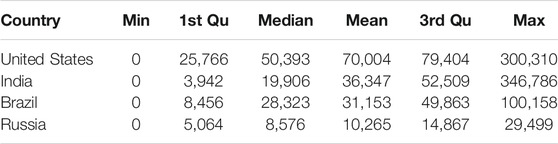
TABLE 5. Descriptive Statistics of the United States, India, Brazil, and Russia for daily confirmed cases.
The data is from January 22, 2020 to April 22, 2021. In Figure 1, the total number of daily confirmed cases for the United States is displayed. Though there are two spikes in the original curve, both the filter and smooth model frameworks are capable of producing epidemic curves that soundly resembled the chronological time series. As observed from the graph, the cases gradually increased up to December 2020, i.e., three hundred days, and then decreased. The graph follows the pattern in a sinusoidal way and the confirmed cases fluctuated. In addition, the 15 days’ forecast also shows an increase in the number of confirmed cases. This revealed that in the next 15 days the total number of cases will increase in the United States.
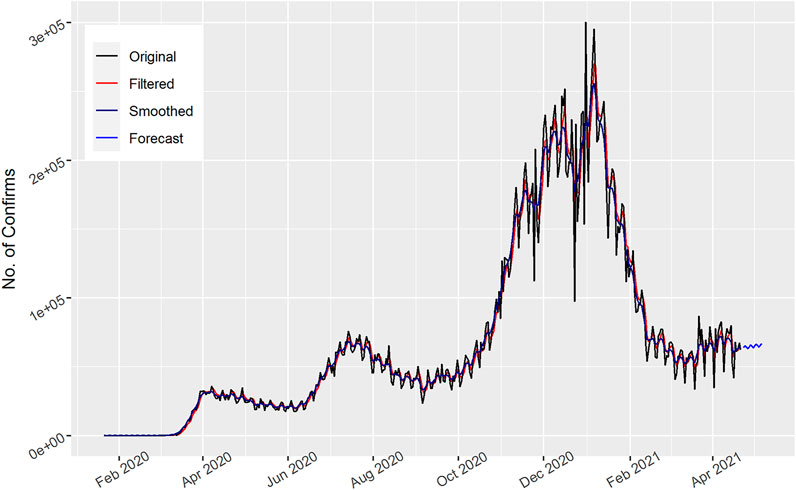
FIGURE 1. Number of daily Confirmed cases in the United States.
In Figure 2, the total number of daily confirmed cases are displayed for India. The filtered and smoothed Kalman follows the actual pattern of the data. The graph shows that the daily confirmed cases are gradually increasing and in mid-September 2020 the maximum number of cases then decreased. After that they again increased; the 15 days’ forecast also indicates fluctuated values and an overall increase in the number of confirmed cases.
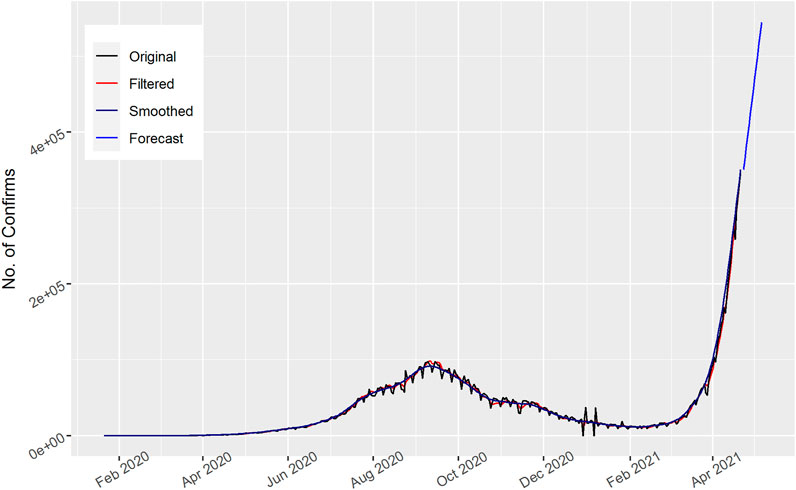
FIGURE 2. Number of daily Confirmed cases in India.
In Figure 3, the total number of daily confirmed cases are displayed for Brazil. The Kalman filter captured the actual data trend and showed better performance. The number of cases fluctuated with time. However, they increased in January 2021 and by the end of March 2021 had moved to the maximum. Similarly, the number of daily confirmed cases for Brazil decreased for the upcoming 15 days’ forecast as shown in the figure, which shows a downward trend of COVID-19 spread in the Brazilian people.
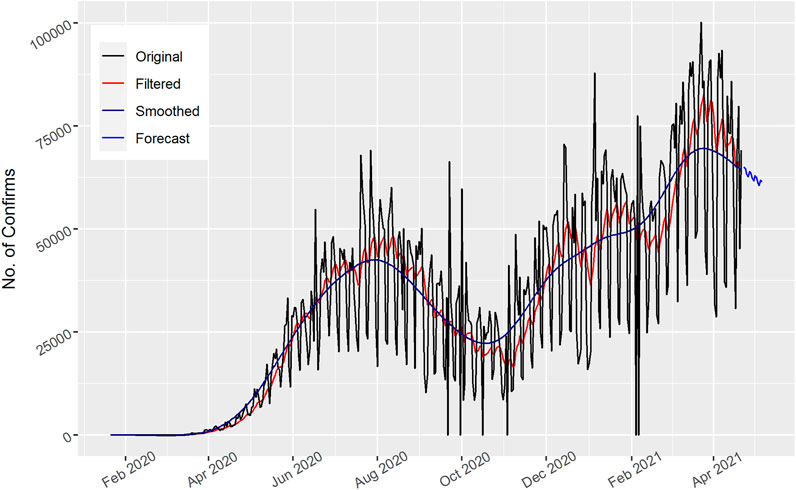
FIGURE 3. Number of daily Confirmed cases in Brazil.
In Figure 4, the total number of daily confirmed cases are displayed for Russia. The Kalman filter captured the actual data trend and showed better performance. The number of cases fluctuated with the time. However, they increased in the beginning of March 2020 and then decreased. After that they again increased to the maximum. Similarly, the number of daily confirmed cases for Russia decreased for the upcoming 15 days’ forecast as shown in the figure, which shows a downward trend of COVID-19 spread in the Russian people.
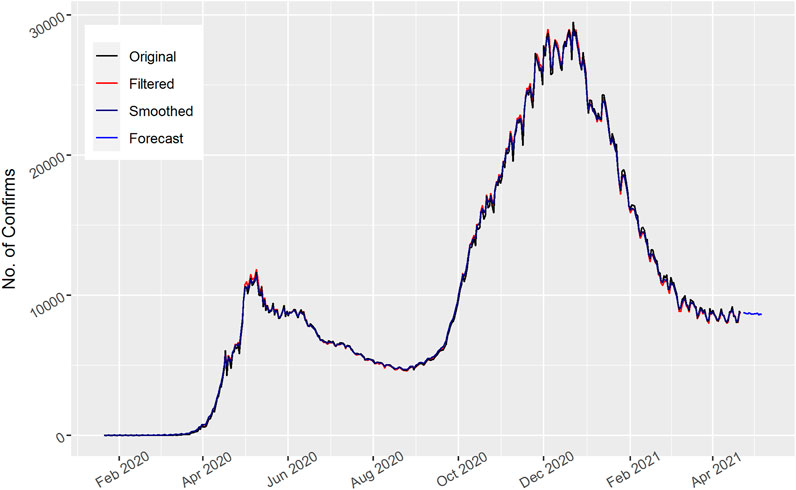
FIGURE 4. Number of daily Confirmed cases in Russia.
In Figure 5, the total number of daily deaths are displayed for the United States. The Kalman filter method trail almost overlaps with the actual pattern of the data and shows better performance. It is shown from the graph that the daily death cases increase and then decrease in a sinusoidal way in the United States. Moreover, the 15 days’ forecast also indicates the downward curve for the upcoming number of deaths. This forecasted value shows that the number of daily deaths decreases in the United States.
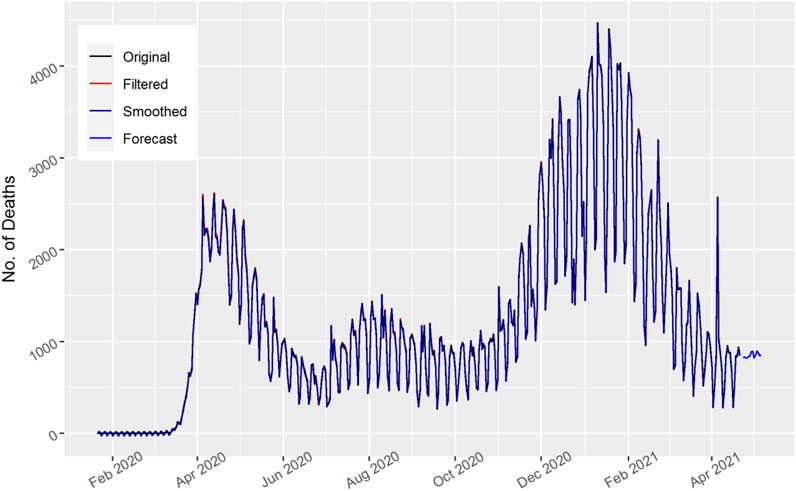
FIGURE 5. Number of daily death cases in the United States.
In Figure 6, the total number of daily death cases are displayed for India. The number of deaths fluctuates and first shows an increasing and then decreasing trend. Moreover, the number of daily deaths peaked in mid-June 2020. The Kalman filter model frameworks are capable of generating epidemic curves that resemble the chronological time series. The 15 days’ forecast shows an upward trend as the number of daily deaths in India may increase further.
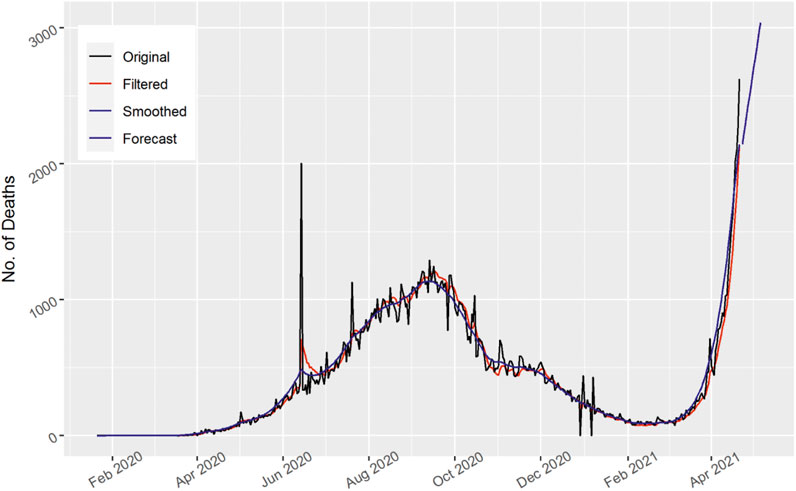
FIGURE 6. Number of daily death cases in India.
In Figure 7, the total number of daily death cases are displayed for Brazil. As the number of deaths fluctuate and are clustered over time, both the filtered and smoothed curves follow the original pattern. The actual data were apprehended very well by the Kalman filter method and indicate an enhanced performance. Similarly, the number of daily deaths for Brazil shows an upward trend. The 15 days’ forecast show an upward trend as the number of daily deaths in Brazil may increase further.
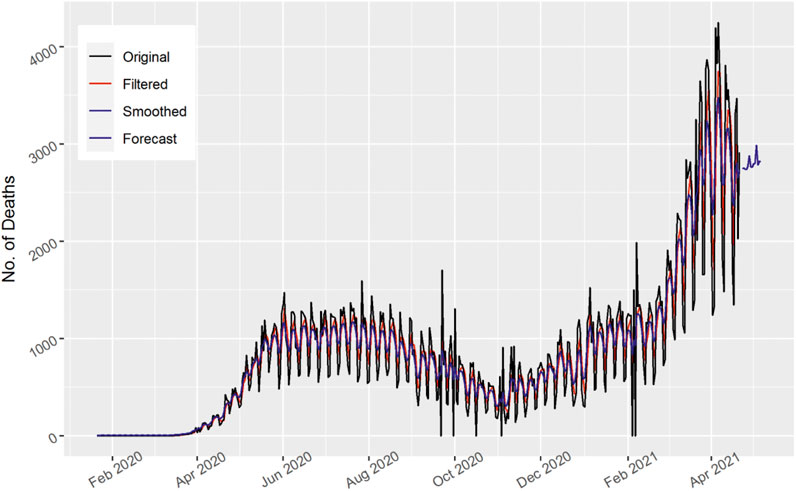
FIGURE 7. Number of daily death cases in Brazil.
In Figure 8, the total number of daily death cases is displayed for Russia. As the number of death cases fluctuates and are clustered over time, both the filtered and smoothed curves follow the original pattern. The actual data captured by the Kalman filter method indicate better results. Similarly, the number of daily deaths for Russia shows an upward trend. The 15 days’ forecast shows an upward trend as the number of daily deaths increases in Russia.
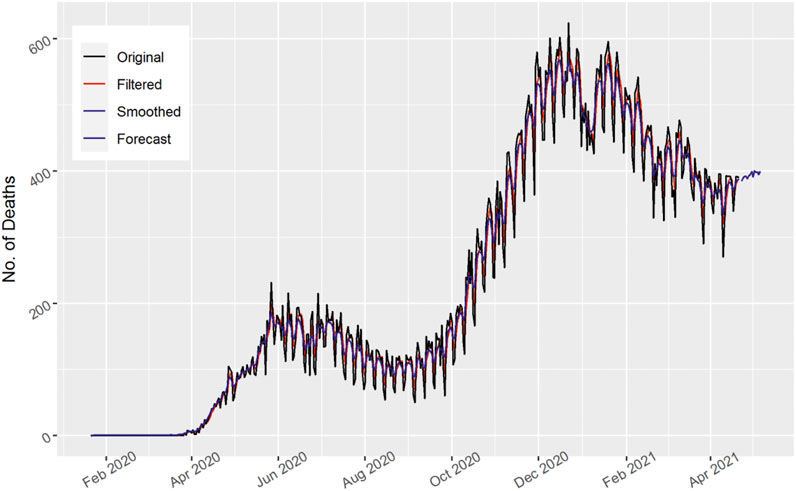
FIGURE 8. Number of daily death cases in Russia.
The number of recovered cases is shown in Figure 9 for the United States. Most patients recovered over time. Most of the patients recovered at the start of January 2021. Then there is a reduction in recovered cases. The forecast curve for the upcoming 15 days also first decreases and then increases as time goes by, which indicates that it is either due to the interim injunction followed by the people or government to take straight action and improve the medical and other related action against the current pandemic.
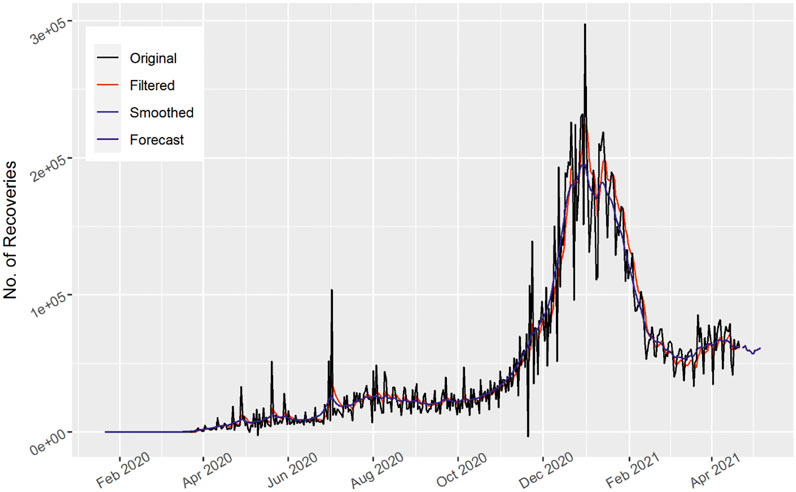
FIGURE 9. Number of daily recovered cases of the United States.
In Figure 10, the total number of daily recovered cases are displayed for India. The Kalman filter model captured nearly all of the actual curve of the recovered cases of India. The number of recovered cases first increases then decreases and again increases over time, as shown in the figure. Similarly, the upcoming 15 days’ forecast increases, which indicates that there may be vaccinations and other treatments helpful in the number of recoveries in India.
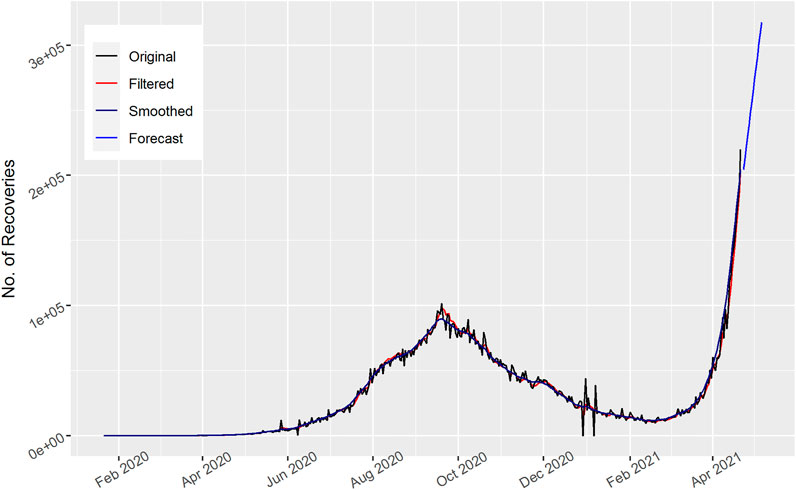
FIGURE 10. Number of daily recovered cases of India.
The total number of daily recovered cases for Brazil is shown in Figure 11. Both the filtered and smoothed Kalman nearly captured the spikes of the actual curve of Brazil and this is due to most of the people recovering at the end of October 2020 and in the figure the spikes can be observed. The forecast curve for the next 15 days increases, which is a good sign to reduce and control the COVID-19 outbreak. This indicates that steps taken by the Brazilian government are helpful in controlling the current COVID-19 outbreak.
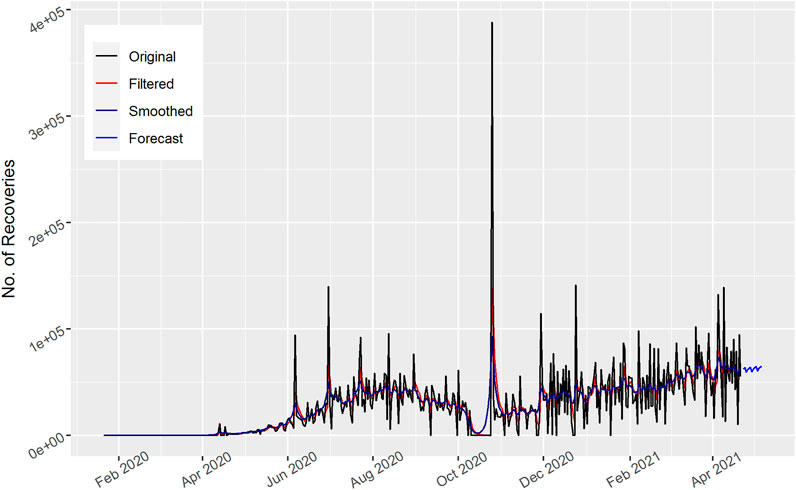
FIGURE 11. Number of daily recovered cases of Brazil.
The number of recovered cases is shown in Figure 12 for Russia. Most patients recovered over time. Most of the patients recovered at the start of December 2020 to the end of January 2021. Then there is a reduction in recovered cases. The forecast curve for the upcoming 15 days also decreases as time goes by, which indicates that it is either due to the interim injunction followed by people or the government in not taking straight action that may help in the reduction of the current pandemic. In addition, it may be possible that the affected patients slowly recovered.
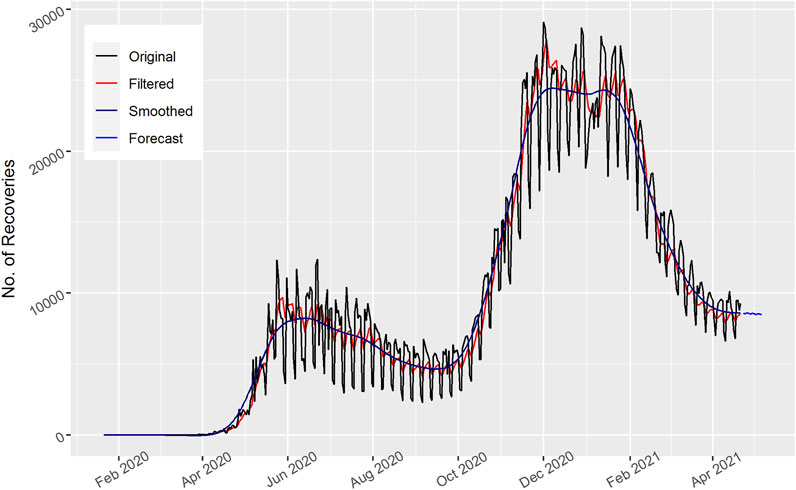
FIGURE 12. Number of daily recovered cases in Russia.
In Figure 13, the heat-map correlation plot is plotted for the United States, India, Brazil, and Russia. In addition, for the cases, their respective Kalman filter and Kalman Smooth are also plotted. From the plot, we can say that both the Kalman filter and Kalman Smooth are highly correlated with their respective cases. This suggests that the Kalman filter captured the real data in the most meaningful way.

FIGURE 13. Heat-map Correlation plot for the daily confirmed cases for United States, India, Brazil, and Russia.
The key findings of this work are as follows:
• The Kalman filter algorithm was able to and followed the actual data pattern of the data in almost all scenarios for the four countries.
• The forecast shows that in the next 15 days the total number of confirmed cases will increase in the United States and India while they will decrease in Brazil and Russia.
• The forecast shows that in the next 15 days the total number of death cases will increase in all three countries except in the United States.
• The recovered cases forecast for the next 15 days revealed that the number of recovered cases will increase in the United States, India, and Brazil while they will decrease in Russia.
• From this study, it is revealed that the Kalman Filter also provides the best forecast for the short term. Therefore, policymakers can use this technique to make short-term decisions.
Limitations
• In this study, we do not consider or measure other parameters like the number of lockdowns, social distancing, and measure of self-isolation.
• The current study did not measure the association of vaccinated people and the number of new daily cases.
Future Work
In this study, the Kalman filter algorithms are used, though the results and both the Kalman filtered and Kalman smoothed captured the original track almost in all cases, i.e., for the daily confirmed cases, deaths, and the number of recovered cases of the four countries. However, to get more precise and accurate results, it can be possible to add some other best models with Kalman filter algorithms, like ANN, that can enhance the results of the predicted values. Moreover, it can be possible to consider other parameters like the number of lockdowns in the country, the number of vaccinations, treatment procedures, etc. This could assist governments in making and adjusting their policies according to the various cases that are forecast.
Thus, the summary of the confirmed, recovered, and death cases is presented in Table 6.
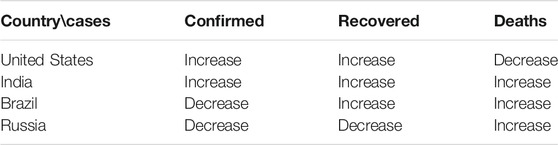
TABLE 6. Summary of the forecasts for the next 15 days.
Conclusion
The use of the Kalman filter method for the time series fluctuation’s drift forecast has a positive outcome. The Kalman filter has a decent oscillation in the time series estimation. In this article, we implemented the Kalman filter algorithm to determine the trend of the COVID-19 pandemic. In addition, the KF method is used to predict the number of confirmed, recovered, and death cases for the United States, India, Brazil, and Russia. The KF algorithm was able to follow the actual data trend in almost all scenarios. The outcomes of the data were summarized with the help of statistical measures and figures were shown for the United States, India, Brazil, and Russia. The COVID-19 outbreak trends were well tracked by the KF algorithm. We predicted the number of confirmed, recovered, and death cases for the upcoming 15 days for the United States, India, Brazil, and Russia. In conclusion, the statistical analysis confirms that the KF algorithm is useful for the short-term forecasting of COVID-19. The KF method can be helpful for decision-makers in adopting short-term strategies with regards to the current amount of disease occurrence. This algorithm is easy to implement in any statistical software. Thus, it will help each country to know about the future status of the COVID-19 virus for the daily number of recoveries, deaths, and new cases. Using this algorithm, the government can review the policies and tune the parameters like lockdown and closure of public parks and other entertainment.
Data Availability Statement
Publicly available datasets were analyzed in this study. This data can be found here: https://github.com/CSSEGISandData/COVID19/tree/master/csse_covid_19_data/csse_covid_19_time_series.
Author Contributions
All authors listed have made a substantial, direct, and intellectual contribution to the work and approved it for publication.
Conflict of Interest
The authors declare that the research was conducted in the absence of any commercial or financial relationships that could be construed as a potential conflict of interest.
Publisher’s Note
All claims expressed in this article are solely those of the authors and do not necessarily represent those of their affiliated organizations, or those of the publisher, the editors and the reviewers. Any product that may be evaluated in this article, or claim that may be made by its manufacturer, is not guaranteed or endorsed by the publisher.
Supplementary Material
The Supplementary Material for this article can be found online at: https://www.frontiersin.org/articles/10.3389/fphy.2021.629320/full#supplementary-material
References
1. Al-qaness MAA, Ewees AA, Fan H, Abd El Aziz M. Optimization Method for Forecasting Confirmed Cases of COVID-19 in China. Jcm (2020) 9(3):674. doi:10.3390/jcm9030674
2. Anastassopoulou C, Russo L, Tsakris A, Siettos C. Data-based Analysis, Modelling and Forecasting of the COVID-19 Outbreak. PloS one (2020) 15(3):e0230405. doi:10.1371/journal.pone.0230405
3. Lin Q, Zhao S, Gao D, Lou Y, Yang S, Musa SS, et al. A Conceptual Model for the Outbreak of Coronavirus Disease 2019 (COVID-19) in Wuhan, China with Individual Reaction and Governmental Action. Kidlington, Oxford, United Kingdom: International Journal of Infectious Diseases (2020). doi:10.1016/j.ijid.2020.02.058
4. Sun G-Q, Wang S-F, Li M-T, Li L, Zhang J, Zhang W, et al. Transmission Dynamics of COVID-19 in Wuhan, China: Effects of Lockdown and Medical Resources. Nonlinear Dyn (2020) 101(3):1981–93. doi:10.1007/s11071-020-05770-9
5. Tian H, Liu Y, Li Y, Wu C-H, Chen B, Kraemer MUG, et al. An Investigation of Transmission Control Measures during the First 50 Days of the COVID-19 Epidemic in China. Science (2020) 368(6491):638–42. doi:10.1126/science.abb6105
6. Li L, Yang Z, Dang Z, Meng C, Huang J, Meng H, et al. Propagation Analysis and Prediction of the COVID-19. Infect Dis Model (2020) 5:282–92. doi:10.1016/j.idm.2020.03.002
7. Blyuss KB, Kyrychko YN. Effects of Latency and Age Structure on the Dynamics and Containment of COVID-19. J Theor Biol (2021) 513:110587. doi:10.1016/j.jtbi.2021.110587
8. Wang Z, Guo Q, Sun S, Xia C. The Impact of Awareness Diffusion on SIR-like Epidemics in Multiplex Networks. Appl Math Comput (2019) 349:134–47. doi:10.1016/j.amc.2018.12.045
9. Kucharski AJ, Russell TW, Diamond C, Liu Y, Edmunds J, Funk S, et al. Early Dynamics of Transmission and Control of COVID-19: A Mathematical Modelling Study. Kidlington, Oxford, United Kingdom: The Lancet Infectious Diseases (2020). doi:10.1016/S1473-3099(20)30144-4
10. Shaman J, Karspeck A. Forecasting Seasonal Outbreaks of Influenza. Proc Natl Acad Sci (2012) 109(50):20425–30. doi:10.1073/pnas.1208772109
11. Aslam M. Using the Kalman Filter with Arima for the COVID-19 Pandemic Dataset of Pakistan. Data in brief (2020) 31:105854. doi:10.1016/j.dib.2020.105854
12. Petropoulos F, Makridakis S. Forecasting the Novel Coronavirus COVID-19. PloS one (2020) 15(3):e0231236. doi:10.1371/journal.pone.0231236
13. Wynants L, Van Calster B, Bonten MM, Collins GS, Debray TP, De Vos M, et al. Prediction Models for Diagnosis and Prognosis of Covid-19 Infection: Systematic Review and Critical Appraisal. BMJ (2020) 369:m1328. doi:10.1136/bmj.m1328
14. Makridakis S, Wakefield A, Kirkham R. Predicting Medical Risks and Appreciating Uncertainty. Foresight: Int J Appl Forecast (2019) 52(52):28–35.
15. Elmousalami HH, Hassanien AE. Day Level Forecasting for Coronavirus Disease (COVID-19) Spread: Analysis, Modeling and Recommendations. arXiv preprint arXiv:2003.07778. New York: Cornell University (2020).
16. Fanelli D, Piazza F. Analysis and Forecast of COVID-19 Spreading in China, Italy and France. Chaos, Solitons & Fractals (2020) 134:109761. doi:10.1016/j.chaos.2020.109761
17. Li M-T, Sun G-Q, Sun G-Q, Zhang J, Zhao Y, Pei X, et al. Analysis of COVID-19 Transmission in Shanxi Province with Discrete Time Imported Cases. Math Biosci Eng (2020) 17(4):3710–20. doi:10.3934/mbe.2020208
18. Ullah I, Fayaz M, Kim D. Improving Accuracy of the Kalman Filter Algorithm in Dynamic Conditions Using ANN-Based Learning Module. Symmetry (2019) 11(1):94. doi:10.3390/sym11010094
19. Zhang Y. Influenza Trend Prediction Using Kalman Filter and Particle Filter. Department of Physics, Carnegie Mellon University (2016).
20. Singh KK, Kumar S, Dixit P, Bajpai MK. Kalman Filter Based Short Term Prediction Model for COVID-19 Spread. Dordrecht, Netherlands: Applied Intelligence (2020). p. 1–13. doi:10.1007/s10489-020-01948-1
21. Harvey AC. Forecasting, Structural Time Series Models and the Kalman Filter. Cambridge University Press (1990).
23. Durbin J, Koopman SJ. Time Series Analysis by State Space Methods. Oxford University Press (2012).
24. Shumway RH, Stoffer DS. Time Series Analysis and its Applications: With R Examples. Springer (2017).
Keywords: corona, COVID-19, forecasting, Kalman filter, modelling
Citation: Ahmadini AAH, Naeem M, Aamir M, Dewan R, Alshqaq SSA and Mashwani WK (2021) Analysis and Forecast of the Number of Deaths, Recovered Cases, and Confirmed Cases From COVID-19 for the Top Four Affected Countries Using Kalman Filter. Front. Phys. 9:629320. doi: 10.3389/fphy.2021.629320
Received: 14 November 2020; Accepted: 16 June 2021;
Published: 12 August 2021.
Edited by:
Andrea Rapisarda, University of Catania, ItalyReviewed by:
Chengyi Xia, Tianjin University of Technology, ChinaGui-Quan Sun, North University of China, China
Copyright © 2021 Ahmadini, Naeem, Aamir, Dewan, Alshqaq and Mashwani. This is an open-access article distributed under the terms of the Creative Commons Attribution License (CC BY). The use, distribution or reproduction in other forums is permitted, provided the original author(s) and the copyright owner(s) are credited and that the original publication in this journal is cited, in accordance with accepted academic practice. No use, distribution or reproduction is permitted which does not comply with these terms.
*Correspondence: Muhammad Aamir, aamirkhan@awkum.edu.pk