
Abstract
Due to safety issues when passengers get on and off the subway and spend a lot of time on the subway, this makes subway station signs very important. Moreover, in case of fire and other dangerous situations and emergency evacuation, the guiding signs must be able to guide passengers to leave the station and dangerous areas efficiently and orderly, so as to protect the personal and property safety of passengers. The purpose of this study was to analyze the decision response of subway evacuation signs using the characteristics of the brain components. In this study, subway model is constructed. When you perform simulation using software, you need to fine tune the parameters to get the best simulation effect. A questionnaire survey was made on the components of the subway sign. The results show that the number of people who think that the standard font of the blackboard logo is the most representative of the emergency exit, accounting for 78.2% of the total number of people, taking the image as the first choice accounted for 52.9% of the total number of people, and the green sulfur powder logo as the first choice accounted for 69.8% of the total number. This study makes an important contribution to the research of subway traffic safety problems.
1 Introduction
The demand for transportation is increasing, mainly because of the continuous development and progress of modern urbanization. Subway is mainly used as underground urban railway transportation system, covering almost all areas of the city. In the use and development of subway and underground space, we need to put safety first. Subway sign system plays an important and irreplaceable role in helping passengers guide underground traffic smoothly and effectively. With the gradual formation and expansion of urban subway network, more and more people join the "Metro City". The subway sign system is designed to allow more passengers to take the subway efficiently and safely, and to facilitate work and life.
The brain consists of billions of neurons interconnected. It is one of the most important organs of the body to control people's thoughts and emotions. How to record cell and brain cell activities together and make cell activity in the brain more detailed. Psychology, cognitive psychology, cognitive psychology. Eg signals have many advantages compared to other technologies. In subsequent studies, using the characteristics of brain components to determine the meaning of subway evacuation targets has become more meaningful and will be of great help to future development.
In the study of subway evacuation signs, Wang J proposed a dynamic evacuation risk analysis model based on Bayesian theory, considering the psychological and behavioral responses of evacuees. Based on a questionnaire survey on the fire scene of Xinjiekou subway station in Nanjing, he used the event tree analysis (ETA) to model the fire scene of the subway. In this fire scenario, three control events (fire alarm, exhaust system and evacuation route) are related to fire evacuation control, and two control events (active escape and passive escape) are related to personnel characteristics. Then, he calculated the probability of the final state of each scene through Monte Carlo simulation. Based on the statistical data of subway fire accidents and safe evacuation in recent years, he used Bayesian theory to update the precursory probability in real time, and finally obtained the posterior probability distribution of safe evacuation. However, Bayesian theory only uses probability to obtain results. It is not an accurate data and lacks authenticity [1]. In order to estimate the evacuation capacity of subway station in emergency and consider the travel time of pedestrian facilities with different crowding degree, Wu Y established a bilevel programming model for evacuation equilibrium. His upper model ensures maximum utilization of the facility, while the lower model minimizes evacuation time by determining how to guide evacuees to safe areas. He also designed an improved particle swarm optimization algorithm to solve the model. In order to verify the effectiveness of the model and algorithm, he took the capacity estimation of Fuxingmen station of Beijing Metro as an example to simulate the evacuation process, and obtained the optimal evacuation path and reasonable estimation, and selected the evacuation passenger flow per unit time and network congestion as the evaluation indexes of station capacity in emergency. His method is not stable [2]. Yuan Z studied the influence of emergency signs on evacuation dynamics in smoke environment. His model assumes that in a smoky hall, pedestrians' view is limited to a certain extent, and they do not know the exact location of the exit. In this process, he analyzed the impact of emergency signs on the direction and speed of movement, as well as the herding behavior of pedestrians. In his analysis, he divided emergency signs into two categories: wall signs (WS) and ground signs (GS). Then, he analyzes the behavior changes of pedestrians when they encounter WS, GS and exits in the evacuation process, and establishes an improved model based on the social force model. In the simulation, he studied the evacuation process in WS and GS. His method is out of date [3].
The innovation of this article lies in the feature extraction of the brain components, and the classification of the types of subway stations, forming a complete system. This study also describes the design elements of evacuation guidance signs in detail. The main algorithm of this study is the evacuation standard and algorithm performance evaluation index of Subway Emergency passenger flow. In this study, a subway station evacuation model was established, and a questionnaire survey was conducted on the design of subway evacuation signs. Combined with the experimental results, this paper analyzes the basic situation of the subway during the operation, analyzes the decision-making response of different people to different fonts, different expressions and different colors of evacuation signs, and analyzes the influencing factors of subway evacuation process. The conclusion is that the method of this study has a good effect on subway evacuation decision.
2 Brain component characteristics and subway evacuation signs
2.1 Feature extraction of brain components
-
(1)
Time domain analysis method
The time domain analysis method is based on the assumption that the EEG signal obeys the stability characteristics in a short time and directly extracts the amplitude, arithmetic mean, variance, standard deviation, zero crossing rate, and other related characteristic parameters from the processed signal. And it has strong intuition and the most clear physical meaning. The characteristic of the EEG signal is influenced by the range of artifacts, but in this way, there is no video domain resolution, only the time domain signal resolution can be obtained, and the resolution of the EEG signal itself is relatively high. Because the frequency domain has strong characteristics, the time domain analysis cannot display the electrical activity of the brain more appropriately [4, 5]. Compared with the regular and periodic physiological signals such as electrical and pulse, the EEG signal is more complex and is a non-stationary random signal. In addition, the brain is always in a state of physiological activity, and there is a nonlinear relationship between the generation of EEG signals and time. In general, the EEG signal is a weak, non-stationary, and nonlinear random signal.
-
(2)
Frequency domain analysis
The frequency domain analysis method, also known as the spectral analysis method, is designed based on the stability of the processed signal. The distribution of EEG signals was directly observed using the rhythm of the spectrum δ, α, θ and β. General frequency domain analysis includes parameter estimation based on Fourier transform power spectrum estimation. There is also a nonparametric estimation method for estimating the power spectrum using the AR model [6].
-
(3)
Time frequency domain analysis
Analysis of signal use frequency and nonsignal combination method, analysis of signal use frequency and frequency. Domain analysis method cannot achieve high resolution in both time domain and frequency domain. In this way, signal reduction analysis can be carried out in both time and frequency domain, and better processing results can be obtained [7, 8].
2.2 Brain-computer interface
Brain-computer Interface (BCI) is a human–computer interface developed in recent years. It is a normal output pathway (that is, peripheral nerve and muscle tissue) that does not depend on the brain to realize the human brain and the outside world (Computer or other external device) direct communication system (as shown in Fig. 1). The strict definition of the brain-computer interface is: a communication control system that does not rely on the normal output channels of the brain's peripheral nerves and muscles. It collects and analyzes the brain's bioelectrical signals to establish a direct communication and control channel between the brain and the computer or other electronic equipment, so that people can express their wishes or manipulate the equipment through the brain, without the need for language or body movements. Guang: In a sense, this kind of communication can also be two-way. On the one hand, external information (sounds, memory content, etc.) is directly transmitted to the brain, such as electronic cochlea, brain memory chips, etc.; on the other hand, the brain directly controls the outside world surroundings.

Schematic diagram of brain-computer interface system
The emergence of BCI technology makes it possible to use brain signals to directly control the external environment. The three necessary conditions for achieving BCI are: first, there must be a signal that can reliably reflect the brain's thinking; second, this signal can be collected in real time and quickly; third, this signal has classifiable characteristics. The human brain signals currently available for BCI are: EEG (electroencephalogram), EMG (magnetoencephalogram) and fMRI (functional magnetic resonance imaging). The brain signal used by most BCI research institutions is EEG5.6.
3 Types and characteristics of metro station emergencies
-
(1)
Types of emergency in subway station
The emergency situation of subway refers to the incident that occurs suddenly in the operation of subway, which brings damage to passengers and subway staff and threatens personal safety. It needs to be dealt with quickly in a short period of time in an uncertain situation. According to the cause, nature and process of emergency in subway station, the emergency situation of subway can be divided into the following four categories [9].
-
1.
Natural disaster: refers to the disasters caused by natural phenomena such as earthquake, landslide, etc., or meteorological disasters such as wind disaster, heavy rain and snow disaster that affect the operation of subway [10, 11].
-
2.
The main causes of the accident are railway accidents and railway accidents. Due to the power failure of electrified railway, the subway train stopped running.
-
3.
Public health accident: mainly refers to the public health accidents that may have a serious impact on public health such as subway passengers, such as infection, gas leakage, biochemical pollution [12].
-
4.
Social security incidents: mainly including terrorist attacks, hostage taking, rail and other emergencies, as well as social events affecting the safe operation of the subway at the operation site. Among them, especially serious and serious accidents occurred in subway stations, mainly including fire, explosion, large-scale power failure of the station, the first line is completely shut down or multiple lines are stopped at the same time, and large-scale battle occurs in the station that affects the safe operation. In case of emergency, the subway will encounter natural disasters such as earthquake, rain and snow [13]. Therefore, it is necessary to preprocess the collected EEG signals to remove spontaneous EEG signals, noise and artifacts. Baseline drift is a phenomenon in which the parameters of circuit components change due to environmental temperature and other factors during the acquisition of EEG signals, which causes the signal to suddenly increase or decrease in a certain period of time. It is common in EEG signal acquisition. It must also be removed.
-
1.
-
(2)
Characteristics of emergency in subway station
Subway stations are closely related to surrounding traffic and geographical surroundings. Geographically convenient location. The structure of the masses is diverse. A small accident can cause a great emergency at any time and even cause it. We know the series of development results. City Subway Emergency and general emergencies have common characteristics and distinctive characteristics. The main feature of Metro emergencies is the sudden and corresponding time emergency of the incident. The first thing was sudden. There was no sign before the event. Even if there is a sign, it cannot be judged. In general, subway accidents are caused by small events such as time, time and place. They are random and cause social confusion and fear of people. Second, urgency of corresponding activities. After activity, you cannot analyze or judge common sense. When the disaster occurs, it is difficult to adjust and manage the tendency of development and development beforehand, and it is difficult to respond correctly to the event [14, 15].
3.1 Design elements of evacuation guidance signs
There are many types of safety evacuation signs in subway stations, which can be divided into three angles: high, flat, and low according to people's visual habits. Station safety evacuation signs are set at the junction of station entrances and halls, platforms (high visual areas), walls, columns (horizontal viewing angles), ground, stairs (low visual areas), etc., as shown in Fig. 2:

Safety evacuation signs for subway stations (the picture is borrowed from https://m.sohu.com/a/282833365_667374)
Some of these signal evacuation signs are about 2 m from the ground, mainly indicating the direction of emergency exits and exits, and they are always on. When an emergency situation causes the subway station to be out of power, you can "stick to work" for 1 h; some walls and columns about 0.5 m above the ground are continuously installed from the platform to the entrance. The sign can be found within the line of sight, and it is always on. Due to the low setting position, when a fire occurs, thick smoke obstructs the line of sight, and the sign can still point you to the direction.
-
(1)
Words
Direction signs are widely used at different ages and educational levels [16]. There are quite a few people who might be foreigners in the metropolitan area of developed countries. Choose the appropriate logo language [17, 18]. This is not a simple job but is an unusual technical term for increasing visitor sense from space. Easy to identify directional signs, avoid confusion, unwanted obstacles and delays [19].
The most eye-catching fonts are not necessarily the best logo fonts. With excellent logo fonts, traffic participants are no longer interested in the font itself, but you can pay attention to the contents of the text from scratch [20]. The degree of text recognition and understanding is inversely proportional to the specificity of the text font style. The more you pay attention to the font, the less likely it is to recognize and understand the content of the text. An excellent designer can understand the balance between the visual beauty and artistic beauty of the directional logo font, and effectively convey information and reflect the beauty of the font [21].
-
(2)
Guide map
Most maps are used to describe space. The physical properties of the objective environment or people's subjective understanding can be extracted by indicating the absolute or relative position, geographical characteristics, spatial proportion, etc.
Maps are usually not distorted or compressible. However, the navigation map is different. Guide map is the simplest and most understandable way to transmit spatial information, which needs fair use of users with different cultural levels. On the other hand, the guidance map is set in a specific place in a specific space, and the observer's direction and angle are also fixed. The content of each guide map is the biggest feature according to the setting place [22, 23].
-
(3)
Public graphic symbols
You cannot use all graphics and symbols as common graphical symbols. The use of images to convey information may exceed the limit according to different countries and countries, but the communication effect varies from person to person. People will suffer from the differences in living environment, cultural background, language and even age. There are differences in consciousness [24].
Public graphic symbol is based on the general understanding of social graphics. Public graphic symbols have the value of public users. They must meet the most important conditions of information transmission, such as clarity, clarity and understanding, before they can be used as signs or prohibited items. The more internationalized a place is, the more graphic languages can be used. The graphic symbols that can be understood without learning can surpass the characters. As other common languages in the world, they are widely used and popularized [25].
3.2 Passenger flow evacuation standards for metro emergencies
Calculation of evacuation time: the total evacuation time is equal to the sum of the travel time of passenger flow on the longest evacuation route and the waiting time of each circulation area (such as platform exit, gate, station hall exit)
where t is the total travel time of exit line; the waiting time of WP platform exit. Wn is the waiting time for other regions.
-
(1)
Walking time t:
$$ T = \sum\limits_{i = 1}^{N} {T_{xi} } = \sum\limits_{i = 1}^{N} {\frac{{L_{xi} }}{{V_{xi} }}} $$(2)\(T_{xi}\) represents the walking time of Xi segment; \(T_{xi}\) represents the distance of Xi segment; \(V_{xi}\) represents the moving speed of Xi segment.
-
(2)
Waiting time WP at platform exit
$$ W_{{\text{p}}} = F_{{\text{p}}} - T_{p} $$(3)FP is the flow time at the exit of the platform; TP is the walking time of the platform.
-
(3)
Waiting time of other circulation areas WN
$$ F_{yi} = \frac{{N_{yi} }}{{C_{yi} }} $$(4)
\(F_{yi}\) is the flow time of the flow area; \(N_{yi}\) is the personnel load of the flow area; \(C_{yi}\) is the maximum capacity.
WN is the waiting time of the flow area; FN is the flow time of the flow area.
3.3 Establishment of passenger flow evacuation time model
The sign of the completion of the passenger flow refuge is that the last person in the passenger flow reaches a safe place. Therefore, the refuge time of passenger flow mainly consists of the following three times. The preparation time of the station is the time for people to pass through the longest refuge path without obstacles. One of the biggest bottlenecks is a refuge route (multiple stations where passengers are cut off at the time) because at one bottleneck. According to the principle of fluid mechanics, the truncation time of the maximum cutoff point only needs to be calculated.
Ttotal is the total evacuation time of passenger flow (s); To is the station preparation time (s); Tave is the time of passing through all horizontal areas in the evacuation path at an unobstructed average horizontal speed; Ti is the time for a single person to pass through all stairs in the evacuation path at an average unstopped speed; Ti is the time when a single person passes through the largest staircase without obstruction; TZ is the time for a single person to pass the gate; T resistance is the time that the last person waits before passing through the bottleneck of the evacuation path; Li is the length of the horizontal area in the I section of the evacuation path; Vave is the average unstopped horizontal speed; Li1 is the length of the ith stair in the evacuation path; VI is the average unstopped stair climbing speed; TIR is the blocking time of the last person passing through the i-flight; TZ refers to the time when the last person in the passenger group passes through the whole staircase in case of obstruction; pave represents the total passenger flow that needs to be evacuated; AI—stair passing capacity; B—stair width; Tr represents the blocking time of the last person passing through the gate; AZ represents the gate passing capacity, and N represents the number of exit gate machines.
3.4 Evaluation index of algorithm performance
In order to quantitatively evaluate the practical performance of the proposed dwica algorithm in the removal of eye artifacts from multi lead EEG signals, this paper compares the dwica algorithm from three aspects: time domain, power spectral density and the correlation degree with the reference signal of synchronous acquisition, so as to show the denoising effect of dwica algorithm, The denoising effect is verified by mean square error RMSE, SNR and running time. The feasibility of the proposed dwica algorithm is evaluated by comparing with ICA, EICA and extended infomax algorithm. The mean square error (RMSE) and signal-to-noise ratio (SNR) are defined as:
\(x_{i}\) is the sample value of the original signal, and \(\hat{x}_{i}\) is the sample value after artifact removal. M is the signal length. The smaller the \(\sum\nolimits_{i = 1}^{M} {(x_{i} - \hat{x}_{i} )^{2} }\) is, the smaller the RMSE value is, and the larger the SNR value is, the better the effect of removing artifacts is.
Secondly, use COR as the correlation coefficient to measure the correlation, the formula is as follows:
\(x_{i} ,y_{i}\) is the two raw signal sample values. \(\overline{x}_{i} ,\overline{y}_{i}\) is the mean value of two original signals. COR is a relational coefficient, and − L < cor < L. For the relational coefficient COR, the closer its value is to 0, the more dissimilar the two signals are, and the closer the cor value to 1 is, the more similar the two signals are. In order to compare the computational complexity of different de artifact algorithms, the algorithm operation time is selected as the measurement index.
4 Establishment of subway evacuation model
4.1 Experimental data collection
The questionnaire in this article covers big cities, small towns, and rural areas. It surveys people's gender, age, and growth background, and finally, what kind of subway sign will be chosen for which city. More formal. More habits, more understanding, etc. The final survey showed three groups with different smoke thicknesses compared to red and green indicator lights.
4.2 EEG
Electroencephalogram (EEG) is the spontaneous and rhythmic activity of brain cells recorded by electrodes. Electroencephalogram (EEG) records the relationship between potential and time by taking the potential of brain cell electrical activity as the vertical axis and time as the horizontal axis. Berger's research in 1933 was affirmed by the famous British physiologist E.D. adrain and others. Since then, EEG has developed rapidly. There have been several detection methods, such as multi lead routine EEG (spontaneous EEG, evoked EEG), sleep EEG, dynamic EEG, time–frequency EEG, etc. Figure 3 shows the EEG topographic map. EEG reflects the electrical activity of brain tissue and the functional state of brain. The analysis of brain signals and the study of the relationship between brain functional state and EEG characteristic signals are hot issues in the research of brain neuroscience and brain cognitive science at home and abroad.

EEG topographic map
For the EEG signal experiment, we recorded the EEG signal data of three channels for 1 s, and the results are shown in Fig. 4:

EEG signal data graph of three channels for 1 s
4.3 Initial position of evacuation personnel
The evac software evacuation simulation model is a fire simulation model based on pyrossim software. The evacuation rate and the number of evacuation parameters are added to achieve the dynamic simulation of the evacuation process. In this model, the distribution of all guardians on the platform is set uniformly, and the specific location is set randomly by the software.
4.4 Evacuation process
To get the best simulation effect, you need to fine tune the parameters. The simulation time was 100 s ago, and the stairs on the right side were mixed, but the left stairs were empty. The main reason for this is that there is a hole in the rule of the software model itself. The guardian does not know the closest stairs but chooses to face the nearest staircase. Therefore, the simulation result of evacuation time in this case takes time more than actual.
5 Subway evacuation signs based on brain component characteristics
5.1 Basic information during metro operation
-
(1)
Population characteristics
Based on the analysis of the crowd characteristics in the normal and low peak periods, the evacuation of the two trains arriving at the station in the normal and low peak periods is simulated and analyzed. The simulated evacuation time in normal and low peak periods is 241.8 s and 193.3 s. The evacuation situation at different times is shown in Table 1. In the objective analysis and evaluation of the high-level cognitive mental activities of the brain, it is difficult for us to analyze consciousness through the changes of a single part of the brain, because specific mental activities cannot be passed such as neuroanalytic biology. The microscopic natural science means to solve it. For EEG signals, due to the complex and irregular EEG components, normal spontaneous EEG is very weak, usually below 75 microvolts.
Table 1 Number of personnel in each period -
(2)
Velocity characteristics
Many scholars at home and abroad have made a lot of observations on the speed of asylum seekers. According to different countries and regions, the average speed of personnel also has certain differences, age, gender, travel purpose, transportation route and other factors will affect the speed of personnel. I used video to observe the moving speed of people on the subway stairs and transfer channels. Taking the entrance of long-distance moving passage and platform of vehicle passage on the west side of line L2 as test points, the observation time is 18:00–19:00 at peak, 10:00–11:00 at peak, and 15:00–16:00 at low peak. According to the above-mentioned age characteristics, the observation values of the movement speed of the people of different ages in different operation periods of stairs and transfer channels are shown in Table 2. Using 2-layer LSTM, the number of nodes is 128. The matrices obtained from the different convolution kernels in the above CNN are arranged in a sequence according to the time dimension, that is, the rows of the same position of the matrix generated by each convolution kernel are spliced together, and then input into the LSTM layer in order for recognition. A separate classifier is constructed for each subject, each subject has 240 samples, 200 are selected as the training set, and 40 are selected as the test set. The average recognition rate is 36.84%, which is not ideal.
Table 2 Movement speed of up and down stairs in different operation periods
5.2 Decision response of different crowd to evacuation signs with different fonts
There are 244 valid questionnaires in this survey. Among them, 78.2% of the total number of people thought that the standard font of black font was the most representative of the emergency exit, accounting for 18.9% of the total, and only 7 people chose cursive font as the first choice. The investigation and statistical analysis of the reasons for people's decision-making show that most people put the standardization of signs in the first place when they choose the emergency exit, so they prefer the black body evacuation signs. Most people think that regular script is more attractive. Few people choose cursive fonts, most of them because they think that cursive fonts are in line with the habit. The obvious degree of the logo, the size of the font, the luminous area of the logo and other factors are the second.
-
(1)
Influence of gender on decision response of evacuation signs with different fonts
According to the statistical analysis of the questionnaire, it is found that the influence of gender on the decision-making response of different font evacuation signs is shown in Table 3.
-
(2)
Influence of growth background on decision response of evacuation signs with different fonts
According to statistics, the influence of growth background on decision-making response of evacuation signs with different fonts is shown in Table 4.
-
(3)
Influence of professional background on decision response of evacuation signs with different fonts
According to the questionnaire survey statistics, the influence of professional background on the decision-making response of different font evacuation signs is shown in Fig. 5. It can be seen from the figure that when using statistical features as input, two algorithms, RBF-SVM and Linear-SVM, are used for emotion recognition, and their accuracy is generally lower than that of the algorithm in this paper. Through the comparison of the accuracy of the algorithm in this paper and the algorithm in the literature, it can be found that this paper takes the pre-processed brain wave signal as input. By adjusting the parameters of the convolutional neural network, the highest accuracy rate of the two-class algorithm can reach 98.8%, and the average accuracy rate is 83.45%, compared with the emotion recognition algorithm of the convolutional neural network that uses statistical features as input, it is significantly improved.

Correlation between professional background and font selection
By adjusting the parameters of the convolutional neural network, compared with the emotion recognition algorithm of the convolutional neural network using statistical features, the highest accuracy rate of the second-class algorithm can reach 98.8%, and the average accuracy rate is 83.45%. In terms of input, it has been significantly improved. Figure 1 shows that most professionals think that bold characters are more reasonable and effective as evacuation signs.
5.3 EEG signal data analysis
5.3.1 Determination of evacuation number
There were 244 valid questionnaires. Among the three groups, images were the most popular choice, accounting for 52.9% of the total. 95 people chose Chinese as their first choice, accounting for 38.9% of the total. English was the first choice, accounting for 8.2% of the total. The investigation on the reasons for the choice shows that the image is more intuitive and obvious when choosing the emergency exit. For most young and middle-aged Chinese mainlanders, Chinese characters are more in line with their habits than English.
-
(1)
Influence of gender on decision response of evacuation signs with different expressions
According to statistics, the influence of gender on decision-making response of evacuation signs with different expressions is shown in Fig. 6. In the process of model training, the value is set to 0.5, and Dropout technology is used for neurons in hidden layer 2 to alleviate the overfitting problem, and the dropout rate is set to 30%. Table 4 shows that when the number of neurons in the two hidden layers is 32 × 6 and 32, the classification accuracy of pleasure and arousal is the highest, which are 73.50% and 73.87%, respectively. When the number of neurons is 32 × 6 and 16, the classification accuracy of likes is the highest, which is 72.80%.
Figure 6 shows that both men and women think that evacuation signs are more often used in graphics and English than in Chinese.
-
(2)
The influence of long back on decision response of evacuation signs with different expressions
The influence of growth background on the decision response of evacuation signs with different expressions is shown in Fig. 7.
-
(3)
The influence of professional background on decision response of evacuation signs with different expressions

The correlation between gender and expression choice

The correlation between growth background and expression choice
The influence of professional background on the decision response of evacuation signs with different expressions is shown in Fig. 8.

Correlation between professional background and choice of expression mode
5.4 Decision response of different crowd to different color evacuation signs
-
(1)
Influence of gender on decision response of evacuation signs with different colors
Among the 172 valid answers, 66 female respondents chose green evacuation sign as the first choice, accounting for 75.8%. Among 106 male respondents, 70 (66.0%) chose green evacuation signs as the first choice. More women use green as a safety color. Table 5 shows the correlation analysis of gender and different color evacuation signs.
-
(2)
Influence of growth background on decision response of evacuation signs with different colors
There were 46 growing up in big cities, of which 35 were the first choice, accounting for 76.1%; 66 were growing in small towns; 47 were green, accounting for 71.2%; 60 were growing in rural areas, and green was the first choice, accounting for 63.3%. Clem coefficient v = 0.178 < 0.3 was weakly correlated. Table 6 shows the correlation analysis of growth background and different color evacuation signs.
Table 6 shows that 287 questionnaires were collected from college students and young and middle-aged technicians, including 172 valid questionnaires, including 106 males and 66 females. Among them, the green sulfur powder label was the first choice of 120, accounting for 69.8% of the total. The Yellow marking lamp was selected in 44 samples, accounting for 25.6% of the total. The red marking lamp was the first 8, accounting for only 4.6% of the total. This part of the survey was carried out among the students of the College of municipal and environmental engineering, most of them are senior students and junior students. Therefore, the only drawback is that the influence of age and professional background on the response to evacuation signs has not been studied.
In the questionnaire, red and green evacuation signs were selected for comparison in smoke environment. In the same thickness of smoke, red is more difficult to disappear in the smoke than green. In this group of comparison, 159 out of 172 (92.4%) thought that red was more eye-catching than green.
5.5 Influencing factors of subway evacuation process
-
(1)
Height of smoke layer
Figure 9 shows the smoke layer height map of different layer areas.
Figure 9 shows that the data graph of smoke height detector at x = − 1. It can be clearly seen that the height of smoke is more than 1.5 m at the beginning, and when it spreads to 9 s, the smoke layer rapidly drops below 1.5 m and maintains until 12 s. At the 12th second, the height of the smoke layer suddenly rises to more than 1.5 m, and then decreases with time.
Fig. 9 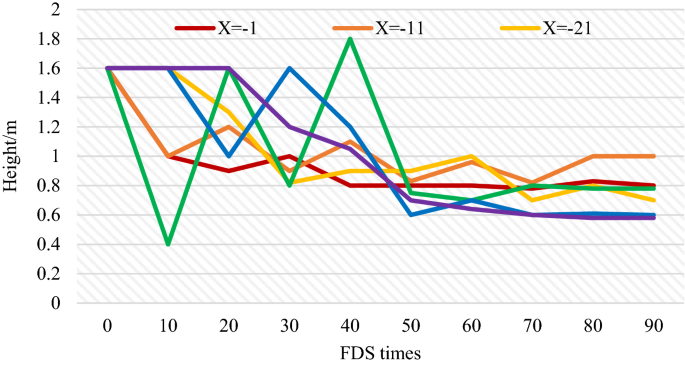
Smoke layer height map in different layer areas
The data map of smoke height detector at x = − 11 can clearly see that the smoke height is more than 1.5 m at the beginning, and when it spreads to 9 s, the smoke layer rapidly drops below 1.5 m and maintains below 1.5 m.
The data map of smoke height detector at x = − 21 can clearly see that the smoke height is above 1.5 m at the beginning, and when it spreads to 13 s, the smoke layer drops below 1.5 m, and remains below 1.5 m.
The data map of smoke height detector at x = − 31 can clearly see that the smoke height fluctuates greatly at this position. At the beginning, the height of smoke was above 1.5 m. When the smoke spread to 10 s, the smoke layer dropped to below 1.5 m, and then to 11 s, the smoke layer rose to more than 1.5 m. In the next two seconds, it began to fluctuate below 1.5 m; at the 14th and 15th seconds, the smoke layer rose to more than 1.5 m. In the next three seconds, it began to fluctuate below 1.5 m; at the 19th and 20th seconds, the smoke layer rose to more than 1.5 m; after 21 s, the height of smoke layer always fluctuated below 1.5 m.
The data map of smoke height detector at x = − 41 can clearly see that the smoke height is above 1.5 m at the beginning, and the smoke layer drops below 1.5 m at the 16th and 17th seconds, and then rises to more than 1.5 m at the 18th, 19th, 20th and 21st seconds. After that, it began to drop below 1.5 m in 1 s, then returned to above 1.5 m and fluctuated continuously for 10 s; at the 33rd second, the height of smoke layer always fluctuated below 1.5 m.
The data map of smoke height detector at x = − 5L can clearly see that the smoke height is above 1.5 m at the beginning, and the smoke layer drops below 1.5 m when it spreads to the 21st second, and then the smoke layer always fluctuates slightly below 1.5 m.
-
(2)
Flue gas temperature
Comparatively speaking, the analysis of flue gas temperature is relatively easy. The data of all flue gas temperature detectors are collected and analyzed in order to obtain complete data with overall distribution characteristics. As shown in Fig. 10, the flue gas temperature diagram of each point is shown. EEG signal is a non-stationary random electrical signal that changes with time. EEG signal acquisition will be affected by various factors, and the statistical characteristics of EEG signals are time-varying, which all reflect the nonstationarity of EEG signals. This leads to traditional signal processing methods and only calculating general statistical characteristics for the processing, analysis and recognition of EEG signals are not very effective.
As can be seen from Fig. 10, the temperature distribution of smoke temperature detectors with x = 1, x = 11, x = 31, x = 41, x = 51 is relatively similar, basically representing time and positive correlation. There is little change in the data. At the position of x = 21, the temperature data of flue gas changes greatly. After the smoke diffused to 42 s, the temperature of x = 1 smoke temperature detector exceeded 100 °C, and then the temperature continued to rise. After the smoke diffused to 39 s, the temperature of x = 11 smoke temperature detector exceeded 100 °C, and then the temperature continued to rise. The temperature of flue gas in x = 31, x = 41 and x = 51 is always less than 100 °C. In the stage of x = 21, smoke will diffuse to the stairs due to its proximity to the stairs, which will be affected by air flow. 98 s ago, only 80 s, 81 s, 90 s, 91 s, 92 s, 93 s, the flue gas temperature will exceed 100 °C, and other times will change under 100 °C. After 98 s, the temperature of flue gas exceeds 100 °C.
Fig. 10 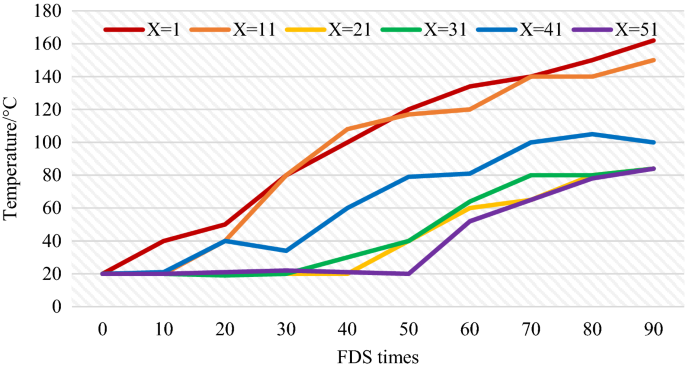
Flue gas temperature diagram of each point
-
(3)
Visibility
Observe the change of visibility during the simulation. At x = 1, x = 11, x = 21, x = 3 l, x = 4L and x = 5L, the time when the visibility began to be lower than 10 m was at the 35th, 33rd, 37th, 46th, 48th and 39th seconds. It can be seen that the position of x = − 41 reaches the critical value at the 48th second. The main reason is that the location is relatively unobstructed around, the speed of flue gas diffusion is relatively fast, and the time consumption of flue gas reinjection to this place is relatively long. Statistical analysis of the above analysis results shows that the time difference of visibility reaching the dangerous approaching value at different positions can be found, as shown in Fig. 11.
Fig. 11 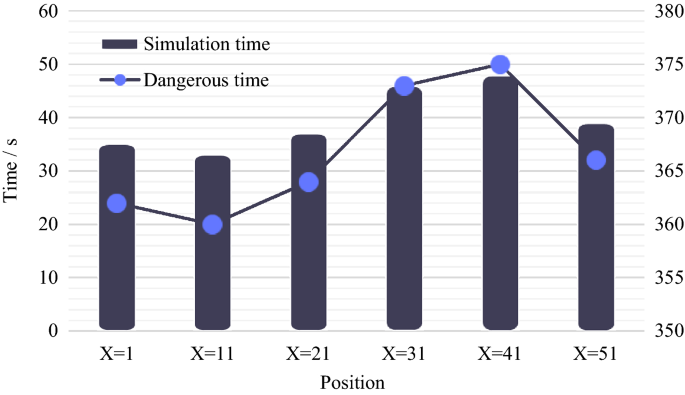
Critical visibility time at each point


It can be seen from Fig. 11 that the subway platform structure is symmetrical. Under the simulation state, the temperature at the symmetrical position is consistent. The simulation results of x = 1, x = 11, x = 21, x = 31, x = 41 and x = 51 are included in the columns x =−1, x =−11, x = − 21, x = − 31, x = − 41 and x = − 51. Table 7 shows the time required for each observation point to reach the critical risk value.
If the visibility is too low when evacuating in a fire, it may make it difficult for the evacuees to find the emergency exit or evacuation direction, which will seriously affect the evacuation effect. The visibility of smoke is different in different space environment. Since the power frequency interference and electromagnetic interference in the experimental environment are often high-frequency interference, this part of the artifacts can be removed by band-pass filtering or low-pass filtering, and only the EEG signals in the effective frequency band are retained. For artifacts such as ocular signals that cannot be removed by filtering, independent component analysis is generally used to find and separate them from EEG signals.
6 Conclusion
This study will combine the shortage of emergency shelters for passenger flow in domestic subway stations, combined with the functions and characteristics of subway passenger stations, and analyze the types of emergencies and the behavior of passengers getting off the train in emergency situations, as well as subway connections. Emergency refuge indication signs and equipment, analysis and research advanced calculation operability simulation expert system theory and methods, research and development of an emergency refuge information disclosure system for passengers to take refuge in the safe operation of subway stations. The subway station provides effective and up-to-date tools. During operation, a large number of passenger flows and emergency passenger flows quickly and effectively provide emergency shelters.
Change history
02 January 2023
This article has been retracted. Please see the Retraction Notice for more detail: https://doi.org/10.1007/s00521-022-08193-2
References
Wang J, Yan W, Xu H et al (2018) Investigation of the probability of a safe evacuation to succeed in subway fire emergencies based on Bayesian theory. KSCE J Civ Eng 22(3):877–886
Wu Y, Xu J, Jia L et al (2018) Estimation of emergency evacuation capacity for subway stations. J Transp Saf Secur 10(1–6):586–601
Yuan Z, Jia H, Zhang L et al (2018) A social force evacuation model considering the effect of emergency signs. SIMULATION 94(8):723–737
Teodosiu CI, Ilie V, Dumitru RG et al (2016) Assessment of ventilation efficiency for emergency situations in subway systems by CFD modeling. Build Simul 9(3):319–334
Pimenta N, Chaves P (2021) Study and design of a retrofitted smart water meter solution with energy harvesting integration. Discov Internet Things 1:10
Jeon GY, Na WJ, Hong WH et al (2019) Influence of design and installation of emergency exit signs on evacuation speed. J Asian Arch Build Eng 18(2):104–111
Munoz JA, Calero V, Marin I et al (2016) Adaptive evacuation management system based on monitoring techniques. IEEE Lat Am Trans 13(11):3621–3626
Ishikawa K, Omori K, Takeuchi I et al (2016) A comparison between evacuation from the scene and interhospital transportation using a helicopter for subarachnoid hemorrhage. Am J Emerg Med 35(4):543–547
Galea ER, Xie H, Deere S et al (2017) An international survey and full-scale evacuation trial demonstrating the effectiveness of the active dynamic signage system concept. Fire Mater 41(5):493–513
Tabachnick AR, Toscano JC (2016) High-pass filtering obscures stimulus encoding characteristics of the auditory brainstem response: evidence from click and tone stimuli. J Acoust Soc Am 140(4):3156–3157
Yousefsani SA, Shamloo A, Farahmand F (2020) Nonlinear mechanics of soft composites: hyperelastic characterization of white matter tissue components. Biomech Model Mechanobiol 19(3):1143–1153
Sotgiu S, Eusebi A, Begliuomini C (2018) Reader response: pregnancy decision-making in women with multiple sclerosis treated with natalizumab: I: Fetal risks. Neurology 91(18):850–850
Golimbet VE, Garakh ZV, Korovaitseva GI et al (2017) Association of the brain-derived neurotrophic factor and serotonin transporter genes with parameters of the early components of event-related potentials on passive word perception. Neur Behav Physiol 47(9):1140–1146
Xiang J, Liu Y, Wang Y et al (2017) Frequency and spatial characteristics of high-frequency neuromagnetic signals in childhood epilepsy. Epileptic Disord 11(2):113–125
Mikhailova ES, Gerasimenko NY, Slavutskaya AV et al (2017) Temporal and topographic characteristics of evoked potentials in the conflict of two consecutive visual stimuli in a working memory task. Hum Physiol 43(3):248–258
Sugawara K, Onishi H, Yamashiro K et al (2016) Effect of range and angular velocity of passive movement on somatosensory evoked magnetic fields. Brain Topogr 29(5):693–703
Almeida KJ, Ânderson BR, Lemos LEAS (2016) Hemotransfusion and mechanical ventilation time are associated with intra-hospital mortality in patients with traumatic brain injury admitted to intensive care unit. Arquivos de neuro-psiquiatria 74(8):644–649
Aas RW, Haveraaen LA, Brouwers EPM et al (2017) Who among patients with acquired brain injury returned to work after occupational rehabilitation? The rapid-return-to-work-cohort-study. Disabil Rehabil 40(21):1–10
Stites MC, Laszlo S (2017) Time will tell: a longitudinal investigation of brain-behavior relationships during reading development. Psychophysiology 54(6):798–808
Flynn M (2017) Visual mismatch negativity to masked stimuli presented at very brief presentation rates. Exp Brain Res 235(2):555–563
Li X, Zhou C, Tian YC (2019) A dynamic decision-making approach for intrusion response in industrial control systems. IEEE Trans Industr Inf 15(5):2544–2554
Garan AD, et al (2018) Response: challenges associated with complex, rapid decision-making in advanced cardiac failure. J Am College Cardiol 71(10):1181–1182
Fernández-Rodríguez D, Cevallos J, Rodríguez-García M (2016) Heart team decision-making in Spain: Is there room for improvement? Response. Revista Espanola De Cardiologia 69(5):534–535
Godo S, Irino S, Nakagawa A et al (2017) Diagnosis and management of patients with paroxysmal sympathetic hyperactivity following acute brain injuries using a consensus-based diagnostic tool: a single institutional case series. Tohoku J Exp Med 243(1):11–18
Von Rhein D, Beckmann CF, Franke B et al (2017) Network-level assessment of reward-related activation in patients with ADHD and healthy individuals. Hum Brain Mapp 38(5):2359–2369
Author information
Authors and Affiliations
Corresponding author
Ethics declarations
Conflict of interest
The author(s) declared no potential conflicts of interest with respect to the research, authorship, and/or publication of this article.
Additional information
Publisher's Note
Springer Nature remains neutral with regard to jurisdictional claims in published maps and institutional affiliations.
This article has been retracted. Please see the retraction notice for more detail:https://doi.org/10.1007/s00521-022-08193-2
Rights and permissions
Open Access This article is licensed under a Creative Commons Attribution 4.0 International License, which permits use, sharing, adaptation, distribution and reproduction in any medium or format, as long as you give appropriate credit to the original author(s) and the source, provide a link to the Creative Commons licence, and indicate if changes were made. The images or other third party material in this article are included in the article's Creative Commons licence, unless indicated otherwise in a credit line to the material. If material is not included in the article's Creative Commons licence and your intended use is not permitted by statutory regulation or exceeds the permitted use, you will need to obtain permission directly from the copyright holder. To view a copy of this licence, visit http://creativecommons.org/licenses/by/4.0/.
About this article

Cite this article
Huang, Y., Cao, D. RETRACTED ARTICLE: Decision response of subway evacuation signs based on brain component features. Neural Comput & Applic 34, 6705–6719 (2022). https://doi.org/10.1007/s00521-021-06150-z
Received:
Accepted:
Published:
Issue Date:
DOI: https://doi.org/10.1007/s00521-021-06150-z