
The Preferences of Different Cultivars of Lettuce Seedlings (Lactuca sativa L.) for the Spectral Composition of Light


1
Department of Vegetable Crops, Poznań University of Life Sciences, ul. Dąbrowskiego 159, 60-594 Poznań, Poland
2
The Franciszek Górski Institute of Plant Physiology, Polish Academy of Sciences, ul. Niezapominajek 21, 30-239 Kraków, Poland
*
Author to whom correspondence should be addressed.
Agronomy 2021, 11(6), 1211; https://doi.org/10.3390/agronomy11061211
Submission received: 29 April 2021
/
Revised: 10 June 2021
/
Accepted: 13 June 2021
/
Published: 15 June 2021
(This article belongs to the Special Issue Sustainable Urban Agriculture in the 21st Century)
Abstract
:The spectrum of light significantly influences the growth of plants cultivated in closed systems. Five lettuce cultivars with different leaf colours were grown under white light (W, 170 μmol m−2 s−1) and under white light with the addition of red (W + R) or blue light (W + B) (230 μmol m−2 s−1). The plants were grown until they reached the seedling phase (30 days). Each cultivar reacted differently to the light spectrum applied. The red-leaved cultivar exhibited the strongest plasticity in response to the spectrum. The blue light stimulated the growth of the leaf surface in all the plants. The red light negatively influenced the length of leaves in the cultivars, but it positively affected their number in red and dark-green lettuce. It also increased the relative chlorophyll content and fresh weight gain in the cultivars containing anthocyanins. When the cultivars were grown under white light, they had longer leaves and higher value of the leaf shape index. The light-green cultivars had a greater fresh weight. Both the addition of blue and red light significantly increased the relative chlorophyll content in the dark-green cultivar. The spectrum enhanced with blue light had positive influence on most of the parameters under analysis in butter lettuce cultivars. These cultivars were also characterised by the highest absorbance of blue light.
1. Introduction
Artificial lighting is one of the main parameters of cultivation, which significantly affects the growth and quality of plants cultivated in closed systems, controlled environment agriculture (CEA) or vertical farms. Lettuce can be successfully grown in controlled growing systems due to its relatively short growing period and small size. Currently light-emitting diodes (LEDs) are used as a source of light in closed systems to use energy efficiently. One of the main advantages of LEDs is the possibility to place them close to plants, because they generate low thermal radiation while generating a high flux of photosynthetically active photons. Apart from that, LEDs are durable, have low operating costs and it is possible to control the spectral composition of light they generate [1].
The potential of LEDs as effective light sources for indoor horticulture production has been extensively investigated. Initial experiments on the growth of lettuce under red LEDs were conducted by Bula et al. [2]. Several experiments showed that blue light (400–500 nm) combined with red light generated by LEDs affected the morphology, growth, and photosynthesis of vegetables. Naznin et al. [3] observed that coriander plants cultured under different ratios of red to blue light from LEDs had higher content of fresh and dry matter than the plants cultured under 100% red light. A combination of red and blue light from LEDs proved to effectively stimulate the growth of various plant species, including lettuce, in controlled environments [4,5]. Schwalb et al. [6] studied the effect of different ratios of red (660 nm) and blue (435 nm) light from LEDs on the photosynthesis of lettuce and petunia seedlings grown with and without background broadband high-pressure sodium radiation. They observed that the optimum photosynthesis occurred when lettuce was grown within a red-to-blue ratio of 5:1–15:1. Terashima [7] measured plants’ absorption of blue and red light from LEDs and found that it amounted to 90%. This means that plant development and physiology is strongly influenced by blue or red light [8].
Johkan et al. [9] observed that green light from LEDs with high PPF (300 μmol m−2 s−1) enhanced the growth of lettuce plants. Seedlings grown under green, red, and blue LEDs grew taller than those grown under red (630 nm) and blue light (470 nm) alone [10]. Moreover, recent studies showed that different wavelengths had synergistic effects on photosynthesis, although their interaction has not been investigated [11]. Generally, broad-spectrum LEDs are preferred in horticultural production as they enable better visual assessment of plants. The growth of crops under these lights is comparable or better than under monochromatic LEDs [12,13]. In conclusion, it can be said that plants are characterised by morphological plasticity to changes in the light quality. Therefore, the optimisation of the light spectrum for photosynthesis, growth and better productivity is an important goal in advanced plant production systems [14]. Moreover, instead of using a one-size-fits-all approach, lighting recipes targeting different growth stages should be determined for different species [15].
The optical properties of leaves are diverse and depend on the pigment composition and stage of ontogenesis. The leaf pigmentation is important for the spectral properties of the plant tissue [16]. The amount of solar radiation absorbed by leaves is a function of the photosynthetic pigment content. Chlorophylls and carotenoids are the main pigments of green leaves [17]. Purple and red lettuce leaves also contain anthocyanins.
Plants grown in closed systems without sunlight require a proper light spectrum, which can be selected by analysing the leaf absorption spectrum. Information on the absorption of radiation and the resulting photosynthetic reactions, as well as changes in the optical properties of leaves, can be a sensitive indicator of the physiological state of the plant and can characterise its needs, especially for photosynthetically active radiation [18].
It is known that white light with broad spectrum is optimal for plant growth. However, the proportion of B/R light is also very important, especially under a low light regime. The optimal light spectrum depends not only on species and developmental stage, but also on cultivar. Furthermore, it might be different depending on leaf colour. Therefore, the objective of this study was to determine how the growth parameters of lettuce seedlings grown under white light were influenced by additional illumination with blue and red light. The sensitivity of lettuce with different leaf colours to diverse light spectra was also determined.
2. Materials and Methods
2.1. Plant Material and Growth Conditions
Seeds of five lettuce (Lactuca sativa L.) cultivars (Rijk Zwaan) were sown in multipots (7 × 9 × 5 cm) filled with peat substrate used for the production of vegetable seedlings (Klasmann-Deilman, Geeste, Germany). Eight plants of each cultivar were grown in each combination in a growth chamber. The cultivars differed in the colour of leaves (Table 1).
The temperature in the growth chamber was maintained at 22 °C until the seeds emerged. During the growing period the day/night temperature was 18/15 °C. The air humidity was maintained at 65–70%. The photoperiod was 16/8 h (day/night). The plants were grown until the seedling phase. The cultivation period after sowing lasted about 30 days. The multipots were placed on drainage mats.
2.2. Treatment of Light
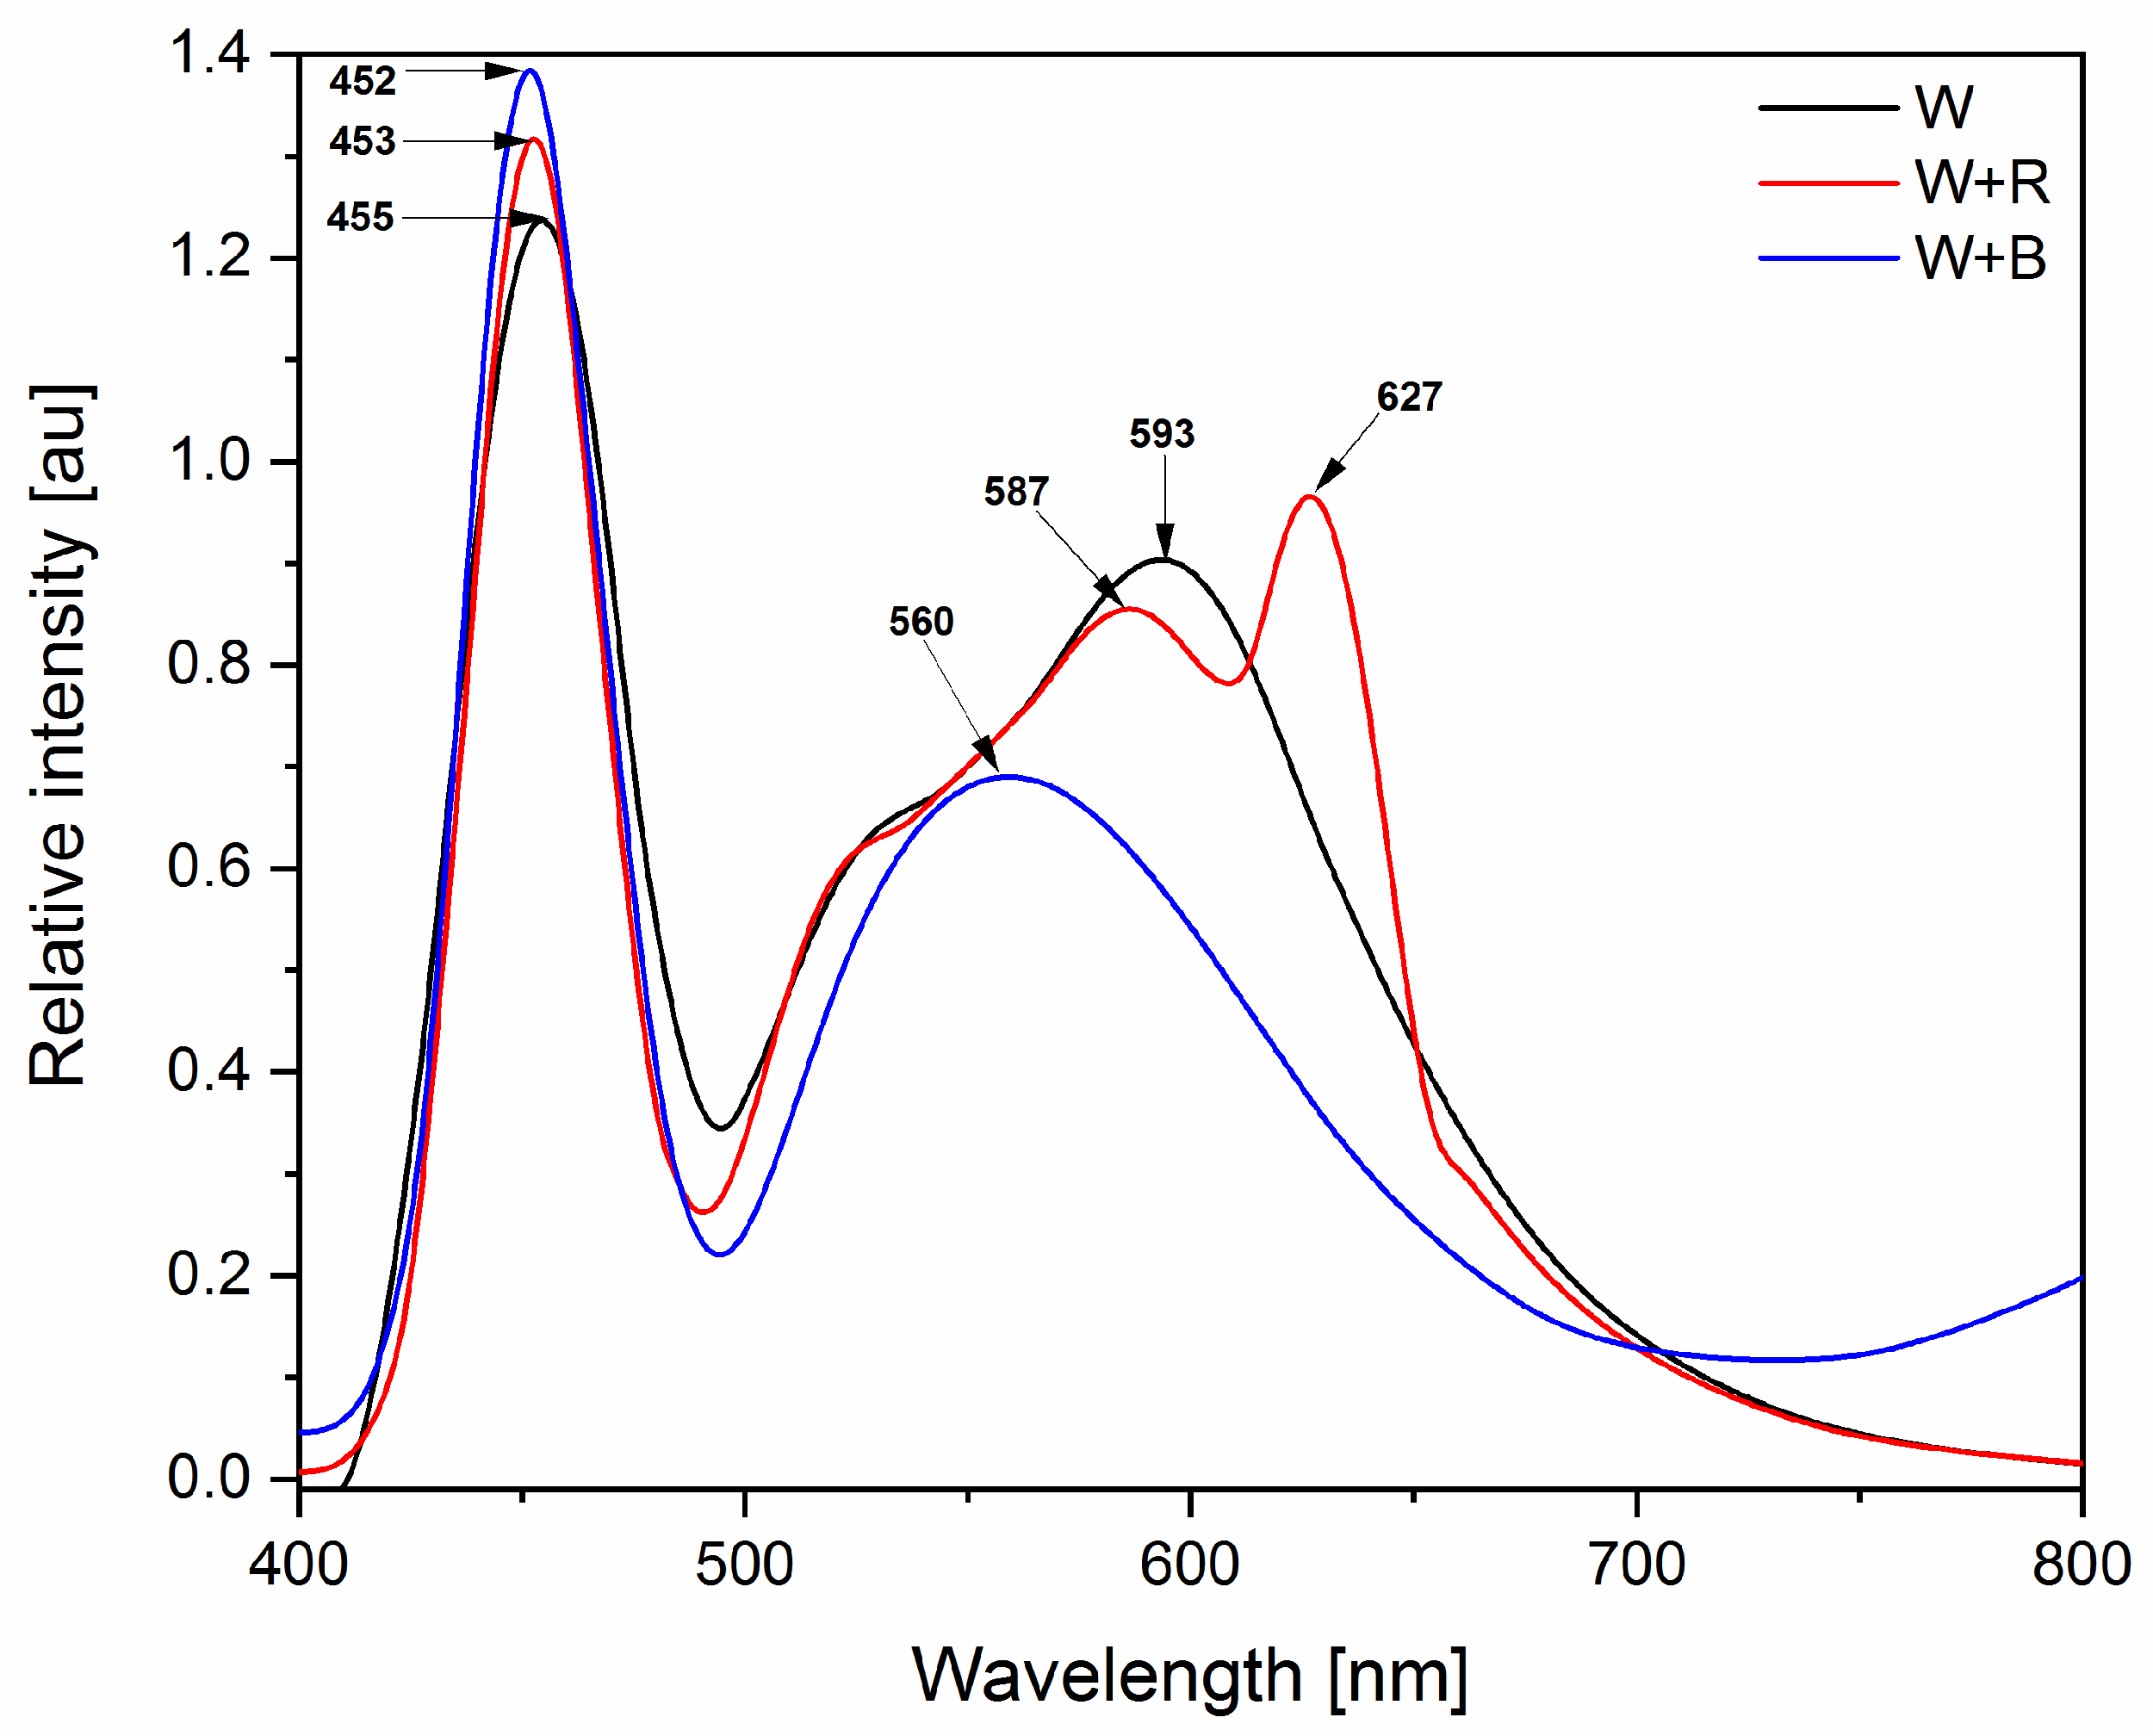
The plants were irradiated with different light spectra: white light (W), white light with red light (W + R), and white light with blue light (W + B). The red, blue and white light came from a high-power solid-state lighting module (LED) (SMD type, Seoul Semiconductor, South Korea). The spectra of individual types of light were determined with a StellarNet apparatus—see Figure 1. The photosynthetic photon flux density (PPFD) from the top of the plants amounted to about 170 μmol m−2 s−1 (± 14 SD) for white light (W) and, additionally, 60 μmol m−2 s−1 (± 8 SD) for blue (B) and red (R) light (the R/B ratios for W, W + R and W + B lights were 0.87, 2.86, and 0.29, respectively). The PPFD for W + R and W + B light combinations amounted to about 230 μmol m−2 s−1. The daily light integral (DLI) was about 9.8 mol m−2 d−1 for white light and about 13.2 mol m−2 d−1 for W + R and W + B lights. The measurements were made 15 cm under the lamps, more or less at the height of the plants’ tops. As the plants grew, the lamps were gradually raised to a higher position.
2.3. Plant Measurements and Experimental Design
2.3.1. Growth Parameters
Biometric measurements were made at the seedling stage, (18-19 BBCH-scale). The length and width of leaves (four fully developed leaves collected from each plant), shoot fresh weight, leaf area of the whole seedling and dry weight of each plant were measured. Dry weight was calculated by drying the material to a constant weight at 105 °C for 24 h. The leaf rosette area and dry weight [m2 g−1 DM] were used to calculate specific leaf area (SLA) and leaf shape indices, i.e., the leaf length-to-width ratio.
2.3.2. Content of Chlorophyll
The relative chlorophyll content in the day before harvest was measured with a CCM-200 plus Chlorophyll Content Meter apparatus (Opti-Sciences, Hudson, NH, USA) on four randomly selected leaves of each plant.
2.3.3. Fluorescence
The dark-adapted parameters were used to determine the maximum quantum yield of PS II (photosystem II): Fv/Fm = (Fm − Fo)/Fm (Fo—the dark adapted initial minimum fluorescence, Fm—the maximum fluorescence measured during the first saturation pulse after dark adaption) [19]. The plants’ fluorescence was measured with an OS1p chlorophyll fluorometer (Opti-Sciences, Hudson, NH, USA). The measurements were made in the dark after the plants had been kept out of light for at least 30 min. The measurements were made on a fully grown leaf for each plant.
2.3.4. Light Absorption
Absorbance (A) was calculated from the logarithmic ratio of the intensity of the incident light (I0) and the intensity transmitted through the leaves (I). The measurements were made in the morning during the last four days of vegetation using a Miniature Fiber Optic Spectrometer (StellarNet, Inc., Tampa, FL, USA).
A = log10 (I0/I)
The absorbance results were used to prepare a lettuce leaf light absorption spectrum for each of the cultivars, depending on the spectral composition of light.
2.4. Statistical Analysis
The research was conducted as a two-factorial experiment in eight replicates as an independent design. One plant was treated as one replicate. The investigations were conducted in two cycles (replications after each other). The results were the means of the two cycles. The data were analysed with ANOVA. Differences between the means were estimated with the Newman–Keuls test at a significance level α = 0.05. The data were analysed statistically with the Statistica program (StatSoft, Kraków, Poland).
Principal component analysis (PCA) was applied to find correlations between the measured parameters and the spectral composition of light. Hierarchical cluster analysis (HCA) was used to find similarities and differences between the types of lettuce, depending on the spectral composition of light. The Euclidean distance was used in the HCA. The distance between similar groups was measured by means of the Ward algorithm. OriginLab 2020 software was used for the PCA, HCA and absorption spectra.
3. Results
3.1. Shoot Fresh and Dry Weight
Individual cultivars differed considerably in their reaction to the spectral composition of light. The exposure of the Aleppo cultivar to W light resulted in the highest increase in its shoot fresh weight, which was 35% greater than under W + R light and as much as 100% greater than under W + B light (Figure 2A). The enhancement of the spectrum with R light caused the highest increase in fresh weight of the Prunei cultivar (270% greater than under W light and 46% greater than under W + B light). It also resulted in the highest fresh weight of leaves among all the cultivars under study. W + B light resulted in the highest increase in shoot fresh weight of the Skyphos cultivar, which was 36% and 45% greater than under W + R light and W light, respectively. The light spectrum did not cause such significant differences in fresh weight of other cultivars (e.g., Quintus and Ferrado). There were similar dependencies observed for dry weight (DW, Figure 2B). Among all cultivars Prunai presented the highest DW under W + R.
3.2. Total Leaf (Seedling) Area
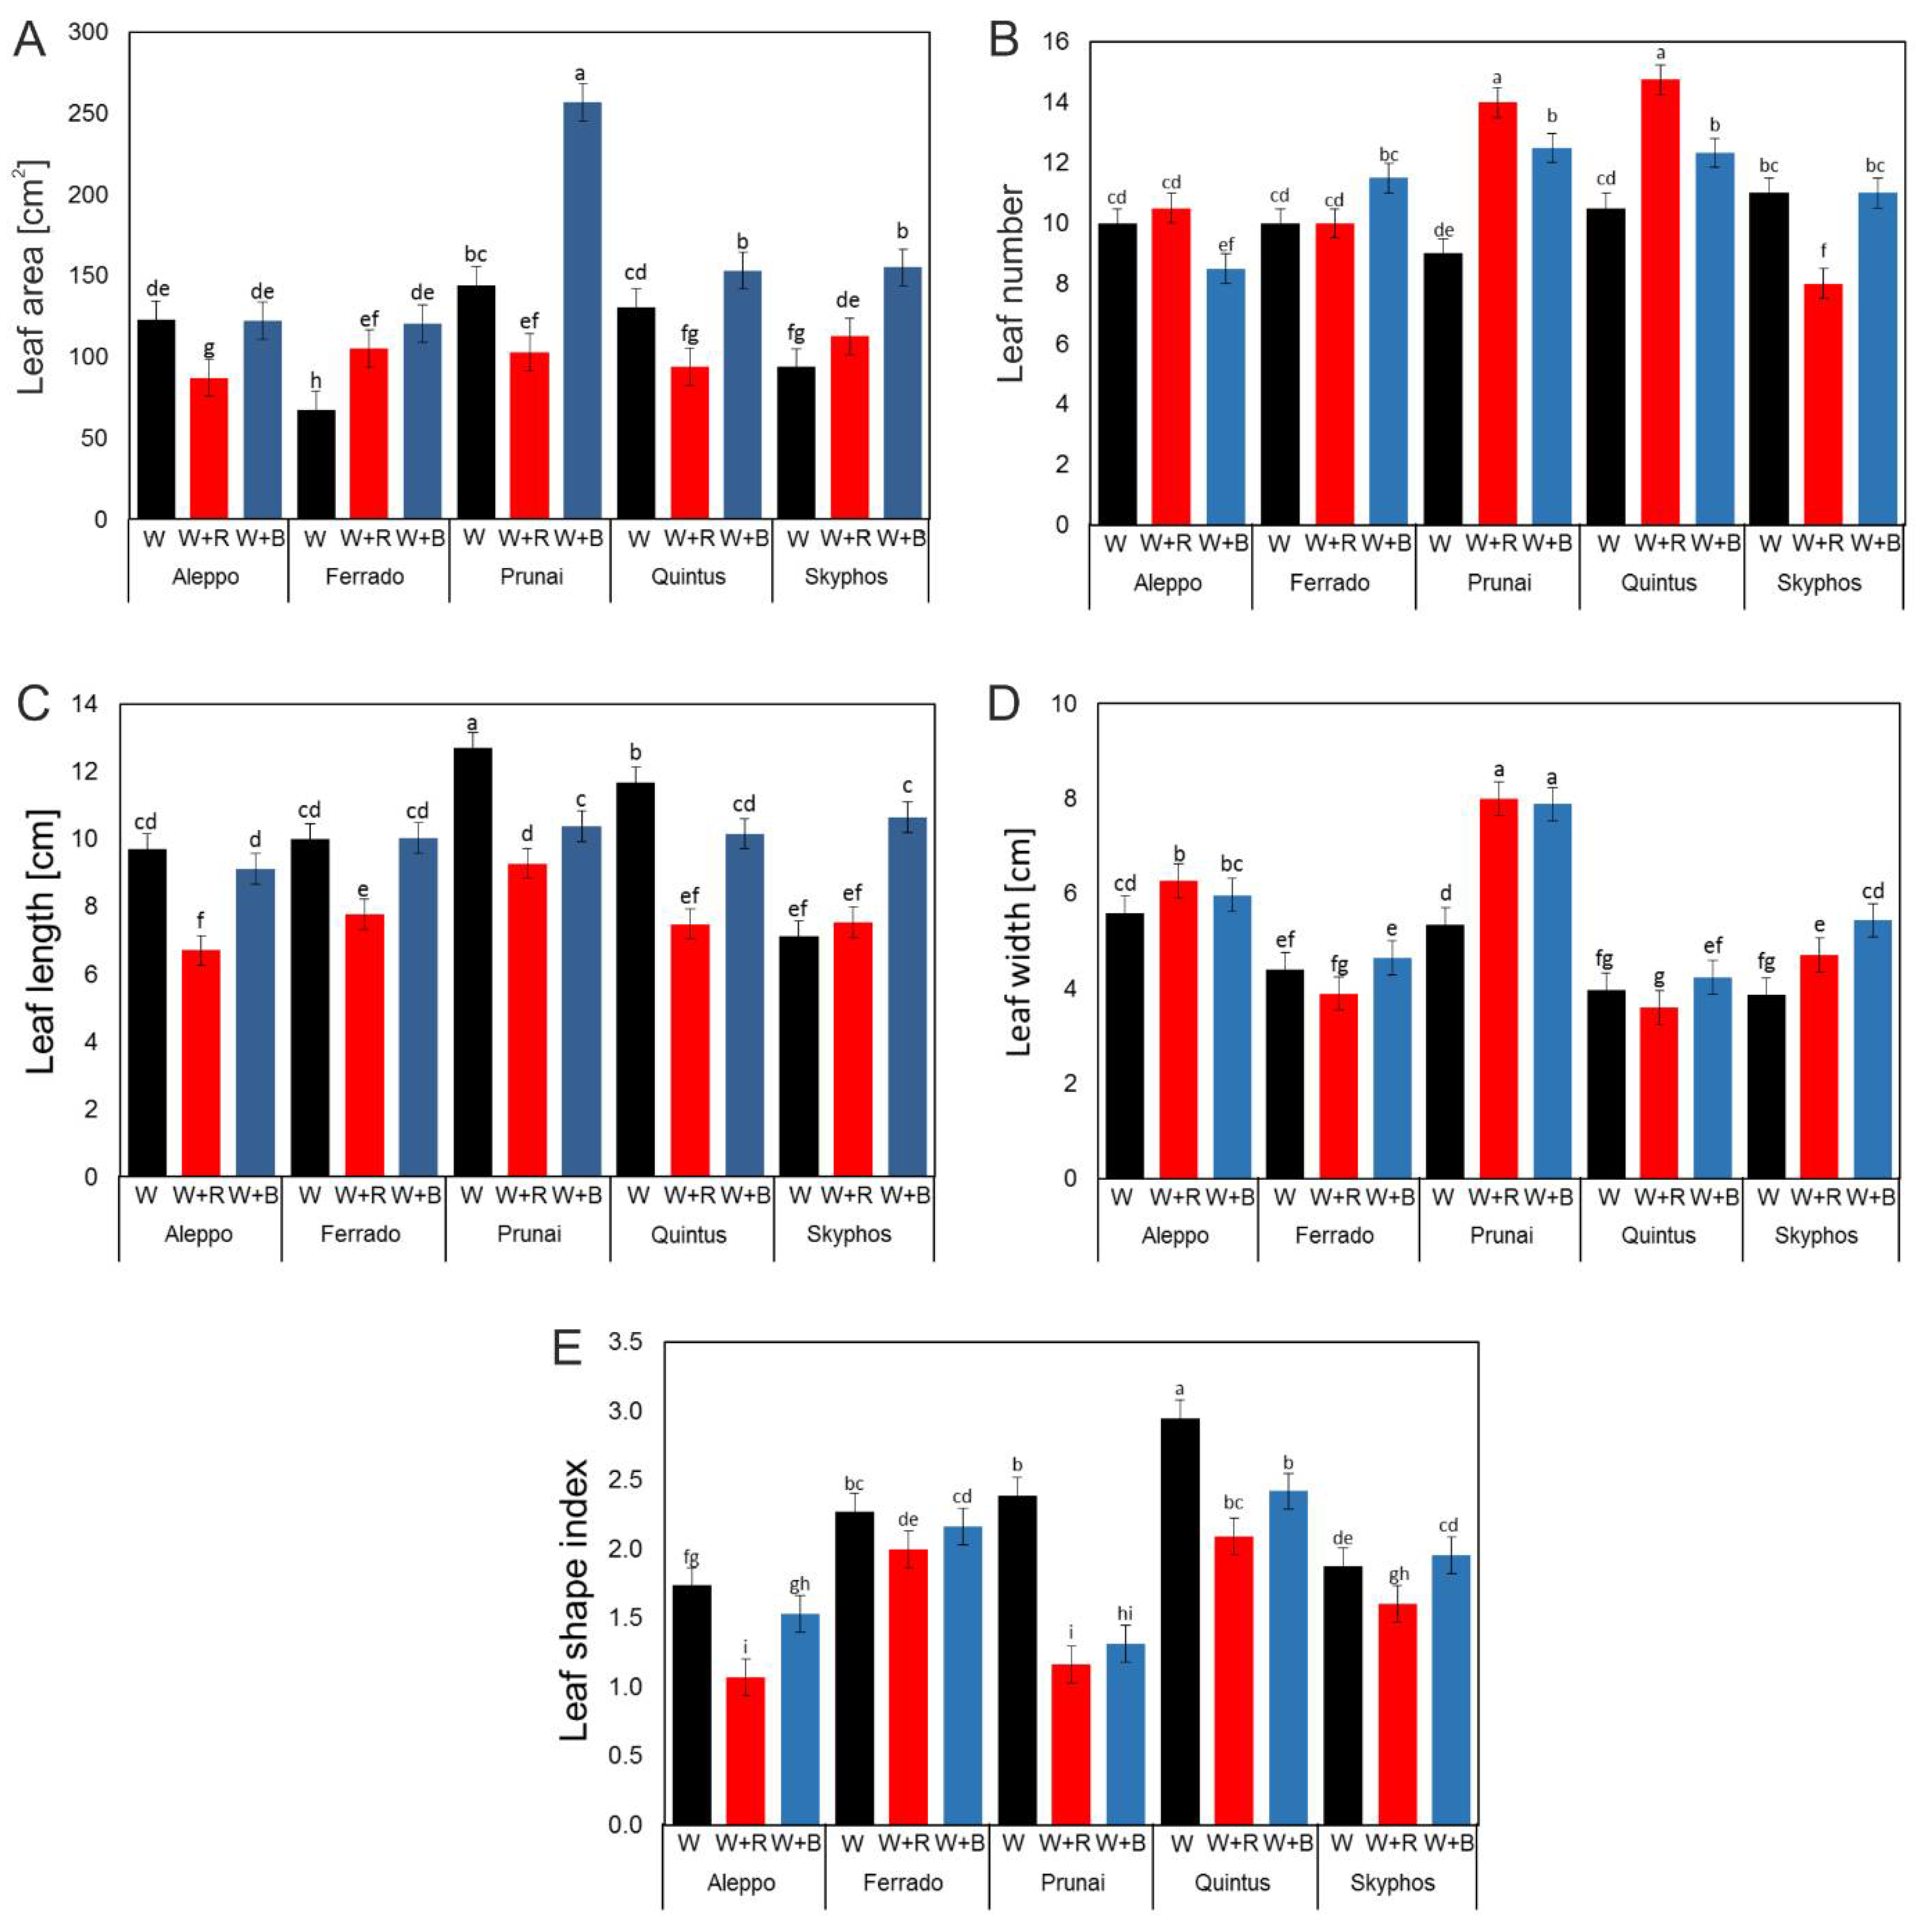
The area of seedlings was not correlated with fresh weight. However, the exposure to W + B light increased leaf area in all lettuce cultivars, except the Aleppo cultivar, where similar results were obtained for both W and W + B lights (Figure 3A). The exposure to W + B light resulted in the largest leaf area in the Prunai cultivar. On the other hand, the exposure to W + R light reduced leaf area in the Aleppo, Prunai and Quintus cultivars. Only in the Ferrado cultivar leaf area was similar for both W + R and W + B light and higher than for W light.
3.3. Number, Length and Width of Leaves
The enhancement of the spectrum with R and B lights had a significant effect on the number of leaves, but there were usually small differences between the combinations (Figure 3B). The biggest differences were observed in the Prunai and Quintus cultivars grown under W + R and W lights (55% and 40%) and in the Skyphos cultivar grown under W and W + B lights compared to W + R light (37%). The largest number of leaves was found in the Prunai and Quintus cultivars grown under W + R light—11.8 and 12.5, respectively.
W light elongated the leaves in the Prunai and Quintus cultivars (Figure 3C). The longest leaves were observed in the Prunai cultivar under W light. W + B light resulted in a similar leaf length in all the cultivars and in the Aleppo and Ferrado cultivars similar to one under W light. On the other hand, W + R light visibly inhibited leaf elongation. Leaves of the plants grown under W + R light were 11–36% shorter than those grown under W + B light and 28–56% shorter than those exposed to W light. The only exception was the Skyphos cultivar, whose leaves were the longest under W + B light and similar under W and W + R lights.
W + B and W + R lights increased leaf width in the Prunai, and Skyphos cultivars (Figure 3D). The biggest differences in leaf width were found for the Prunai cultivar between W light and the spectrum enhanced with R or B lights.
The highest value of the leaf shape index was observed in the Quintus cultivar under W light (Figure 3E). Moreover, in the Aleppo and Prunai cultivars the highest value of this index was noted under W light. The addition of red or blue light to W light significantly reduced leaf shape index in these cultivars. The smallest differences were found in the Ferrado cultivar. The Aleppo and Skyphos cultivars under W + B light were characterised by the same value of this index compared to W light. On the other hand, the addition of red light reduced the value of the leaf shape index in both cultivars.
3.4. SPAD, SLA and Fluorescence
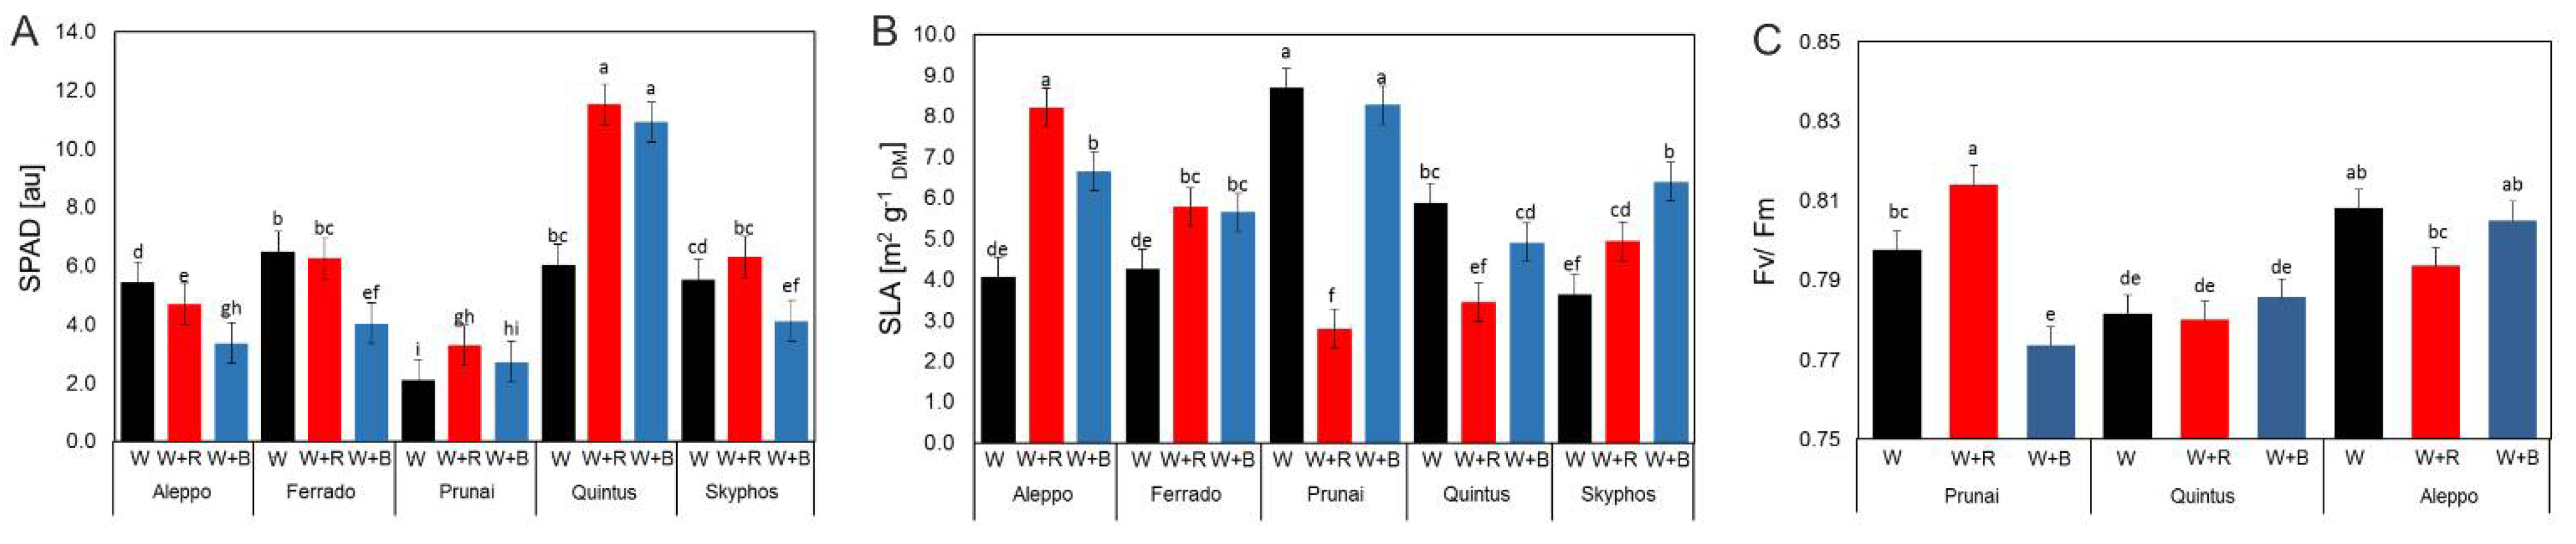
The highest relative chlorophyll content (SPAD) was noted for the Quintus cultivar under W + R and W + B lights (Figure 4A). It was almost twofold higher than under W light and at least twofold higher than in the other combinations. The enhancement of light spectrum with B light (W + B light) reduced SPAD value in the Ferrado, Skyphos and Aleppo cultivars. In the Aleppo cultivar also the addition of R light reduced SPAD value, as compared with SPAD value under W light.
There were considerable differences in the specific leaf area (SLA), i.e., the ratio of leaf area to dry weight, depending on the cultivar and the spectral composition of light (Figure 4B). The lowest SLA value was noted for the Prunai cultivar under W + R light. It was almost threefold lower than under the other lights. It is noteworthy that this cultivar in this combination was also characterised by the highest fresh and dry weights. There were similar dependencies observed for the Quintus cultivar. The highest SLA value was obtained also for the Prunai cultivar under W and W + B lights, as well as for the Aleppo cultivar under W + R light.
The highest chlorophyll fluorescence was noted for the Aleppo cultivar under W and W + B lights and for the Prunai cultivar under W + R light (Figure 4C). The Prunai cultivar exposed to W + R combination was also characterised by the highest fresh weight. This cultivar was also characterised by the lowest chlorophyll fluorescence under W + B light. The Quintus cultivar had similar fluorescence and fresh weight values in all the combinations.
3.5. Leaf Biometric Parameters vs. Spectral Composition of Light
The PCA showed a positive correlation between the leaf biometric parameters (leaf width, leaf area, and leaf length) and between the number of leaves, dry weight, and SPAD. There was a negative correlation between the SPAD and SLA values (Figure 5A).
The HCA showed similarities and differences between the lettuce cultivars and the spectral composition of light within the parameters under analysis. The spectral compositions of light (W, W + R, and W + B) had the strongest influence on the Prunai cultivar, which was the only one with red leaves. The biometric parameters, as well as the SPAD and SLA indices of this cultivar, differed depending on the spectral composition of light (Figure 5A). Prunai was the only cultivar for which three separate groups were distinguished (Figure 5B). The plants grown under the W + R light combination were the next group with similar leaf and growth parameters. The plants grown under the W + B light combination were the third group with similar leaf and growth parameters. The similarity of lettuce grown under white light to the plants exposed to the other spectral compositions of light was cultivar-dependent. The parameters of the butter lettuce cultivars (Ferrado and Skyphos) grown under W + B light (Figure 5B, blue group) differed from those of the plants growing under white and W + R lights (Figure 5B, red group). As far as the other cultivars (Aleppo, Quintus) are concerned, there was a similarity between the plants grown under white light and those exposed to W + B light (Figure 5B, blue group).
3.6. Foliar Light Absorption
The analysis of the light absorption spectra as well as the PCA and HCA showed that individual lettuce cultivars, which differed in the thickness and colour of leaves, had different preferences for the spectral composition of light.
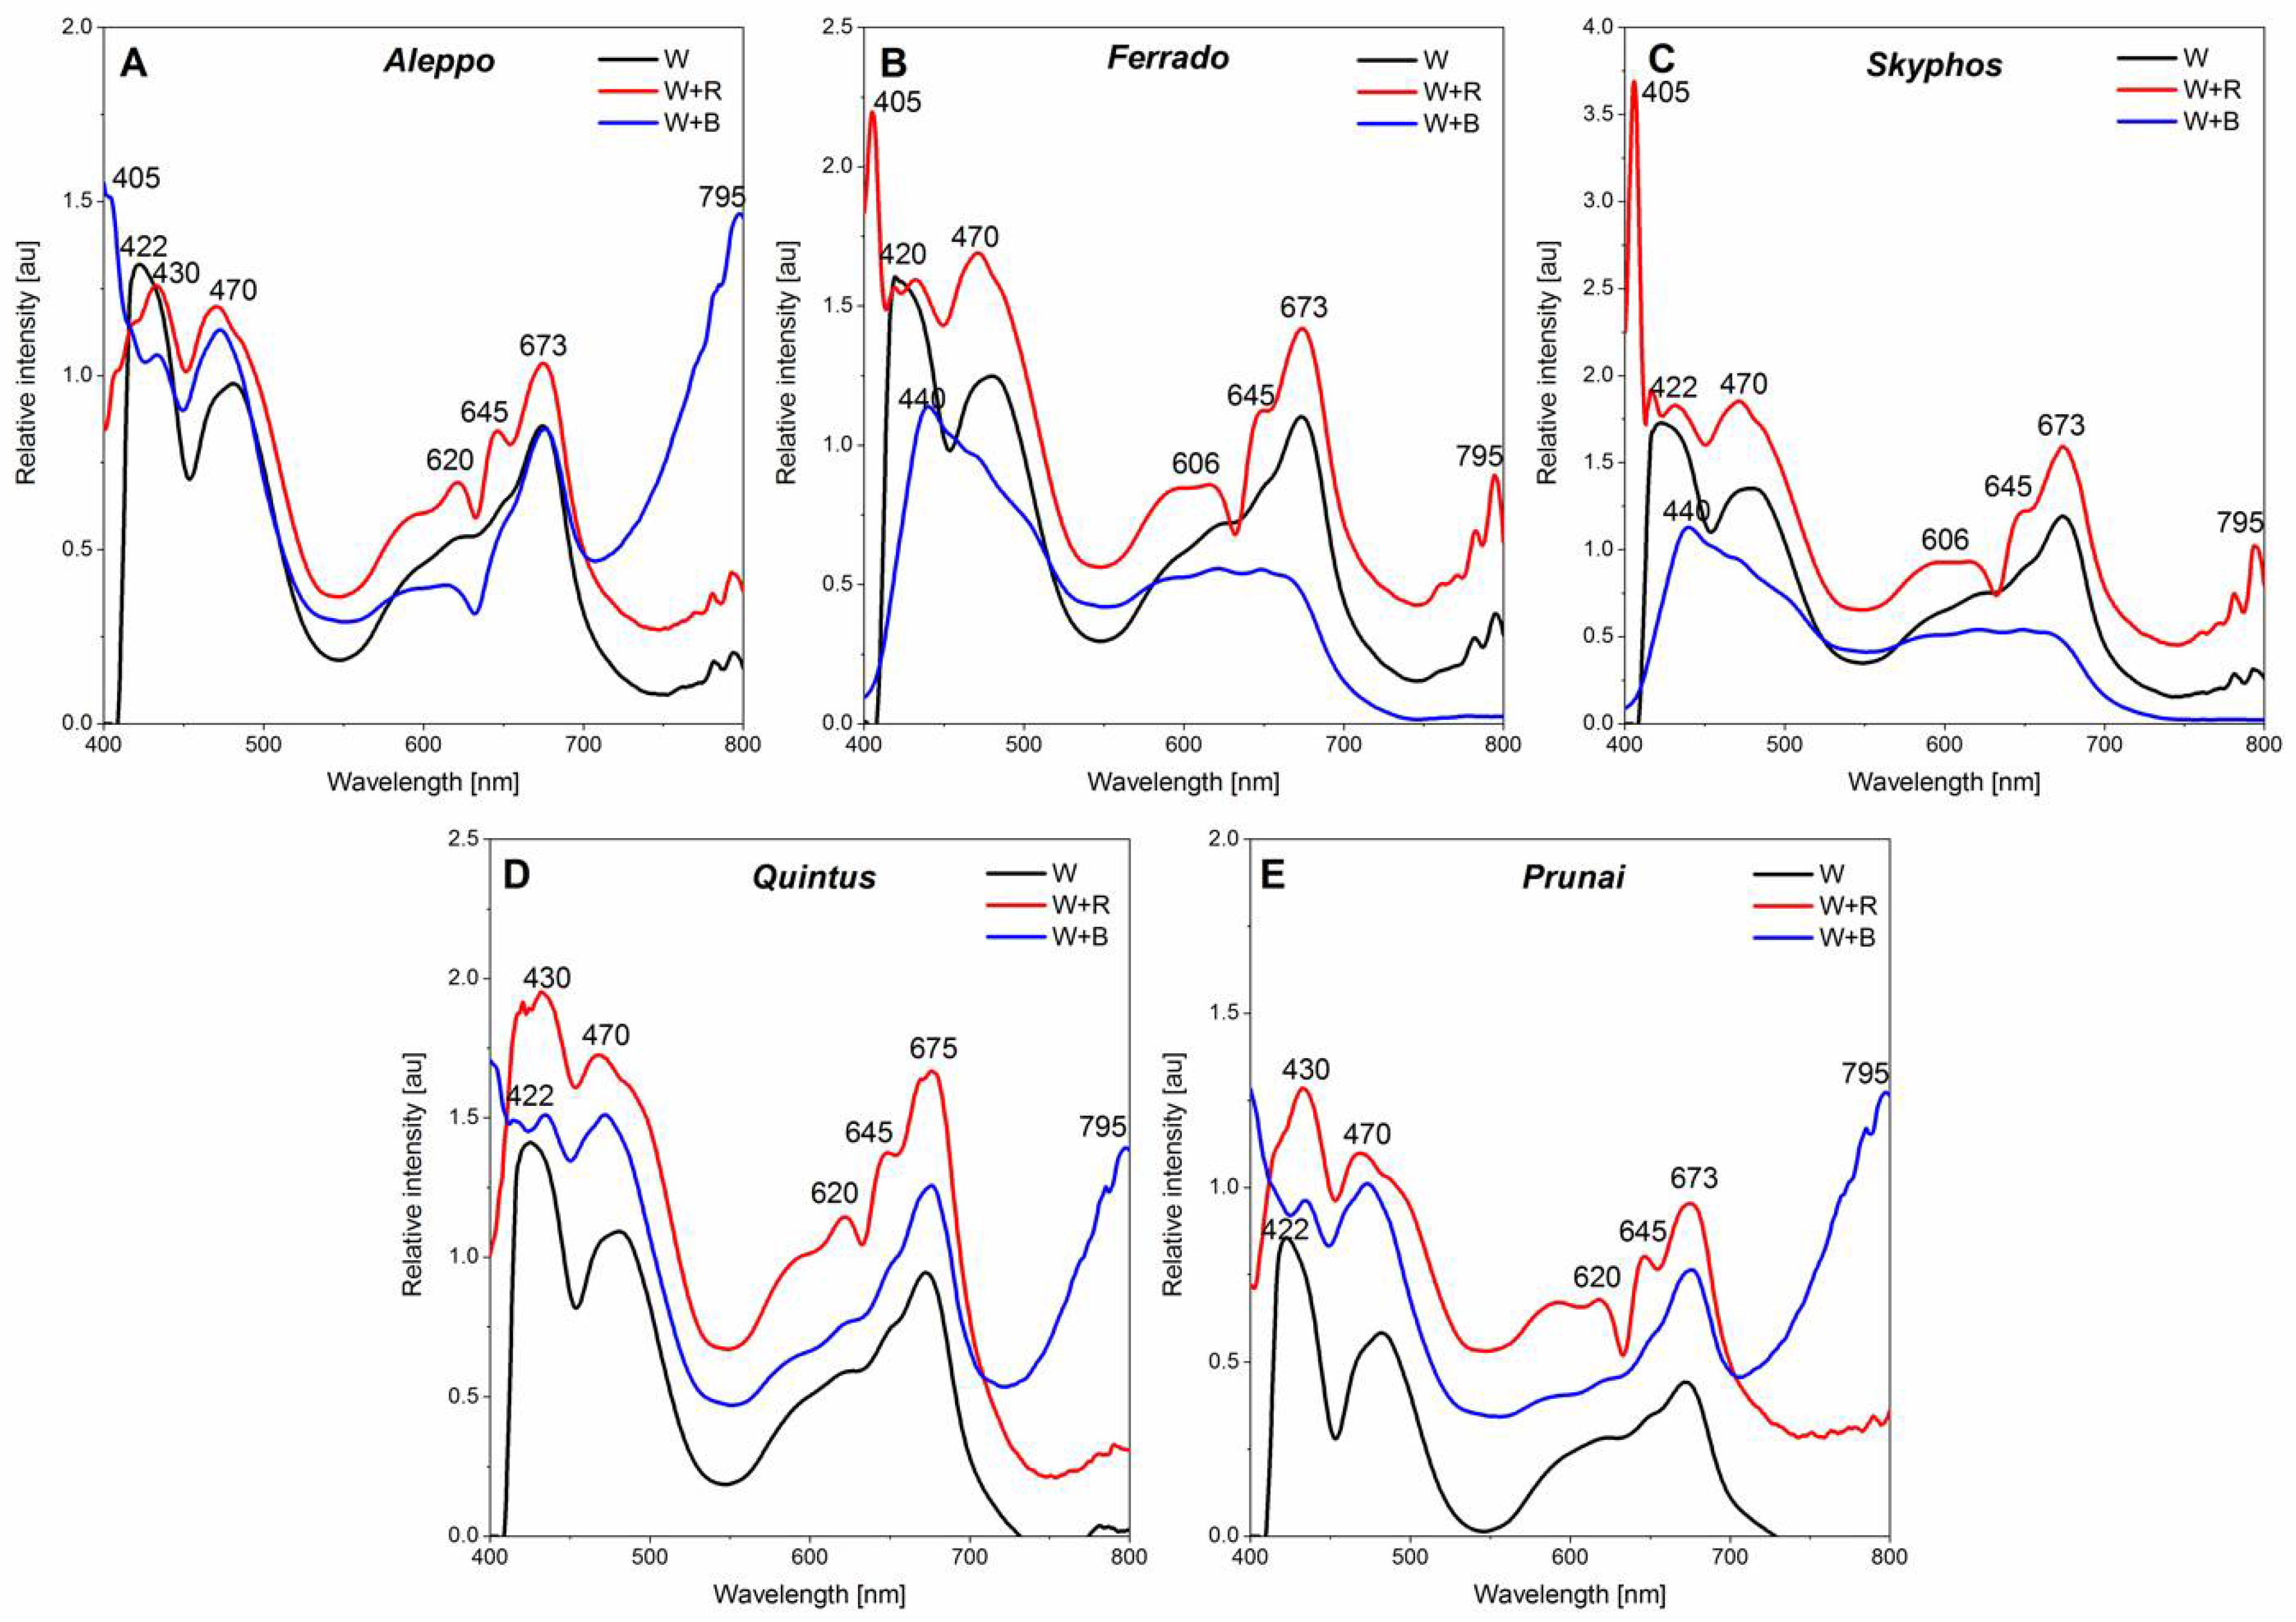
The highest light absorption intensity was noted in the plants grown under W + R light, regardless of the cultivar (Figure 6A–E). The butter lettuce cultivars (Ferrado and Skyphos) differed considerably from the other cultivars in their intensity of individual wavelengths and preferences for different wavelengths. Both cultivars exhibited very high wavelength absorbance at 405 nm when exposed to W + R light and no absorbance at 795 nm when exposed to W + B light, as compared with the other lettuce cultivars. In addition, the wavelength absorbance at 470 nm in both butter lettuce cultivars was higher or the same as at 422 nm (Figure 6B,C). The other lettuce cultivars did not exhibit such wavelength absorbance (Figure 6A,D,E). The Ferrado and Skyphos cultivars also differed from the other lettuce cultivars in the lack of absorbance at 620 nm and higher absorbance at 606 nm. The Ferrado and Skyphos cultivars did not exhibit noticeable absorbance when exposed to W + B light. This may have been caused by the lesser preference of these cultivars for this light spectrum (Figure 6B,C).
4. Discussion
Light is one of the most important environmental factors influencing plant growth. Although it is a well-known fact that light intensity may positively influence plant growth, the effects of light quality are more complex, and the results are usually considerably diversified.
4.1. DLI and Spectrum
The experiment was conducted under two daily light integrals which amounted to about 9.8 mol m−2 d−1 for white light and about 13.2 mol m−2 d−1 for W + R and W + B lights. Theoretically, there should greater plant growth parameters at a higher DLI. However, this dependency was not observed in our study. Some cultivars had the best parameters under W light, or their parameters were close to those of the plants grown under W + R or W + B lights. However, it is noteworthy that our experiment was conducted on plants at an early growth phase, which had lower light requirements.
Chen et al. [20] observed that the plants grown under W light and illuminated with B or R light were characterised by the highest fresh weight and chlorophyll content. Both ranges of the light band had a similar effect on these parameters. According to these authors, differences in the lettuce growth parameters may be influenced either by the total amount of R and B light photons or by their R/B ratio. In their study the lettuce biomass was more sensitive to the number of photons. In our research the R/B ratios for W, W + R and W + B lights were 0.87, 2.86 and 0.29, respectively. The total amount of photons in the R and B light spectra in the W + R and W + B combinations was respectively the same and 34% greater than for the W light. However, most of the parameters were influenced by the R/B ratio more than by the total amount of photons.
4.2. Fresh and Dry Weight
Fresh weight of the lettuce depended on both the spectral composition of light and the cultivar. Each cultivar reacted differently to the light spectrum used. This indicates that the plant growth responses to the light spectrum are not only species- but also cultivar-dependent [21,22]. The Aleppo cultivar with light-green and delicate leaves achieved the highest fresh weight under white light. This means that W light was sufficient for this cultivar, and its additional enhancement with R light, or especially with B light, inhibited the fresh weight increase. Interestingly, when the Aleppo cultivar was exposed to W light, it had the highest relative chlorophyll content (also under W + B light) and the lowest SLA value. The dark red leaves of the Prunai cultivar achieved the highest fresh weight under W + R light. Similarly, Johkan et al. [23] observed that R light caused an increase in the fresh weight of the red-leaved lettuce, but only at the initial growth period. According to Meng et al. [24], a spectrum with a low ratio of B to R radiation may maximise yield of red lettuce during production. However, the Skyphos cultivar with red and green leaves achieved the highest fresh weight under W + B light. The spectrum of light had the smallest influence on the fresh weight of the Ferrado and Quintus cultivars.
Johakan et al. [22] observed that the red and green lettuce seedlings which initially had been grown under B light had lower fresh weight than the seedlings grown under R light, B + R (1:1) and W light. However, after another period of cultivation under sunlight the plants which had earlier been grown under B and B + R lights had the highest fresh weight. According to these authors, the increase in the yield of lettuce may be caused by the high antioxidative activity in seedlings grown under blue LEDs. There were similar results in a study by Amoozgar et al. [25]. Lin et al. [5] observed that R + B + W light resulted in a greater fresh weight than R + B and fluorescent light. According to these authors, R + B + W light may significantly increase the growth of plants due to better penetration of their surface. Moreover, the R + B + W light spectrum is the closest to the spectrum of sunlight. However, some authors observed the highest fresh weight of lettuce under dominant R light [21,26]. These differences in the results show that lettuce exhibits high plasticity and sensitivity to the applied spectral composition of light.
A higher DLI usually increases the dry weight of lettuce shoots [27]. However, our study did not confirm this dependency for the cultivars with delicate, light-green leaves, where the highest dry weight was observed at a lower DLI (Aleppo) or there were no differences between the combinations (Skyphos—W = W + R = W + B, Ferrado—W = W + R).
4.3. Leaf Area (LA)
Most of the cultivars in our study were characterised by a high LA when they were grown with the spectral enhancement of B light. Earlier studies showed that a higher share of B light in the spectrum may reduce leaf area [28], especially at low DLI [29]. Wang et al. [30] observed that the lettuce leaf area increased proportionally to the increase in the R/B ratio. The largest leaf area was noted at R/B = 12 and when the plants were grown only under R light. On the contrary, in our study the spectrum enhanced with R light had a negative influence on leaf area in three cultivars. However, in our study the plants grew under the full spectrum of W light to which B or R light was added. The results may suggest that other wavelengths also interact with B and R light and affect the leaf morphology. For example, Zhou et al. [22] noted that the crops grown under W light had a higher LA than the ones exposed to B and R light in various proportions. Mickens et al. [12] found that the morphological parameters of lettuce plants grown under W light with both R and B light added had lower values than those grown under other light combinations (white light, white and far-red light, red and green light, white and green light). The research by Dougher and Bugbee [31] showed that lettuce was very sensitive to B light. Moreover, a later study conducted by these authors [32] showed that a higher share of B light in the spectrum caused an increase in the lettuce leaf area as a consequence of an increase in cell expansion and cell division. Clavijo-Herrera et al. [33] observed an increase in the lettuce leaf area as the share of B light in the spectrum increased. In our study the smallest influence of blue light on LA was noticed in cultivars with light-green leaves. On the other hand, earlier studies showed that a higher share of B light in the spectrum noticeably inhibited the growth and yield of lettuce [21,24,34]. The share of far-red (FR) in the spectrum is also important. Although the share of R light in the spectrum was similar, the R/FR proportion in W + R light was very high. Lee et al. [35] found that a low R/FR ratio stimulated the growth of the fresh weight of lettuce mainly by increasing the expansion of the leaf surface, as compared with plants grown only under R + B light. According to Zou et al. [36,37], lettuce is very sensitive to the FR spectrum, which stimulates the expansion of leaves. It is particularly important for young plants with a limited leaf area to capture radiation for photosynthesis. A higher leaf area under W + B light in our study may have been caused by the interaction of B and FR light.
4.4. Number of Leaves and Leaf Shape Index
Many authors stress the fact that R light stimulates an increase in the number of lettuce leaves [20,30]. Meng et al. [23] also observed the largest number of leaves in the spectrum without B light. The R/B ratio did not affect the number of lettuce leaves in the study by Nanzin et el. [38]. In our study the effect of light spectrum on the number of leaves varied depending on the cultivar. It was the highest under W + R light, for red (Prunai) and dark-green cultivars (Quintus). Although for some cultivars the spectrum enhanced with B light strongly influenced the number of leaves.
Generally, at higher light intensity leaves are thicker and have a smaller area [29]. This dependency was not observed in our study. It was the cultivar and the composition of the light spectrum rather than the DLI that influenced the morphological traits of the leaves.
Son and Oh [21] found that leaf shape index in the spectrum without B light was significantly higher than in the other variants containing B light. In our study R light inhibited leaf shape index in some cultivars. For the most cultivars the highest value was achieved under W light or both W and W + B light. This may have been caused by the low R/FR ratio in W and W + B lights, as compared with W + R light. According to Lee et al. [35], the share of FR in the spectrum and a low R/FR ratio increase leaf shape index. In our study the increase in leaf shape index under W light and, for some cultivars, under W + B light, indicates that the leaf growth was caused by an increase in the leaf length rather than width.
4.5. SLA, SPAD and Photosynthesis Parameter
SLA characterises the surface absorbing radiation, so it indirectly influences the use of solar energy reaching the soil, and thus the production of biomass. In many species SLA level decreases along with leaf size, but this is not a strict rule [39]. In our study this relation was observed only for the Aleppo cultivar. There was a positive correlation between leaf area and SLA in the other cultivars but we didn’t find any correlation between SLA and shoot fresh mass. Some authors [26,40] observed that SLA were significantly increased by a higher R light fraction in BR light ratios. In our experiment, B light caused an increase in SLA for some cultivars. Hanyu and Shoji [41] showed that when spinach was irradiated briefly with blue light, SLA increased significantly. Interestingly, in other research transplant lettuces grown under 100% R or 100% B light had the highest SLA compared to another combinations of R and B light [42].
Earlier studies showed that an increase in the share of B light in the spectrum caused an increase in the chlorophyll concentration in leaves [21,29]. In our study a high share of B light (39%) had a negative effect on the relative chlorophyll content in the lettuce leaves, except for the dark-green Quintus cultivar. Such a large amount of B light in the spectrum and a more than threefold lower share of R light may have reduced the plants’ chlorophyll biosynthesis capacity. The same effect may have been caused by a very small amount of B light. Moreover, the share of B light in the other combinations (17% and 13%) was close to natural sunlight (18%) and this value may have been sufficient to stimulate chlorophyll biosynthesis in the light-green and red lettuce leaves. Many authors believe that a 5–12% share of B light in relation to R light is sufficient for proper chlorophyll biosynthesis [40,43,44]. Nanzin et al. [38] observed that when the share of B light in the spectrum increased from 9% to 17%, the total chlorophyll content in lettuce leaves decreased.
In general, a higher share of B light in the spectrum causes an increase in the Fv/Fm value in lettuce leaves by increasing the efficiency of the photosynthetic apparatus [21,26]. The results of our study did not confirm this relationship, except in the Aleppo cultivar. Each cultivar achieved the highest Fv/Fm value for a different light combination, although these results were correlated with the dry matter content in the leaves. The Fv/Fm value was below the optimal value (0.800). However, it is necessary to remember that the study was conducted on seedlings, where this value may be lower at this growth stage [26].
4.6. Foliar Absorbance
According to Viršilė et al. [45], the sensitivity of lettuce plants to the light spectrum is determined by the metabolic plasticity of cultivars. This relationship was confirmed in our study, where the absorbance of light differed in a cultivar-dependent manner. The highest light absorbance intensity was observed under W + R light. This finding is consistent with the results of earlier studies on the role of R light in the cultivation of plants in closed systems. The cultivars with light-green (Aleppo) and red (Prunai) leaves were characterised by the lowest absorption of R light. According to Inada [46], light-green leaves have a weaker peak within the range of R light. Moreover, leaves containing anthocyanins absorb much less R light [47]. Interestingly, the red-leaved cultivar (Prunai) was characterised by the greatest variability of the parameters under analysis, which depended on the spectral composition of light. According to Inada [46], purple leaves differ from green leaves in their response to a variable spectrum of light. This dependency was also observed in our study.
5. Conclusions
Both our study and the research conducted by other authors showed that lettuce plants exhibited diverse reactions to B and R light, which depended on various factors, including the composition of the entire light spectrum, the plant development phase, cultivar and leaf colour. The research results showed that at the initial stage of growth lettuce exhibited high sensitivity to the light spectrum, and its absorbance largely depended on the colour and thickness of leaves. It is important to note that plants are influenced not only by a single wavelength, but also by the entire light spectrum, i.e., the proportions and share of individual wavelengths and their interaction. As lettuce is characterised by such high plasticity, it is very important to select the right spectrum. Therefore, W light with a similar composition to sunlight can be used as the base. Additional illumination with R or B light can be used in a cultivar-dependent manner in order to achieve specific effects. For example, if the most important factor in cultivation is fresh weight, then supplementation with red light is beneficial for red-leaved cultivars, while for cultivars with light-green, delicate leaves there is no need to use additional light. Similarly, in the case of cultivars with thick and dark-green or green-red leaves, if the number of leaves is treated as the most important feature of plants, then it is beneficial to illuminate the dark-green and red plants with red light.
Author Contributions
Conceptualization, B.F.; methodology, B.F. and M.K.-M.; software, M.K.-M.; writing—original draft preparation, B.F. and M.K.-M.; writing—review and editing, B.F.; visualization, M.K.-M.; project administration, B.F.; funding acquisition, B.F. All authors have read and agreed to the published version of the manuscript.
Funding
Publication was co-financed within the framework of the Polish Ministry of Science and Higher Education’s program: “Regional Initiative Excellence” in the years 2019–2022 (No. 005/RID/2018/19)”, financing amount 1,200,000 PLN.
Institutional Review Board Statement
Not applicable.
Informed Consent Statement
Not applicable.
Data Availability Statement
Data sharing not applicable.
Conflicts of Interest
The authors declare that there are no conflict of interest related to this article.
References
- Xu, Y. Nature and source of light for plant factory. In Plant Factory Using Artificial Light, 1st ed.; Anpo, M., Fukuda, H., Wada, T., Eds.; Elsevier: Amsterdam, The Netherlands, 2019; pp. 47–69. [Google Scholar] [CrossRef]
- Bula, R.J.; Morrow, R.C.; Tibbits, T.W.; Barta, R.W.; Ignatius, R.W.; Martin, T.S. Light emitting diodes as a radiation source for plants. Hort. Sci. 1991, 26, 203–205. [Google Scholar] [CrossRef] [Green Version]
- Naznin, M.T.; Lefsrud, M.; Gravel, V.; Hao, X. Different ratios of red and blue LEDs light effects on coriander productivity and antioxidant properties. Acta Hortic. 2016, 1134, 223–229. [Google Scholar] [CrossRef]
- Folta, K.M.; Koss, L.L.; McMorrow, R.; Kim, H.H.; Kenitz, J.D.; Wheeler, R.; Sager, J.C. Design and fabrication of adjustable red–green–blue LED light arrays for plant research. BMC Plant. Biol. 2005, 5, 1–11. [Google Scholar] [CrossRef] [Green Version]
- Lin, K.H.; Huang, M.Y.; Huang, W.D.; Hsu, M.H.; Yang, Z.W.; Yang, C.M. The effects of red, blue, and white light-emitting diodes on the growth, development, and edible quality of hydroponically grown lettuce (Lactuca sativa L. var. capitata). Sci. Hortic. 2013, 150, 86–91. [Google Scholar] [CrossRef]
- Schwalb, M.; Naznin, M.T.; Lefsrud, M. Determination of the effect of red and blue ratios of LED light on plant photosynthesis. In Topics in Growth Chambers and Controlled Environments 2; Lecture notes in growth chambers and controlled environments 2; American Society for Horticultural Sciences: Orlando, FL, USA, 2014; p. S241. [Google Scholar]
- Terashima, I.; Fujita, T.; Inoue, T.; Chow, W.S.; Oguchi, R. Green light drives leaf photosynthesis more efficiently than red light in strong white light: Revisiting the enigmatic question of why leaves are green. Plant. Cell Physiol. 2009, 50, 684–697. [Google Scholar] [CrossRef] [Green Version]
- Olle, M.; Viršile, A. The effects of light-emitting diode lighting on greenhouse plant growth and quality. Agric. Food Sci. 2013, 22, 223–234. [Google Scholar] [CrossRef]
- Johkan, M.; Shoji, K.; Goto, F.; Hahida, S.; Yoshihara, T. Effect of green light wavelength and intensity on photomorphogenesis and photosynthesis in Lactuca sativa. Environ. Exp. Bot. 2012, 75, 128–133. [Google Scholar] [CrossRef]
- Folta, K.M. Green light stimulates early stem elongation, antagonizing light-mediated growth inhibition. Plant. Physiol. 2004, 135, 1407–1416. [Google Scholar] [CrossRef] [Green Version]
- Zhen, S.; van Iersel, M.W. Far-red light is needed for efficient photochemistry and photosynthesis. J. Plant. Physiol. 2017, 209, 115–122. [Google Scholar] [CrossRef] [Green Version]
- Mickens, M.A.; Skoog, E.J.; Reese, L.E.; Barnwell, P.L.; Spencer, L.E.; Massa, G.D.; Wheeler, R.M. A strategic approach for investigating light recipes for ‘Outredgeous’ red romaine lettuce using white and monochromatic LEDs. Life Sci. Space Rese. 2018, 19, 53–62. [Google Scholar] [CrossRef]
- Park, Y.; Runkle, E.S. Spectral effects of light-emitting diodes on plant growth, visual color quality, and photosynthetic photon efficacy: White versus blue plus red radiation. PLoS ONE 2018, 13, E0202386. [Google Scholar] [CrossRef] [Green Version]
- Terfa, M.T.; Solhaug, K.A.; Gislerød, H.R.; Olsen, J.E.; Torre, S. A high proportion of blue light increases the photosynthesis capacity and leaf formation rate of Rosa × hybrida but does not affect time to flower opening. Physiol. Plant. 2013, 148, 146–159. [Google Scholar] [CrossRef]
- Wong, C.E.; Teo, Z.W.N.; Shen, L.; Yu, H. Seeing the lights for leafy greens in indoor vertical farming. Trends Food Sci. Technol. 2020, 106, 48–63. [Google Scholar] [CrossRef]
- Féret, J.B.; Gitelson, A.A.; Noble, S.D.; Jacquemoud, S. PROSPECT-D: Towards modelling leaf optical properties through a complete lifecycle. Remote Sens. Environ. 2017, 193, 204–215. [Google Scholar] [CrossRef] [Green Version]
- Hatfield, J.L.; Gitelson, A.A.; Schepers, J.S.; Walthall, C.L. Application of Spectral Remote Sensing for Agronomic Decisions. Agron. J. 2008, 100, 117–131. [Google Scholar] [CrossRef] [Green Version]
- Kuleshova, T.E.; Seredin, I.S.; Cheglov, S.A.; Blashenkov, M.N.; Chumachenko, A.V.; Feofanov, S.V.; Odnoblyudov, M.A. Spectrometric method for measuring light absorption by plant leaves. J. Phys. Conf. Ser. 2018, 1135, 012013. [Google Scholar] [CrossRef] [Green Version]
- Maxwell, K.; Johnson, G.N. Chlorophyll fluorescence—A practical guide. J. Exp. Botany 2000, 51, 659–668. [Google Scholar] [CrossRef]
- Chen, X.; Xue, X.; Guo, W.; Wang, L.; Qiao, X. Growth and nutritional properties of lettuce affected by mixed irradiation of white and supplemental light provided by light-emitting diode. Sci. Hortic. 2016, 200, 111–118. [Google Scholar] [CrossRef]
- Son, K.H.; Oh, M.M. Leaf shape, growth, and antioxidant phenolic compounds of two lettuce cultivars grown under various combinations of blue and red light-emitting diodes. Hort. Sci. 2013, 48, 988–995. [Google Scholar] [CrossRef]
- Zhou, C.; Zhang, Y.; Liu, W.; Zha, L.; Shao, M.; Li, B. Light quality affected the growth and root organic carbon and autotoxin secretions of hydroponic lettuce. Plants 2020, 9, 1542. [Google Scholar] [CrossRef]
- Jokhan, M.; Shoji, K.; Goto, F.; Hashida, S.N.; Yoshihara, T. Blue light-emitting diode light irradiation of seedlings improves seedling quality and growth after transplanting in red leaf lettuce. Hort. Sci. 2010, 45, 1809–1814. [Google Scholar] [CrossRef] [Green Version]
- Meng, Q.W.; Boldt, J.; Runkle, E.S. Blue radiation interacts with green radiation to influence growth and predominantly controls quality attributes of lettuce. J. Am. Soc. Hortic. Sci. 2020, 145, 75–87. [Google Scholar] [CrossRef] [Green Version]
- Amoozgar, A.; Mohammadi, A.; Sabzalian, M.R. Impact of light-emitting diode irradiation on photosynthesis, phytochemical composition and mineral element content of lettuce cv. Grizzly. Photosynthetica 2017, 55, 85–95. [Google Scholar] [CrossRef]
- Azad, M.O.K.; Kjaer, K.H.; Adnan, M.; Naznin, M.T.; Lim, J.D.; Sung, I.J.; Park, C.H.; Lim, Y.S. The evaluation of growth performance, photosynthetic capacity, and primary and secondary metabolite content of leaf lettuce grown under limited irradiation of blue and red led light in an urban plant factory. Agriculture 2020, 10, 28. [Google Scholar] [CrossRef] [Green Version]
- Both, A.J.; Albright, L.D.; Langhans, R.W.; Reiser, R.A.; Vinzant, B.G. Hydroponic lettuce production influenced by integrated supplemental light levels in a controlled environment agriculture facility: Experimental results. Acta Hort. 1997, 418, 45–51. [Google Scholar] [CrossRef]
- Wollaeger, H.M.; Runkle, E.S. Growth of impatiens, petunia, salvia, and tomato seedlings under blue, green, and red light-emitting diodes. Hort. Sci. 2014, 49, 734–740. [Google Scholar] [CrossRef]
- Hernández, R.; Kubota, C. Growth and morphological response of cucumber seedlings to supplemental red and blue photon flux ratios under varied solar daily light integrals. Sci. Hortic. 2014, 173, 92–99. [Google Scholar] [CrossRef]
- Wang, J.; Lu, W.; Tong, Y.; Yang, Q. Leaf morphology, photosynthetic performance, chlorophyll fluorescence, stomatal development of lettuce (Lactuca sativa L.) exposed to different ratios of red light to blue light. Front. Plant. Sci. 2016, 7, 250. [Google Scholar] [CrossRef] [Green Version]
- Dougher, T.A.; Bugbee, B. Differences in the response of wheat, soybean and lettuce to reduced blue radiation. Photochem. Photobiol. 2001, 73, 199–207. [Google Scholar] [CrossRef]
- Dougher, T.A.; Bugbee, B. Long-term blue light effects on the histology of lettuce and soybean leaves and stems. J. Am. Soc. Hortic. Sci. 2004, 129, 467–472. [Google Scholar] [CrossRef] [Green Version]
- Clavio-Herrera, J.; van Santen, E.; Gómez, C. Growth, water-use efficiency, stomatal conductance, and nitrogen uptake of two lettuce cultivars grown under different percentages of blue and red light. Horticulture 2018, 4, 16. [Google Scholar] [CrossRef] [Green Version]
- Kang, W.H.; Park, J.S.; Park, K.S.; Son, J.E. Leaf photosynthetic rate, growth, and morphology of lettuce under different fractions of red, blue, and green light from light-emitting diodes (LEDs). Hortic. Environ. Biotechnol. 2016, 57, 573–579. [Google Scholar] [CrossRef]
- Lee, M.J.; Son, K.H.; Oh, M.M. Increase in biomass and bioactive compounds in lettuce under various ratios of red to far-red LED light supplemented with blue LED light. Hortic. Environ. Biotechnol. 2016, 57, 139–147. [Google Scholar] [CrossRef]
- Zou, J.; Zhang, Y.; Zhang, Y.; Bian, Z.; Fanourakis, D.; Yang, Q.; Li, T. Morphological and physiological properties of indoor cultivated lettuce in response to additional far-red light. Sci. Hortic. 2019, 257, 108725. [Google Scholar] [CrossRef]
- Zou, J.; Zhou, C.; Xu, H.; Cheng, R.; Yang, Q.; Li, T. The effect of artificial solar spectrum on growth of cucumber and lettuce under controlled environment. J. Integr. Agric. 2020, 19, 2027–2034. [Google Scholar] [CrossRef]
- Naznin, M.T.; Lefsrud, M.; Gravel, V.; Azad, M.O.K. Blue light added with red LEDs enhance growth characteristics, pigments content, and antioxidant capacity in lettuce, spinach, kale, basil, and sweet pepper in a controlled environment. Plants 2019, 8, 93. [Google Scholar] [CrossRef] [Green Version]
- Milla, R.; Reich, P.B. The scaling of leaf area and mass: The cost of light interception increases with leaf size. Proc. R. Soc. B 2007, 274, 2109–2115. [Google Scholar] [CrossRef] [Green Version]
- Borowski, E.; Michałek, S.; Rubinowska, K.; Hawrylak-Nowak, B.; Grudziński, W. The effects of light quality on photosynthetic parameters and yield of lettuce plants. Acta Sci. Pol. Hortorum Cultus 2015, 14, 177–188. [Google Scholar]
- Hanyu, H.; Shoji, K. Acceleration of growth in spinach by short-term exposure to red and blue light at the beginning and at the end of the daily dark periods. Acta Hortic. 2002, 580, 145–150. [Google Scholar] [CrossRef]
- Spalholz, H.; Hernández, R. Transplant lettuce response to different blue:red photon flux ratios in indoor LED sole-source lighting production. Acta Hortic. 2018, 1227, 555–562. [Google Scholar] [CrossRef]
- Yorio, N.C.; Goin, G.D.; Kagie, H.R.; Wheeler, R.M.; Sager, J.C. Improving spinach, radish and lettuce growth under red light emitting diodes (LEDs) with blue light supplementation. Hort. Sci. 2001, 36, 380–383. [Google Scholar] [CrossRef] [Green Version]
- Hogewoning, S.W.; Trouwborst, G.; Maljaars, H.; Poorter, H.; van Ieperen, W.; Harbinson, J. Blue light dose-responses of leaf photosynthesis, morphology, and chemical composition of Cucumis sativus grown under different combinations of red and blue light. J. Exp. Bot. 2010, 61, 3107–3117. [Google Scholar] [CrossRef] [PubMed]
- Viršilė, A.; Brazaitytė, A.; Vaštakaitė-Kairienė, V.; Miliauskienė, J.; Jankauskienė, J.; Novičkovas, A.; Laužikė, K.; Samuolienė, G. The distinct impact of multi-color LED light on nitrate, amino acid, soluble sugar and organic acid contents in red and green leaf lettuce cultivated in controlled environment. Food Chem. 2020, 310, 125799. [Google Scholar] [CrossRef] [PubMed]
- Inada, K. Effects of leaf colour and the light quality applied to leaf-developing period on the photosynthetic response. Jpn. J. Crop. Sci. 1977, 46, 37–44. [Google Scholar] [CrossRef] [Green Version]
- Logan, B.A.; Stafstrom, W.C.; Walsh, M.J.; Reblin, J.S.; Gould, K.S. Examining the photoprotection hypothesis for adaxial foliar anthocyanin accumulation by revisiting comparisons of green- and red-leafed varieties of coleus (Solenostemon scutellarioides). Photosynth Res. 2015, 124, 267–274. [Google Scholar] [CrossRef] [PubMed]
Figure 1.
The spectral composition of the lamps for white light (W), white light with red light (W + R) and white light with blue light (W + B). The maxima for each of the lamps are marked on the spectrum.
Figure 1.
The spectral composition of the lamps for white light (W), white light with red light (W + R) and white light with blue light (W + B). The maxima for each of the lamps are marked on the spectrum.

Figure 2.
The fresh (A) and dry weight (B) of lettuce seedlings grown under different light treatment (W—white light, W + R—white and red light, W + B—white and blue light). Different letters for the same parameter indicate significant differences at the 5% level, according to the Newman–Keuls’s test. The bars represent the standard deviation.

Figure 3.
(A–E) The biometric parameters of leaf lettuce in the seedling stage grown under different light treatment (W—white light, W + R—white and red light, W + B—white and blue light). Different letters for the same parameter indicate significant differences at the 5% level, according to the Newman–Keuls’s test. The bars represent the standard deviation.

Figure 4.
The relative chlorophyll content (SPAD) (A); specific leaf area (SLA) (B); and chlorophyll fluorescence (Fv/Fm) (C) of leaf lettuce grown under different light treatment (W—white light, W + R—white and red light, W + B—white and blue light). Different letters for the same parameter indicate significant differences at the 5% level, according to the Newman–Keuls’s test. The bars represent the standard deviation.

Figure 5.
The principal component analysis (A) and hierarchical clustering (B) show the leaf biometric parameters in relation to the spectral composition of light.
Figure 5.
The principal component analysis (A) and hierarchical clustering (B) show the leaf biometric parameters in relation to the spectral composition of light.

Figure 6.
The absorption spectra of leaves of different lettuce cultivars (Aleppo (A), Ferrado (B), Skyphos (C), Quintus (D), Prunai (E)) vs. the spectral composition of light (W—white light, W + R—white and red light, W + B—white and blue light).
Figure 6.
The absorption spectra of leaves of different lettuce cultivars (Aleppo (A), Ferrado (B), Skyphos (C), Quintus (D), Prunai (E)) vs. the spectral composition of light (W—white light, W + R—white and red light, W + B—white and blue light).


Table 1.
The characteristics of lettuce cultivars.
| Name of Cultivar | Lettuce Type | Leaf Colour |
|---|---|---|
| Aleppo | leafy | light-green |
| Ferrado | butter | light-green |
| Prunai | oak-leaved | red |
| Quintus | Roman | dark-green |
| Skyphos | butter | green and red |
Publisher’s Note: MDPI stays neutral with regard to jurisdictional claims in published maps and institutional affiliations. |
© 2021 by the authors. Licensee MDPI, Basel, Switzerland. This article is an open access article distributed under the terms and conditions of the Creative Commons Attribution (CC BY) license (https://creativecommons.org/licenses/by/4.0/).
Share and Cite
MDPI and ACS Style
Frąszczak, B.; Kula-Maximenko, M. The Preferences of Different Cultivars of Lettuce Seedlings (Lactuca sativa L.) for the Spectral Composition of Light. Agronomy 2021, 11, 1211. https://doi.org/10.3390/agronomy11061211
AMA Style
Frąszczak B, Kula-Maximenko M. The Preferences of Different Cultivars of Lettuce Seedlings (Lactuca sativa L.) for the Spectral Composition of Light. Agronomy. 2021; 11(6):1211. https://doi.org/10.3390/agronomy11061211
Chicago/Turabian StyleFrąszczak, Barbara, and Monika Kula-Maximenko. 2021. "The Preferences of Different Cultivars of Lettuce Seedlings (Lactuca sativa L.) for the Spectral Composition of Light" Agronomy 11, no. 6: 1211. https://doi.org/10.3390/agronomy11061211
Note that from the first issue of 2016, this journal uses article numbers instead of page numbers. See further details here.