Article

Disaggregating the Value of Conservation Agriculture to Inform Smallholder Transition to Sustainable Farming: A Mexican Case Study

1
Agriculture & Food, Systems Program, Commonwealth Scientific and Industrial Research Organization (CSIRO), Waite Campus, Adelaide 5064, Australia
2
International Maize and Wheat Improvement Center (CIMMYT), El Batán, Texcoco 56237, Mexico
3
Cornell University, Ithaca, NY 14850, USA
*
Author to whom correspondence should be addressed.
Agronomy 2021, 11(6), 1214; https://doi.org/10.3390/agronomy11061214
Submission received: 23 April 2021 / Revised: 5 June 2021 / Accepted: 9 June 2021 / Published: 15 June 2021
(This article belongs to the Special Issue Farmers’ Adoption of Agricultural Innovations and Their Impact)

Abstract

:
Conservation Agriculture (CA) is promoted by research and development (R&D) agencies to sustainably intensify agricultural systems with the goals of improving food security and livelihoods and adapting food systems to global climate change. Despite the many benefits of CA, there are few farmers around the world that have simultaneously implemented all facets of the strategy. In part, this reflects the challenges in applying, adapting, and understanding this complex and multi-dimensional agricultural innovation in the context of diverse farming systems. In this paper, we applied an integrated framework that combines bioeconomic simulation, risk analysis, adoption theory, and impact assessment to investigate how various combinations of CA components (no-tillage, soil cover, crop diversification, plus growing a new crop or variety) performed over a 10-year period in representative farms in a central Mexican case study. We found significant differences in profit, net value, downside risk, and risk-aversion cost between double-component scenarios (and improved CA to a lesser extent) and all other scenarios, which suggested that disaggregating CA into smaller component packages could increase farmer adoption in risky contexts. Our findings provided valuable insights on CA feasibility and could help establish policy and reporting metrics. The study highlighted the need for employing a range of research tools to understand the relative value of agricultural innovations and to identify and reduce trade-offs and uncertainty in farming systems.

1. Introduction

Conservation Agriculture (CA) systems contribute to food security, improve livelihoods, and help farmers tackle climate change [1]. CA is defined by the FAO as “a farming system that promotes minimum soil disturbance (i.e., no-till or minimal tillage farming), maintenance of a permanent soil cover and diversification of crop species. It enhances biodiversity and natural biological processes above and below the ground surface, which contribute to increased water and nutrient use efficiency and improved and sustained crop production” [2].
Researchers have investigated the potential to intensify under-performing agricultural land through innovations such as CA, particularly among global smallholder operations [3,4,5,6,7,8]. CA’s ability to function in the world’s diverse contexts and production systems attests to its adaptability. CA can also generate substantial economic and environmental benefits under marginal conditions, particularly by enhancing climate change resilience. Recent meta-analyses confirmed that CA strategies favoured the drier regions of the globe—such as central Mexico—and increased organic carbon in soil and crop yield by helping retain soil moisture [9,10,11]. In southern Africa, CA maize and wheat yields have seen increases up to 50% over six years, relative to conventional agriculture [5]. Dryland maize in central Mexico averaged gains of 38–48% over 9 to 10 years [5,12]. Also, large cost savings can result from increased labour efficiency and reduced automation when moving from conventional systems to CA with only minimal land preparation and direct seeding [13].
Although the potential for these interventions has been recognised, their success has been limited [3,10,14,15,16]. Many factors can contribute to the overall low adoption rates of innovation in agriculture. High risk levels, a lack of economic drivers or incentives, broader social constraints, the level of farmer engagement, or combinations of these can all impact the likelihood of farmers implementing new innovations [17,18,19,20]. Other factors—such as alternative technologies being available as supplements, complements or replacements, either simultaneously or sequentially—may also affect the speed and level of adoption [21,22]. Adoption is particularly problematic for complex sustainable intensification technologies, such as CA, which have multiple components and potential effects in a variety of dimensions resulting in large outcome variability [13,23]. These also frequently present a learning curve and require initial technical assistance or minimal start-up investment for longer-term benefits [23]. In the context of this paper, CA is defined as a series of recommendations that enable farmers to produce more with less, and the resource-conserving behaviour provides a pathway to sustainably intensifying production on existing farmland. However, so-called sustainable practices often have both beneficial and adverse effects on the environment, ranging from measurable yield gains from improved soil condition to broader impacts on air quality and biodiversity [13] that fall outside the scope of this study.
Assessing the full impact of CA is challenging given the complex, context-specific and multi-dimensional nature of the innovation and the systems in which farmers implement it. For example, changes in crop yield impact the production of stubble—the remnants of the plants after harvest—which can have multiple uses depending on various factors such as quantity, quality, and value. Crop stubble can be sold as fodder or retained. In the latter case, it can be incorporated in the soil, used as ground cover, fed to livestock, or burned [24]. Moreover, the relative role of crop residues, or stubble, can change, as they may be a better source of income than grains in very dry years, but not in wetter years, potentially complicating the long-term adoption of CA. The fate of crop stubble can be further influenced by crop choice. All of these factors and actions have consequences in terms of resource trade-offs and the allocation of farm inputs, feed, labour, machinery, capital, and sometimes water and land as well. Increasing agricultural production and hastening the shift towards intensified systems often require a well-planned mechanisation strategy that also fits with the multiple goals of farm sustainability, profitability, and resilience; meanwhile, they are limited by local supply, infrastructure, and the farmers’ socioeconomic context [25].
There is a growing trend towards integrated systems approaches that more effectively harness key stakeholder interactions, promote synergies and minimize trade-offs for resource-use-efficiency, scale innovations, and enable potential adoption and positive impact [7,26,27,28,29,30,31]. Sadras et al. argued that overlooking resource trade-offs, scaling/adoption drivers, and context-specificity in crop research often lead to over-optimistic projections, experimental shortcomings, and irrelevant (controlled-environment) agronomy [32]. Overlooking the socioeconomic and risk contexts further limits the closure of yield and profit gaps [33].
For this study we used a case study within central Mexico, a dry-climate region with high potential for CA implementation outcomes [11]. For three decades, CA has been variously adapted to and promoted in Mexico’s prevailing maize-based agriculture sector in an effort to increase productivity [4,5,8,12,13,25,34,35,36,37]. One goal of the efforts is to improve the national average maize yield of 2.9 t/ha [38], significantly lower than the world’s average of 5.1 t/ha [39], thereby contributing to the country’s agricultural self-sufficiency and national food security [40]. Even though Mexico is one of the top 10 maize producers in the world [41] and maize is the nation’s staple crop—representing over 50% of the caloric intake for the poorest sectors of the population [42]—the country still imports one-third of its maize, the second highest maize import rate in the world [43].
The objective of this study was to gain insight into the feasibility of CA and help to set and adjust reference criteria towards decision recommendations by exploring the economic value of adopting CA practices in the case study area. The selected area is composed of traditional smallholder farming systems near the central Mexican city, Guanajuato. CA in the region has been variously supported under the MasAgro research initiative, supported by the Government of Mexico and coordinated by the International Maize and Wheat Improvement Center (CIMMYT) [44,45]. The initiative seeks to increase farmer income and the productivity of maize and wheat in Mexico by implementing research collaborations, as well as by developing and promoting the use of improved seeds, sustainable technologies, and farming practices [46,47,48].
In this study, we compared the current conventional production system in the region (baseline) with nine scenarios of various combinations of three CA components (no-tillage, soil cover, and crop diversification), as well as an improved maize variety and a novel legume crop to further explore the robustness and flexibility of the system. In the process, we used Value-Ag [49], an integrated framework using Commonwealth Scientific and Industrial Research Organization (CSIRO) models that combines bioeconomic simulation, risk analysis, adoption theory, and impact assessment to demonstrate how agroecological and socioeconomic drivers determine the relative advantage of CA strategies in the case study. This study specifically addressed the following three questions:
  • How do various combinations of no-tillage, soil cover, and crop diversification affect the profitability and the downside risk of the whole farm over time, given farmer risk aversion?
  • What is the net value impact of adopting alternative options of CA?
  • What are the relative benefits of introducing a new maize variety and alternative legume crops to an existing CA field setup?
This study intended to quantify the profit-risk profile and net value of the various CA components to enable farmers, researchers, funders/and policy makers to make more informed and strategic decisions in regard to adopting the innovation and prioritising research and investment while fostering a more results-focused culture.
The paper is structured as follows. Section 2 provides an overview of the study area, modelling approach and analysis design. Section 3 presents and discusses modelling results and future research opportunities, leading to the conclusions and policy implications in Section 4.

2. Materials and Methods

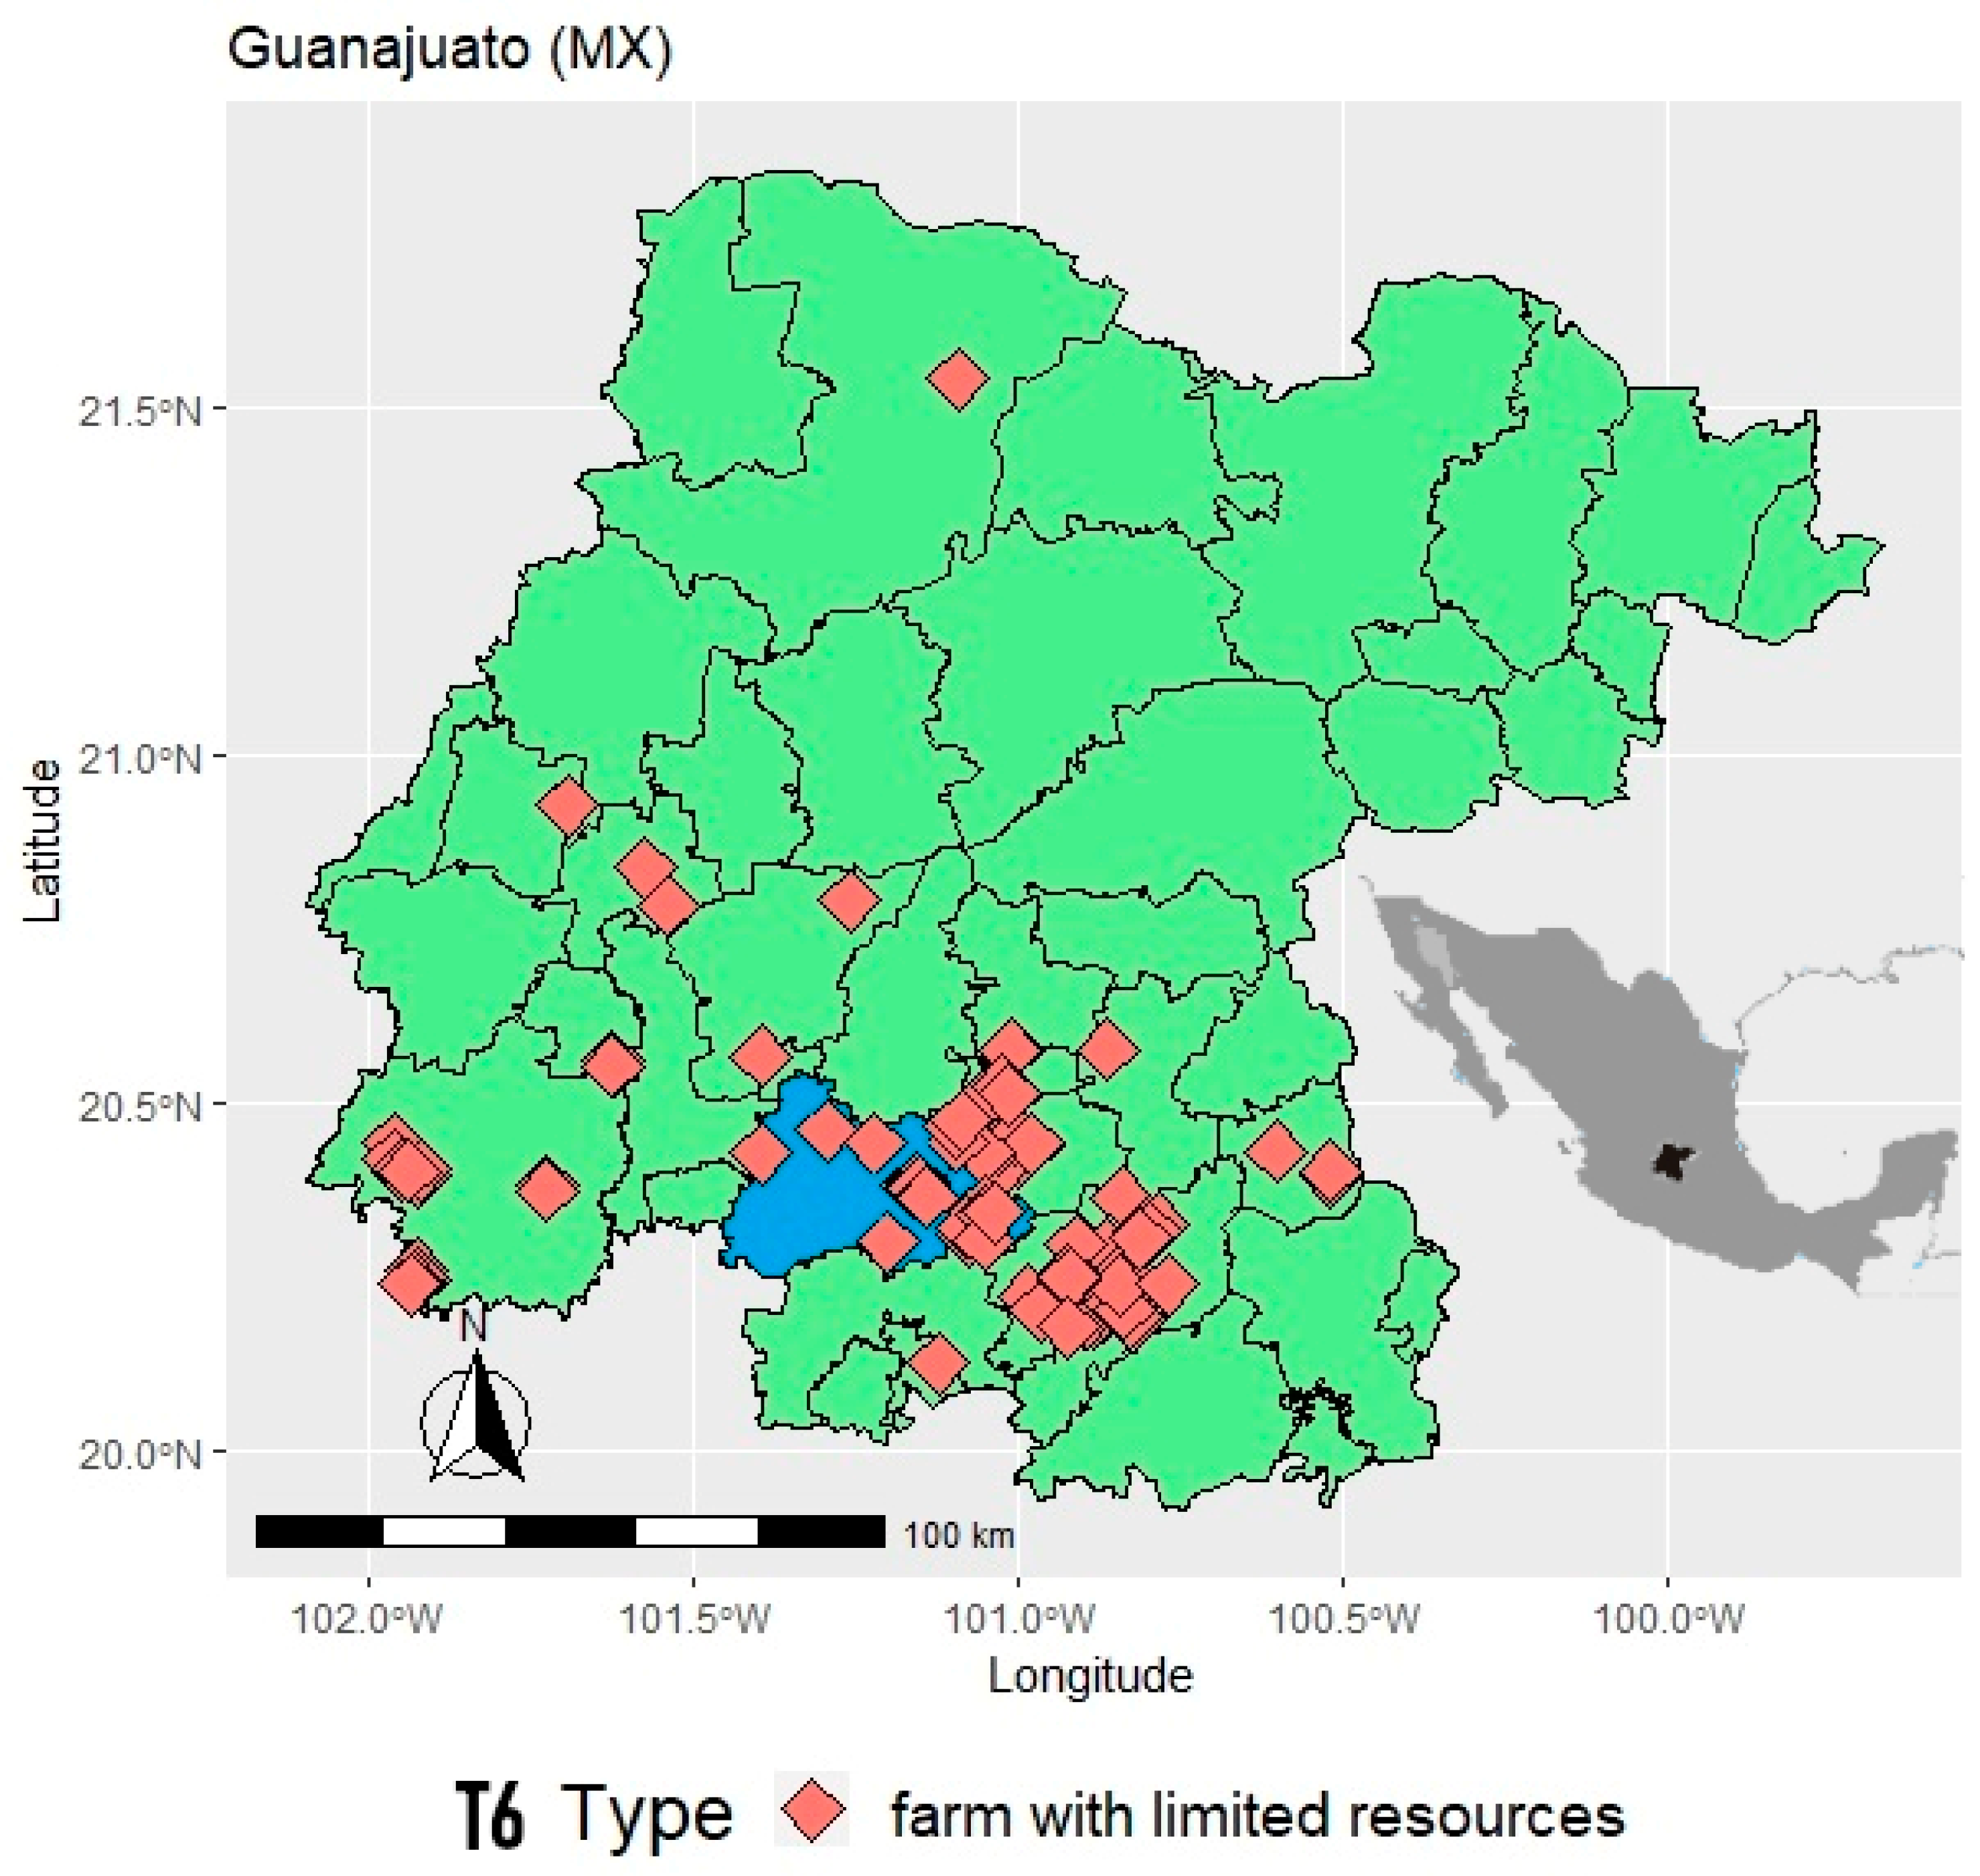
2.1. Case-Study Context

The study area was located in southern Guanajuato, part of the Bajío region of central Mexico (Figure 1). The region’s elevation is around 1750 m above sea level and the area is characterized by a dry season between November and April with an average daily temperature of 20–25 °C. It also has a wet season between June and September with an average monthly precipitation of 100–200 mm. Substantial irrigation in the broader Bajío region is mainly carried out on medium-scale farms (greater than 5.0 ha) [24].
The study area was primarily composed of rain-fed smallholder agriculture, which often integrates maize production with livestock. Problems arising from competing demands for crop residue, soil degradation, and low economic profitability are prevalent in these systems [35]. Rainfed maize grown in the smallholder farms of central Mexico is often a mixture of native (criollo) and improved (creolised) landrace varieties [50,51]. The conventional system of agriculture in the region has a high level of heterogeneity in terms of farm size, herd size, crop intensity, level of mechanisation, labour availability, initial endowment, and reliance on off-farm income, among other factors. The degree to which commodities are produced for their consumption or for sale in local markets or larger markets is another differentiator.
Zepeda et al. aggregated Guanajuato rural farms into six main production unit typologies (T, n = 480): T1, peri-urban with high female participation (15.6%); T2, rural in poverty with female participation (22.9%); T3, commercial and ageing (6.0%); T4, mechanised with young families (17.7%); T5, diversified with young professionals (12.3%); and T6, agriculture with limited resources (25.4%) [52,53]. Appendix A Table A1 contains a summary description of all typologies. For this analysis, we focused on T6, the most representative farm typology in the study area. There were 122 T6 farms, representing more than a quarter of the 480 farms surveyed in the typology study. T6 farms also displayed the most geographic uniformity, as almost all T6 farms are located in the plains of southern Guanajuato and had good CA potential overall. In contrast to the other typologies, T6 farmers have limited resources and farm a typical, average-sized farm of less than 4 ha with low livestock numbers (enough to capture key crop-livestock trade-offs without hindering CA adoption), a low level of mechanisation, and limited irrigation. These farms are run by ageing families (more than 90% male, with an average age of 60.9) with high economic dependence on family (63%), and who generate their income from agriculture and livestock relying on hired labour (58%) as well as from off-farm work (34%). These farmers potentially have both the need and willingness to adopt new technologies or learn new skills to intensify their farms.

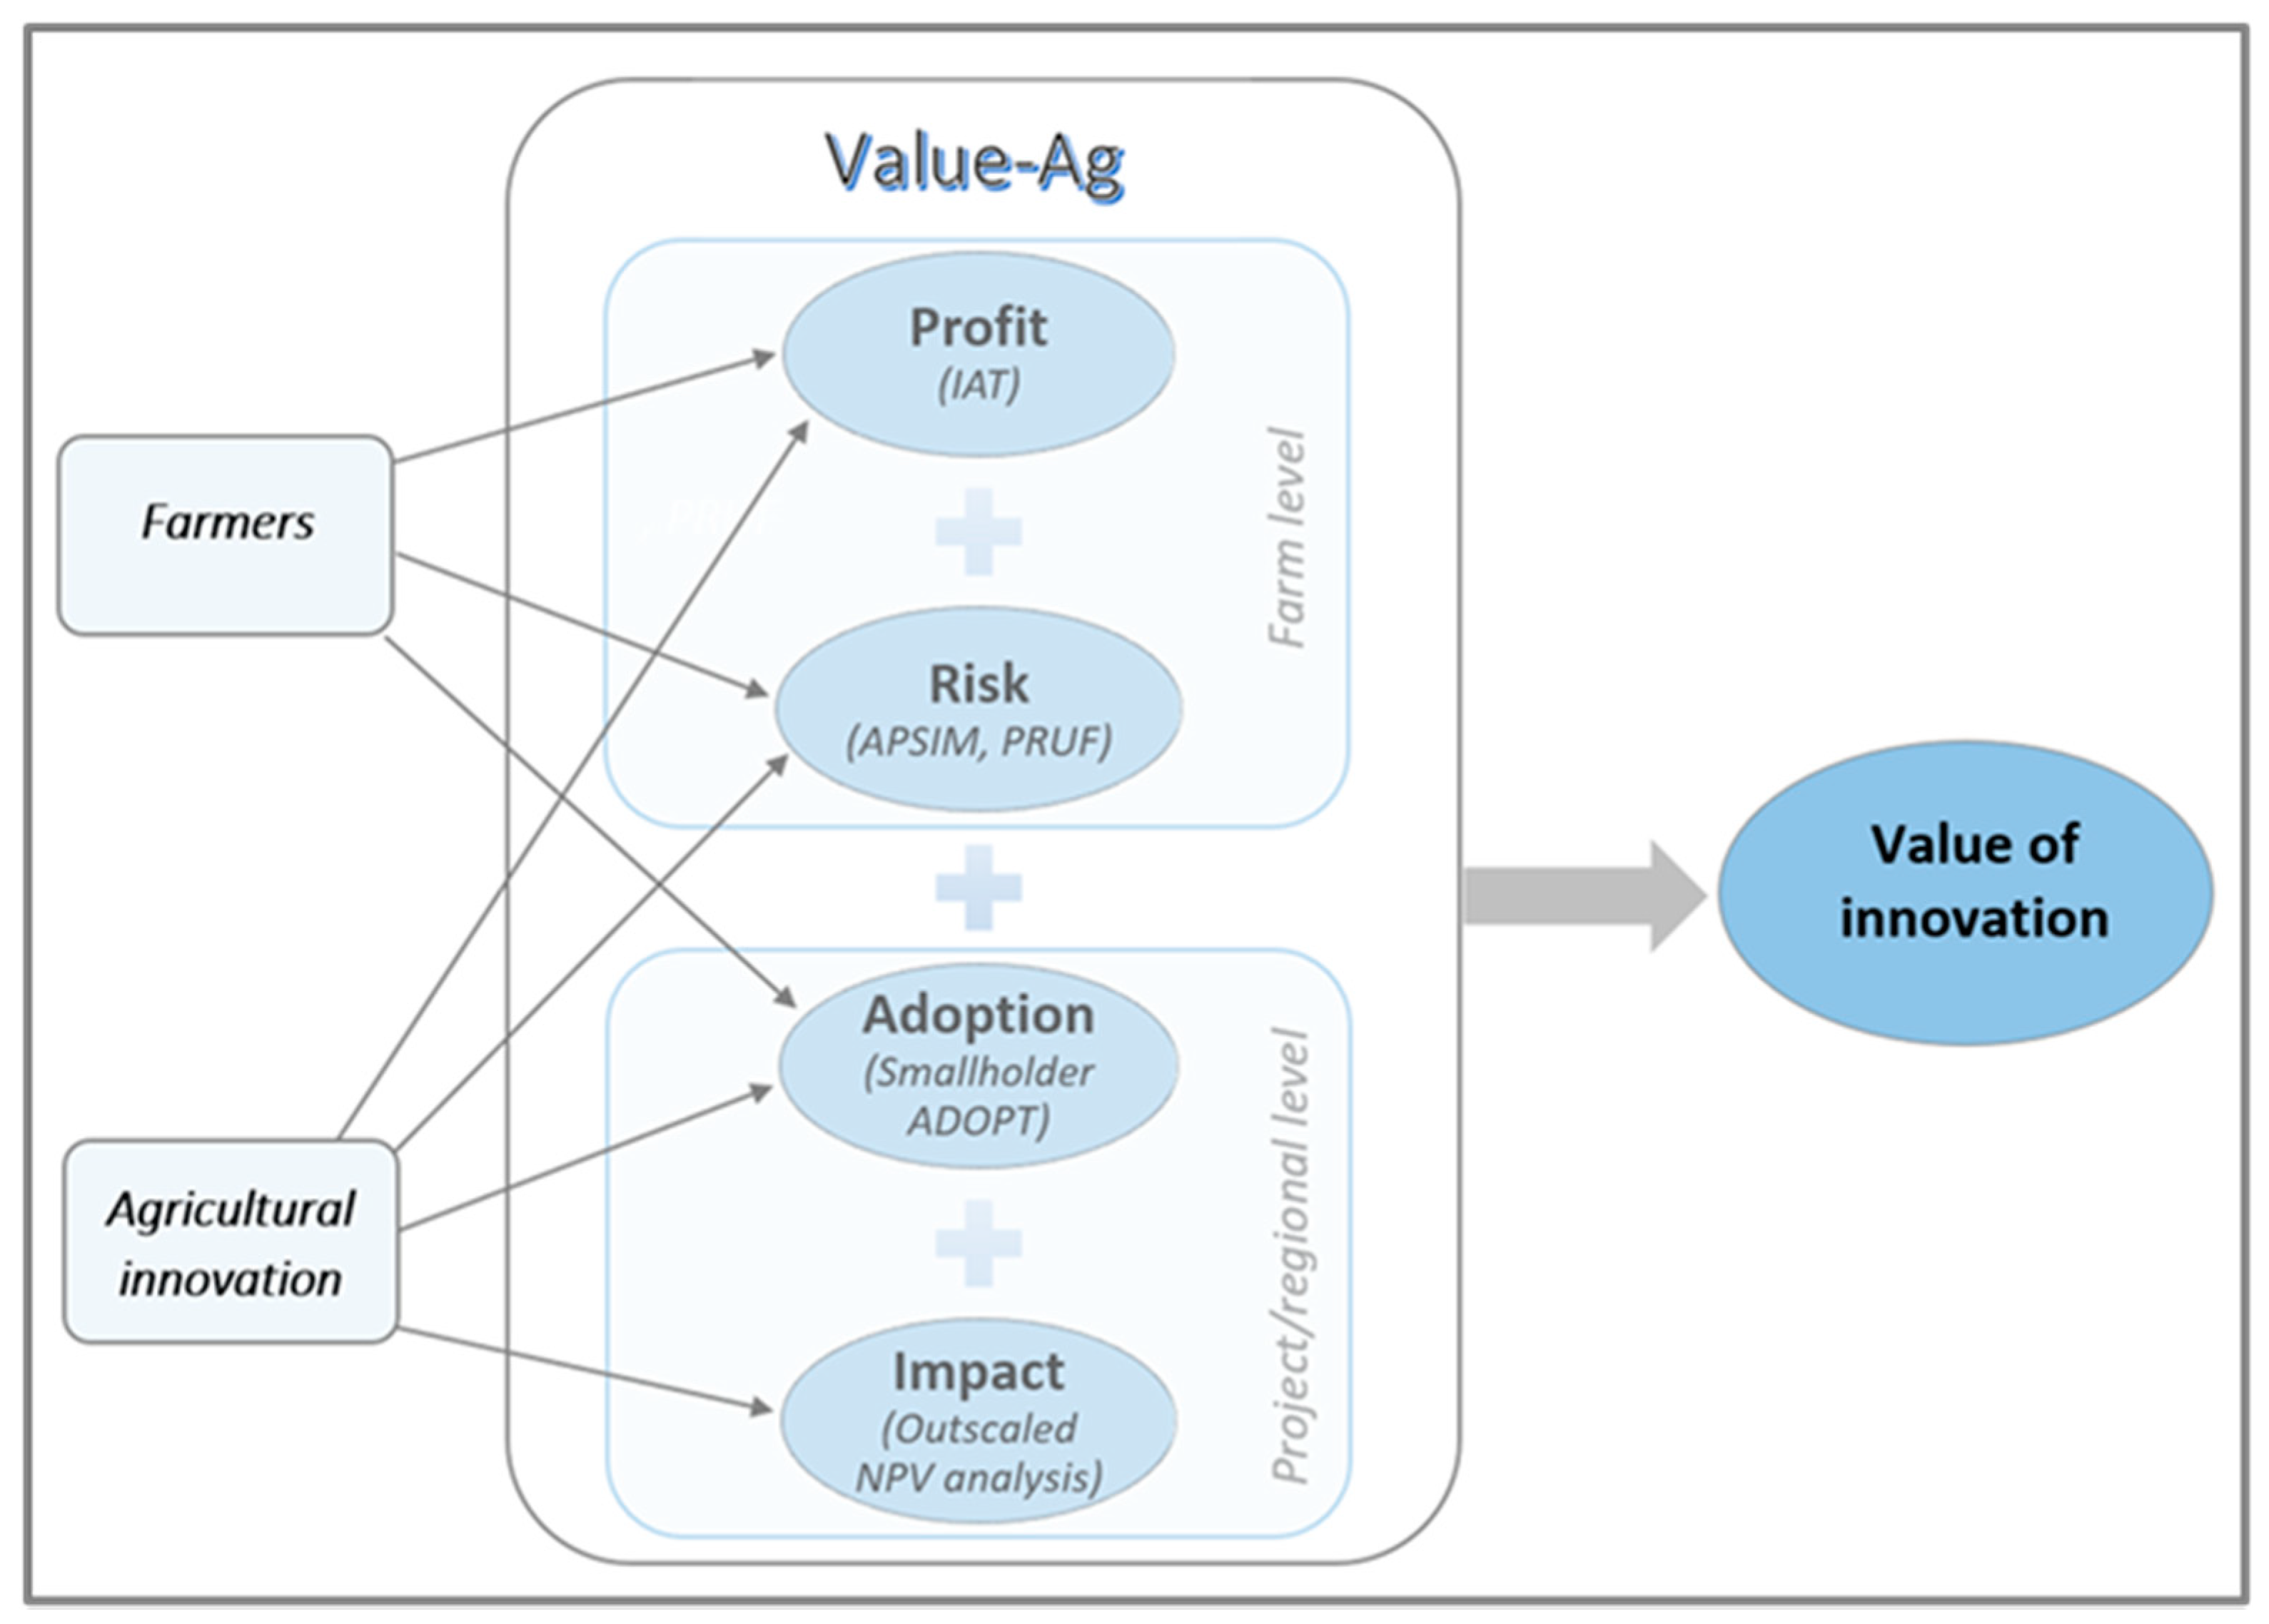
2.2. The Value-Ag Framework

In this paper, we applied an integrated model framework, Value-Ag [49,54], to quantify the likely economic value of implementing variations of CA over 10 years for representative rain-fed smallholder farmers in central Mexico, and predict their multi-year adoption, thereby also informing local and regional agri-food system value chains and farmer communities. Value-Ag is a micro-level bioeconomic modelling framework, and it is part of a rich history of bioeconomic models [55] that have attempted to capture technology choice in dynamic, complex agri-food systems by focusing on their interactions in each context. The Value-Ag framework (Figure 2) effectively combines different tools and their outputs at different scales: (i) whole-farm profit simulated with the Integrated Analysis Tool (IAT) [56]; (ii) risk and uncertainty metrics borrowed from a Profit-Risk-Utility Framework (PRUF) [33,54]; (iii) adoption predicted by the Smallholder ADOPT (Adoption and Diffusion Outcomes Prediction Tool) [57,58]; and (iv) impact assessment through an out-scaled Net Present Value (NPV) analysis [49].

2.2.1. Profit

As illustrated in Appendix B Figure A1, the IAT integrates data and outputs from a farm-household economic module (labour, capital), a ruminant growth module, and a separate crop/forage simulation model such as APSIM [59] or another growth model. Alternatively, the user may enter annual yield data for crop grain and crop/forage biomass (e.g., from experimental trials or relevant literature). Monjardino et al. provided more detail on the integration of the IAT in the Value-Ag framework [49]. McDonald et al. described the IAT in full, including mathematical structure and assumptions [56].

2.2.2. Risk

Erenstein et al. and Pannell et al. identified risk and risk aversion as important influences on smallholder farmers adopting CA [5,60], as risk management is a major driver of farm-household decision making [61]. Underpinned by rainfall and yield variability, the risk profile of a scenario was established through a combination of standard deviation (SD) and the coefficient of variation (CV) of the 10-year average net profit, probability of a positive net profit [p(π ≥ 0)], and conditional value at risk of the lowest 10% of net profits (CVaR0.1) as a measure of downside risk. Calculation of p(π ≥ 0) and CVaR0.1 were performed with the @RISK software [62]. Additionally, the Value-Ag analysis accounted for the likelihood that risk-averse smallholder farmers may have been willing to sacrifice some expected income (risk premium) to reduce the probability of below-average income [61]. Hence, average net profit was adjusted for risk through the calculation of a risk premium linked to one of five levels of farmer risk aversion (0 = no risk aversion, i.e., a risk-neutral decision-maker; 1= low risk aversion; 2 = moderate risk aversion; 3 = high risk aversion; 4 = very high risk aversion). The maximum cost of risk aversion for each scenario is the difference between the risk-neutral profit and the risk-adjusted profit for very high aversion to risk.

2.2.3. Adoption

Value-Ag employs Smallholder ADOPT to generate predicted adoption outcomes in the years following the introduction of the innovation. While not aiming to specifically capture all possible factors influencing the rate of adoption in smallholder innovation systems [63], the ADOPT framework presented users with 22 questions about commonly influential factors of adoption. Users answered these questions via a choice of Likert-scaled responses, and the responses were given a value that fed into a series of formulas that provided numeric predictions for Peak Adoption Level and Time to Peak Adoption. The predictions were then used to generate an S-curve that approximated the characteristics of the cumulative adoption of an innovation in practice.

2.2.4. Impact

The farm-scale annual net profit outputs for the baseline and the innovation scenarios were transferred from the IAT into the Value-Ag platform, where the results of each simulation trial were summarised as the NPV of annual net profit over 10 years using a real discount rate (3.0% in this case study). The principal economic criterion used to compare the innovation scenarios with the baseline was the net value of the innovation, calculated as the difference between the NPV of annual net profit of each innovation scenario and the baseline scenario of a typical farm with no innovation. The net value of the innovation varied according to the climate conditions and resulting yields in each scenario throughout the analysis. The last stage in the Value-Ag approach involves three steps. First, out-scaling the farm economic benefit by multiplying the annual net profit outputs of the baseline and the innovation scenarios by the number of farms covered by the project. Second, overlaying the annual net values of innovation (i.e., the difference between annual farm net profits with and without innovation) over a given period with the annual data points extracted from ADOPT’s predicted diffusion curve (as described in Section 2.2.3), establishing the net value of the adopted innovation for the entire smallholder population targeted by the project case study. Third, calculating the predicted profit impact of the innovation across the target farmer population (i.e., the percentage change between the out-scaled net value of the innovation relative to the out-scaled NPV of the annual net benefit of the baseline).
Overall, the integration of the different scales of the component models—farming system (IAT) and farmer population (Smallholder ADOPT)—is best conducted within farm typologies, as discussed in 2.1, although assuming a relatively homogeneous farmer population (e.g., village) with similar exposure to the innovation is possible [54].

2.2.5. Research Workshops

The application of Value-Ag to this case study involved a series of research workshops at CIMMYT headquarters in Mexico between November 2019 and February 2020. Various collaborating team members and other researchers (10–15 per workshop) attended these workshops and subsequent online meetings throughout 2020. The team contributed to IAT parameterisation, calibration, and validation for this case study, and aided in establishing adoption predictions for the CA-based scenarios using Smallholder ADOPT. Supplementary Materials Table S1 provides further details on the research workshops.
Input data points were drawn from several sources to populate the IAT. Price and cost data, production input levels, labour requirements, and family expenses were derived from a combination of baseline survey reports of households located in the target communities [52,53,64], databases [44,65], government historical records [38,66], research literature [4,5,8,12,13,25,34,35,36,37], unpublished data [67,68,69], as well as local expert input from CIMMYT researchers. Validation of the modelled baseline scenario relative to the actual historical baseline was conducted via expert and stakeholder assessment of the system represented, as well as through relevant literature and data review.

2.3. Scenario Analysis

2.3.1. Baseline Scenario

The IAT was parameterised to simulate whole-farm resource flow over 10 years (2011–2020) for a conventional, rain-fed smallholder farm that grows maize and sorghum in central Mexico. Most maize in Mexico is cultivated on rainfed fields smaller than 5 ha [40]. As mentioned in Section 2.1, this study focused on farm typology T6, representing roughly a quarter of all farms in the state of Guanajuato. They are particularly common in southern Guanajuato (Figure 1). The baseline scenario is summarised in Table 1 and described below. The currency used in the analysis is the Mexican peso (MXN). At the time of writing, 1.0 MXN = 0.050 US dollars (USD).
Land and crops: A conventional maize and sorghum system was grown on a large proportion of the case study farm of 4.2 ha, assuming 3.8 ha of arable land and 0.4 ha (~10%) was occupied by buildings, yards, pathways, etc. Of the arable farmland area, based on clay soil types, 1.8 ha was sown to maize and 1.8 ha sown to sorghum. Annual rain-fed (temporal) maize and sorghum yields for the spring-summer cycle (ciclo Primavera-Verano, PV) were sourced from government agricultural records [66] between 2011 and 2020. The 10-year average yield was 2.68 t/ha for maize (CV = 0.19) and 2.41 t/ha for sorghum (CV = 0.28) based on a mix of criollo and creolised varieties [50,51]. Sale prices were assumed at 3.8 MXN/kg for maize and sorghum and 11 MXN/kg for beans, based on 10-year trends [70,71]. Farmers sold nearly 70% of the crop stubble in the baseline case at an average fixed price of 1.0 MXN/kg. This research assumed that the remaining 0.2 ha of the arable area was used for horticulture (e.g., 0.05 ha carrots, 0.05 ha mixed beans, 0.05 ha pumpkin/calabaza) for sale and/or home consumption (amounting to a fixed gross margin income of 12,163 MXN/year from horticulture for all scenarios), and an extra 0.05 ha of unspecified minor crops, trees, and grasses. These peripheric enterprises—which operate independently of the main crop and livestock modules—use simple average yields and prices, but also add proportionality to the scenario effects and accuracy to the farm labour pool.
Livestock and feed: Consistent with the low livestock numbers in the region, the whole-farm simulation was assumed to start with the equivalent of four B. taurus cattle for sale and milk production, including for home consumption. Maize crop residues (stubble) underpin traditional mixed crop-livestock systems in Mexico [35]. In the baseline system, 30% of the maize and sorghum stubble sustained the cattle during the dry season (a variable supply based on annual grain yields and a harvest index (HI) of 0.43/0.40) [72]. Commonly-used feed supplements (molasses, blood meal, fish meal, and chicken manure-based pollinaza) and oat straw and alfalfa fodder purchased on-demand (at a cost of 35–50 MXN per 30 kg bale) [73] were also used to sustain the cattle, along with low-quality native grassland (e.g., on unused land or along roadsides). Overall, feed availability (underpinned by yields, costs and labour) determined the simulated herd performance in terms of calves born, milk production, and beef turnoff over time.
Agronomy and machinery: The baseline scenario was assumed to be a conventional farming system which, given the T6 farmer profile, largely depends on machine hire for land preparation and tillage and subsequent planting, fertilising, and spraying. For dry-land conditions, a fertiliser nitrogen-phosphorus (N–P) formula mix (ammonium sulphate/urea/DAP) was commonly applied to maize and sorghum, split over two applications (4270 MXN/ha per crop). Typically, one application of selective herbicide costs 1350 MXN/ha per crop. Operational costs were based on default labour rates described below. The following rules applied to the baseline land preparation and planting [74]:
  • Every two to three years subsoil working;
  • Annual land preparation: ploughing, two harrowing passes, optional ridging;
  • Annual minimal planting, sometimes planting pass and fertilisation pass;
  • Minimum five machine passes at an average of 800 MXN/ha per activity totalling 4000 MXN/ha/year, including operator and fuel costs for each activity.
Household and labour: In line with the farm typology T6, the farm was modelled for a household with an ageing couple and a child (grandchildren often live or stay with grandparents). Each adult worked 240 days per year at an off-farm job at an average rate of 150 MXN/day. Farm labour was hired on-demand at 130–180 MXN/day for teenagers and adults. The baseline assumed 10,000 MXN in annual farm overhead costs, including 5000 MXN for general farm maintenance and services and 1000 MXN in electricity costs. The simulation was initialised with 60,000 MXN cash on hand and 3000 MXN in monthly living expenses.

2.3.2. Innovation Scenarios

The baseline scenario was modified using nine variations of the CA system. All scenarios were rain-fed and underpinned by traditional maize-sorghum crop rotation, plus a legume crop in CA and crop diversification (CD)-based scenarios (beans in Scenarios 2, 5, 7–9; grass pea Lathyrus sativus L. in Scenario 10). Maize was based on a criollo and creolised variety mixture in all scenarios except in Scenario 9, which used a generic hybrid variety. The 10 scenarios analysed in this study are described below and in Table 1:
  • Baseline: the current system
  • CA: Conservation Agriculture (no-tillage, soil cover, crop diversification)
  • NT: No-Tillage
  • SC: Soil Cover
  • CD: Crop Diversification
  • NT + SC: No-Tillage and Soil Cover
  • NT + CD: No-Tillage and Crop Diversification
  • SC + CD: Soil Cover and Crop Diversification
  • CA + NewVar: Conservation Agriculture with a new maize variety
  • CA + NewLeg: Conservation Agriculture with a new legume crop
While the basic model structure remained unchanged—including most initial assumptions of farm capital labour, crops, and livestock—key changes were made to reflect each scenario in terms of: (a) crop yield and area; (b) the inclusion of beans in the crops (10-year average yield 1.16 t/ha, CV = 0.36); (c) stubble fate (sold vs. retained for incorporation, ground cover, or livestock feed); (d) land preparation and associated labour requirements; (e) the number of machine passes; (f) the cost of machine hire; (g) the number of herbicide applications; (h) the number of fertiliser applications; and (i) other changes, e.g., the cost of seeds and price of grain, HI, and growing season.
As shown in Table 1, most practices were assumed to have an incremental positive effect on crop yield over 10 years. The exception was NT, due to mixed trial results and the reported yield gains mostly occurring in hybrid maize. While it is difficult to define the stepwise increment of yield since it depends on multiple and complex factors—including water availability, soil health, and agronomic management [37]—a 10-year incremental yield boost of 15–30% for maize, 10–20% for sorghum, and 15% for legumes was assumed in this study, based on average figures found in unpublished or preliminary field data from Guanajuato (ciclo PV, 2019). There were also annual yield gains of up to 3.0% and 1.5% pa in maize and sorghum/beans, respectively [75]. For reference, significant improvements in maize yields of up to about 50% have been observed in long-term CA field experiments under rain-fed conditions across central Mexico [12,37].
Each scenario was also underpinned by an assumed fate of crop stubble residues, ranging from a sold/retained ratio of 80/20 in SC and NT + CD to 30/70 in the CA scenarios. Stubble retained for soil cover varied between nil (baseline and NT/CD-based scenarios) and 63% in the CA scenarios. Of the stubble produced, 0–30% was fed to livestock across all scenarios. Variation in these values was likely to occur and could be further tested in sensitivity analysis.
Transitioning from conventional agriculture to CA in this region assumed a doubling in herbicide use in all scenarios, except SC, at a total cost of 2700 MXN/ha per crop, plus the cost of application. The assumption was that SC limits weed infestation and contributes to the reduced germination of uncovered weeds. However, increased herbicide usage in most scenarios could impact biodiversity. Insecticide use in legume crops is uncommon in the study region, possibly due to lower pest incidence at high altitude (1750 m) [76] and was excluded from the analysis. Relative to the baseline, 20% less N was applied to maize and sorghum in all scenarios with a N-fixing legume crop at a cost of 3416 MXN/ha [75], except hybrid maize (CA + NewVar).
In addition, the implementation of CA practices represents a drastic reduction in land preparation (and labour). CA includes the following considerations [36]:
  • A maximum of two or three machinery passes (depending on the CA practices applied) at an average cost of 2400 or 3600 MXN/ha/year. An increase from 800 MXN to 1200 MXN per pass relative to the conventional system accounts for likely higher hire costs under CA and more difficult passage with soil cover;
  • Initial land preparation works for full CA conversion (subsoil work, ploughing, two harrowing, one bed-making pass) at an average cost of 4000 MXN/ha (year zero, lasting 15–20 years);
  • In NT conditions, farmers conduct subsoil works approximately every eight years at a cost of 1000 MXN/ha.
Scenario 9 (CA + NewVar) offered an opportunity to quantify the economic impact of a new generic maize hybrid variety in the CA context. Hybrids offer farmers higher yields but imply a recurring higher seed price. On average, the cost of hybrid maize seed is three and five times higher than creolised and criollo varieties, respectively [77], so a four-fold increase in the cost of seed (15 MXN/kg) was assumed in the CA + NewVar scenario, while the sale price was left unchanged relative to the baseline. Hybrids yield more than landraces and CIMMYT recorded average yield increases of 73% under CA in Guanajuato [65], and we took this into consideration in this scenario (5.8 t/ha, CV = 0.40). Also, maize productivity can be raised significantly when hybrids are combined with judicious fertiliser use and good agronomy [78], so a higher fertiliser rate was applied to the CA + NewVar relative to the CA scenario. Beyond increases in seed cost, grain yield, and fertiliser use (Table 1), other changes are likely to occur between criollo/creolised and hybrid maize varieties. These can include the length of their respective growing seasons, harvest index, grain quality, and chemical use, but these were not considered here.
We added Scenario 10 (CA + NewLeg) to the analysis to demonstrate the flexibility of the framework in accommodating diverse changes to the systems, such as replacing traditional beans with a new legume crop to complement the CA system based on grass pea. Opportunities for grass pea to contribute to the sustainable intensification of traditional systems are currently under investigation in Mexico, because the plants are very hardy dual-purpose legume crops that are well adapted to dryland conditions, have high nutritional value, and produce good biomass in the winter months [79,80,81,82,83]. They can also be used as high-quality forage for livestock [84]. In addition, grass pea offers considerable potential in crop rotation, improving soil fertility and reducing the amount of disease and weed populations (from increased crop competition), hence reducing production costs [85]. Encouraged by long-running breeding efforts to stabilise yields and reduce toxicity to the neurotoxin β-ODAP in grass pea-based diets [85,86,87,88,89], Lathyrus species are gaining interest as legume crops in Mediterranean-type environments [90] and production is increasing globally [81,82,83,91].
Based on trial data from central Mexico [67,68,69] and local agronomic expertise [92], grass pea was represented in the IAT simulation through the following changes relative to the bean crop and summarised in Table 1: annual grain yields 1.5–2.5 t/ha (CV = 0.18) and straw yields 6.0–8.0 t/ha (HI of approx. 0.31) over the 2011–2020 period; 4% N in grain, based on a 25% crude protein content [68,69]; likely growing season November through April under Guanajuato’s conditions; seed density of 80 kg/ha at a cost of 5.0 MXN/kg; no chemicals typically applied in the fast-growing winter cycle; 50 kg DAP recommended in rainfed low-yielding ecologies; long-term incremental yield gains of 15% from CA benefits could apply to this legume crop as well. Based on limited available global market data for the grass pea (mostly from the largest producing countries, Bangladesh, Nepal, India, and Ethiopia), the average price was estimated at 0.50 USD/kg [93], or 10 MXN/kg of grain (and 1.0 MXN/kg of baled forage), assuming there is a market deep enough to absorb the produce.

3. Results and Discussion

The results and discussion of the application of each Value-Ag tool to the case study are presented as follows: 3.1, whole-farm profitability from the IAT; 3.2, risk and risk aversion using PRUF; 3.3, adoption prediction using Smallholder ADOPT; 3.4, Value-Ag based impact assessment; 3.5, implications of assessing the economic value of CA technologies; and 3.6, future research opportunities. Combinations of undisturbed, covered-soil, and diverse crops had an impact on whole-farm profitability and downside risk over time, given farmer risk aversion, adoption rates, and changes in crop type and variety. Key economic and risk results for the baseline and the innovation scenarios are presented in Table 2.

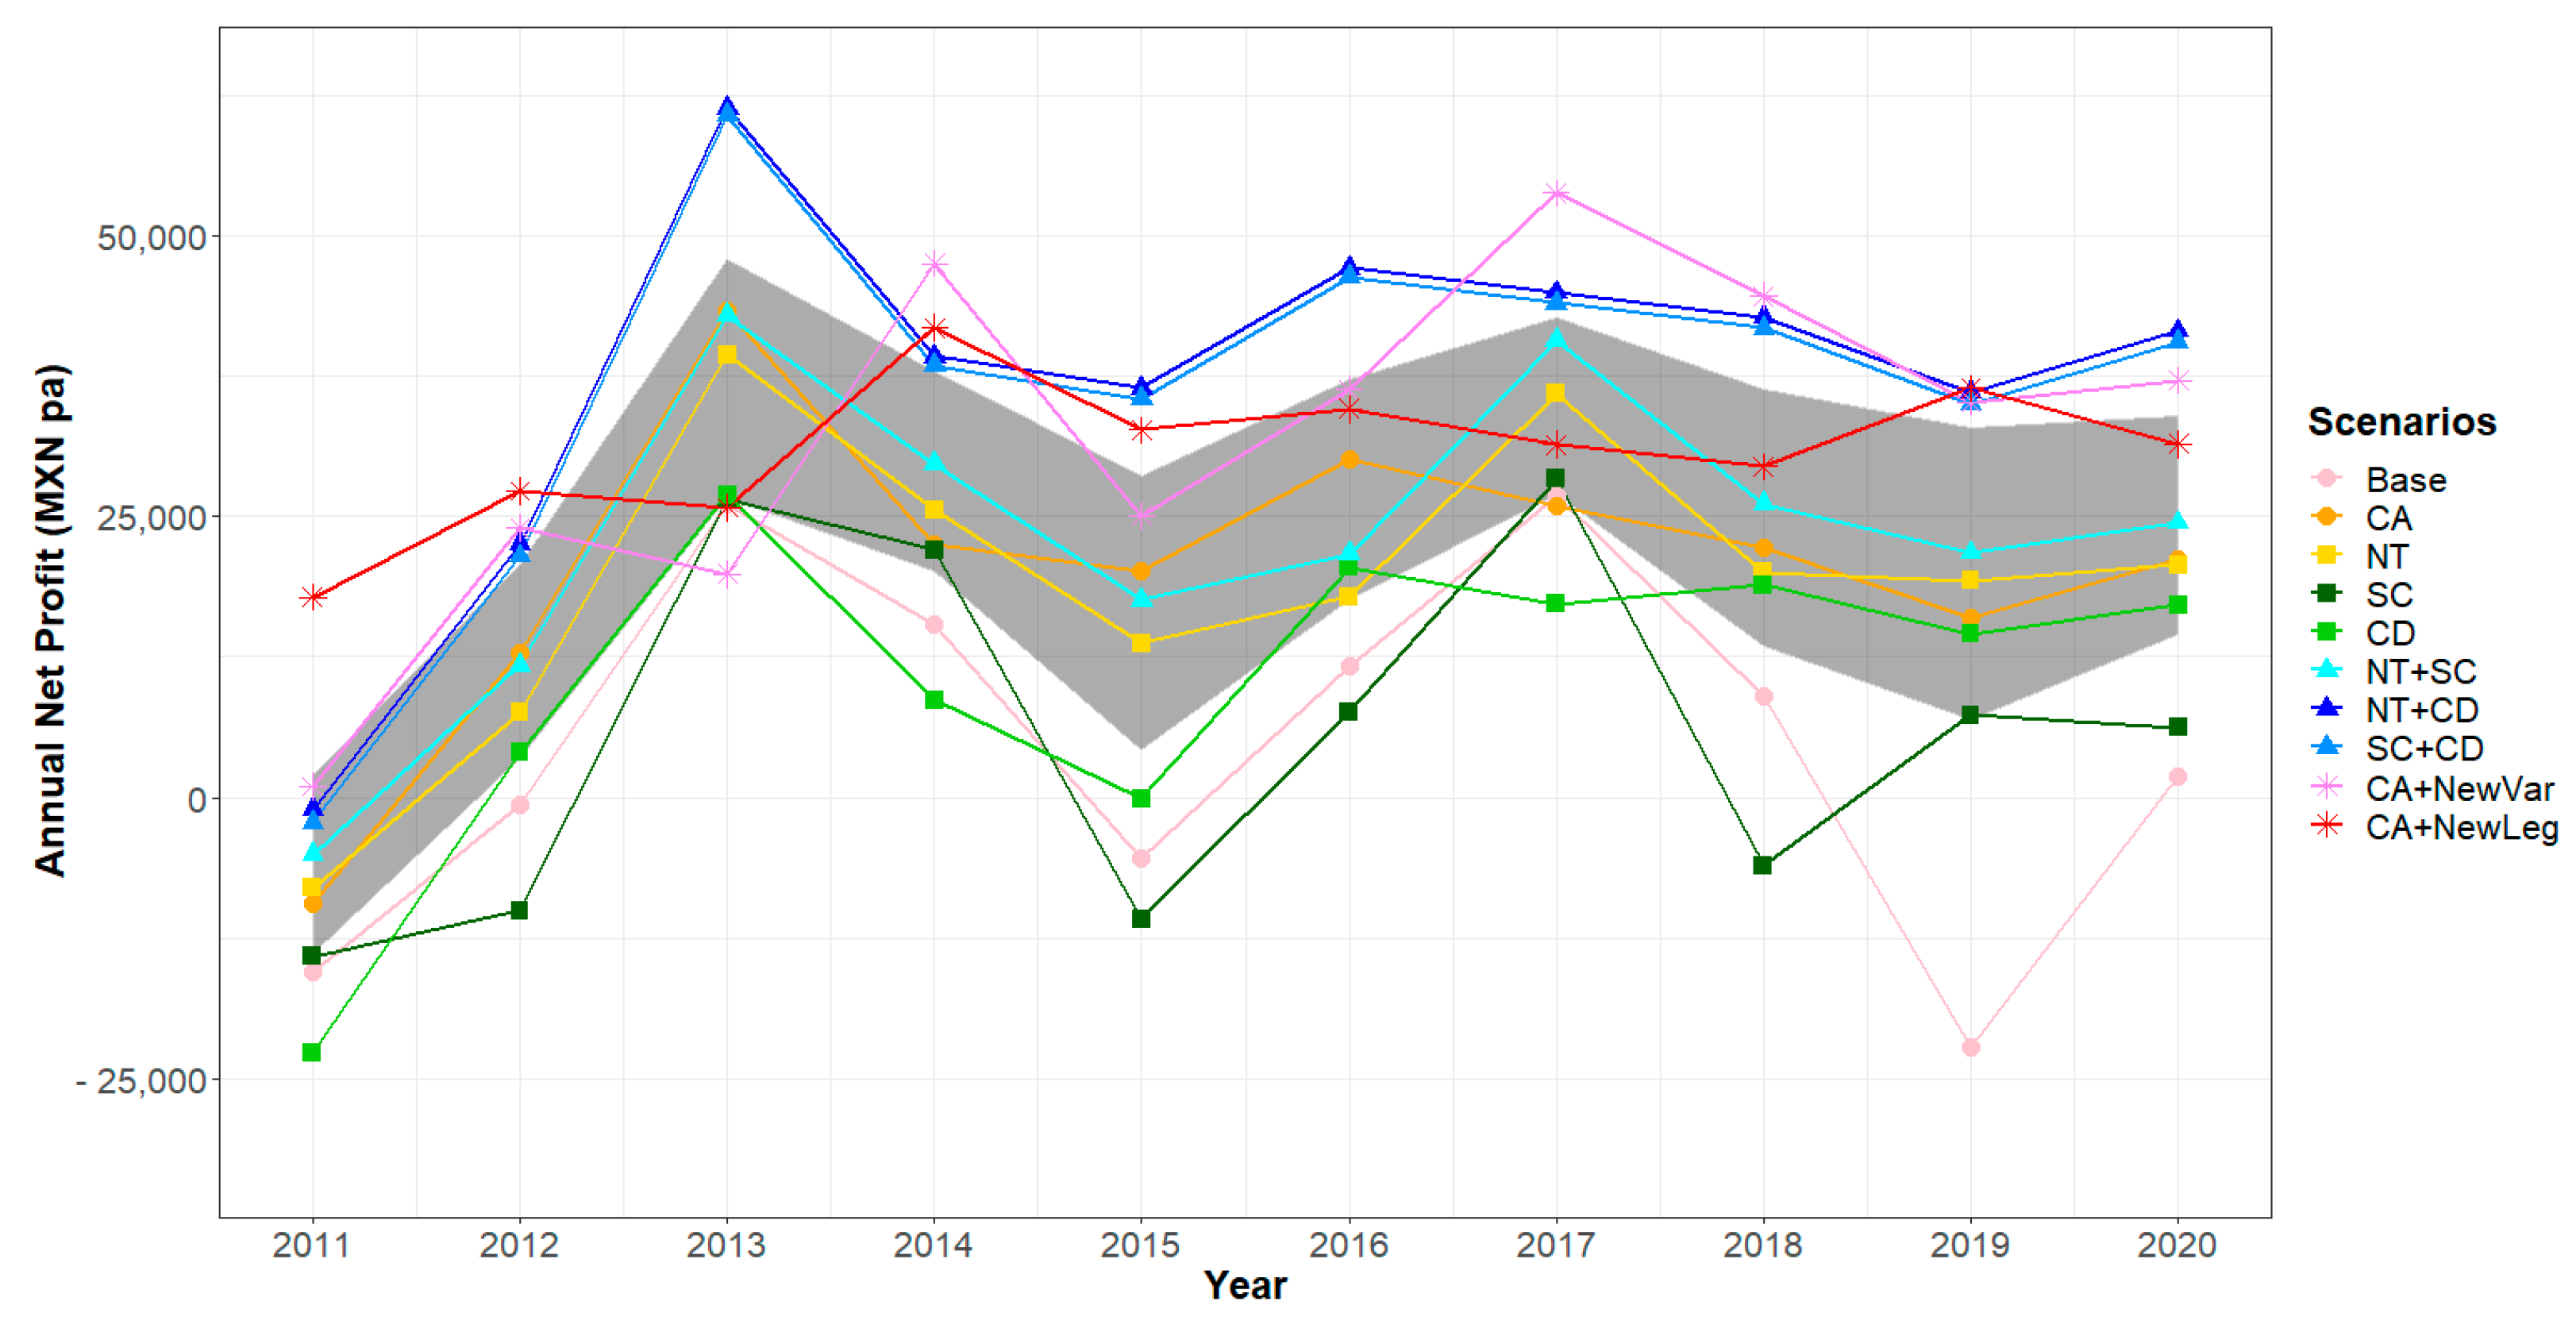
3.1. Whole-Farm Profitability

Based on key assumptions outlined in Section 2.3, the disaggregated results for all possible combinations of CA components, shown in Table 2 and Figure 3, indicated that the two-component scenarios with a legume crop (NT + CD and SC + CD) outperformed all other scenarios analysed, with an average farm net profit of around 29,000 MXN pa. NT + SC was also profitable, but to a lesser degree. This does not mean that these practices are better or more stable in the long run, but they offer greater potential to initiate the transition process to more sustainable farming practices. The improved CA scenarios performed considerably better than the standard CA, with hybrid maize and grass pea boosting CA profits by 58% (CA + NewVar) and 51% (CA + NewLeg). The findings are more of a reflection on hybrid maize and grass peas, thereby supporting the role of crop improvement and underlining ample opportunity for crop diversification to facilitate intensification of agricultural systems. SC was the least profitable of the innovation scenarios, with a 21% gain relative to the baseline, despite the largest savings in labour costs (14%), at least in this context. While the analysis was underpinned by the assumption that the various practices were perfectly implemented and achieved their goal, in reality, when not guided, farmers may implement only what they perceive to be the innovation (e.g., reduced tillage instead of no-tillage), or disturb subsoil too often in CA conditions, or have cattle grazing in a CA field—all of which would likely deliver suboptimal results. Conversely, conventional systems may rely on better practices than those assumed in the study baseline, such as mixes of criollo/creolised and hybrid maize varieties, and/or some irrigation enabling double cropping.
Overall, the benefits of the innovation scenarios were accrued from improvements in crop and livestock production and cost savings in overheads, machinery hire, purchased fodder, labour hire, and other inputs, while mitigating risk (lower SD and CV, higher CVar0.1 and p(π ≥ 0)) (Table 2). The cost-saving benefits of conservation practices, including NT, are well documented (e.g., [5]). For current assumptions, the highest net value of all innovation scenarios was generated for NT + CD and SC + CD (>200,000 MXN), followed by CA + NewVar, CA + NewLeg, NT + SC and CA (>100,000 MXN), compared with lower net values for NT, CD, and SC (Table 2). These results support the case for equal consideration of agronomic research and technical support beyond yield gains when promoting new crop varieties.
The share of revenue growth in the innovation scenarios that came from direct sale and consumption of crop grains increased by up to 2.6% for conventional maize (CA), up to 6.3% for sorghum (CA + NewLeg), and 119% for hybrid maize (CA + NewVar) on a per-hectare basis (although a significant rise in input costs resulted in lower crop gross margins relative to the baseline). It should be noted that all scenarios with crop diversification (CA, CD, NT + CD, SC + CD, CA + NewVar, CA + NewLeg) implied moving from a two-way area split to a three-way split, resulting in a reduction in area from 1.8 ha (for maize and sorghum each) to 1.2 ha for each rotational crop, including maize, sorghum and a legume crop—with the legume making a significant contribution to the farm bottom line (12,067 MXN for beans and 23,294 MXN for grass pea) (Table 2).
We showed livestock management to be a profitable activity that could continue to play a key role in the long-term viability of mixed smallholder farming systems. The underlying assumption is that the farmer/trader buys low-cost cows that can be fattened and then sold at a profit. Compared with the baseline, cattle gross margins increased by up to 21% and calf births increased by 4.3% in several scenarios (Table 2). The reduction of up to 12% in cattle gross margin in the CA scenarios was due to the high retention of crop residue on the field, otherwise used for fodder.
A major driver of farm profitability in the two-component scenarios was a 31% reduction in the cost of purchased fodder relative to the baseline, due to a combination of increases in maize and sorghum yields and biomass production, integration of a legume crop with high-quality stubble and, above all, more efficient stubble management (Table 2). CD had the highest fodder costs due to 80% of crop stubble being sold (Table 1 and Table 2).
Moving from conventional to almost any conservation variation assumes a reduction in machinery passes on the field due to reduced tillage [13] and consequently reduced machine hire costs, which resulted in lower overhead costs (by up to 16%). This had a significant positive impact on the farm bottom line (Table 2). Most scenarios required 9% more labour relative to the baseline, matching the wider expectation that farm intensification—while improving efficiencies—will put extra pressure on labour resources. Adequate mechanisation planning could be needed to counterbalance this conflict [94].
Moving from traditional varieties and crops—such as criollo/creolised maize and beans—to the more productive hybrid maize and grass peas improved the profitability of CA relative to the other scenarios. However, these scenarios were not tested with the new variety and crop options in this study. Likewise, introducing irrigation could potentially benefit the CA package through increased yield [8] or yield stabilisation under climate change scenarios [40]. It should be noted that this does not always result in higher yields compared with conventional practices in irrigated conditions [4].
Small-scale maize farmers may expect economic gains from combinations of reduced tillage, retention of sufficient residues, and appropriate rotations, compared with the common practices of heavy tillage before seeding, monocropping, and crop residue removal. The simulation captured key whole-farm trade-offs, based on trialled CA benefits in this region, including up to 30% maize yield increases over 10 years, higher crop and cattle revenue, and larger cost-savings in fodder, labour, and machinery hire. Smaller benefits from CA relative to conventional systems captured in other economic studies with a focus on Africa are likely justified by lower assumed yield gains from CA [16,60], as well as a lack of whole-farm analyses accounting for machinery hire and/or crop-livestock trade-offs, especially since a major constraint of full CA adoption is livestock ownership, which affects residue retention on/in the field instead of removal as baled fodder [24]. Likewise, previous Value-Ag studies around the introduction of a legume crop—either in rotation with a traditional rice crop in Southeast Asia [54] or in intercropping with maize in South Africa (unpublished results)—generated lower profit gains (26–40%) but did not consider other CA components besides crop diversification.

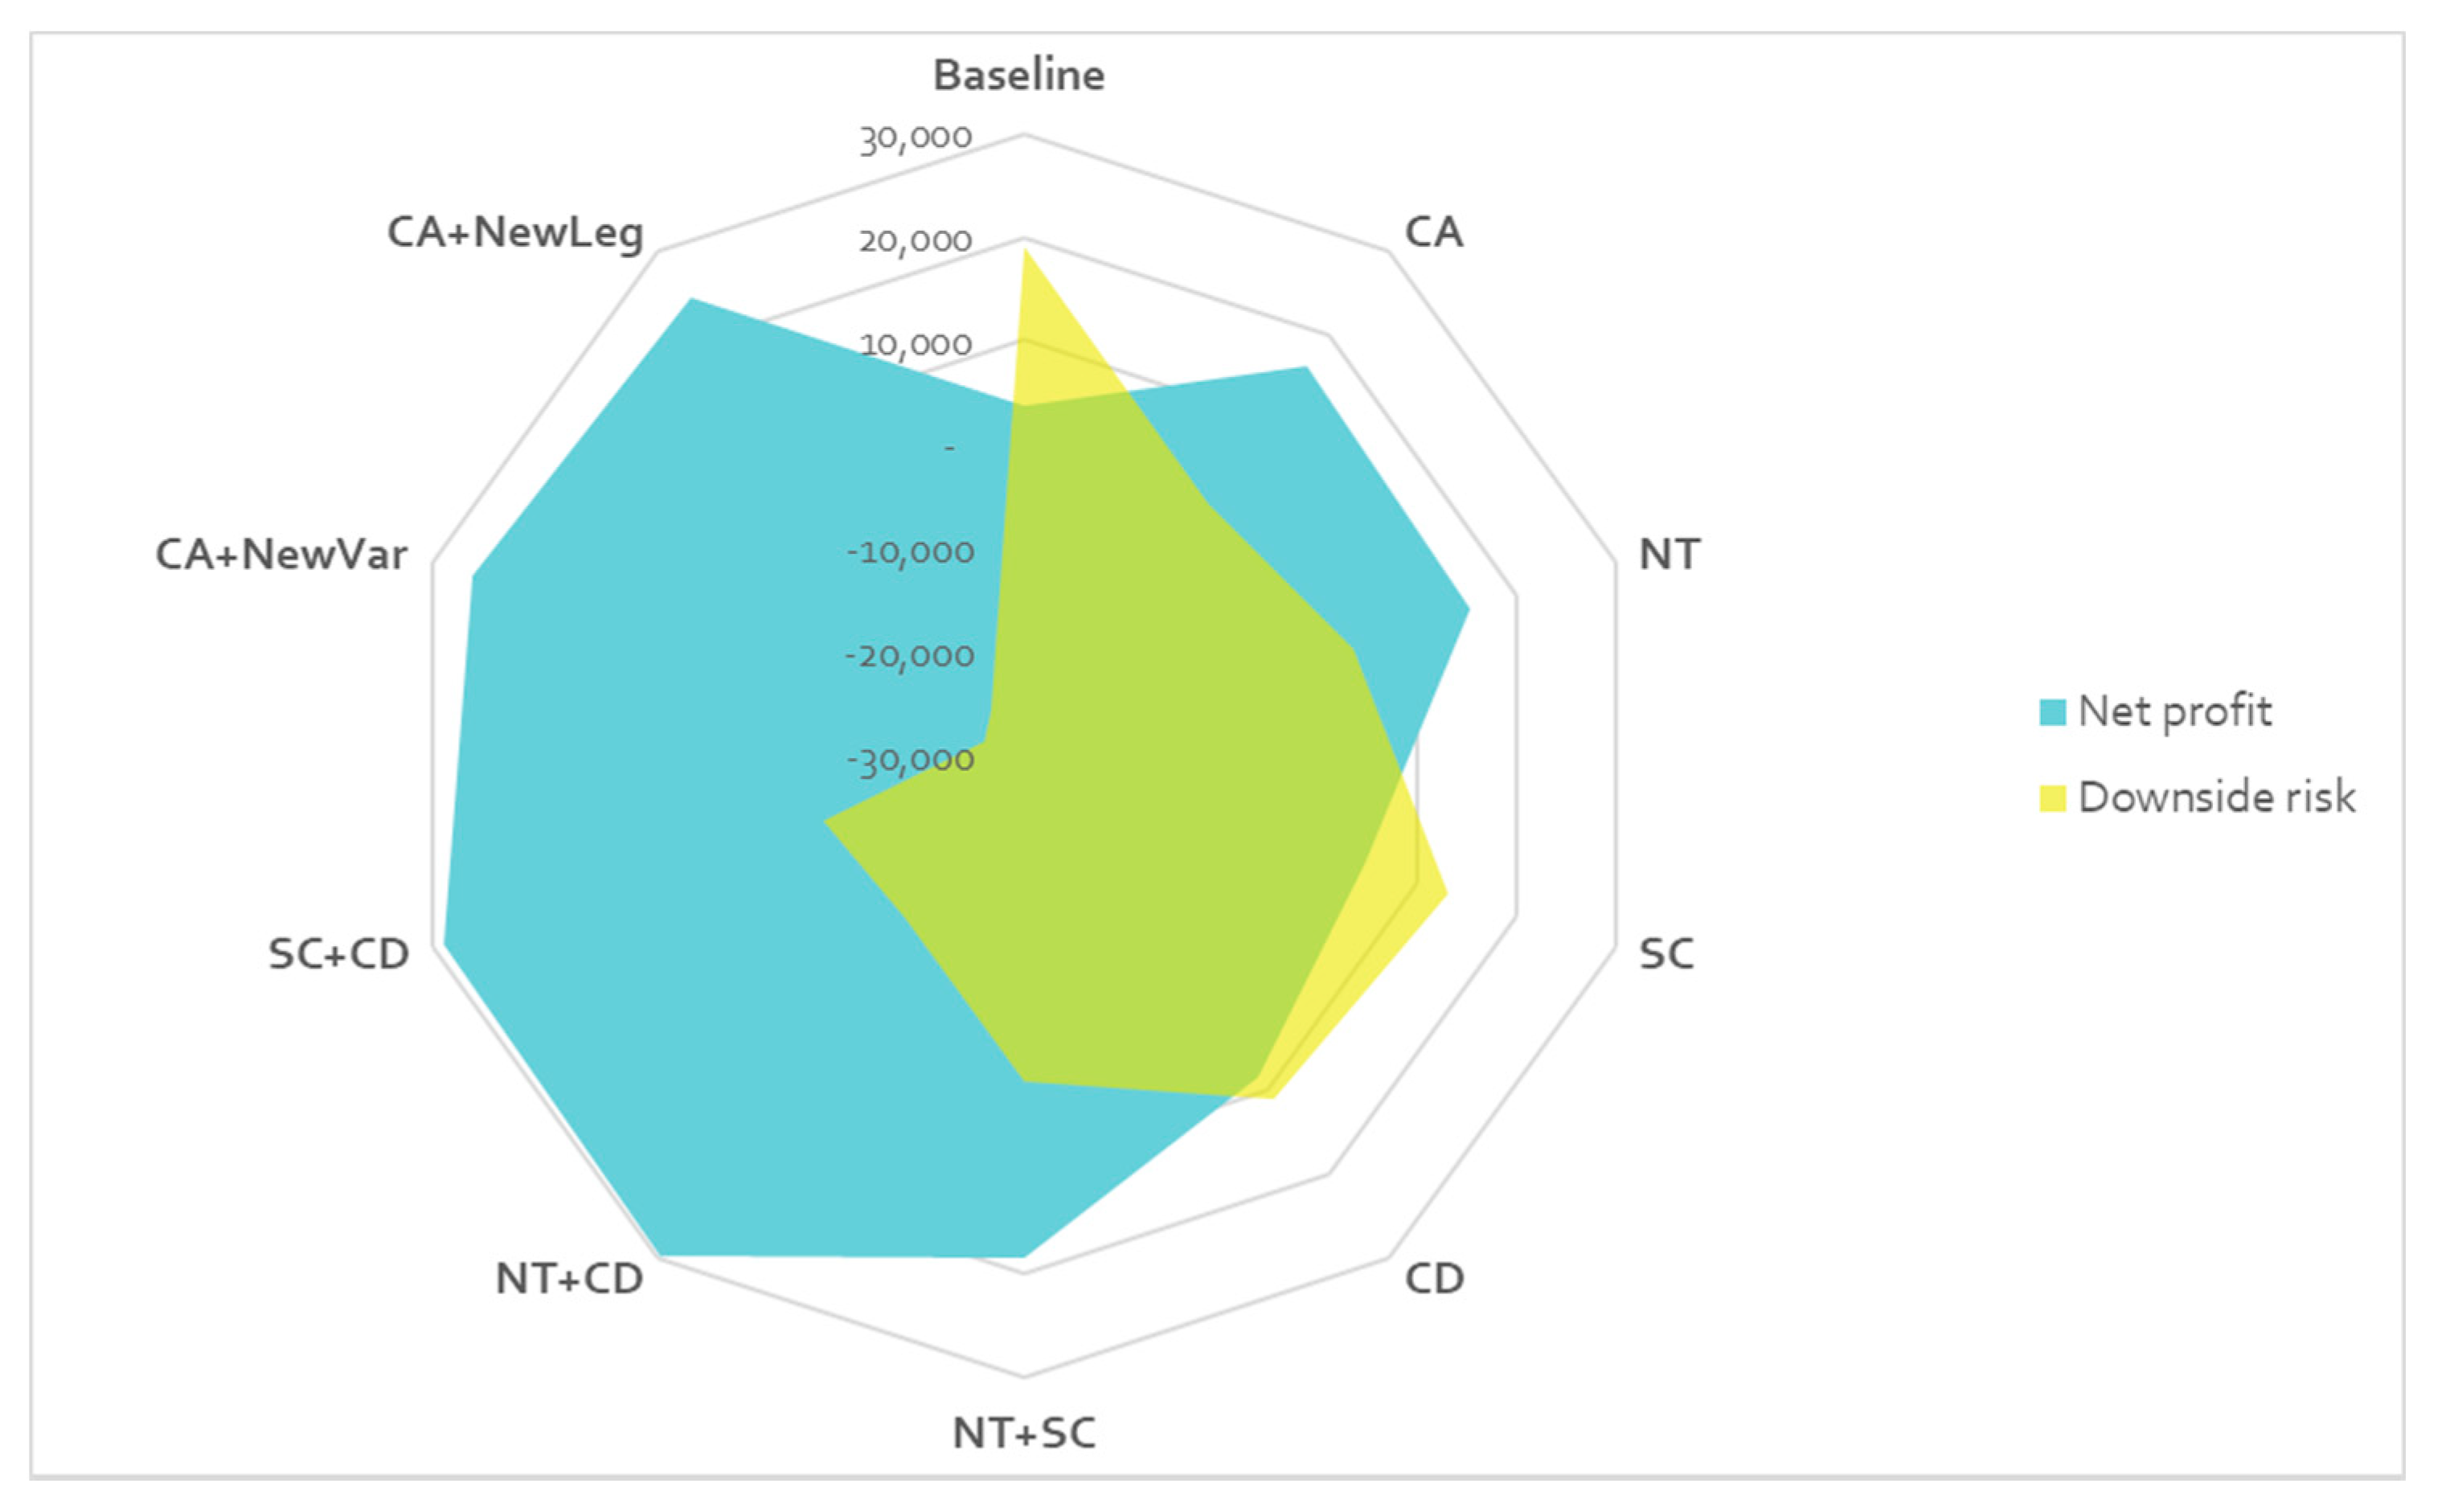
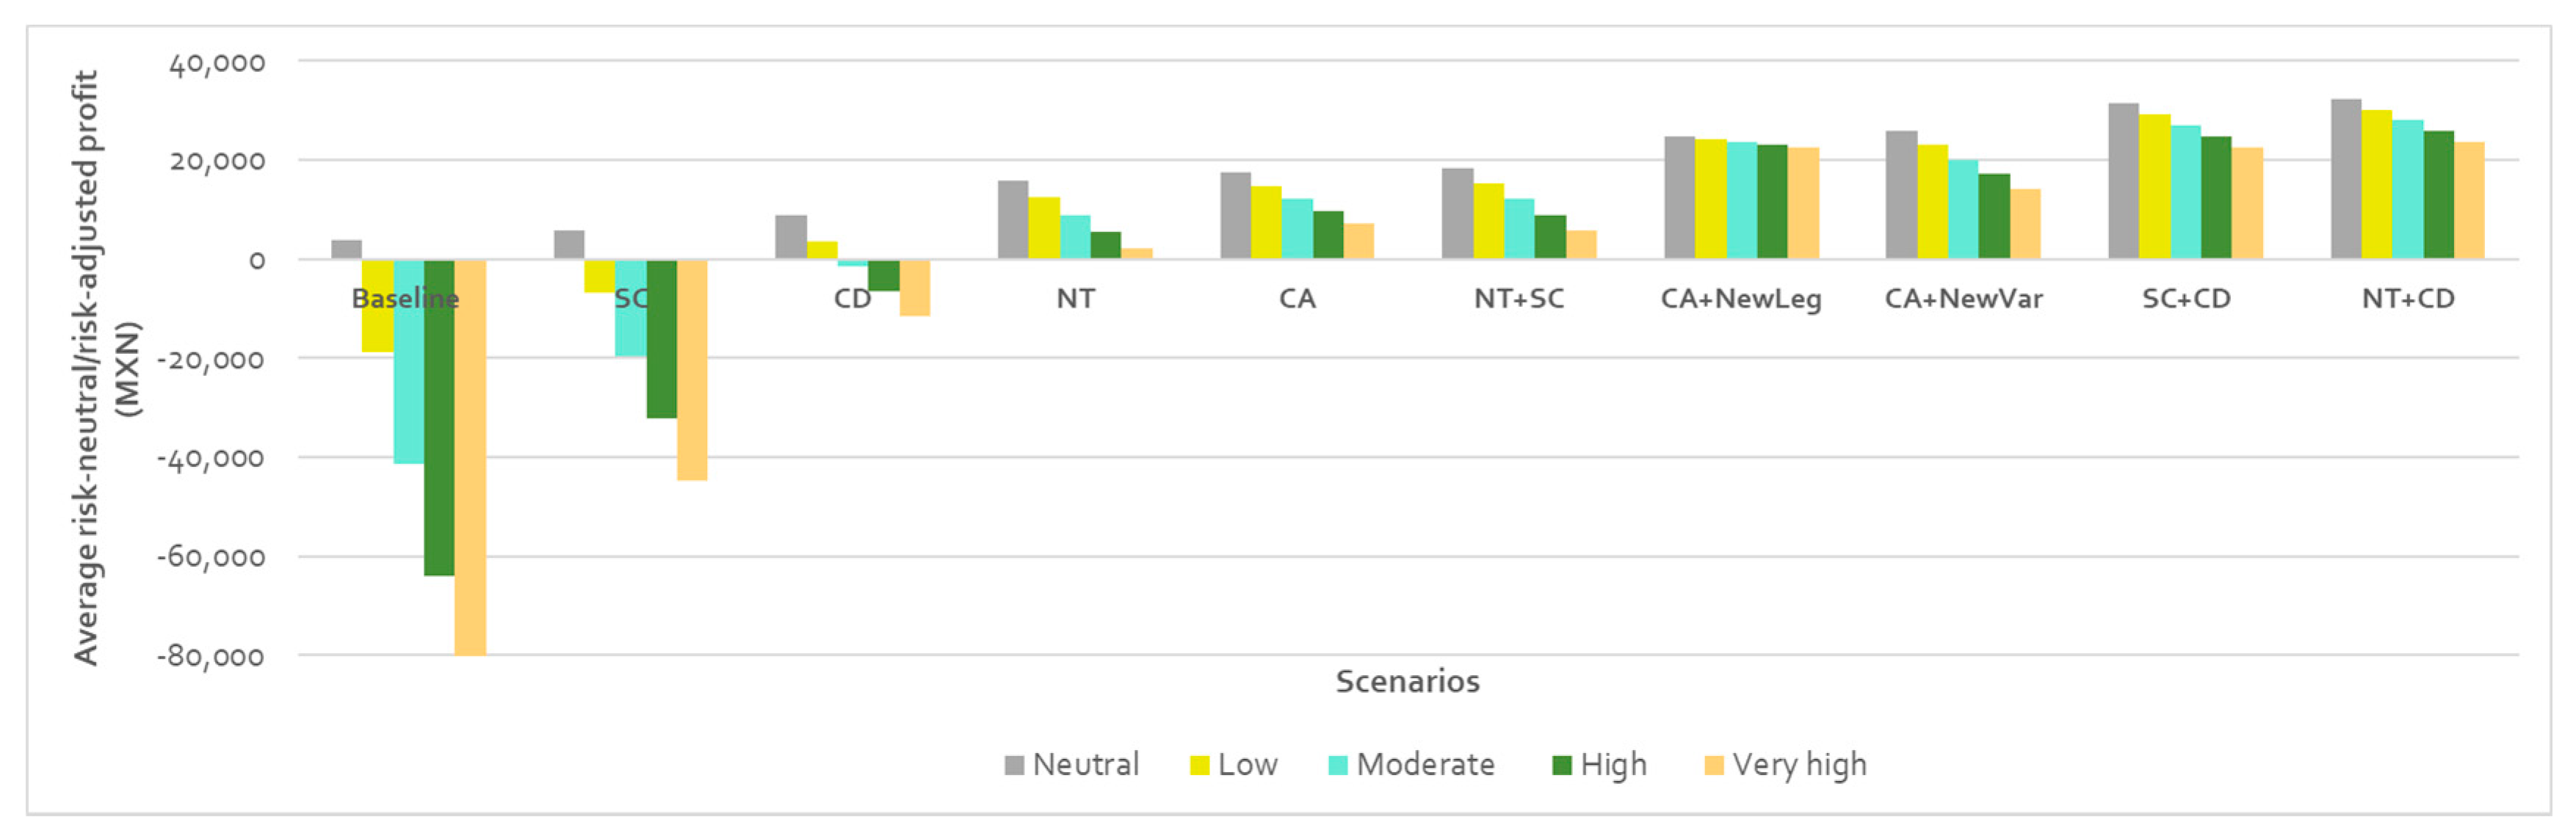
3.2. Downside Risk and Farmer Risk Aversion

As indicated in Section 2.2.2, all innovation scenarios had the positive effect of reducing CVar0.1 (or downside risk) significantly, relative to the baseline. This was especially true in the poorer growing seasons (e.g., 2015 and 2019) where stable livestock performance and feed system offset rainfall-dependent losses in crop yields. Other key drivers of financial risk mitigation included lower overhead/machinery costs (in CA- and NT-based scenarios), and more reliable gross margins (hybrid maize and grass pea) (Table 2). CVar0.1 was reduced for all other innovation scenarios over 10 years by between 32% (SC) and around 230% (CA+ scenarios). The probability of break-even, p(π ≥ 0), varied between 61% (baseline) and 100% (CA+ scenarios). The CV of net profit decreased from 3.46 in the baseline to 0.21 (94%) in CA + NewLeg, suggesting a significantly reduced risk, or increased resilience in most cases (Table 2, Figure 4). Importantly, key trade-offs between profit and risk were identified across the analysed scenarios, and these are expected to change with each case study.
The results so far assumed a farmer with a risk-neutral behaviour (i.e., nil risk aversion). Accounting for four levels of risk aversion (low, moderate, high, very high), we found that the highest risk-adjusted profit was achieved across all risk aversion levels by the NT + CD and SC + CD scenarios (Figure 5), closely followed by CA + NewVar and CA + NewLeg. Similarly, NT + SC, CA and NT generated positive risk-adjusted profit for all levels of risk aversion. CD ranked next with a positive profit achieved for a neutral- to low- risk-averse farmer. Additionally, while SC broke even in risk-neutral conditions, it was too risky for any risk-averse farmer in this context (Figure 5). The maximum cost of risk aversion significantly varied from 2184 MXN (CA + NewLeg) and 8623 MXN (NT + CD) to 50,493 MXN (SC). These results suggest that improved CA and two-component packages are less risky than single practices or standard CA, and could become the preferred option of more risk-averse farmers. Thus, they could be potentially appealing options to all types of farmers.
The opportunity to provide evidence on which practices are more likely to reduce risk or boost the net profit of farms increases the likelihood of risk-averse farmers adopting conservation practices [60,95]. Likewise, the knowledge that non-action (baseline) or reluctance to step away from conventional practices (out of fear of change) poses at least and equal risk to farmers is very valuable in the case-study context.

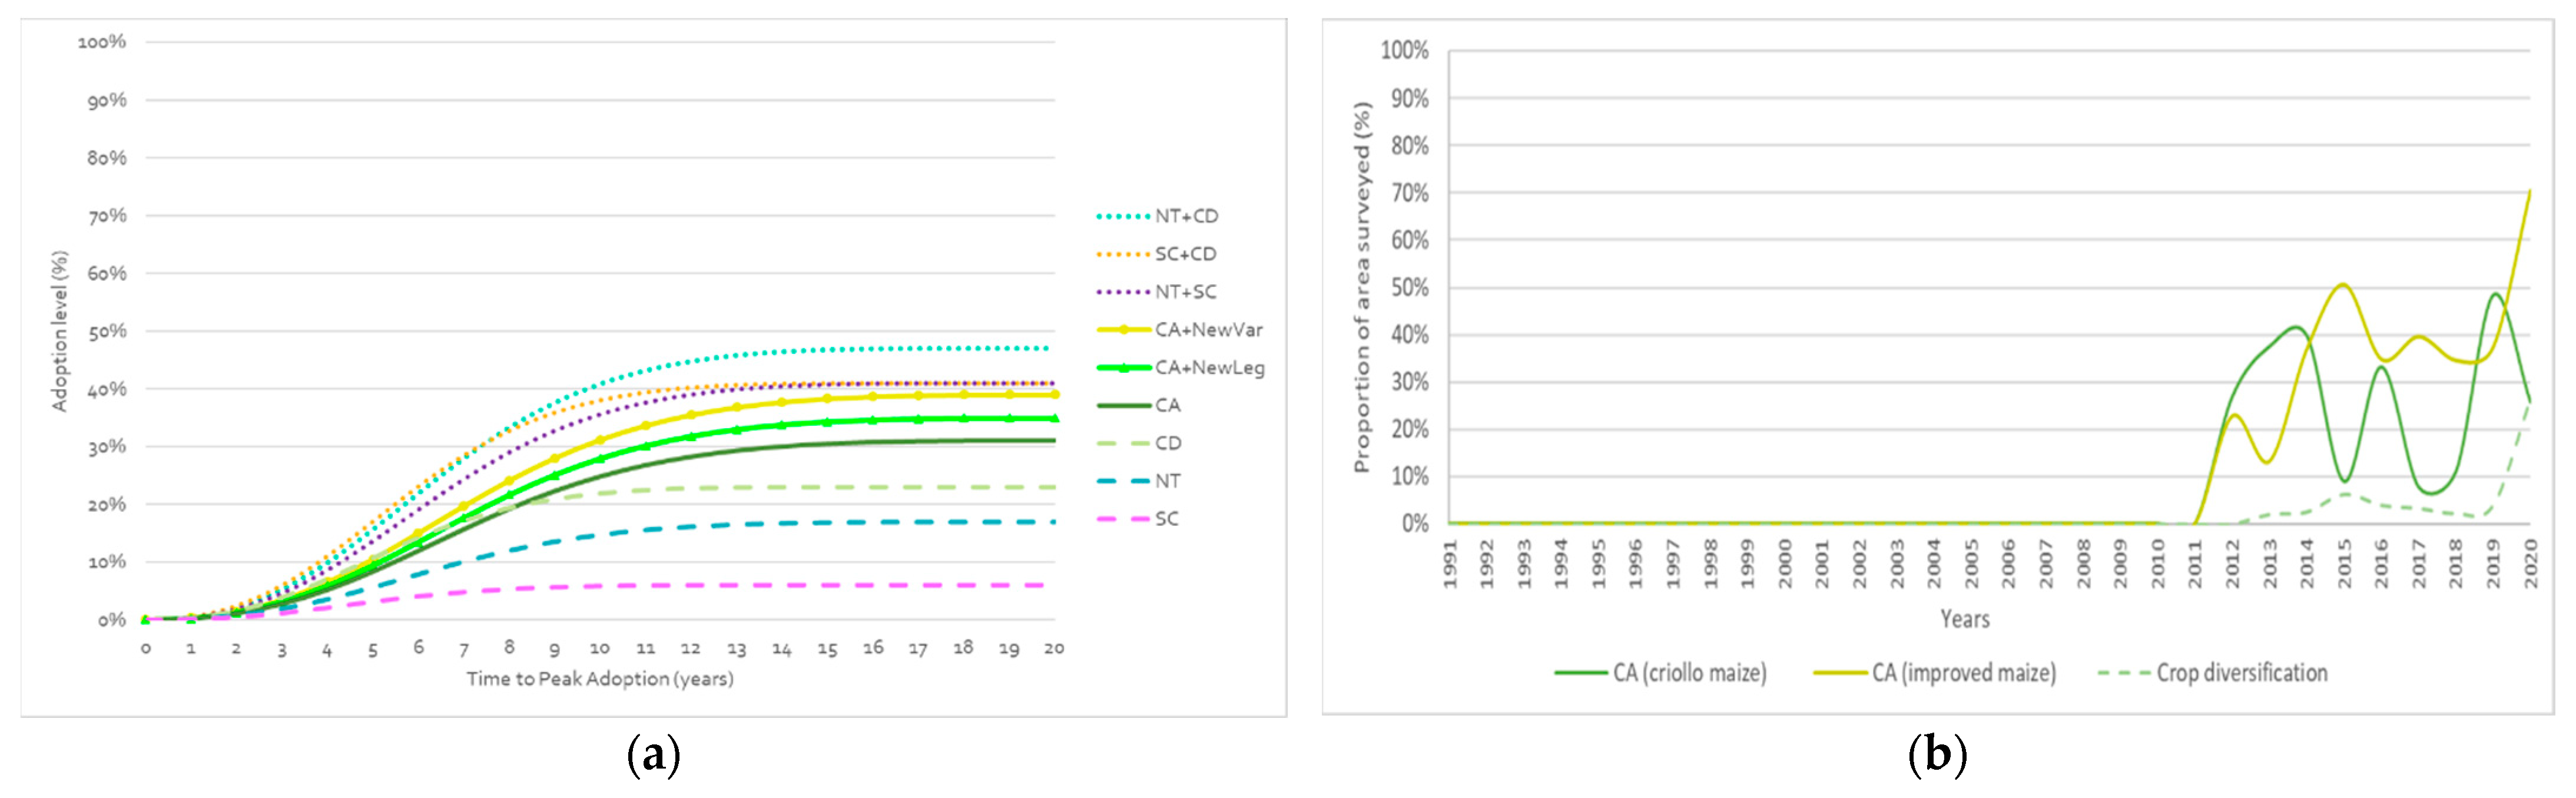
3.3. Peak Adoption and Time to Peak Adoption

While the official CA adoption records for Guanajuato only date back to 2012 [65], the innovation was first implemented 30 years ago with early trials taking place at the Centro de Desarrollo Tecnológico Villadiego in Valle de Santiago in 1988 and 1990 [96]. The implicit slow transition to sustainable farming in the region confirms that the adoption of conservation practices is a gradual and dynamic process [15,97]. Given limited information on the long-term adoption of most CA components in the region (and negligible adoption of newly introduced crops like the grass pea), workshop participants used Smallholder ADOPT to generate predictions of future Peak Adoption and Time to Peak Adoption for all innovation scenarios (Figure 6a). For example, 28% of the representative farm type (T6) in southern Guanajuato could adopt CA with a productive legume such as the grass pea (CA + NewLeg) on their farm within 10 years; it would take 20 years to reach 35% Peak Adoption. Table S2 summarises the results from Smallholder ADOPT, along with all questions and the responses that were chosen for each innovation scenario based on group consensus.
It is worth noting that the relative advantage for the target farmer population was unchanged across scenarios (Q1–6) as population characteristics and attitudes (e.g., risk orientation) were not assumed to be substantially influenced by typical project interventions. Some responses remained subjective, however, such as the relative upfront cost of CA machinery (Q14), which can be larger than expected due to extra security requirements in the specific area of intervention or supply and demand issues linked with the particularities of specific CA machinery, like direct seeders, residue management equipment, or precision fertilisers. This could hinder further adoption of CA in the region, which has low adaptive manufacturing infrastructure and bad distribution channels that complicate access to these more specialised mechanical solutions. The ease and convenience of CA (Q22) can also be perceived through a social lens, considering factors such as tradition, neighbour opinion (even aggression due to straw burning), and other economic impacts including youth migration and local labour availability [98]. Additionally, while there is a relative advantage of the innovations in terms of social cohesion, human and animal health, the environmental footprint generated, and the information gap (which is captured to some extent in Qs 16–20), the full potential and long-term impacts of CA-based practices in situ remain difficult to quantify.
We showed partial adoption validation using actual data (rain-fed, ciclo PV) from a total surveyed farm area of less than 2000 ha (i.e., with and without the innovation) implementing CA (using criollo and improved/hybrid maize) and crop diversification (using various crop types, including legumes) in Guanajuato over nine years (2012–2020) [65]. A similar period of the analysis confirmed a growing trend in the region to adopt CA practices, along with improved maize varieties (Figure 6b). However, the surveyed area was less than the total farmed area in southern Guanajuato and may also not directly equate to the number of farmers adopting these technologies. Additionally, reduced tillage has been widely adopted (67%) in the broader, partly irrigated Bajío region of Mexico [24], where improved soil moisture conditions better suit no or reduced tillage [9]. Adoption validation data will inform ongoing calibration of Smallholder ADOPT.
Overall, selected bundles of conservation practices (NT + CD, NT + SC, SC + CD, CA + NewVar,) would be the most likely to be adopted by the farmers identified in this case study, although it would take two to five years longer to reach Peak Adoption relative to single subsets (NT, SC, CD). This research’s findings aligned with Canales et al. who suggested that complementarities between conservation practices may enhance the benefits from adoption and thus the speed of adoption over time [22]. It is crucial to note that with potential changes in rainfall, farm resources and management, commodity prices, and farmers’ attitudes, the relative scale and speed of adoption of interventions would be expected to change further [16,22].

3.4. Impact Assessment

Combining the annual net values and the adoption curves within Value-Ag resulted in a more accurate estimation of the net value of each innovation scenario for the targeted 122 smallholder farmers in the case study area. The predicted lower rate of adoption of each innovation scenario resulted in significant differences in profit impact with full adoption vs. predicted adoption. The expected value generated by each scenario can be summarised as the profit impact of the innovation with predicted adoption (see Section 2.2.4), ranked as follows: 145% NT + CD, 140% SC + CD, 98% CA + NewVar, 75% NT + SC, 72% CA + NewLeg, 41% CA, 25% NT, 24% CD, and 1.7% SC.
Even though conservation practices were found to increase farm profitability and resilience over the 10-year period investigated, the region-wide value of intensifying this central Mexican mixed system will depend on how many target farmers adopt these practices and to what extent. Clearly there is a need for long-term commitment and program continuity to sustain farmer support and promote innovation uptake across the region over several years.

3.5. Implications of Assessing the Value of CA Technologies

For the representative farm (T6) in southern Guanajuato, the double-component scenarios NT + CD and SC + CD performed better than the CA packages, and much better than the single scenarios in terms of farm profitability, risk mitigation—across all five levels of farmer risk aversion—and overall net value. The profit impact of the innovations with predicted adoption averaged 120% in the two-component scenarios, 70% in the CA-based scenarios, and 17% in the single scenarios. These findings could inform CA-related investment decisions by the government of Guanajuato, for example, by justifying the need for technical assistance over the years. They could also help inform decision making by building on the gradual progress of implementing one innovation—or a component thereof—and subsequently changing the system to include other innovations, such as new crops or varieties, farm machinery, precision agriculture technologies, or even irrigation.
This analysis supports the idea that CA should not be promoted as a one-size-fits-all solution and that there is a real benefit in disaggregating the CA package into smaller components to better suit diverse agroecological and socioeconomic contexts, as well as different attitudes to risk [60]. It also provided insight into why farmers often adopt the elements of packages like CA in a selective, partial way or do so stepwise over time [15].
We found that livestock ownership—which is associated with residue retention and fodder requirements—and the cost of and access to machinery hire were the main factors that hindered further adoption of CA. Likewise, introducing a new maize variety or alternative legume crop to an existing CA program could significantly increase its value to farmers. However, adoption rates of new varieties and crops are often compromised by lack of awareness, lack of seed access, and high seed prices [24,99].
It is worth noting that positive results occurred despite a number of environmental benefits not being explicitly quantified in the economic risk analysis—although they are captured in predicted adoption outcomes through Smallholder ADOPT Q18 and Q19—such as reduced soil erosion and greenhouse gas (GHG) emissions (e.g., fuel savings, less residue burning, N fertilizer efficiency) [13]. Conversely, there are potential impacts on biodiversity from higher chemical use that could detract from the positive results. A more complete evaluation of the identified conservation practices would be especially relevant for individual components of CA that may be unattractive options in some contexts, given that there likely are needs to couple a surface cover strategy and a reduction of fodder availability with zero-tillage or direct seeding equipment to potentially reap the full agroecological benefits.
Relative to existing evaluation options, Value-Ag can provide: a structured analysis framework for quantification of the impact of innovations on farm productivity, profitability, and resilience; a platform to out-scale these changes across the case-study area based on predicted adoption outcomes; and explicit insights into bioeconomic and socioeconomic trade-offs to improve the design/delivery of intensification options, the engagement of project proponents in R&D evaluation, and the building of research capacity.
Finally, we acknowledge a potential limitation of the study: the results were strictly dependent on the data assumptions underpinning key farm parameters. Nevertheless, this study provided valuable insights that could improve farm productivity and profitability while reducing risk exposure from a range of CA-based scenarios in a smallholder system in central Mexico. It also offered a novel platform to evaluate scaling strategies across Mexico and other regions according to predicted adoption outcomes.

3.6. Future Research Opportunities

This study and the multi-disciplinary team that performed it identified some gaps and opportunities for potential future research:
  • Explore changes in intervention levels and “what-if” scenarios via further scenario and sensitivity analysis at both farm and regional scales. An analysis of the changes in key farm parameters could include grain yields, stubble fate, herd numbers, labour supply, produce prices, and input costs. These, for example, could be a part of new scenario analyses focusing on irrigation, climate change, machine innovation and availability, livestock trade, price shock, or government subsidies. Likewise, changes in key adoption parameters as a result of farm simulation outputs, such as linking risk attitudes to farmer risk aversion metrics, could influence adoption outcomes [49].
  • Characterise wrongfully or partially implemented CA practices and innovations via sensitivity analysis of key parameters (e.g., stubble fate, degree of tillage/subsoil work).
  • Evaluate the performance of the new maize variety (generic hybrid) and legume crop (grass pea) across all scenarios and transient farming systems, not just CA. Specific new maize varieties promoted by CIMMYT and other legume crops in the context of CA and disaggregated scenarios should also be evaluated.
  • Apply a similar approach to the other five farm typologies (T1–T5) identified for Guanajuato [53], as well as to other smallholder contexts across Mexico and beyond. This can help explore how geography, farm size, resources, attitudes to risk, time horizons, irrigation, and market access may impact different conservation practices.
  • Improve the scaling process by exploring potential synergies with other relevant tools, such as CIMMYT’s Scaling Scan that determines the potential to scale [100].
  • Assess the strengths and weaknesses of the Value-Ag approach relative to comparable modelling tools (e.g., TradeOff Analysis-MultiDimensional, TOA-MD) [101] in terms of their performance in quantifying whole-farm profit, risk, adoption, and impact in context-specific conditions.
  • Expand the approach to include additional components for modelled scenarios that reflect the ecosystem services and sustainability factors of the farming systems (e.g., soil carbon accounting, GHG accounting, biodiversity index, land condition index). It could also reflect other factors relating to employment or fee-for-service provisions around farm, including machinery and postharvest services.
  • Expand the approach by using individual household data and aggregating at the end, instead of using average parameters of the farm typology. This Monte Carlo approach will provide not only the expected outcomes but also information on the bandwidth of outcomes.

4. Conclusions

The Value-Ag analytical framework was used to investigate how profit-risk trade-offs, farmer risk aversion, and adoption drivers are likely to impact a range of CA practices to intensify a representative smallholder crop-livestock farm in central Mexico. We were also able to demonstrate the relative value of disaggregating the CA package to suit specific agroecological and socioeconomic conditions. For this case study, two-component and improved CA scenarios were the clear winners in terms of farm profitability and stability, as well as the overall net value given adoption predictions. NT + CD and SC + CD had the highest profit impact overall. Beyond that, the large difference in the cost of risk aversion between these scenarios and most of the others indicated that disaggregating CA into smaller component packages and including a more productive crop/variety will likely increase farmer adoption in riskier contexts.
Our study further demonstrated the potential to learn, not only from where benefits may be greatest, but also where risk and uncertainty can most readily be mitigated. Higher volatility in terms of seasonal rainfall and commodity prices, lower availability of capital and farm labour, reduced market access, and threatened food security are examples of where uncertainty can be mitigated in this way. The complex interplay of these and other factors has a crucial role in determining the economic value of the various components of CA and their likelihood of being adopted, together and separately. Based on this Guanajuato case-study, prioritising livestock and stubble management, a mechanisation strategy, and technical support beyond yield gains when promoting new crops and varieties, along with the gradual implementation of practices, would likely maximise the value from investments in CA in the region. More broadly, our results supported the need for employing a context-specific, system-based approach that quantifies the complex trade-offs and best informs farmer decisions and the strategic prioritisation of research investment in technological change in target geographies around the world.

Supplementary Materials

The following are available online at https://www.mdpi.com/article/10.3390/agronomy11061214/s1. Table S1: Outline of the CIMMYT research workshops; Table S2: Smallholder ADOPT question set and case-study responses across the nine innovation scenarios.

Author Contributions

Conceptualization and methodology, M.M., S.L.-R., J.V.L., K.A.M., G.K. and A.Z.; data acquisition and validation, M.M., S.L.-R., J.V.L., A.Z., E.O.H., J.B. and R.G.S.; formal analysis, M.M.; writing—original draft preparation, M.M.; writing—review and editing, S.L.-R., J.V.L., K.A.M., G.K., A.Z., J.B., B.G. and O.E.; visualizations, M.M., J.V.L. and A.Z.; project administration, funding acquisition and institutional endorsement, G.K., B.G. and O.E. All authors have read and agreed to the published version of the manuscript.

Funding

This collaborative study is the result of a three-month visiting fellowship at CIMMYT’s headquarters in Mexico supported by CSIRO Agriculture & Food Systems Program and CIMMYT’s Socioeconomic Program. The collaboration builds on a multi-stakeholder initiative including the Crops for Mexico Initiative made possible by the generous support of the Government of Mexico, the MasAgro Guanajuato project supported by the Government of Guanajuato, and CIMMYT. It also promotes the sustainable intensification of maize and wheat production in Mexico. Support for this study was also provided by the CGIAR Research program on Maize (CRP MAIZE).

Institutional Review Board Statement

The study was conducted according to the guidelines of the Declaration of Helsinki, and approved by CIMMYT’s Internal Research Ethics Committee (protocol code IREC 2019.033, December 20th, 2019).

Informed Consent Statement

Informed consent was obtained from all subjects involved in the study.

Data Availability Statement

Data supporting reported results can be provided on request.

Acknowledgments

We are grateful to Andrea Gardeazabal, Glória Martínez, Maria de Lourdes Ramírez, Samuel Flores, Carolina Camacho and Trent Blair for releasing key MasAgro datasets and/or providing contextual information underpinning the Guanajuato case study. Muchas gracias to Janin Trinidad for invaluable help with fellowship logistics. We thank Rick Llewellyn, Geoff Kuehne and two anonymous referees for review comments, and Doug Johnson for proof-reading the paper.

Conflicts of Interest

The authors declare no conflict of interest.

Appendix A

Table A1. Typology of rural production units–Guanajuato 2019 (Source: adapted from [52]).
VariablesUnitT1T2T3T4T5T6
StructuralAltitudeMeters183520071824172817881764
Distance to town (>10 k hab.)Km5.811.58.57.18.25.6
Average daily wageMXN166170146156162147
Women participation in local agriculture%0.80.80.30.10.50.2
Youth participation in local agriculture%1.00.80.80.90.90.6
Average farm areaHectare3.63.59.06.55.03.7
Irrigation use (0-nil, 4-high)Index0.90.31.81.31.61.0
Household sizePeople2.73.12.13.34.12.4
Ownership of large livestock (0-nil, 4-high)Index0.53.32.12.10.80.2
Ownership of small livestock (0-nil, 4-high)Index0.10.90.30.30.20.1
Machinery ownership
(0-nil, 6-high)
Index3.22.65.15.04.32.9
Manual toolsNumber5.87.57.68.35.56.8
Animal-powered toolsNumber0.00.70.90.30.00.1
Mechanical toolsNumber1.71.24.85.52.50.8
EconomicHousehold incomeMXN74,59746,539191,209128,979151,17585,557
Agriculture income%93.337.983.784.765.285.5
Livestock income%2.327.45.98.32.52.0
Remittances income%0.97.95.61.44.65.2
Other income%1.38.01.32.825.83.2
Off-farm labour (>6 h)%17.224.026.430.126.233.9
Labour hire%16.422.624.033.846.458.0
Agriculture production self-consumption%1.521.33.23.52.41.6
Access to financial services (0-nil, 1-high)Index0.00.00.10.20.00.1
SocialFamily economic dependence%46.150.077.023.628.962.7
Family average ageAge53.252.766.041.840.460.9
Women in farm%41.048.440.851.552.444.8
Women in agriculture%69.361.430.517.836.58.2
Meat consumptionTimes/week1.91.42.62.52.72.1
Constant annual incomeMonths2.46.84.95.98.55.4
Household savings%3.12.812.46.511.311.7
Farm population below poverty level%50.963.546.343.447.756.4
Risk aversion (0-nil, 1-high)Index0.40.40.40.30.30.3

Appendix B

Figure A1. Framework of the Integrated Analysis Tool (IAT) (Source: adapted from [56]).
Agronomy 11 01214 g0a1

References

  1. FAO. Available online: http://www.fao.org/3/ca7126en/CA7126EN.pdf (accessed on 20 December 2020).
  2. FAO. Available online: http://www.fao.org/publications/card/en/c/981ab2a0-f3c6-4de3-a058-f0df6658e69f/ (accessed on 23 March 2021).
  3. Giller, K.E.; Witter, E.; Corbeels, M.; Tittonell, P. Conservation agriculture and smallholder farming in Africa: The heretics’ view. Field Crops Res. 2009, 114, 23–34. [Google Scholar] [CrossRef]
  4. Verhulst, N.; Carrillo-García, A.; Moeller, C.; Trethowan, R.; Sayre, K.D.; Govaerts, B. Conservation agriculture for wheat-based cropping systems under gravity irrigation: Increasing resilience through improved soil quality. Plant Soil. 2011, 340, 467–479. [Google Scholar] [CrossRef]
  5. Erenstein, O.; Sayre, K.; Wall, P.; Hellin, J.; Dixon, J. Conservation Agriculture in Maize- and Wheat-Based Systems in the (Sub)tropics: Lessons from Adaptation Initiatives in South Asia, Mexico, and Southern Africa. J. Sustain. Agric. 2012, 36, 180–206. [Google Scholar] [CrossRef]
  6. Corbeels, M.; de Graaff, J.; Ndah, T.H.; Penot, E.; Baudron, F.; Naudin, K.; Andrieu, N.; Chirat, G.; Schuler, J.; Nyagumbo, I.; et al. Understanding the impact and adoption of conservation agriculture in Africa: A multi-scale analysis. Agric. Ecosyst. Environ. 2014, 187, 155–170. [Google Scholar] [CrossRef]
  7. Rodriguez, D.; de Voil, P.; Rufino, M.C.; Odendoc, M.; Van Wijk, M.T. To mulch or to munch? Big modelling of big data. Agric. Syst. 2017, 153, 32–42. [Google Scholar] [CrossRef]
  8. Fonteyne, S.; Martinez Gamiño, M.A.; Saldivia Tejeda, A.; Verhulst, N. Conservation Agriculture Improves Long-term Yield and Soil Quality in Irrigated Maize-Oats Rotation. Agronomy 2019, 9, 845. [Google Scholar] [CrossRef] [Green Version]
  9. Pittelkow, C.; Liang, X.; Linquist, B.; Van Groenigen, K.J.; Lee, J.; Lundy, M.E.; Van Gestel, N.; Six, J.; Venterea, R.T.; Van Kessel, C. Productivity limits and potentials of the principles of conservation agriculture. Nature 2015, 517, 365–368. [Google Scholar] [CrossRef]
  10. Descheemaeker, K. Limits of conservation agriculture in Africa. Nat. Food. 2020, 1, 402. [Google Scholar] [CrossRef]
  11. Sun, W.; Canadell, J.G.; Yu, L.; Yu, L.; Zhang, W.; Smith, P.; Fischer, T.; Huang, Y. Climate drives global soil carbon sequestration and crop yield changes under conservation agriculture. Glob. Chang. Biol. 2020, 26, 3325–3335. [Google Scholar] [CrossRef]
  12. Govaerts, B.; Sayre, K.D.; Deckers, J. Stable high yields with zero tillage and permanent bed planting? Field Crops Res. 2005, 94, 33–42. [Google Scholar] [CrossRef]
  13. Verhulst, N.; Govaerts, B.; Sayre, K.D.; Sonder, K.; Romero-Perezgrovas, R.; Mezzalama, M.; Dendooven, L. Conservation agriculture as a means to mitigate and adapt to climate change, a case study from Mexico. In Climate Change Mitigation and Agriculture, 1st ed.; Wollenberg, E., Nihart, A., Tapio-Biström, M.L., Grieg-Gran, M., Eds.; Earthscan: London, UK, 2012; p. 287300. [Google Scholar]
  14. Tittonell, P.; Van Wijk, M.; Herrero, M.; Rufino, M.; de Ridder, N.; Giller, K. Beyond resource constraints—Exploring the biophysical feasibility of options for the intensification of smallholder crop-livestock systems in Vihiga district, Kenya. Agric. Syst. 2009, 101, 1–19. [Google Scholar] [CrossRef]
  15. Brown, B.; Nuberg, I.; Llewellyn, R. Stepwise frameworks for understanding the utilisation of conservation agriculture in Africa. Agric. Syst. 2017, 153, 11–22. [Google Scholar] [CrossRef]
  16. Corbeels, M.; Naudin, K.; Whitbread, A.M.; Kühne, R.; Letourmy, P. Limits of conservation agriculture to overcome low crop yields in sub-Saharan Africa. Nat. Food 2020, 1, 447–454. [Google Scholar] [CrossRef]
  17. Pannell, D.J.; Marshall, G.R.; Barr, N.; Curtis, A.; Vanclay, F.; Wilkinson, R. Understanding and promoting adoption of conservation practices by rural landholders. Aust. J. Exp. Agric. 2006, 46, 1407–1424. [Google Scholar] [CrossRef] [Green Version]
  18. Carlisle, L. Factors influencing farmer adoption of soil health practices in the United States: A narrative review. Agroecol. Sustain. Food Syst. 2016, 40, 583–613. [Google Scholar] [CrossRef]
  19. Valdivia, R.O.; Antle, J.M.; Stoorvogel, J.J. Designing and evaluating sustainable development pathways for semi-subsistence crop-livestock systems: Lessons from Kenya. Agric. Econ. 2017, 48, 11–26. [Google Scholar] [CrossRef]
  20. Mottaleb, K. Perception and adoption of a new agricultural technology: Evidence from a developing country. Technol. Soc. 2018, 55, 126–135. [Google Scholar] [CrossRef]
  21. Kassie, M.; Jaleta, M.; Shiferaw, B.; Mmbando, F.; Mekuria, M. Adoption of interrelated sustainable agricultural practices in smallholder systems: Evidence from rural Tanzania. Technol. Forecast. Soc. Chang. 2013, 80, 525–540. [Google Scholar] [CrossRef]
  22. Canales, E.; Bergtold, J.S.; Williams, J.R. Conservation practice complementarity and timing of on-farm adoption. Agric. Econ. 2020, 51, 777–791. [Google Scholar] [CrossRef]
  23. Krishna, V.V.; Yigezu, Y.A.; Karimov, A.A.; Erenstein, O. Assessing technological change in agri-food systems of the Global South: A review of adoption-impact studies in wheat. Outlook Agric. 2020, 49, 89–98. [Google Scholar] [CrossRef]
  24. Van den Broeck, G.; Grovas, R.R.P.; Maertens, M.; Deckers, J.; Verhulst, N.; Govaerts, B. Adoption of Conservation Agriculture in the Mexican Bajío. Outlook Agric. 2013, 42, 171–178. [Google Scholar] [CrossRef] [Green Version]
  25. Van Loon, J.; Woltering, L.; Krupnik, T.J.; Baudron, F.; Boa, M.; Govaerts, B. Scaling agricultural mechanization services in smallholder farming systems: Case studies from sub-Saharan Africa, South Asia, and Latin America. Agric. Syst. 2020, 180, 102792. [Google Scholar] [CrossRef]
  26. Giller, K.E.; Rowe, E.C.; de Ridder, N.; van Keulen, H. Resource use dynamics and interactions in the tropics: Scaling up in space and time. Agric. Syst. 2006, 88, 8–27. [Google Scholar] [CrossRef]
  27. Herrero, M.; Thornton, P.; Notenbaert, A.; Msangi, S.; Wood, S.; Kruska, R.; Dixon, J.; Bossio, D.; van de Steeg, J.; Ade Freeman, H.; et al. Drivers of Change in Crop-Livestock Systems and Their Potential Impacts on Agro-Ecosystems Services and Human Well-Being to 2030; CGIAR Systemwide Livestock program ILRI: Nairobi, Kenya, 2009. [Google Scholar]
  28. Whitbread, A.M.; Robertson, M.J.; Carberry, P.S.; Dimes, J.P. How farming systems simulation can aid the development of more sustainable smallholder farming systems in southern Africa. Eur. J. Agron. 2010, 32, 51–58. [Google Scholar] [CrossRef] [Green Version]
  29. Reynolds, M.; Kropff, M.; Crossa, J.; Koo, J.; Kruseman, G.; Molero Milan, A.; Rutkoski, J.; Schulthess, U.; Balwinder, S.; Sonder, K.; et al. Role of Modelling in International Crop Research: Overview and Some Case Studies. Agronomy 2018, 8, 291. [Google Scholar] [CrossRef] [Green Version]
  30. Woltering, L.; Fehlenberg, K.; Gerard, B.; Ubels, J.; Cooley, L. Scaling—From reaching many to sustainable system change: Implications for design of scalable pilots in pro-poor development. Agric. Syst. 2019, 176, 102652. [Google Scholar] [CrossRef]
  31. Hermans, T.D.G.; Whitfield, S.; Dougill, A.J.; Thierfelder, C. Bridging the disciplinary gap in conservation agriculture research in Malawi. A review. Agron. Sustain. Dev. 2020, 40, 3. [Google Scholar] [CrossRef] [Green Version]
  32. Sadras, V.; Alston, J.; Aphalo, P.; Connor, D.; Denison, R.F.; Fischer, T.; Gray, R.; Hayman, P.; Kirkegaard, J.; Kirchmann, H.; et al. Making science more effective for agriculture. Adv. Agron. 2020, 163, 153–177. [Google Scholar] [CrossRef]
  33. Monjardino, M.; Hochman, Z.; Horan, H. Yield potential determines Australian wheat growers’ capacity to close yield gaps while mitigating economic risk. Agron. Sustain. Dev. 2019, 39, 49. [Google Scholar] [CrossRef]
  34. Fischer, R.A.; Santiveri, F.; Vidal, I.R. Crop rotation, tillage and crop residue management for wheat and maize in the sub-humid tropical highlands: II. Maize and system performance. Field Crops Res. 2002, 79, 123–137. [Google Scholar] [CrossRef]
  35. Hellin, J.; Erenstein, O.; Beuchelt, T.; Camacho, C.; Flores, D. Maize stover use and sustainable crop production in mixed crop–livestock systems in Mexico. Field Crops Res. 2013, 153, 1–21. [Google Scholar] [CrossRef] [Green Version]
  36. Romero-Perezgrovas, R.; Verhulst, N.; De La Rosa, D.; Hernández, V.; Maertens, M.; Deckers, J.; Govaerts, B. Effects of Tillage and Crop Residue Management on Maize Yields and Net Returns in the Central Mexican Highlands Under Drought Conditions. Pedoshpere 2014, 4, 476–486. [Google Scholar] [CrossRef]
  37. Fonteyne, S.; Burgueño, J.; Contreras, B.A.A.; Enriquez, E.A.; Villaseñor, L.C.; Velázquez, F.E.; Cruz, H.E.; Balbuena, J.E.; Solorio, A.E.; Meza, P.G.; et al. Effects of conservation agriculture on physicochemical soil health in 20 maize-based trials in different agro-ecological regions across Mexico. Land Degrad. Dev. 2021, 32, 2242–2256. [Google Scholar] [CrossRef]
  38. SIAP. Available online: http://infosiap.siap.gob.mx/aagricola_siap_gb/icultivo/index.jsp (accessed on 3 March 2020).
  39. FAO. Available online: http://www.fao.org/faostat/en/#data/QC (accessed on 3 March 2021).
  40. Ureta, C.; González, E.J.; Espinosa, A.; Trueba, A.; Piñeyro-Nelson, A.; Álvarez-Buylla, E.R. Maize yield in Mexico under climate change. Agric. Syst. 2020, 177, 102697. [Google Scholar] [CrossRef]
  41. ASERCA. Available online: https://www.gob.mx/aserca/articulos/maiz-grano-cultivo-representativo-demexico?idiom=es (accessed on 10 February 2021).
  42. Fernández Suárez, R.; Morales Chávez, L.A.; Gálvez Mariscal, A. Importancia de los maíces nativos de México en la dieta nacional: Una revisión indispensable. Rev. Fitotec. Mex. 2013, 36, 275–283. [Google Scholar]
  43. FIRA. Available online: https://www.gob.mx/fira/documentos/panoramaagroalimentario (accessed on 10 March 2021).
  44. CIMMYT. MasAgro. Available online: http://masagro.mx/es/2012-06-21-17-47-58/documentos (accessed on 21 January 2020).
  45. CIMMYT. Strategic Plan 2017–2022: Improving Livelihoods through Maize and Wheat Science; Centro Internacional de Mejoramiento de Maiz y Trigo: Texcoco, Mexico, 2016. [Google Scholar]
  46. Liedtka, J.; Salzman, R.; Azer, D. Design Thinking for the Greater Good: Innovation in the Social Sector; Columbia University Press: New York, NY, USA, 2017; p. 352. [Google Scholar]
  47. Govaerts, B.; Chávez, X.; Fernández, A.; Vega, D.; Vázquez, O.; Pérez, M.; Carvajal, A.; Ortega, P.; López, P.; Rodríguez, R.; et al. Maíz para México—Plan Estratégico 2030. CIMMYT. 2019. Available online: https://repository.cimmyt.org/handle/10883/20219 (accessed on 10 January 2021).
  48. Gardeazabal, A.; Lunt, T.; Jahn, M.M.; Verhulst, N.; Hellin, J.; Govaerts, B. Knowledge management for innovation in agri-food systems: A conceptual framework. Knowl. Magn. Res. Pract. 2021. [Google Scholar] [CrossRef]
  49. Monjardino, M.; Kuehne, G.; Cummins, J. Value-Ag: An integrated model for rapid ex-ante impact evaluation of agricultural innovations in smallholder systems. Exp. Agric. 2020, 56, 633–649. [Google Scholar] [CrossRef]
  50. Segura Nieto, M.; Aguirre Gómez, A.; Pons Hernández, J.L. Resumen Parcial de la Base de Datos de las Principals Razas de los Maíces Criollos de “El Bajío” de Guanajuato. Información Agronómica, Nutricional, Proteomica y Molecular. 2006. INIFAP. Available online: http://www.ira.cinvestav.mx/maicescriollos/folleto.pdf (accessed on 10 March 2021).
  51. Preciado Ortiz, R.E.; Terrón Ibarra, A.D.; Aguirre Gómez, A.; Noriega González, L.A.; Cruz Morales, A.S. Conocimiento de la Diversidad y Distribuición Actual del Maíz Nativo y sus Parientes Silvestres en México. Segunda Etapa 2008–2009. Informe Final. Guanajuato, Querétaro, Michoacán. INIFAP, Conabio, INE. Available online: https://www.biodiversidad.gob.mx/media/1/genes/files/Inf_Fin_Gto-Qro_FZ016-050411.pdf (accessed on 10 March 2021).
  52. Zepeda, E.A.; Camacho, C. Tipología de Unidades de Producción Rural—Guanajuato; CIMMYT Report: Texcoco, Mexico, 2019. [Google Scholar]
  53. Zepeda Villarreal, E.A.; Camacho Villa, T.C.; Barba Escoto, L.; López Ridaura, S. Maize productivity gaps: An explanation based on the heterogeneity of Mexico Central and South farm households. Trop. Subtrop. Agroecosyst. 2020, 23, 40. [Google Scholar]
  54. Monjardino, M.; Philp, J.; Kuehne, G.; Phimphachanhvongsod, V.; Sihathep, V.; Denton, M. Quantifying the value of adopting a post-rice legume crop to intensify mixed smallholder farms in Southeast Asia. Agric. Syst. 2020, 177, 102690. [Google Scholar] [CrossRef]
  55. Kruseman, G.; Bairagi, S.; Komarek, A.M.; Molero, M.A.; Nedumaran, S.; Petsakos, A.; Prager, S.; Yigezu, Y.A. CGIAR modeling approaches for resource-constrained scenarios: II. Models for analyzing socioeconomic factors to improve policy recommendations. Crop Sci. 2020, 60, 568–581. [Google Scholar] [CrossRef] [Green Version]
  56. McDonald, C.K.; MacLeod, N.; Lisson, S.; Corfield, J. The Integrated Analysis Tool (IAT)—A model for the evaluation of crop-livestock and socio-economic interventions in smallholder farming systems. Agric. Syst. 2019, 176, 176–189. [Google Scholar] [CrossRef]
  57. Brown, P.R.; Nidumolu, U.B.; Kuehne, G.; Llewellyn, R.S.; Mungai, O.; Brown, B.; Ouzman, J. Development of the Public Release Version of Smallholder Adopt for Developing Countries. ACIAR Impact Assessment Series Report No. 91; Australian Centre for International Agricultural Research: Canberra, Australia, 2016. Available online: https://aciar.gov.au/publication/technical-publications/ias91-development-public-release-version-smallholder-adopt-developing-countries (accessed on 10 January 2020).
  58. Kuehne, G.; Llewellyn, R.; Pannell, D.J.; Wilkinson, R.; Dolling, P.; Ouzman, J.; Ewing, M. Predicting farmer uptake of new agricultural practices: A tool for research, extension and policy. Agric. Syst. 2017, 156, 115–125. [Google Scholar] [CrossRef]
  59. Holzworth, D.P.; Huth, N.I.; deVoil, P.G.; Zurcher, E.J.; Herrmann, N.I.; McLean, G.; Chenu, K.; van Oosterom, E.J.; Snow, V.; Murphy, C.; et al. APSIM—Evolution towards a new generation of agricultural systems simulation. Environ. Modell. Software 2014, 62, 327. [Google Scholar] [CrossRef]
  60. Pannell, D.J.; Llewellyn, R.S.; Corbeels, M. The farm-level economics of conservation agriculture for resource-poor farmers. Agric. Ecosys. Environ. 2014, 187, 52–64. [Google Scholar] [CrossRef]
  61. Hardaker, J.B.; Lien, G.; Anderson, J.R.; Huirne, R.B.M. Coping with Risk in Agriculture: Applied Decision Analysis, 3rd ed.; CABI Pub.: Wallingford, Oxfordshire, UK, 2015; pp. 1–332. [Google Scholar]
  62. Palisade Corporation. Best Fit, Distribution Fitting for Windows v 4.5; Palisade Pub: New York, NY, USA, 2002. [Google Scholar]
  63. Llewellyn, R.S.; Brown, B. Predicting Adoption of Innovations by Farmers: What is Different in Smallholder Agriculture? Appl. Econ. Persp. Policy 2020, 42, 100–112. [Google Scholar] [CrossRef]
  64. Zepeda, E.A.; Barba, L.; Camacho, C. Tipología de Unidades de Producción en el Estado de Guanajuato Identificadas como parte de Proagro; CIMMYT Report: Texcoco, Mexico, 2017. [Google Scholar]
  65. CIMMYT. Bitacora Electronica MasAgro (BEM). Internal information from CIMMYT. 2016. Available online: http://bem.cimmyt.org (accessed on 10 December 2020).
  66. SIAP. Available online: http://infosiap.siap.gob.mx:8080/agricola_siap_gobmx/ResumenProducto.do (accessed on 10 December 2020).
  67. Fernández Rivera, M. Evaluación de Variedades de Grass Pea (Lathyrus sativus L.) en Michoacán. 2018; Unpublished Data. [Google Scholar]
  68. Semillas Berentsen. Paquete Basico para Dietas y Concentrado—Grass pea. Servicios GAQ. 2015, 2016, 2017; Unpublished Data. [Google Scholar]
  69. Semillas Berentsen. Resumen de Ensayo con Grass Pea en Campeche. 2018; Unpublished Data. [Google Scholar]
  70. Indexmudi 2021. Available online: https://www.indexmundi.com/commodities/?commodity=corn&months=120&currency=mxn (accessed on 15 February 2021).
  71. SAGARPA. Available online: https://www.gob.mx/cms/uploads/attachment/file/256428/B_sico-Frijol.pdf (accessed on 15 March 2021).
  72. Hay, R.K.M.; Gilbert, R.A. Variation in the harvest index of tropical maize: Evaluation of recent evidence from Mexico and Malawi. Ann. App. Biol. 2001, 138, 103–109. [Google Scholar] [CrossRef]
  73. Martínez, G.; CIMMYT, El Batán, Mexico. Personal communication, 2020.
  74. Van Loon, J.; CIMMYT, El Batán, Mexico. Personal communication, 2020.
  75. Ortíz Hernandez, E.; CIMMYT, Guanajuato, Mexico. Personal communication, 2021.
  76. Maharjan, K.L. The Effects of Altitude on Crop Farming and Cash Crop Use in Ilam District: Some Implications for Agricultural Policy. The Free Library. Research Centre for Nepal and Asian Studies. 2003. Available online: https://www.thefreelibrary.com/The+effects+of+altitude+on+crop+farming+and+cash+crop+use+in+Ilam...-a0113937397 (accessed on 5 April 2021).
  77. Bellon, M.R.; Adato, M.; Becerril, J.; Mindek, D. Poor farmers’ perceived benefits from different types of maize germplasm: The case of creolization in lowland tropical Mexico. World Dev. 2006, 34, 113–129. [Google Scholar] [CrossRef]
  78. Devkota, K.P.; McDonald, A.J.; Khadka, L.; Khadka, A.; Paudel, G.; Devkota, M. Fertilizers, hybrids, and the sustainable intensification of maize systems in the rainfed mid-hills of Nepal. Eur. J. Agron. 2016, 80, 154–167. [Google Scholar] [CrossRef]
  79. Campbell, C.G. Grass Pea. Lathyrus sativus L. Promoting the Conservation and Use of Underutilized and Neglected Crops. 18. Institute of Plant Genetics and Crop Plant Research, Gatersleben/International Plant Genetic Resources Institute, Rome, Italy. 1997. Available online: https://www.bioversityinternational.org/fileadmin/_migrated/uploads/tx_news/Grass_pea__Lathyrus_sativus_L._430.pdf (accessed on 30 March 2021).
  80. Hanbury, C.D.; Siddique, K.H.M.; Galwey, N.W.; Cocks, P.S. Genotype environment interaction for seed yield and ODAP concentration of Lathyrus sativus L. and L. cicera L. in Mediterranean-type environments. Euphytica 1999, 110, 45–60. [Google Scholar] [CrossRef]
  81. Almeida, N.; Rubiales, D.; Vaz Patto, M. Grass Pea. In Grain Legumes. Handbook of Plant Breeding; De Ron, A., Ed.; Springer: New York, NY, USA, 2015; Volume 10, Chapter VI; pp. 251–265. [Google Scholar]
  82. Dixit, G.P.; Parihar, A.K.; Bohra, A.; Singh, N.P. Achievements and prospects of grass pea (Lathyrus sativus L.) improvement for sustainable food production. Crop J. 2016, 4, 407–416. [Google Scholar] [CrossRef] [Green Version]
  83. Heuzé, V.; Tran, G.; Hassoun, P.; Lessire, M.; Lebas, F. Grass Pea (Lathyrus sativus). Feedipedia, a Programme by Inrae, Cirad, AFZ and FAO. 2016. Available online: https://www.feedipedia.org/node/285 (accessed on 30 March 2021).
  84. Hanbury, C.D.; White, C.L.; Mullan, B.P.; Siddique, K.H.M. A review of the use and potential of Lathyrus sativus L. and L. cicera L. grain for animal feed. Anim. Feed Sci Tech. 2000, 87, 1–27. [Google Scholar] [CrossRef]
  85. Patto, M.C.V.; Skiba, B.; Pang, E.C.K.; Ochatt, S.J.; Lambein, F.; Rubiales, D. Lathyrus improvement for resistance against biotic and abiotic stresses: From classical breeding to marker assisted selection. Euphytica 2006, 147, 133. [Google Scholar] [CrossRef]
  86. Abd El-Moneim, A.M.; van Dorrestein, B.; Baum, M.; Ryan, J.; Bejiga, G. Role of ICARDA in Improving the Nutritional Quality and Yield Potential of Grasspea (Lathyrus sativus L.), for Subsistence Farmers in Dry Areas. Lathyrus Lathyrism Newsl. 2001, 2, 55–58. [Google Scholar]
  87. Hillocks, R.J.; Maruthi, M.N. Grass pea (Lathyrus sativus): Is there a case for further crop improvement? Euphytica 2012, 186, 647–654. [Google Scholar] [CrossRef]
  88. Bohra, A.; Jha, U.C.; Kavi Kishor, P.B.; Pandey, S.; Singh, N.P. Genomics and molecular breeding in lesser explored pulse crops: Current trends and future opportunities. Biotechnol. Adv. 2014, 32, 1410–1428. [Google Scholar] [CrossRef]
  89. Sarker, A.; Fikre, A.; Abd El-Moneim, A.M.; Nakkoul, H.; Singh, M. Reducing anti-nutritional factor and enhancing yield with advancing time of planting and zinc application in grasspea in Ethiopia. J. Sci. Food Agric. 2017, 98, 27–32. [Google Scholar] [CrossRef]
  90. Crinó, P.; Polignano, G.B.; Tavoletti, S. Grass pea, a potentially important crop in Mediterranean agriculture. Grain Legumes 2004, 40, 6–7. [Google Scholar]
  91. Indian Council of Agricultural Research ICAR. Project Coordinator’s Report of all India Coordinated Research Project on Mungbean, Urdbean, Lentil, Lathyrus, Rajmash and Pea, New Delhi. 2009. Available online: https://icar.org.in/files/aicrp-report-2002-07/AICRPsCropScience.pdf (accessed on 30 March 2021).
  92. Gopal Sigh, R.; CIMMYT, El Batán, Mexico. Personal communication, 2021.
  93. Mongabay. 2019. Available online: https://india.mongabay.com/2019/05/toxic-debate-rages-on-over-cultivation-ban-on-khesari-dal/ (accessed on 30 April 2021).
  94. Baudron, F.; Sims, B.; Justice, S.; Kahan, D.G.; Rose, R.; Mkomwa, S.; Kaumbutho, P.; Sariah, J.; Nazere, R.; Ketsela, G.M.; et al. Re-examining appropriate mechanization in Eastern and Southern Africa: Two-wheel tractors, conservation agriculture, and private sector involvement. Food Secur. 2015, 7, 889–904. [Google Scholar] [CrossRef]
  95. Ramsey, S.; Bergtold, J.; Canales, E.; Williams, J. Effects of farmers’ yield-risk perceptions on conservation practice adoption in Kansas. J. Agric. Resour. Econ. 2019, 44, 380–403. [Google Scholar] [CrossRef]
  96. FIRA. 2013. Available online: https://www.youtube.com/watch?v=0U79-Ztg8Uw (accessed on 10 March 2021).
  97. Byerlee, D.; Depolanco, E.H. Farmers stepwise adoption of technological packages—Evidence from the Mexican Altiplano. Am. J. Agric. Econ. 1986, 68, 519–527. [Google Scholar] [CrossRef]
  98. Zepeda, A.; CIMMYT, El Batán, Mexico. Personal communication, 2021.
  99. Simtowe, F.; Amondo, E.; Marenya, P.; Rahut, D.; Sonder, K.; Erenstein, O. Impacts of drought-tolerant maize varieties on productivity, risk, and resource use: Evidence from Uganda. Land Use Policy 2019, 88, 104091. [Google Scholar] [CrossRef] [PubMed]
  100. Jacobs, F.; Ubels, J.; Woltering, L. The Scaling Scan- A practical tool to determine the strengths and weaknesses of your scaling ambition. PPPlab and CIMMYT, Mexico. 2018. Available online: https://ppplab.org/2018/11/3223/ (accessed on 10 March 2021).
  101. Antle, J.M.; Stoorvogel, J.J.; Valdivia, R.O. New parsimonious simulation methods and tools to assess future food and environmental security of farm populations. Philos. T. Roy. Soc. B 2014, 369, 20120280. [Google Scholar] [CrossRef] [Green Version]
Figure 1. Geographical location of the focus of the research case study: representative farms (T6, red marks) in the State of Guanajuato (green area), central Mexico (gray inset) (Source: adapted from [52]).
Agronomy 11 01214 g001
Figure 2. The Value-Ag framework combines whole-farm profit and risk at the farm level with broader adoption and short-cycle impact of an agricultural innovation to estimate its likely value.
Agronomy 11 01214 g002
Figure 3. IAT-simulated annual farm net profit in the 10-year period of 2011–2020 for the baseline and all innovation scenarios analysed for the representative farm (T6) in southern Guanajuato, with 95% confidence band marking in gray, assuming a t-distribution of scenario estimates per year as a sample of a larger population of observations (df = 9).
Agronomy 11 01214 g003
Figure 4. Risk return profile (scale shown in MXN pa) of the baseline and nine innovation scenarios measured in terms of average net profit and downside risk (CVar0.1) over the 10-year period analysed (2011–2020) for the representative farm (T6) in southern Guanajuato. For illustration purposes, downside risk is represented similarly to net profit (e.g., high values = high profit/risk, low values = low profit/risk).
Agronomy 11 01214 g004
Figure 5. Average risk-neutral profit (gray bars) and associated risk-adjusted profit for the 10 scenarios across four levels of farmer risk aversion (low–yellow bars; moderate–blue bars; high–green bars; and very high–orange-brown bars) for the representative farm (T6) in southern Guanajuato. Scenarios are ranked by risk-neutral profit.
Agronomy 11 01214 g005
Figure 6. Adoption prediction and validation results: (a) Predictions of Peak Adoption and Time to Peak Adoption for all innovation scenarios using Smallholder ADOPT among the representative farms (T6) in southern Guanajuato; (b) Adoption level as a proportion of total surveyed area of rain-fed agriculture (ciclo PV) implementing CA (using criollo maize and improved/hybrid maize) and crop diversification in Guanajuato (Source: [65], in the context of a 30-year adoption process despite no adoption records available until 2012).
Agronomy 11 01214 g006
Table 1. Key model parameters used in the whole-farm simulation for the representative farm (T6) in southern Guanajuato and changes in modelling parameters between the baseline and nine innovation scenarios with various combinations of conservation agriculture (CA), no-tillage (NT), soil cover (SC), crop diversification (CD), new hybrid maize variety (NewVar) and new legume crop (NewLeg) concerning crop rotation, percent incremental yield change over the 10 years, stubble fate (sold or retained, incorporated, ground cover, or livestock feed), seeding (conventional or direct), number of machine passes and machine hire cost, number of herbicide and N-P fertiliser applications, and other changes relative to baseline or CA (for CA+ scenarios).
ScenarioCrop Rotation-Area (ha)Crop Yields t/ha + % Change
over 10 Years
Stubble FateSeeding/PloughingNo. of Machine PassesCost to Hire Machinery
MXN/ha/Year
No. of Herbicide
Applications per Crop
No. of N-P Fertiliser
Applications per Crop
Other Changes Relative to Baseline/CA
BaselineMaize—1.8
Sorghum—1.8
2.68 2.4169% sold
1% incorp.
30% feed
Conv./Yes5400012
CAMaize—1.2
Sorghum—1.2
Beans—1.2
+30% +15% 1.16 +15%30% sold
63% cover
7% feed
Direct/No22400 (+single 4000
on 15 years)
2120% lower N in maize/sorghum
NTMaize—1.8
Sorghum—1.8
0% 0%50% sold
50% incorp.
Direct/No22400 (+single 1000
in year 8)
22
SCMaize—1.8
Sorghum—1.8
+15% +10%50% sold
38% cover
12% feed
Direct/Yes3360012
CDMaize—1.2
Sorghum—1.2
Beans—1.2
+15% +10% 1.1680% sold
10% incorp.
10% feed
Conv./Yes540002120% lower N in maize/sorghum
NT + SCMaize—1.8
Sorghum—1.8
+15% +10%50% sold
50% cover
Direct/No2240022
NT + CDMaize—1.2
Sorghum—1.2
Beans—1.2
+15% +10% +0%80% sold
20% incorp.
Direct/No224002120% lower N in maize/sorghum
SC + CDMaize—1.2
Sorghum—1.2
Beans—1.2
+30% +20%
+15%
50% sold
50% cover
Direct/Yes336002120% lower N in maize/sorghum
CA + NewVarHybrid Maize—1.2
Sorghum—1.2
Beans—1.2
5.67 +30% +15% +15%30% sold
63% cover
7% feed
Direct/No22400 (+single 4000
on 15 years)
214x hybrid seed cost, 20% lower N in sorghum,
CA + NewLegMaize—1.2
Sorghum—1.2
Grass pea—1.2
+30%
+15%
2.03 + 15%
30% sold
63% cover
7% feed
Direct/No22400 (+single 4000
on 15 years)
2
(0 in GP)
1Nov-Apr,
lower HI,
higher seed cost, 20% lower N in maize/sorghum
Table 2. Average economic and risk-neutral results from the IAT simulation and NPV analysis for the baseline and nine innovation scenarios for a representative farm (T6) in southern Guanajuato over the 10-year period analysed (2011–2020).
IndicatorBaselineInnovation Scenario
Average 10-Years Results
(per annum, pa)
CANTSCCDNT + SCNT + CDSC + CDCA + NewVarCA + NewLeg
Maize gross margin (MXN pa)7900499154708174481757444817499117,6884935
Sorghum gross margin (MXN pa)6239372938096404369339743693378437294261
Legume gross margin (MXN pa)012,2500012,067012,06712,25012,25023,294
Horticulture gross margin (MXN pa)12,16312,16312,16312,16312,16312,16312,16312,16312,16312,163
Cattle gross margin (MXN pa)30,43829,78236,86129,40536,48436,32136,68836,68829,07026,696
Average male liveweight (kg pa)269265272271275270270270278267
Calves born (no. pa)2.32.42.42.32.32.42.42.42.32.2
Purchased fodder (MXN pa)38,48033,25229,56438,12345,94326,41026,48626,48635,04633,388
Hired labour
(MXN pa)
4488487548753861487548754875487555024875
Overhead costs (MXN pa)10,00084008400960010,00084008400960084008400
Average farm net profit (MXN pa)377316,38915,4644563840718,51829,66728,91525,95324,685
SD of net profit13,058942210,30811,988945310,87611,80511,88812,3655192
CV of net profit3.460.540.662.111.080.590.370.380.480.21
Prob. of break-even p(π ≥ 0) (%)61%96%94%64%84%95%99%99%100%100%
Downside risk (CVaR10) (MXN)−19,144−15−3298−12,995−11,134−159910,505963725,95324,685
NPV of annual net profit (MXN)32,278137,493128,10636,98667,175154,905248,715242,297215,606208,726
Net value of innovation (MXN) 105,21695,828470934,897122,627216,438210,019183,329176,448
Publisher’s Note: MDPI stays neutral with regard to jurisdictional claims in published maps and institutional affiliations.

