Article

A Tree-Ring-Based Assessment of Pinus armandii Adaptability to Climate Using Two Statistical Methods in Mt. Yao, Central China during 1961–2016

1
College of Geography and Environmental Science, Henan University, Kaifeng 475004, China
2
National Demonstration Center for Environmental and Planning, Henan University, Kaifeng 475004, China
3
Henan Key Laboratory of Earth System Observation and Modeling, Henan University, Kaifeng 475004, China
4
Department of Geography, University of Hong Kong, Hong Kong, China
*
Author to whom correspondence should be addressed.
Forests 2021, 12(6), 780; https://doi.org/10.3390/f12060780
Submission received: 27 April 2021 / Revised: 6 June 2021 / Accepted: 10 June 2021 / Published: 13 June 2021

Abstract

:
Assessing the characteristics and limiting factors of tree growth is of practical significance for environmental studies and climatic reconstruction, especially in climate transition zones. In this study, four sites of Pinus armandii Franeh are investigated to understand regional climate-tree growth response in Mt. Yao, central China. Based on the high similarity of four residual chronologies and high correlations between chronologies and climatic factors, we analyzed the correlations of regional residual chronology with monthly climatic factors and the self-calibrating Palmer Drought Severity Index (scPDSI) from 1961–2016. The results indicate that the hydrothermal combination of prior August and current May and the scPDSI in May are main limiting factors of regional tree growth in Mt. Yao. The results of stepwise regression models also show that temperature and scPDSI in May are the main limiting factors of tree growth, but the limiting effect of scPDSI is more than temperature in this month. Through the analysis of the number of tree growth years corresponding to high temperature and high scPDSI, it was further confirmed that scPDSI in May is the main limiting factor on the growth of P. armandii in Mt. Yao. However, the influence of scPDSI in May has weakened, while temperature in May has increasingly significant influence on tree growth. The above findings will help improve our understanding of forest dynamics in central China under global climate change.

1. Introduction

Tree-rings have become one of the most important means for studying global climate change, with their precise dating, high (annual or season) resolution, extensive spatial availability, and high sensitivity to hydroclimate at many locations [1,2]. Tree growth is mainly affected by climate, physiological traits of tree species, and ecological micro-environment, such as slope and altitude [1,3,4,5,6,7]. Therefore, a reliable climate reconstruction based on tree-rings should be built on a clear understanding of tree growth under different environmental conditions, and can only be achieved by incorporating the samples with coherent growth patterns.
Tree-ring studies in China have witnessed a rapid development in recent decades, but mostly concentrate in arid and semi-arid regions [8,9,10,11,12,13,14,15] and on the Tibetan Plateau [16,17,18,19,20,21,22]. More studies are emerging in central and eastern China in recent years [23,24,25,26,27,28,29,30,31,32].
To better understand climate change and help tree-ring-based climate reconstructions in central and eastern China, the relationship between climate and tree growth in high mountains needs to be assessed. This is because the plains are heavily affected by human activities and the forests are mostly preserved in high mountains, where temperatures increase more than the surrounding lowlands experience them [33]. The rapid temperature increase has imposed a critical impact on the tree growth and dynamics of high-elevation forests [17,34,35]. In general, tree radial growth at high altitude is mostly temperature-limited in the mountain environments [7,36,37,38], whereby it may respond in different ways or to a different extent at different altitudes [39,40]. Besides that, different ecological factors such as slope orientation will also make a difference [41].
Here, we report a case study in Mt.Yao of the eastern Funiu Mountains, Henan Province. The study area is located in the transition zone of subtropical-warm temperature in central eastern China, with abundant forest resources (mainly Pinus tabulaeformis Carr and Pinus armandii Franeh in the high mountains). Thus far, there are only a few dendroecological studies in Baotianman National Nature Reserve [42,43], and a few climate reconstructions by using tree-ring isotope and ring-width or early wood width index of P. tabulaeformis, respectively [30,44,45,46,47].
This paper aims to study the regional climate-growth response of P. armandii at different mountain eco-environments in the climatic transition zones of central China. Specifically, we will assess whether there is altitude or slope orientation-related growth response, and the adaptability of this species to mountain environments, and the main limiting factors on the growth of P. armandii in this area for the sake of forest regeneration and management.

2. Materials and Methods
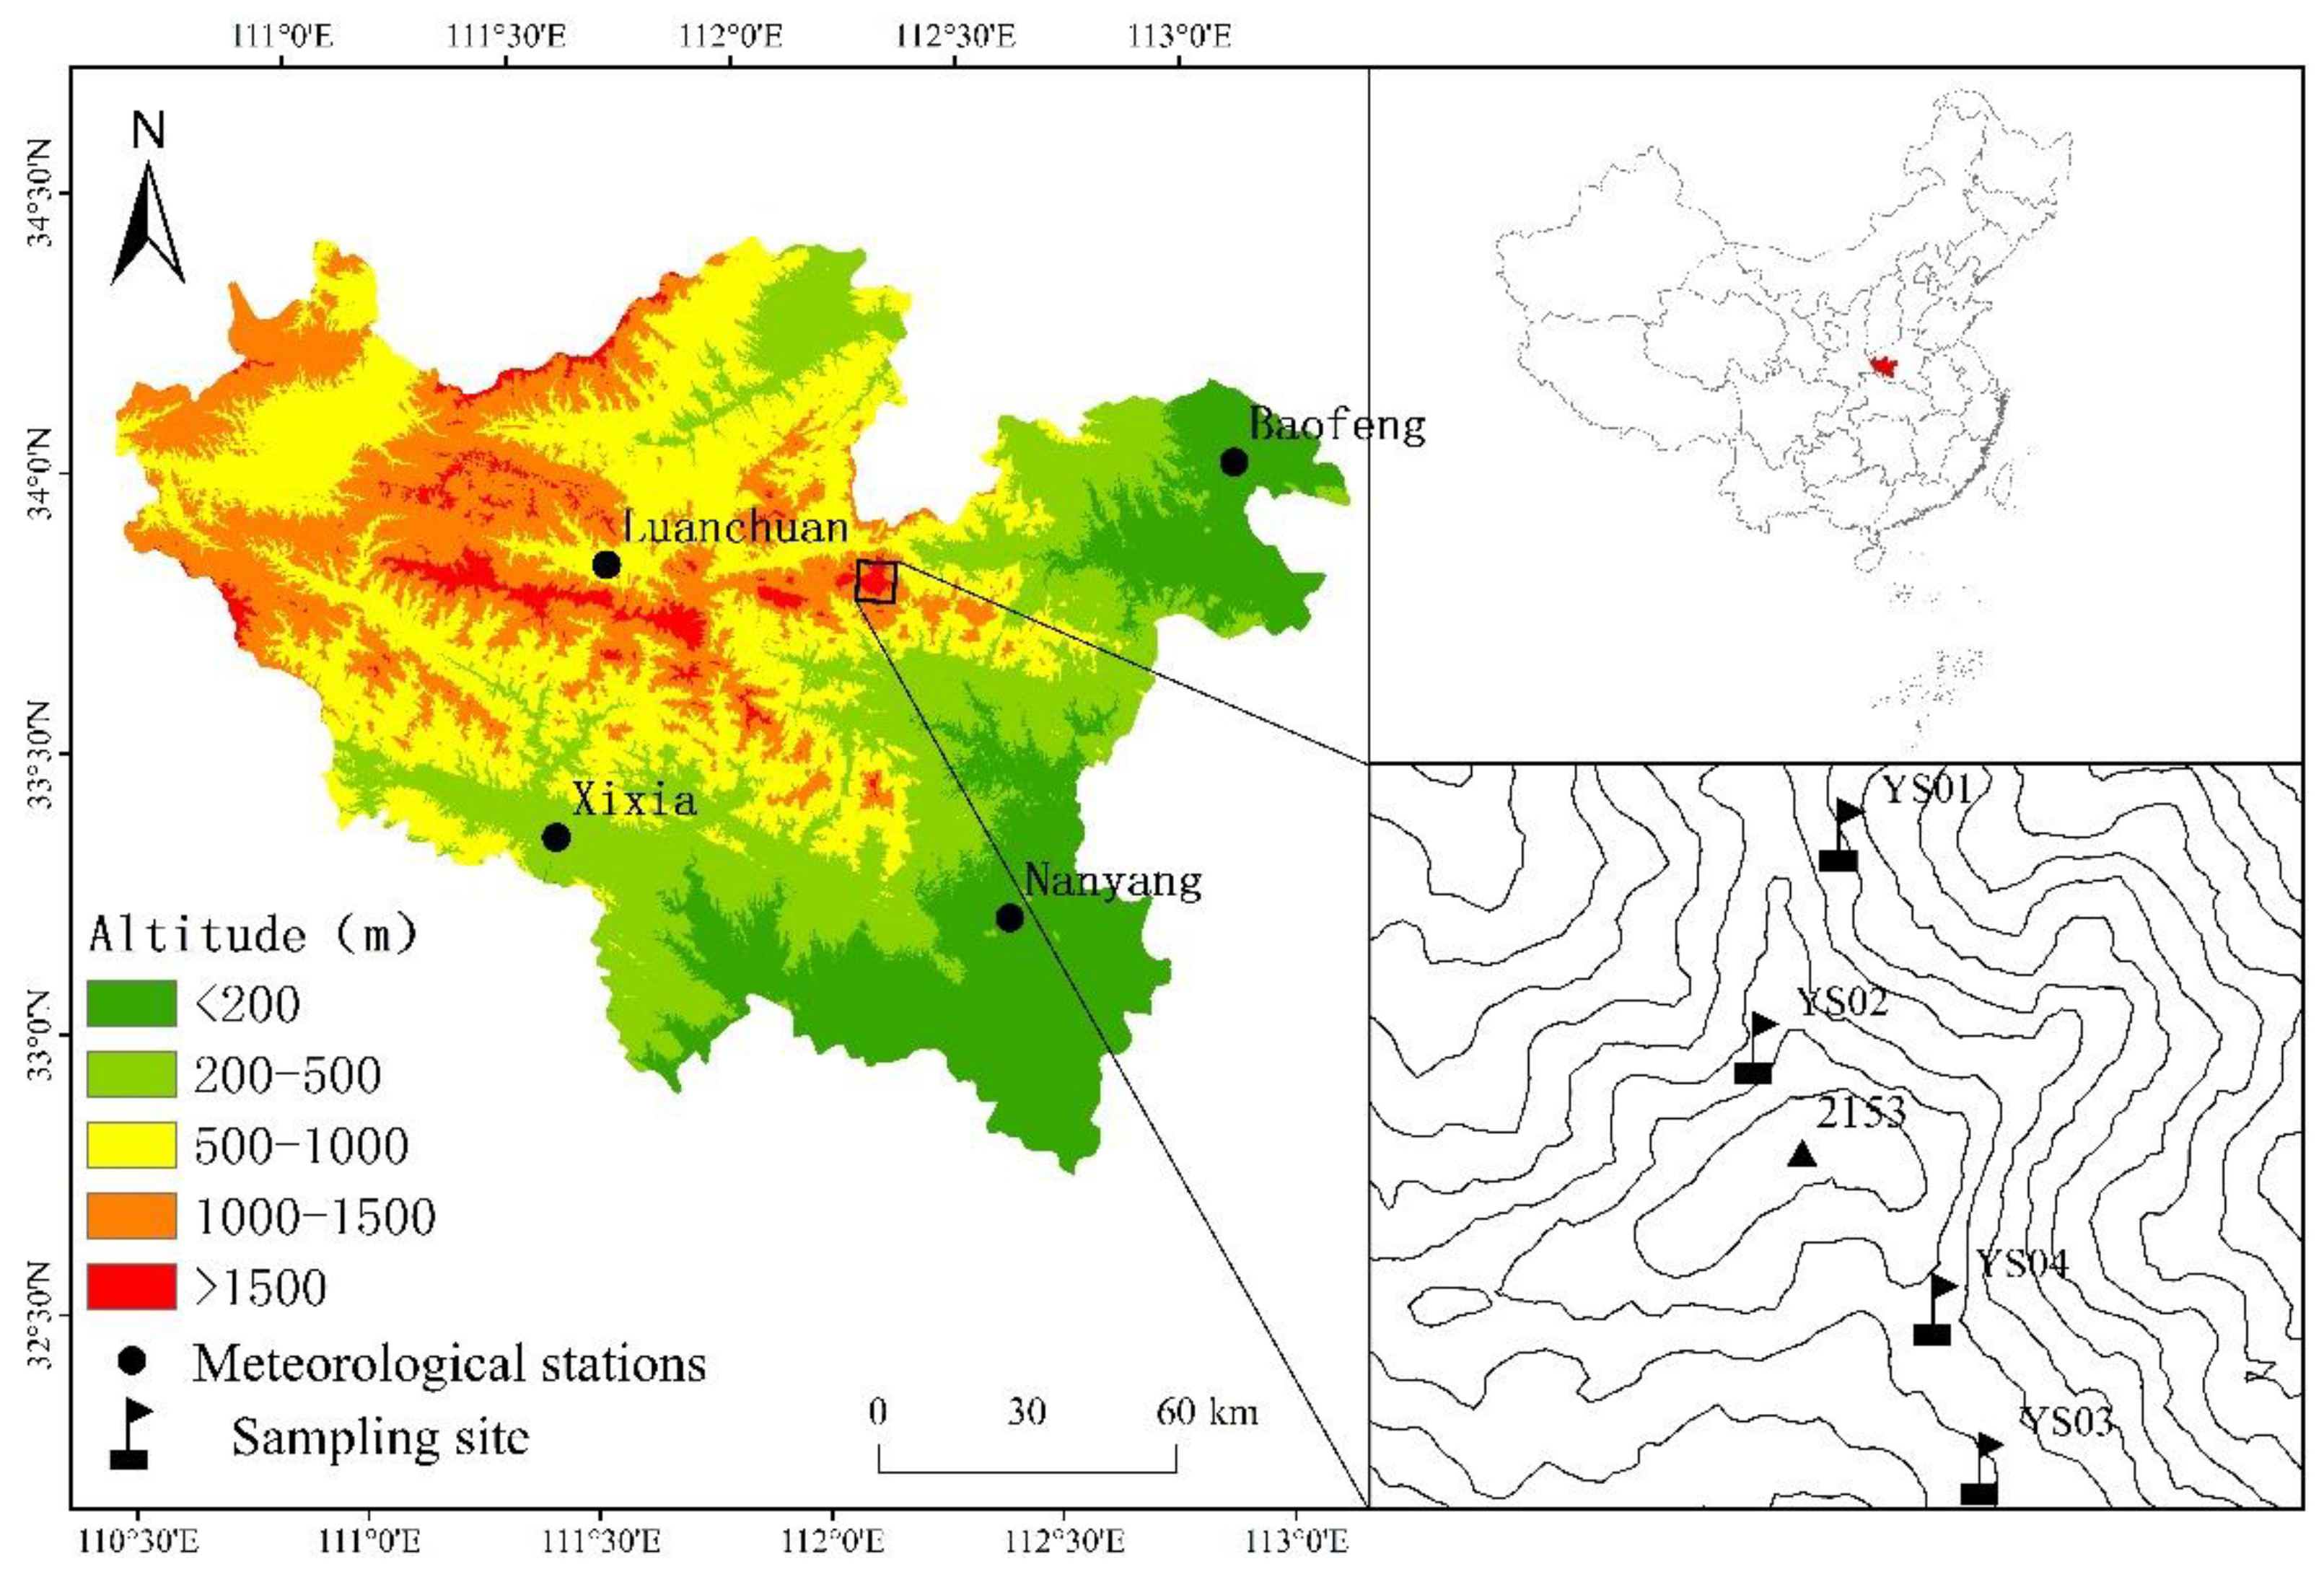
2.1. Study Region

Mt. Yao (112°13′55″–112°42′31″ E, 33°47′01″–33°38′18″ N; 1300 to 2153 m above sea level (a.s.l.)) is located in the eastern Funiu Mountain, Henan Province (Figure 1). The Funiu Mountain is an important geographical boundary of warm temperate and northern subtropical zone in the eastern China. Mt. Yao is the source region of the Sha River (a tributary of the Huai River), and it features a continental monsoon climate, with lower temperatures but higher precipitation than the surrounding plains, due to the high altitude of the mountains. Based on observations from a meteorological station near Mt. Yao, the annual mean temperature is 14.8 °C. The monthly mean maximum temperature is 25.3 °C in July, and the monthly mean minimum temperature is −1.9 °C in January. The annual total precipitation is 820–860 mm, which is largely concentrated in summer (mainly in late July and early August) and accounts for 70%~80% of the annual precipitation. Annual mean relative humidity reached 64%–74%. The soil is typically brown mountain soil in study area.
The average canopy coverage rate of the forests is 95%, with major tree species, including P. armandii, P. tabulaeformis, Quercus var. acutesserrata, Toxicodendron vernicifluum, and Carpinus turczaninowii Hance. Forest type and structure in Mt. Yao are complex, rich and diversified, making it a relatively rare region with distinct vertical forest distribution zones in central China. P. armandii, endemic to China, and it is one of the main afforestation conifer species in the high mountain areas of the Funiu Mountains, mainly distributed within an elevation of 1400–1900 m a.s.l.

2.2. Chronology Development

In July 2017, we collected tree-ring samples of P. armandii from 4 sampling sites in Mt. Yao. In general, 1 or 2 cores were taken at breast height from each tree using 5.15 mm increment borers. In total, 165 cores from 101 trees were retrieved from 4 sampling sites and were marked as YS01, YS02, YS03 and YS04, respectively (Figure 1 and Table 1).
Following standard methods of dendrochronology [48], all the samples were brought back to the lab, mounted, air-dried and sanded until the annual rings could be distinguished. After that, the samples were cross-dated and measured using a Velmex measuring system (0.001 mm precision). The quality of visual cross-dating was checked with COFECHA [49] program to ensure exact dating for each annual ring.
To study the climate-growth response, biological growth trend in tree-rings needs to be removed to preserve the ring-width variability caused by climate factors alone. The ARSTAN program [50] was used to detrend raw ring-width measurements conservatively by fitting negative exponential curves or linear regression curves of any slope, and to produce three types of chronologies (standard, residual and autoregressive) by calculating the biweight robust means that can decrease the effect of outliers [51]. We developed ring-width residual chronology for each group of samples, and the common period of the three chronologies was set to 1980–2015 (Figure 2). Statistical values of the four chronologies are shown in Table 1.
There are higher correlations among the four residual chronologies from 1961–2016 (Table 2), which are all significant at 0.01 levels, except for that between YS01 and YS03. We extracted the first principal component (PC1, 58.7% variance) of the four residual chronologies as the regional residual chronology in order to analyze the relationship between regional tree growth and climatic factors.

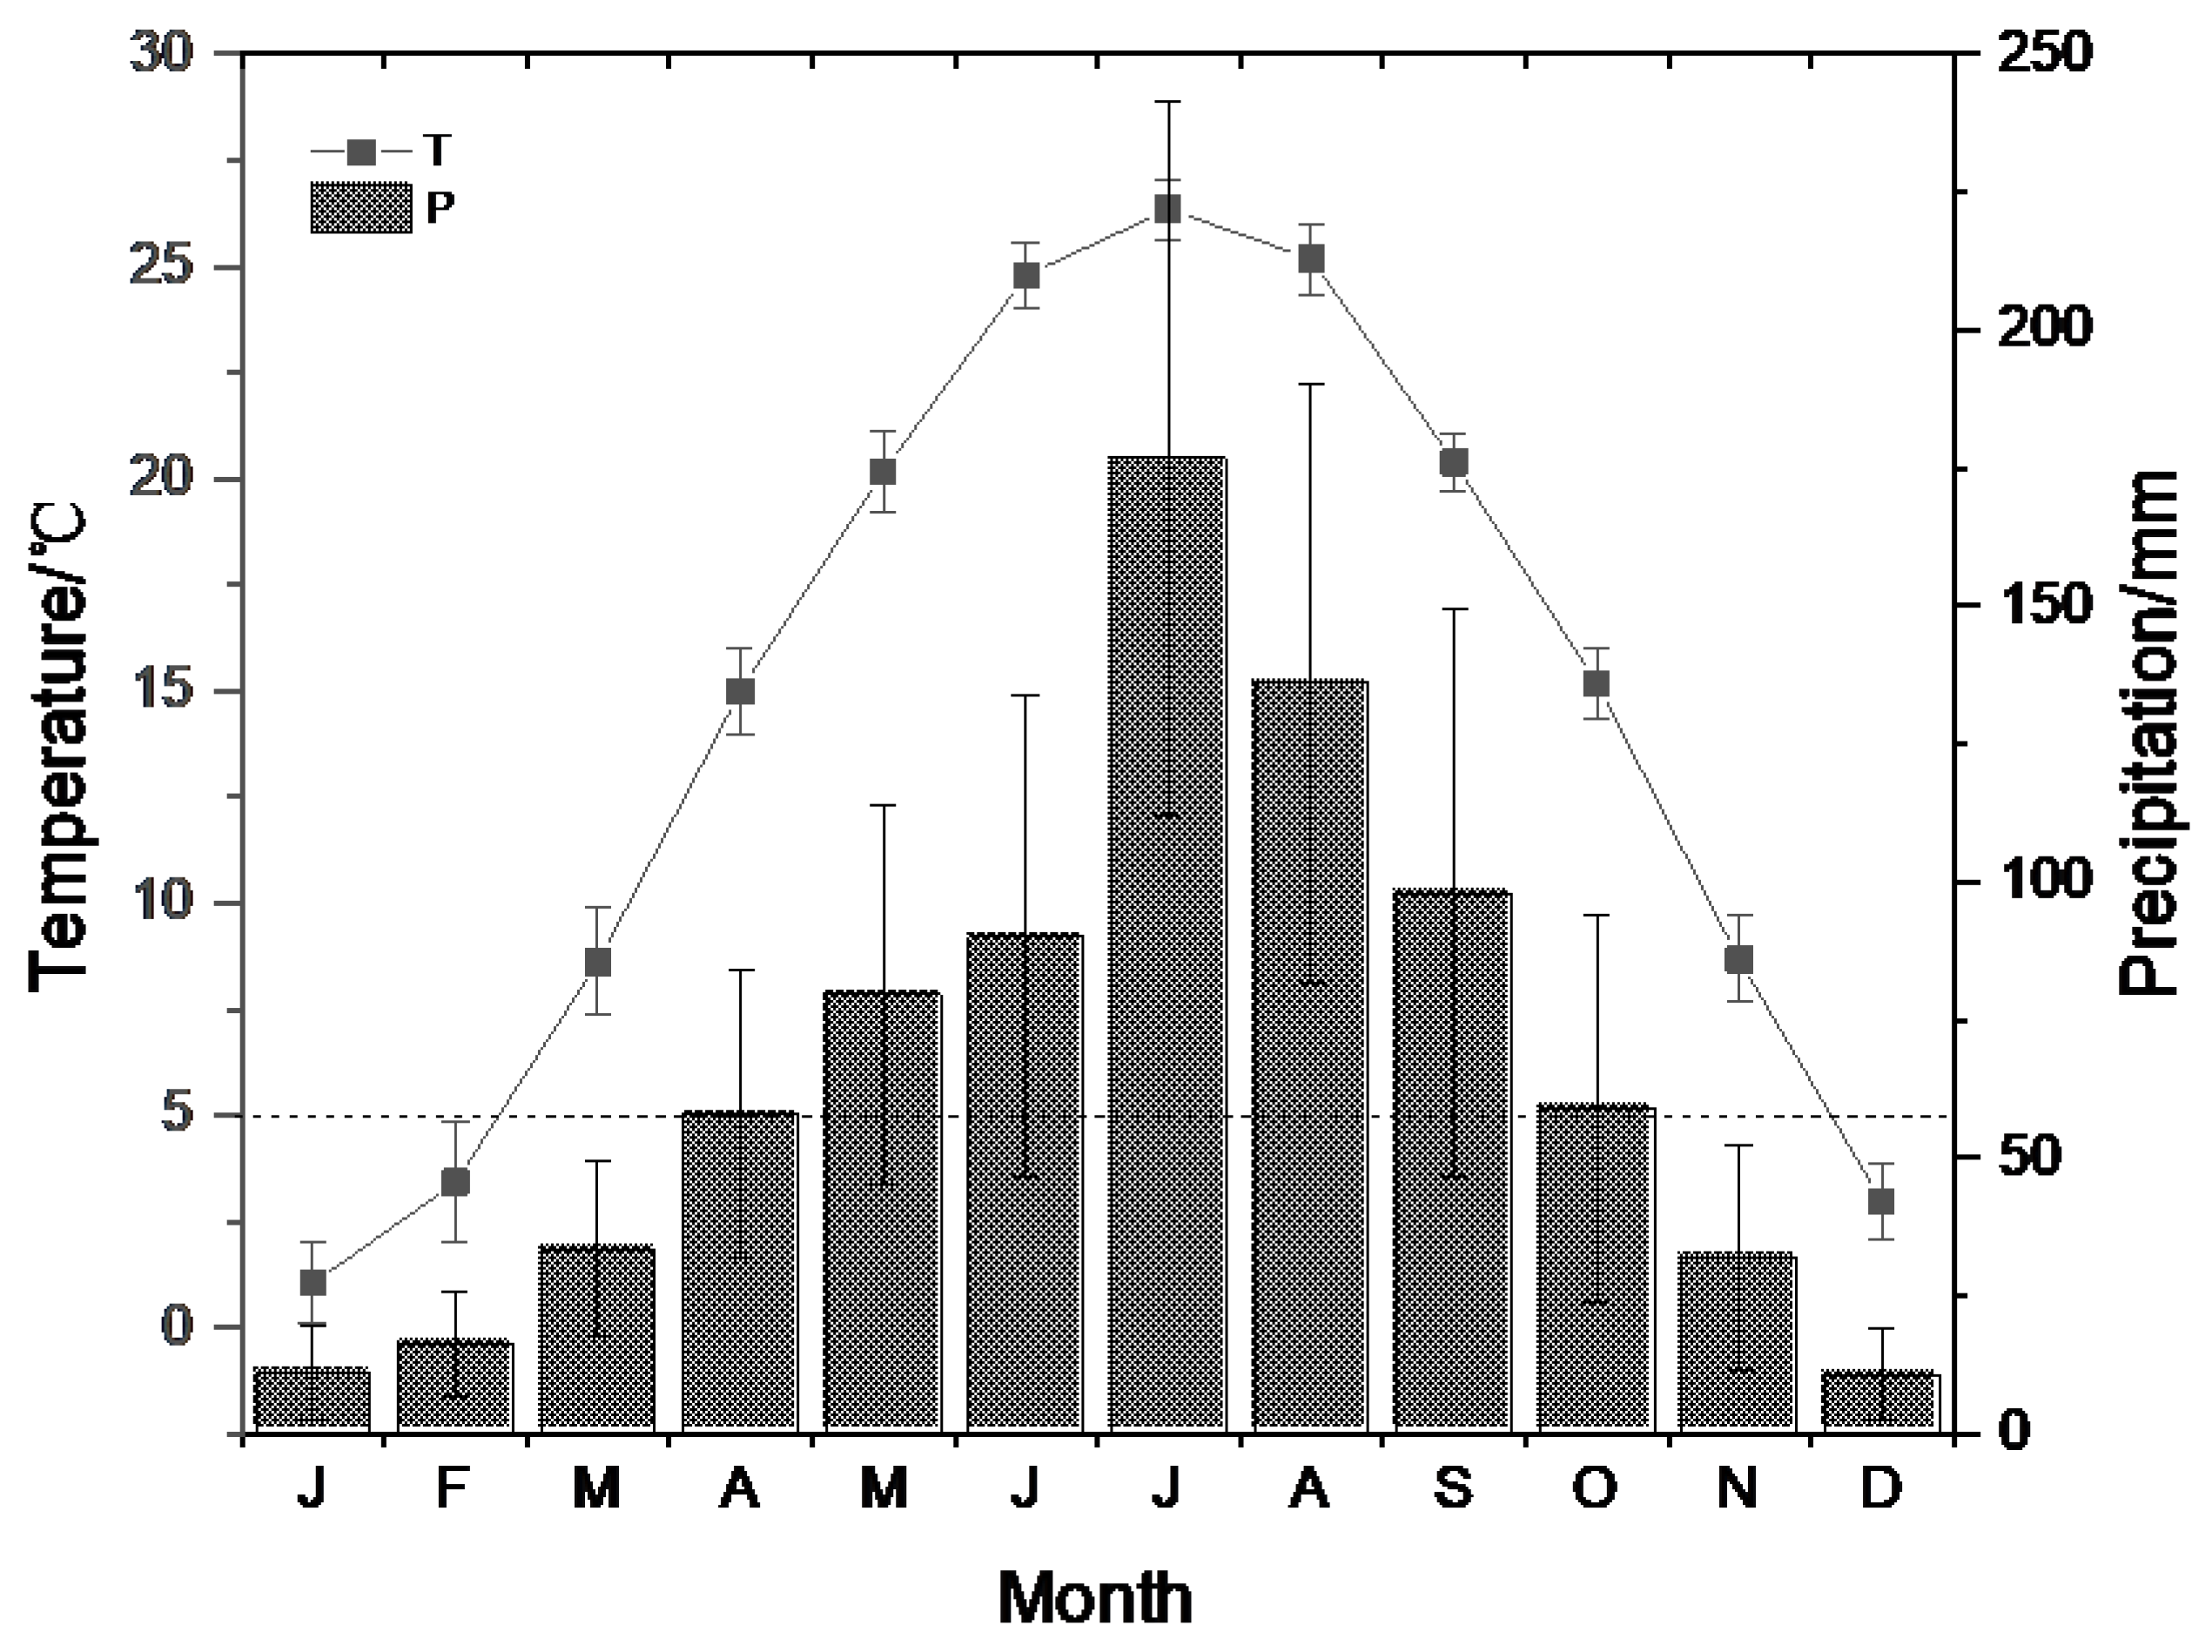
2.3. Meteorological Data

Monthly climate data from 1961–2016 were calculated from the average of four meteorological stations (Figure 1 and Figure 3), including Luanchuan (33°47′ N, 111°36′ E, 750 m a.s.l.), Xixia (33°18′ N, 111°30′ E, 250 m a.s.l.), Nanyang (33°2′ N, 112°35′ E, 129 m a.s.l.) and Baofeng (33°53′N, 113°3′E, 136 m a.s.l.). In addition, we obtained the self-calibrating Palmer Drought Severity Index [52] data from 1961–2016 (http://climexp.knmi.nl, 1 December 2020), which were averaged within 33–34° N and 111–112° E around the sampling sites. The scPDSI was calculated from temperature and precipitation data sets, together with fixed parameters related to soil/surface characteristics at each location [52]. Climate variables used for correlation analyses include monthly mean temperature (T), monthly total precipitation (P) and the scPDSI.

2.4. Methods

Based on tree growth consistency in Table 1, we extracted the PC1 of the four residual chronologies by SPSS software [53]. DendroClim2002 program [54] was used to perform Pearson’s correlation analysis of chronologies (including four site chronologies and PC1 chronology) with climate factors and scPDSI from March 1961–November 2016. Regression model was also established based on the relationship between regional chronology and climate factors. Finally, the stepwise regression models between tree growth and climate factors and the significant limiting factor were established by using the SPSS software [53].

3. Results

3.1. Growth Features of P. Armandii in Different Environments

As shown in Table 1, mean sensitivities (M.S.) of all residual chronologies are over 0.2 and standard deviations (S.D.) of all chronologies are lower than 0.25. These indicated that tree growth is in good consistency among the four sampling sites of different environments in this study area. High correlations for all-cores, within-tree and between-trees (r1, r2 and r3) of all chronologies showed that all trees had good growth consistency. High signal-to-noise ratio (SNR; 11.699~25.297) and expressed population signal (EPS; 0.921~0.962) demonstrate a high level of accuracy for these chronologies [55] and more climatic information is possibly retained in these chronologies, especially YS03 on the south slope (SNR, 25.297; EPS, 0.962).

3.2. Regional Climate-Growth Response

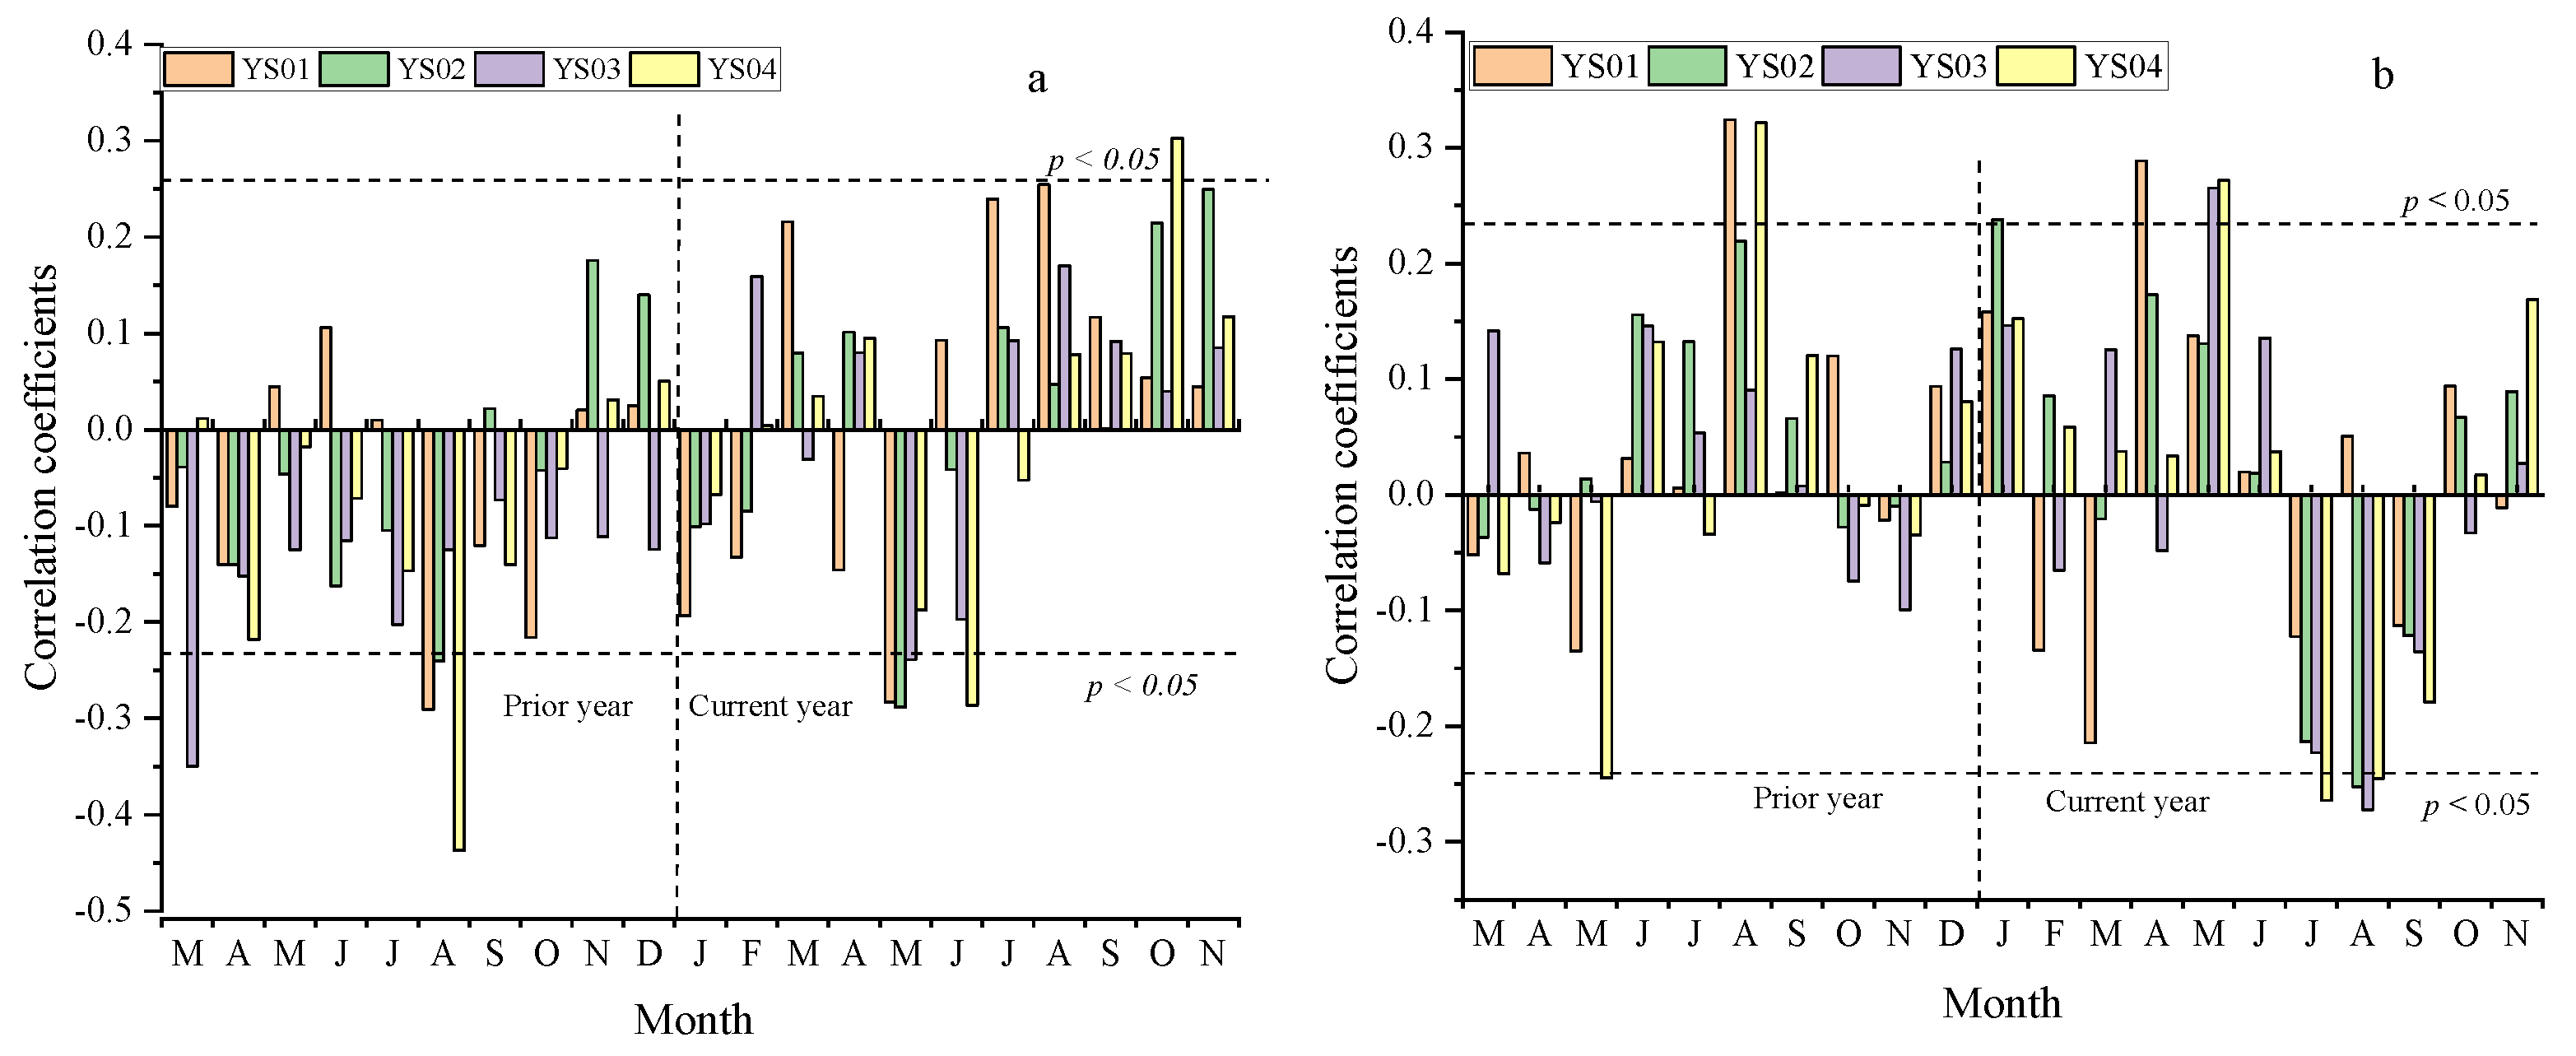
3.2.1. Correlation between Chronologies and Regional Climate Factors

Correlation results with regional T indicate that the majority of trees show negative correlations with T from the prior March to current June, and positive correlations are concentrated in July to November, except for YS04 chronology that showed significant positive correlation with T in current October (Figure 4a). Significant negative correlations with T are found in current May at YS01, YS02 and YS03 sites, in prior August at YS01 and YS04 sites, in prior March at YS03, and in current June at YS04 site, respectively.
Correlation results with regional P indicate different significant correlations with four residual chronologies (Figure 4b). Significant negative correlations with P are found in prior May and current July at YS04 site and in current August at YS02, YS03 and YS04 sites. Significant positive correlations are found in prior August at YS01 and YS04 sites, current May at YS03 and YS04 sites, current April at YS01 site, and current January at YS02 site, respectively.

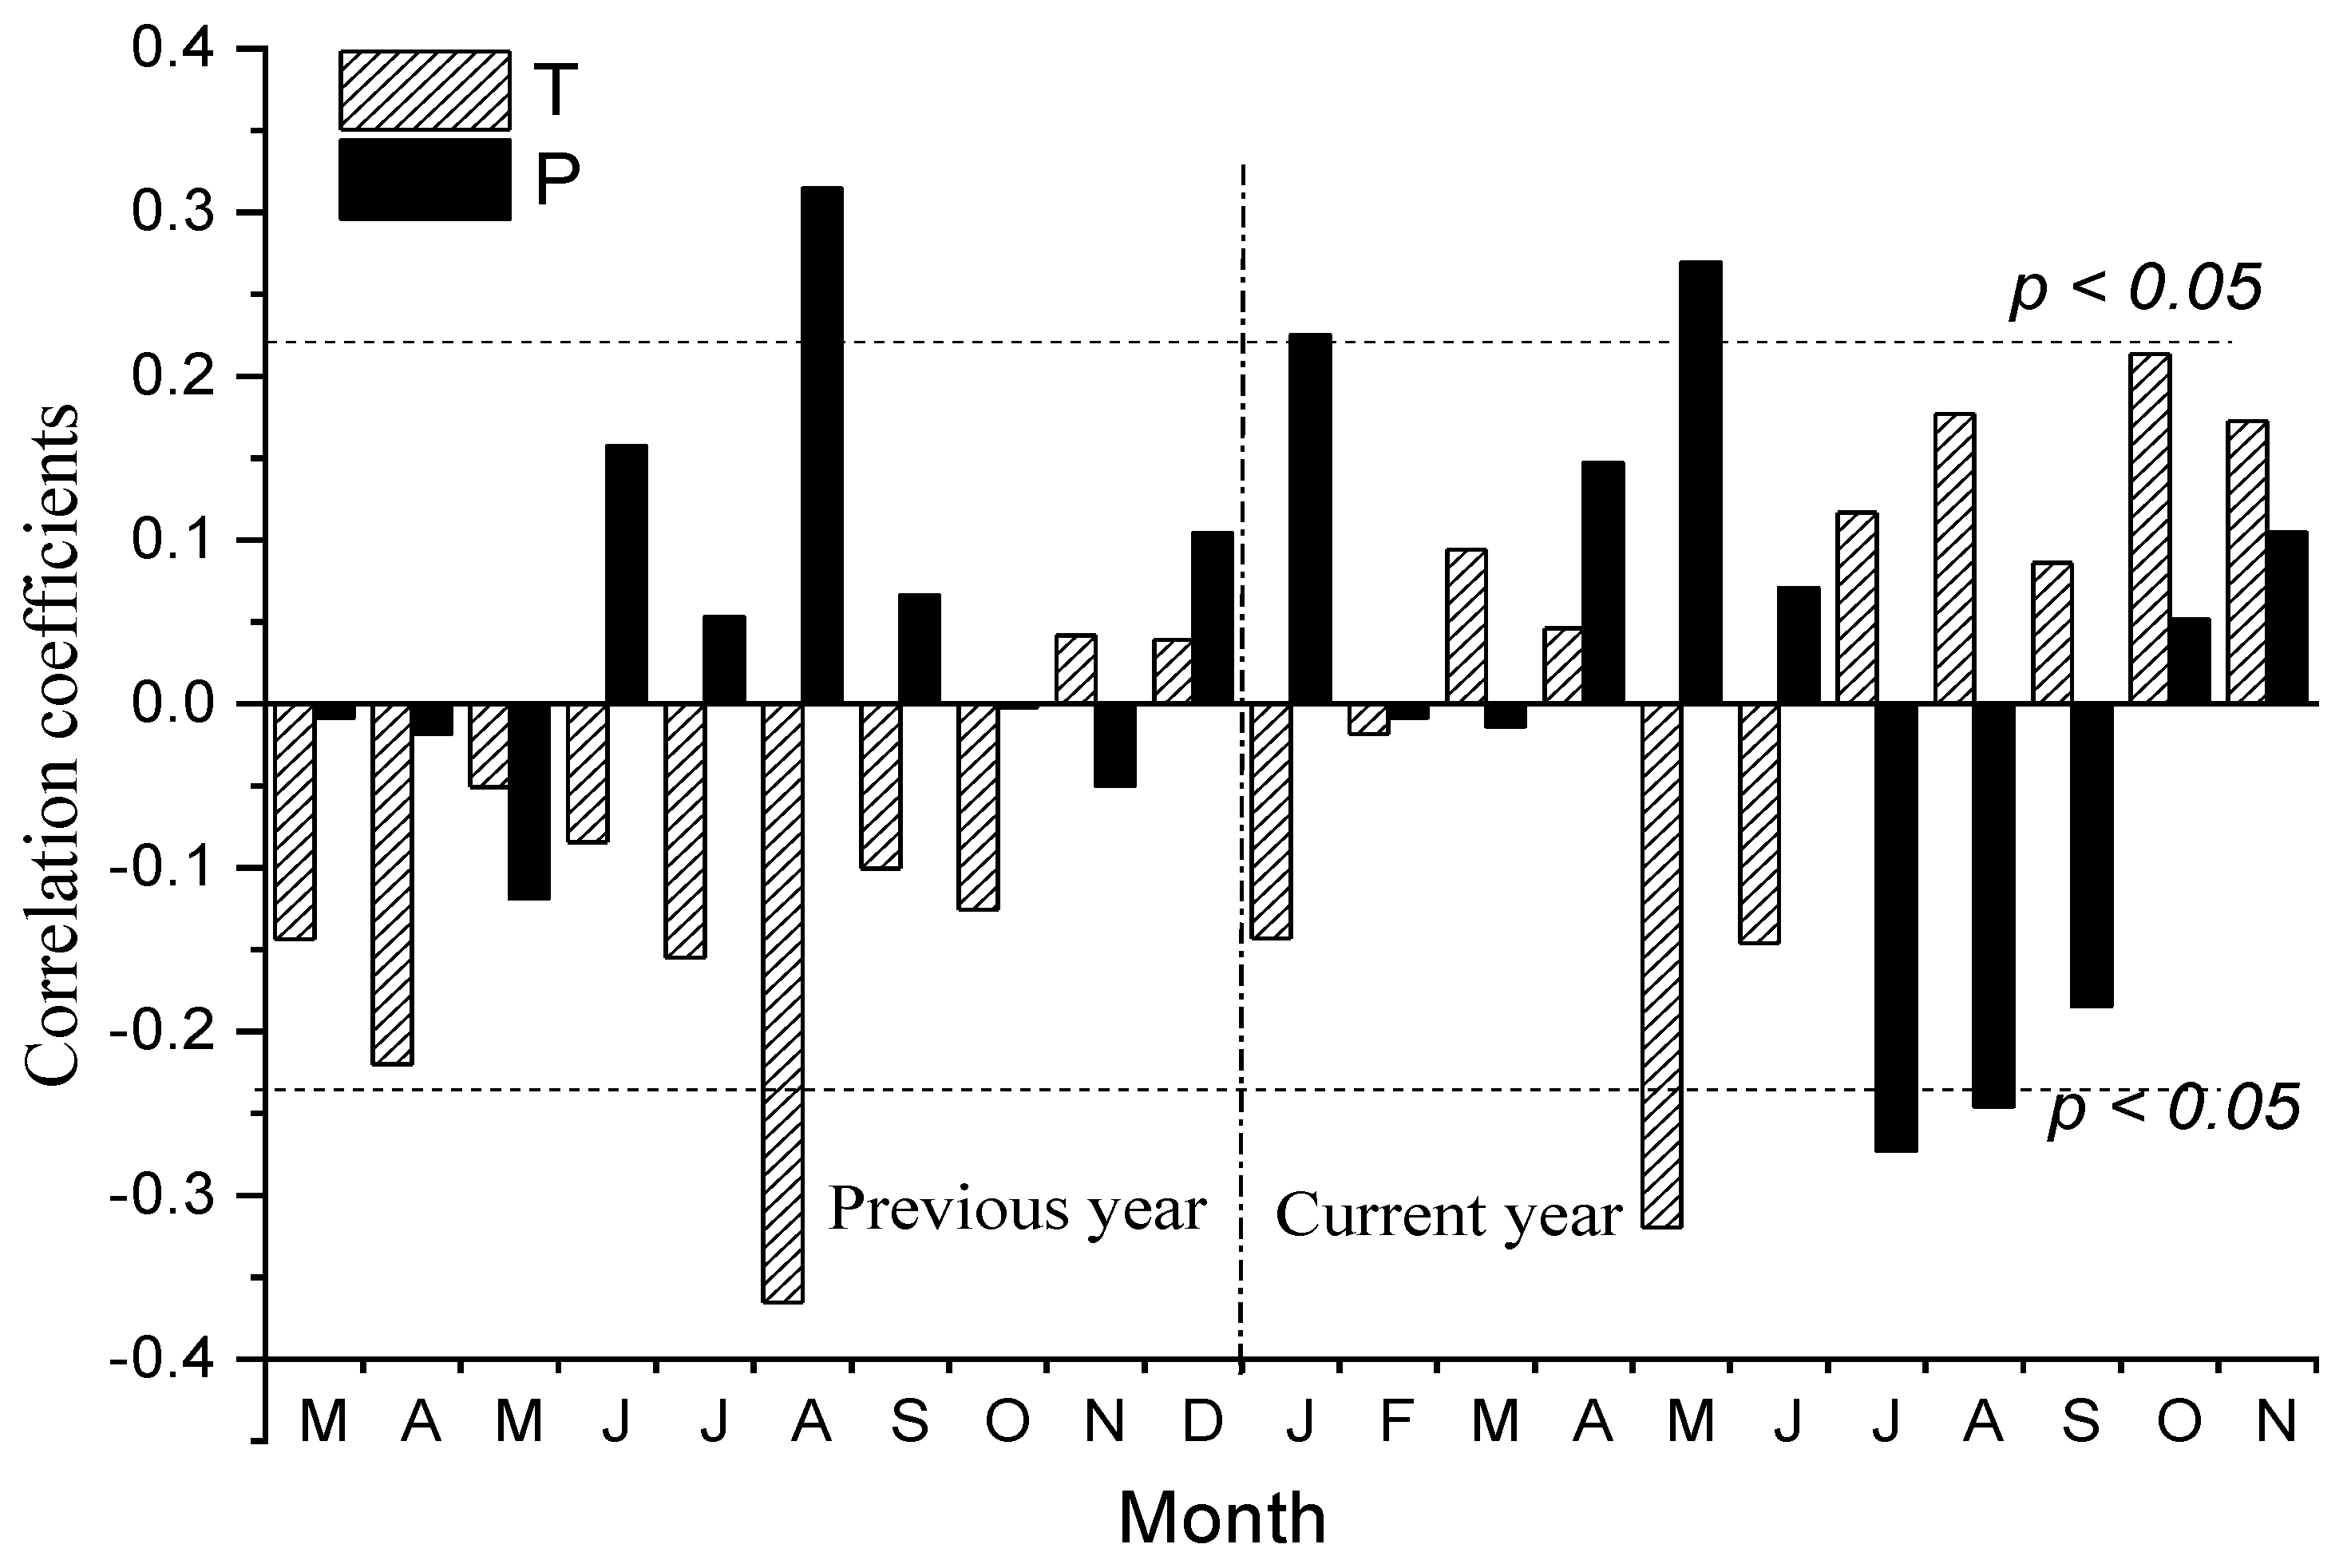
3.2.2. Correlation between PC1 and Regional Climate Factors

Correlation results indicate that regional tree growth shows significant negative correlations with T in prior August and current May, and significant positive correlations with P in prior August and current May (Figure 5). Obviously, the hydrothermal combination of prior August and current May are the main limiting factors on tree growth in Mt. Yao.

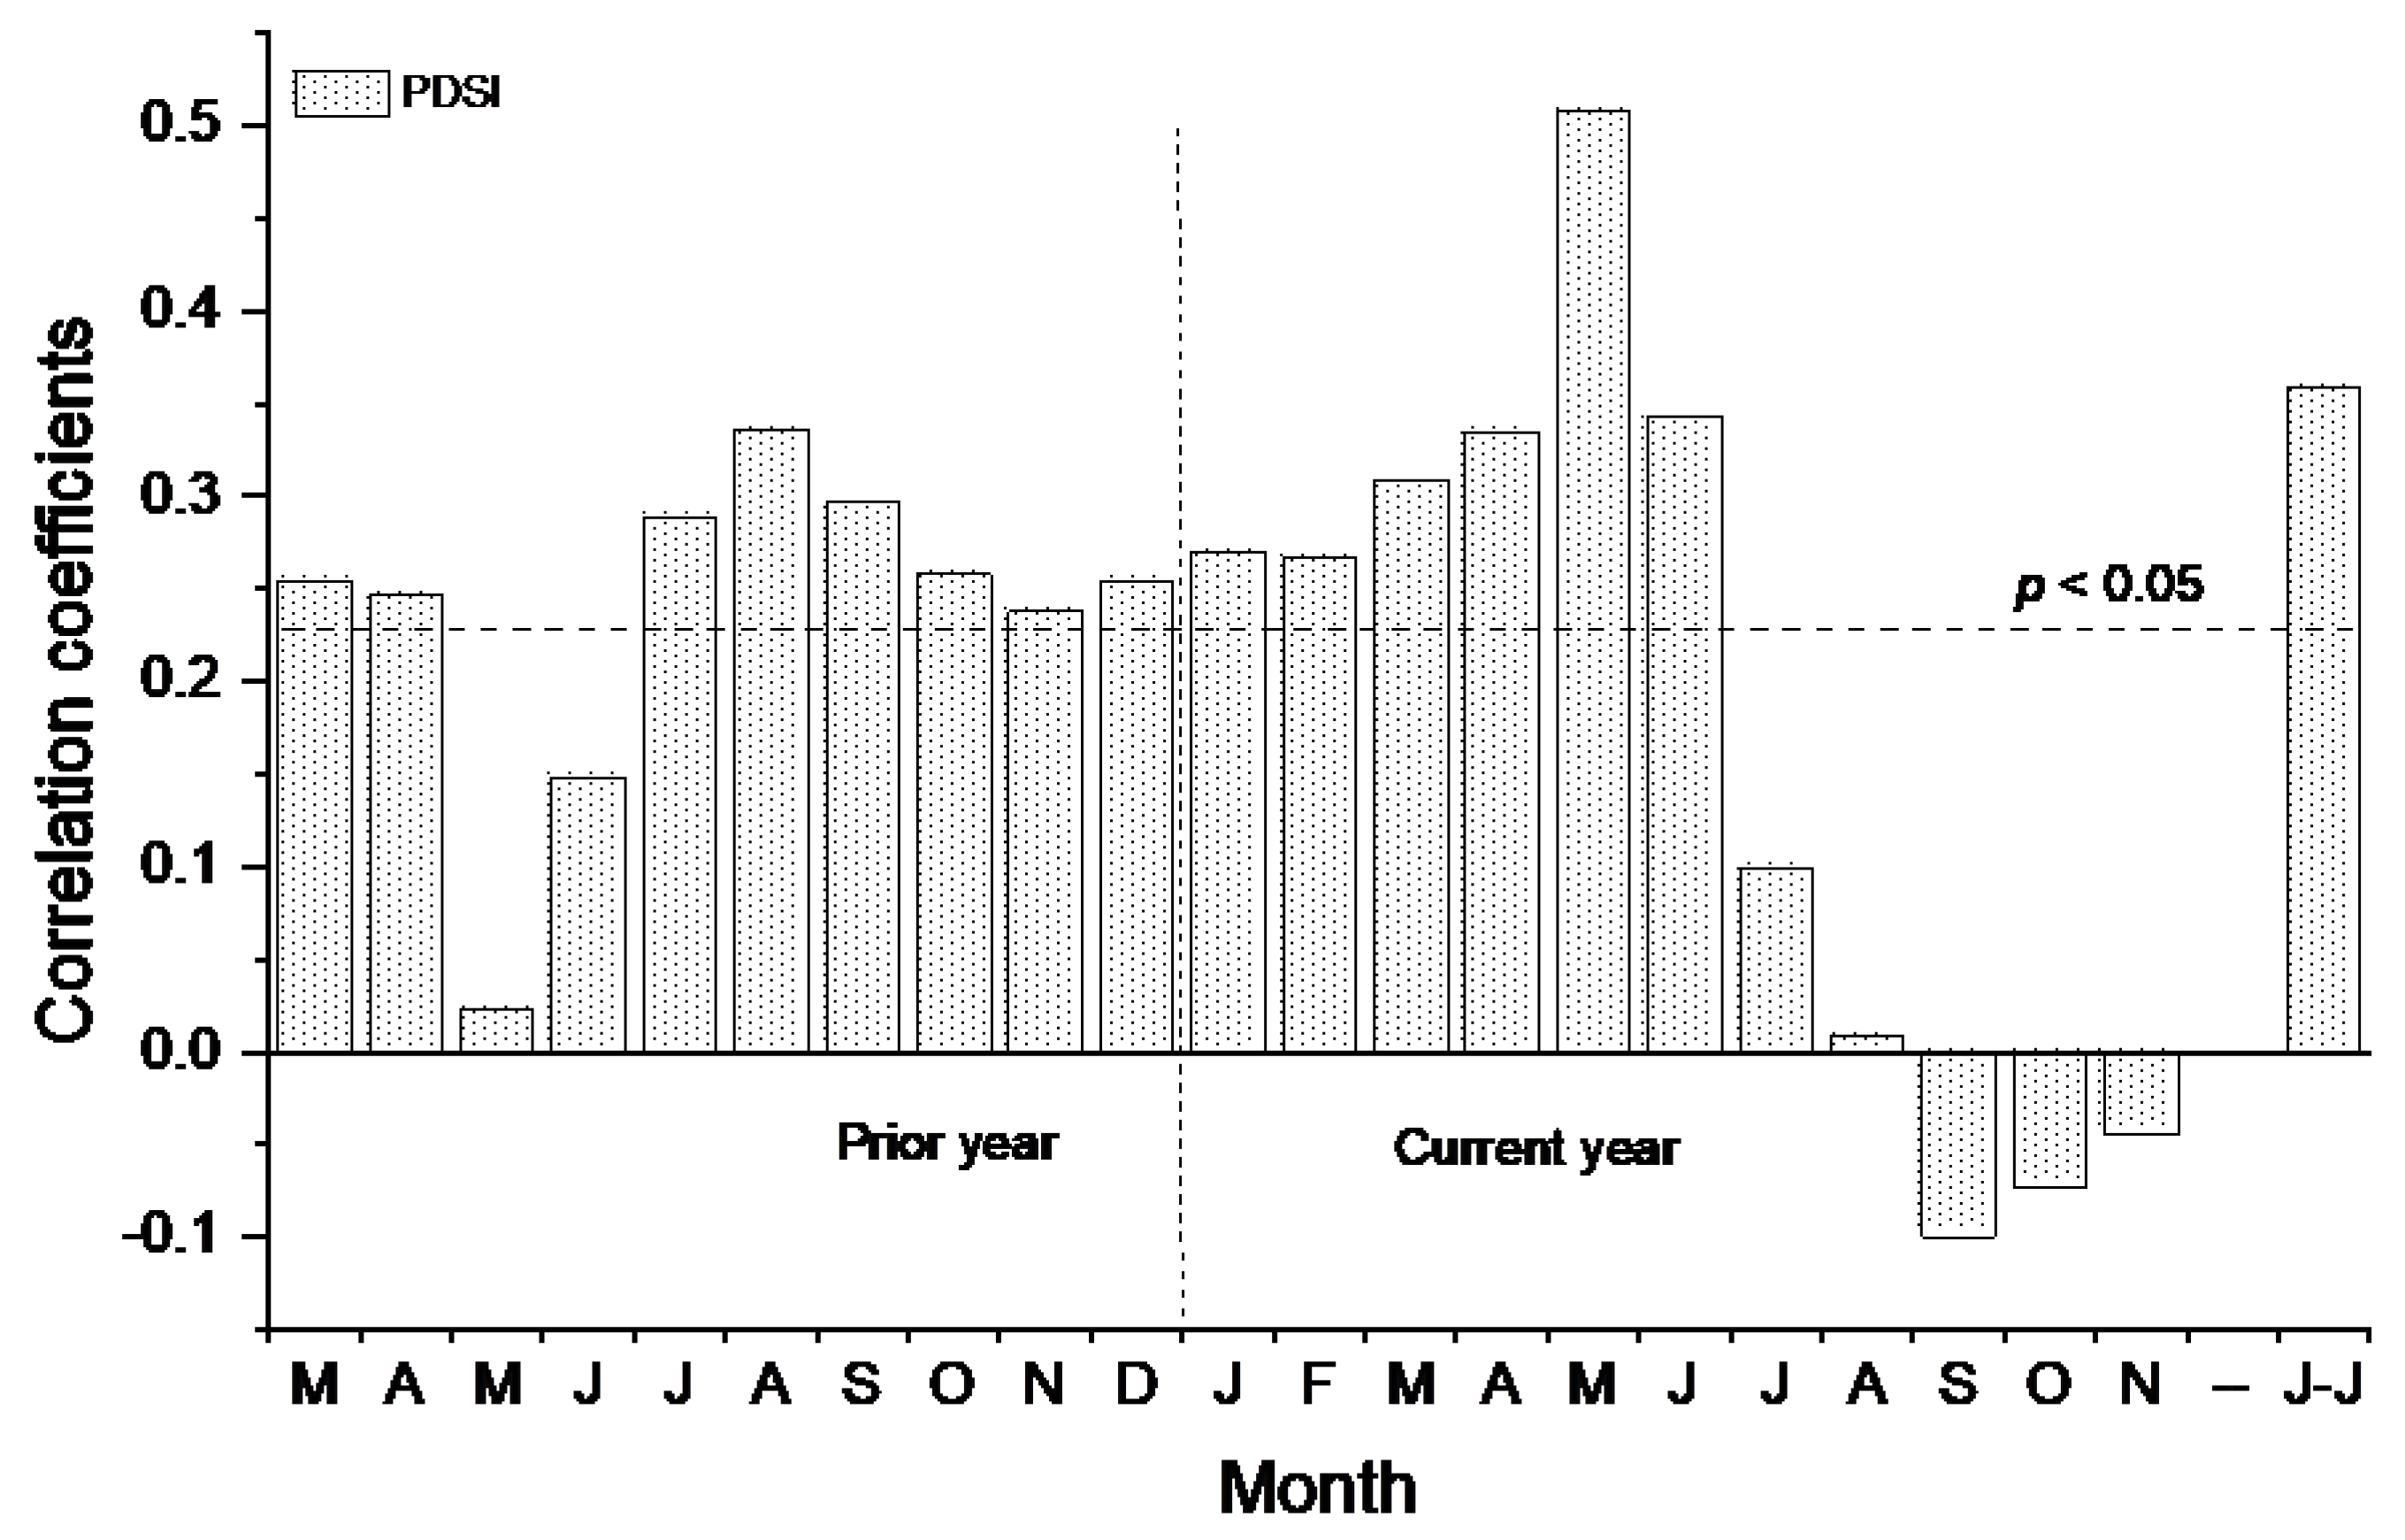
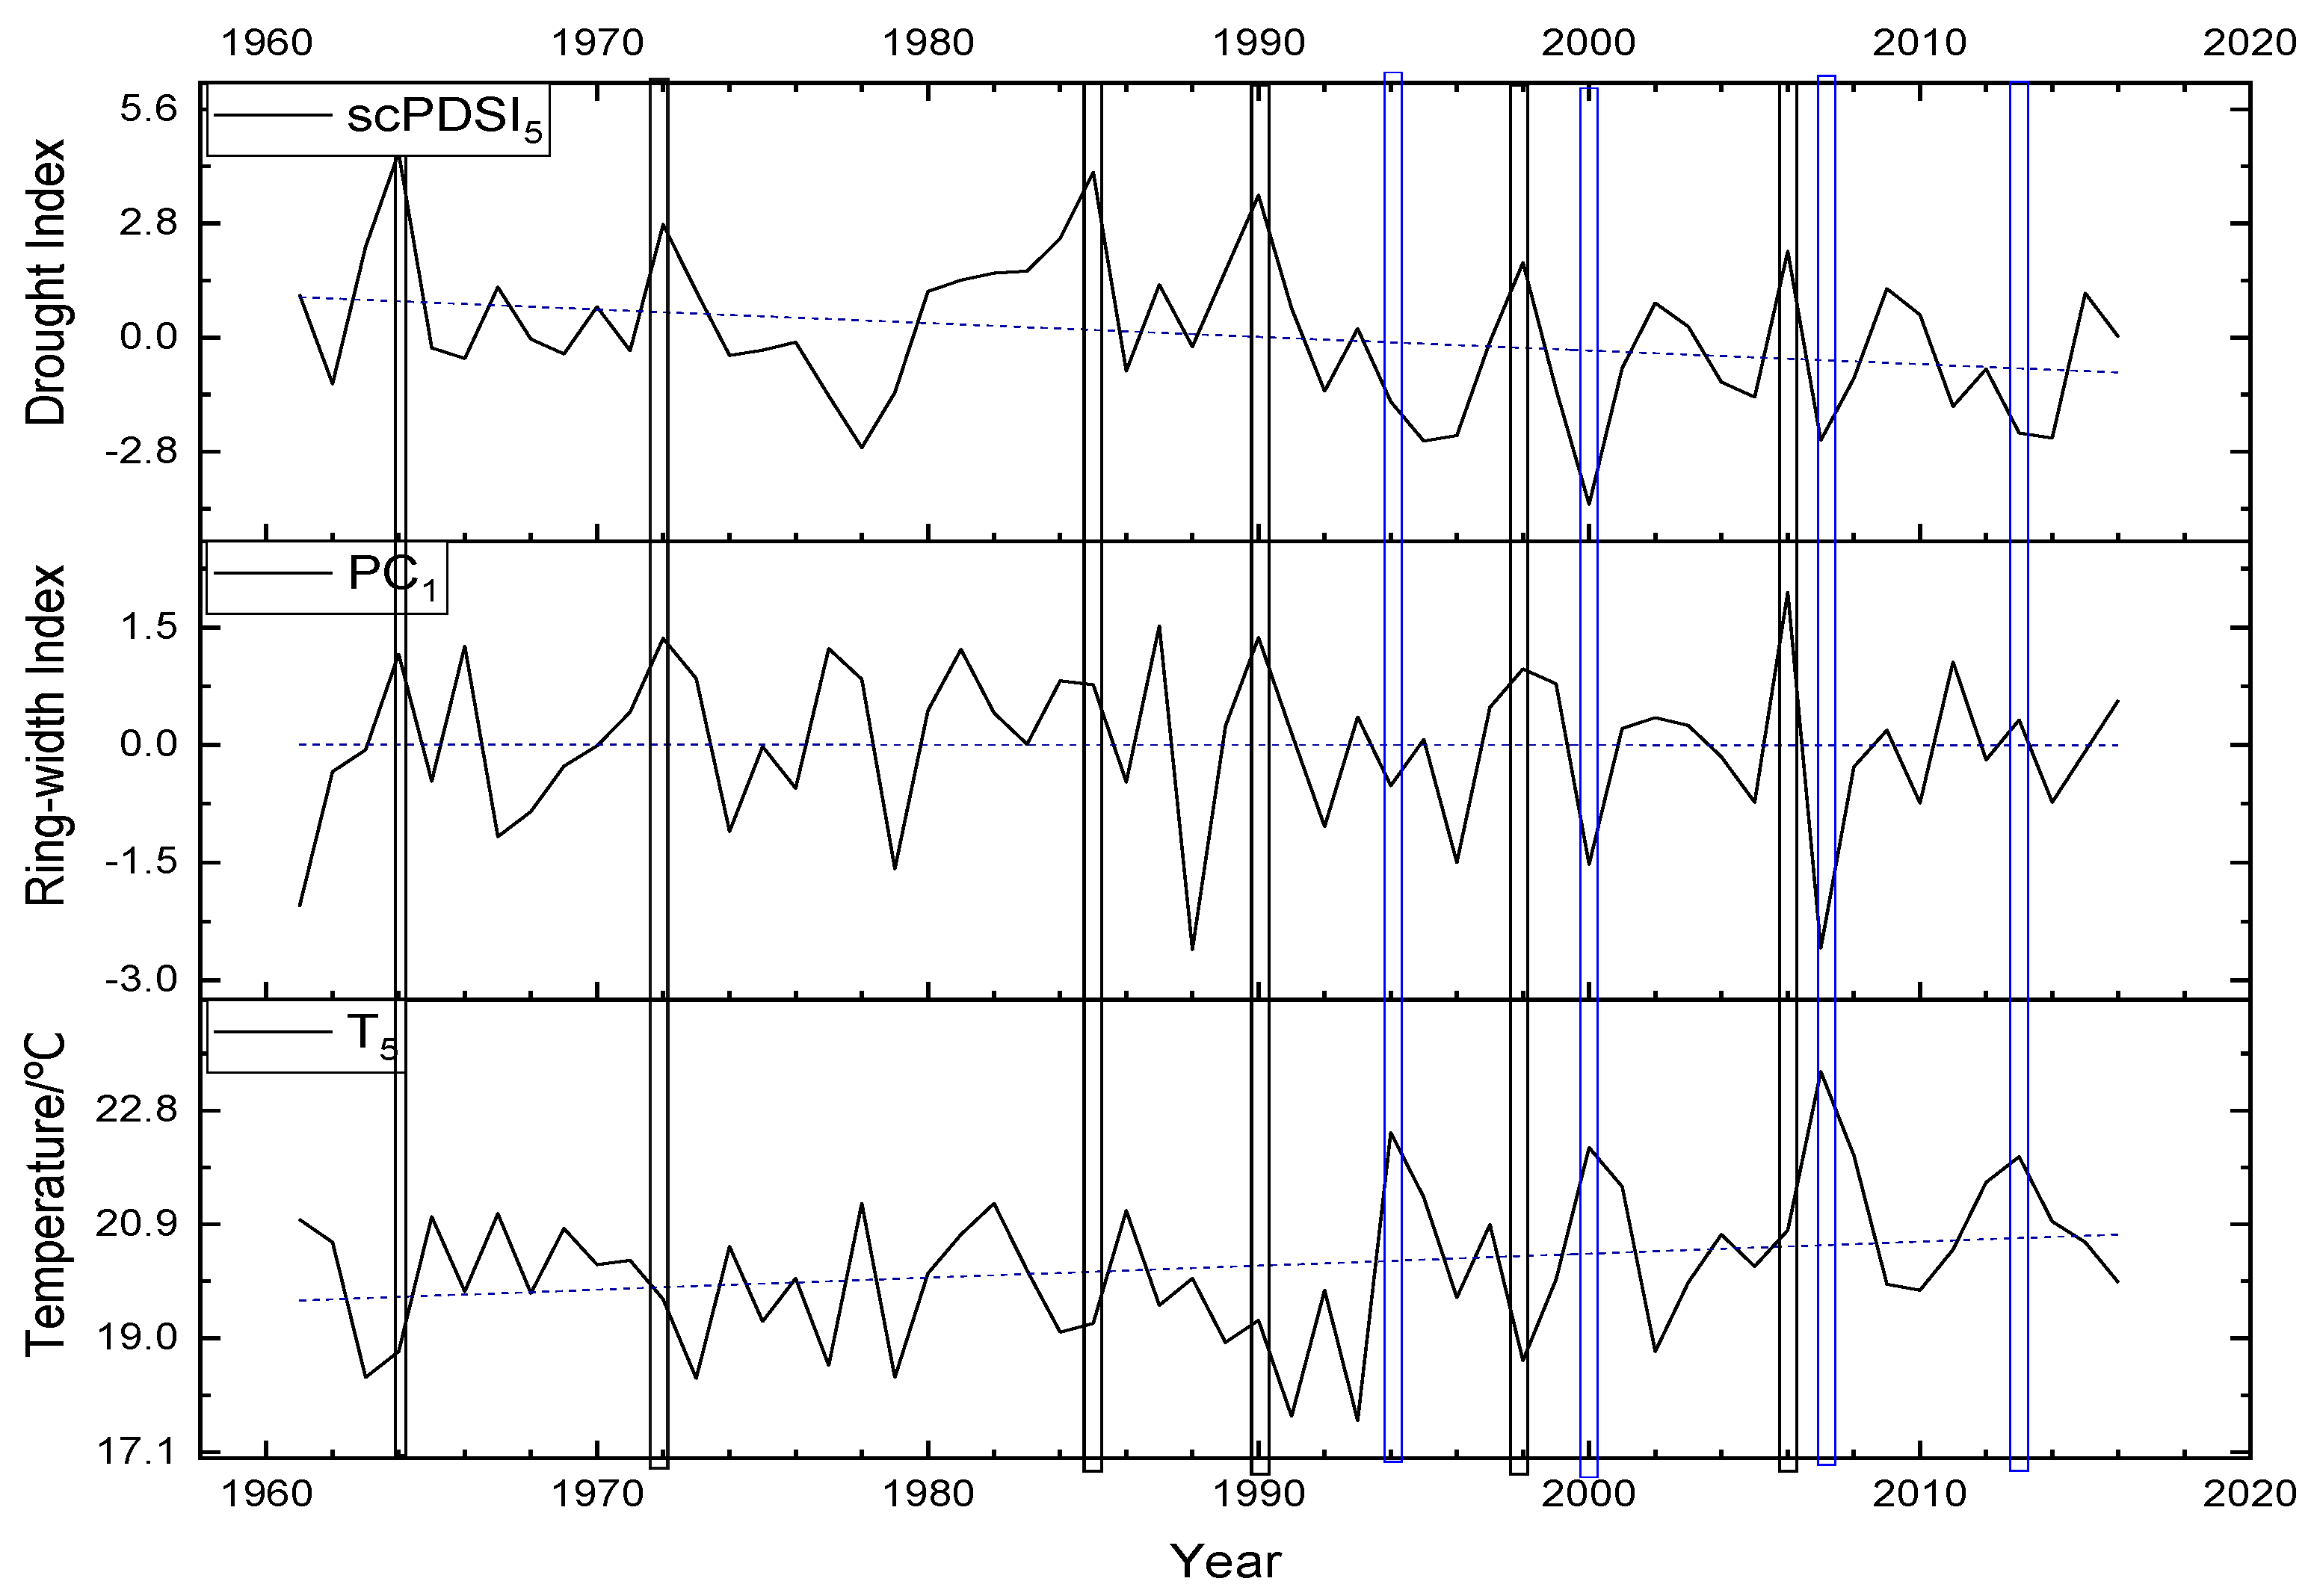
3.2.3. Correlation between PC1 and Regional scPDSI

To better understand regional climate-growth response, we calculated the correlations between PC1 and regional mean scPDSI. There are significant positive correlations between the scPDSI of prior March–April and prior July to current June and the PC1 of four residual chronologies in Mt. Yao (Figure 6). The highest correlation (0.51) is found between regional PC1 and scPDSI in current May, which shows that the latter is the main limiting factor on regional tree growth in Mt. Yao. Meanwhile, the correlation with annual scPDSI from prior July to current June is lower (0.36) than that in May (Figure 6).

3.3. Regional Regression Models of Climate-Growth

In order to better understand the relationships between regional tree growth (PC1) and climate factors, linear stepwise regressions based on bidirectional elimination are used to extract the main limiting factors on tree growth.
Firstly, we developed different climate-growth models using following linear stepwise regression equation, with temperature and precipitation from current January to December from 1960–2016.
Wt = −0.333 *T5 − 0.004*P8 + 7.285
(N = 55, r = 0.438, R2 = 0.192, R2adj = 0.161, F = 5.025 (p = 0.029), D−W = 2.251),
Wt = −0.283 *T5 + 5.711
(N = 55, r = 0.340, R2 = 0.115, R2adj = 0.099, F = 7.036 (p = 0.01), D−W = 2.251),
where (1) and (2), Wt is the index of regional tree-ring chronology for year t; T5 and P8 represent temperature in current May and precipitation in current August, respectively.
The two outcomes of stepwise regression are developed—one is a multiple growth model of temperature in May and precipitation in August, the dominant factors of tree growth (Equation (1)), and the other is a simple regression growth model, where the temperature in May is the main limiting factor of tree growth (Equation (2)). The F and D−W values are positive, and the p values are below 0.05 in both equations, indicating that these models are valid. These results are highly consistent with previous correlation results, verifying the limiting effect of temperature in May.
Secondly, linear stepwise regression equations with the scPDSI were established:
Wt = 0.332 *scPDSI5 − 0.15 *PDSI9 − 0.013
(N = 55, r = 0.539, R2 = 0.291, R2adj = 0.264, F = 5.65 (p = 0.021), D−W = 2.307),
Wt = 0.263 *scPDSI5 − 0.018
(N = 55, r = 0.464, R2 = 0.215, R2adj = 0.201, F = 14.827 (p = 0.000), D−W = 2.307),
where (3) and (4), Wt is the index of regional chronology for year t, and scPDSI5 and scPDSI9 are the scPDSI values in May and September, respectively.
Similarly, Equation (3) is multiple growth models on scPDSI5 and scPDSI9 for tree growth, and (4) is a simple regression model on scPDSI5. Both indicate that the scPDSI5 is the main limiting factor on tree growth. Likewise, the results are very consistent with previous correlation results, verifying the limiting effect of hydrothermal combination in May.

4. Discussion

4.1. Climate-Growth Response of Trees in Different Environments

Previous studies found that there were large discrepancies among trees of different slopes and altitudes [1,5,7,24,56,57,58]. In this study, all four sampling sites are located in a high altitude of Mt. Yao, whereby temperature is generally the main limiting factor on tree growth.
The above results prove that temperature is the main limiting factor on tree growth in this area, while there are different results in various environmental sampling points. Tree growth at YS02 (SW slope, 2070 m), YS03 (S slope, 2016 m) and YS01 (N, 1851 m) is limited by May T. Monsoon precipitation, which has not yet arrived in the region in May, and thus high temperature in May induces soil-effective water loss by increasing land evaporation and plant transpiration, resulting in tree dehydration on high temperature in the sunny slope, while YS01 in shady slope in low altitude compensates for the heat to some extent. However, it is more complicated in the case of the YS04 site, due to the lack of heat in the high altitude (2050 m) and the deficient of heat and water in the northwest shady slope.
Correlation results with regional P indicate different significant correlations with four residual chronologies (Figure 4b). Therefore, there are different responses from four sampling sites of different altitude and slope to precipitation, but tree growth in high altitude at YS02, YS03 and YS04 was all limited by P in current August. This is because much rainfall in August decreased temperature or less rainfall in August resulted in drought to limit tree growth. The above results show that altitude may be a dominant factor that leads to a difference in the influence of precipitation on tree growth, and slope orientation complicates the influence of precipitation.
These results indicate that there are similar responses of tree growth to climatic factors in the region, but different responses were due to the different altitude and slope of each sampling site. The results were consistent with previous studies [7,24,57,58].

4.2. Correlation between PC1 and Regional Climate

Based on the common characteristics of the chronologies and high similarity between each chronology and regional climate factors, the PC1 was extracted to carry out the correlation analysis of regional tree growth (PC1) and regional climate.

4.2.1. Correlation between PC1 and Regional Climate Factors

Regional climate-growth responses found that the hydrothermal combination of prior August and current May was the main limiting factor on regional tree growth in Mt. Yao. The study region features a continental monsoon climate, but it shows low temperature and high rainfall compared to the surrounding plains. It is observed that precipitation in July and August is the main source of water for tree growth in the late growing season and the next year; in particular, a lot of rainfall in August helps the soil to hold water and promote tree growth next spring. More rainfall in August also decreases temperature and limits the tree growth of the late growing season in the current year. High temperature in August may reduce water storage in soils in winter, which may inhibit tree growth in the following year and the formation of narrow rings. Of course, high temperatures in August will help trees grow in the current year. The East Asian Monsoon has not yet arrived in May at Mt. Yao, and thus high temperature-induced soil effective water loss by increasing land evaporation and plant transpiration would lead to narrow ring formation [24]. However, the precipitation in May of the pre-monsoon rainy season is conducive to tree growth and wide ring formation. These results are consistent with many previous studies [7,24,56,57,58].

4.2.2. Correlation between PC1 and Regional scPDSI

The scPDSI originates from the PDSI [59], with the aim to make the values more comparable from different climate regimes. The scPDSI is calculated from precipitation and temperature, together with fixed parameters related to the soil/surface characteristics at each location, so it may represent tree growth response to moisture conditions.
The results show significant positive correlations between PC1 and regional scPDSI of the prior July to the current June in Mt. Yao (Figure 6). The highest correlation is found in the current May rather than annual scPDSI from prior July to current June. On the one hand, the significant negative correlation with temperature and the significant positive correlation with precipitation in May are understood. On the other hand, it shows that the scPDSI has no strong cumulative effect on tree growth in the study area. Tree growth is mainly limited by moisture in current May, which suggests that precipitation and soil moisture in the early growing season may benefit tree-growth, and high temperature may induce drought in May that can inhibit tree grow to form narrow rings [7].

4.3. Comparison of Major Limiting Factors on Tree Growth

The results of correlation analysis and stepwise-regression analysis showed that temperature and scPDSI in May were the limiting factors on tree growth, and the regression results showed that the limiting effect of May scPDSI (R2 = 0.215) is more than May’s temperature (R2 = 0.115). Therefore, scPDSI in May is the main limiting factor in Mt. Yao. A similar result was reported by using early wood width (EWW) of P. tabulaeformis in Mt. Funiu by Zhao et al. [30].
Figure 7 shows that increasing T and decreasing scPDSI trends were obvious in May, but regional tree growth (PC1) trend did not change much from 1961–2016. This indicated that regional tree growth was affected by multiple factors, while T and scPDSI in May are the only main limiting factors. We found that there are six years with high scPDSI values from 1961–2016 (i.e., 1964, 1972, 1985, 1990, 1998 and 2006); all of them feature high tree growth, while low growths are found in high temperature in May in 1994, 2000 and 2007, but high growth in 2013. This affirms that scPDSI in May is the main limiting factor of regional tree growth.

5. Conclusions

In this study, we investigated regional climate-growth response of P. armandii from four sampling sites in Mt. Yao, central China. We come to the following conclusions: (1) There are strong common features among the four residual chronologies, and thus a regional residual chronology can be developed by using their PC1; (2) Correlations of the PC1 with regional climatic factors and scPDSI indicate that the hydrothermal combination of prior August and current May and scPDSI in May were the main limiting factors of tree growth in Mt. Yao; (3) Climate-growth models using stepwise regressions also showed that temperature and scPDSI in May are the main limiting factors of tree growth, but the limiting effect of scPDSI is stronger than temperature. In a word, the hydrothermal combination in May is the main limiting factor when it comes to the growth of P. armandii in Mt. Yao. The above findings will help improve our understanding of forest dynamics in central China under global climate change.

Author Contributions

J.P. designed and developed the study, J.L. (Jingru Li), X.L., J.C., M.P., J.H. and L.Y. collected and prepared the data, J.P. and J.L. (Jingbao Li) analyzed the data and drafted the manuscript. All authors commented preliminary versions of the manuscript and contributed to improve the final version. All authors have read and agreed to the published version of the manuscript.

Funding

The research was funded by the National Natural Science Foundation of China (No. 41671042, 42077417).

Institutional Review Board Statement

Not applicable.

Informed Consent Statement

Not applicable.

Data Availability Statement

The data presented are not publicly available due to the overall project involved in this study has not been completed.

Acknowledgments

We are grateful to the editor and the two anonymous reviewers for their constructive comments. We also thank the logistical support of Mt. Shirenshan Forestry Centre and the help for tree sampling of Chen Liang, Peng Kunyu and Dan Jinrui.

Conflicts of Interest

The authors declare no conflict of interest.

References

  1. Fritts, H.C. Tree Rings and Climate; Academic Press: New York, NY, USA, 1976. [Google Scholar]
  2. Gou, X.H.; Deng, Y.; Chen, F.H.; Yang, M.X.; Fang, K.Y.; Gao, L.L.; Yang, T.; Zhang, F. Tree ring based streamflow reconstruction for the Upper Yellow River over the past 1234 years. Chin. Sci. Bull. 2010, 55, 4179–4186. [Google Scholar] [CrossRef]
  3. Szeicz, J.M.; MacDonald, G.M. Age-dependent tree-ring growth responses of subarctic white spruce to climate. Can. J. For. Res. 1994, 24, 120–132. [Google Scholar] [CrossRef]
  4. Ettl, G.L.; Peterson, D.L. Extreme climate and variation in tree growth: Individualistic response in subalpine fir (Abies lasiocarpa). Glob. Chang. Biol. 1995, 1, 231–241. [Google Scholar] [CrossRef]
  5. Gou, X.H.; Chen, F.H.; Yang, M.X.; Li, J.B.; Peng, J.F.; Jin, L.Y. Climatic response of thick leaf spruce (Picea crassifolia) tree-ring width at different elevations over Qilian Mountains, northwestern China. J. Arid. Environ. 2005, 61, 513–552. [Google Scholar] [CrossRef]
  6. Shen, C.; Wang, L.; Li, M. The altitudinal variability and temporal instability of the climate tree-ring growth relationships for Changbai larch (Larix olgensis Henry) in the Changbai mountains area, Jilin, Northeastern China. Trees 2016, 30, 901–912. [Google Scholar] [CrossRef] [Green Version]
  7. Peng, J.F.; Li, J.B.; Wang, T.; Huo, J.X.; Yang, L. Effect of altitude on climate–growth relationships of Chinese white pine (Pinus armandii) in the northern Funiu Mountain, central China. Clim. Chang. 2019, 154, 273–288. [Google Scholar] [CrossRef]
  8. Yuan, Y.J.; Jin, L.Y.; Shao, X.M.; He, Q.; Li, Z.Z. Variations of the spring precipitation day numbers reconstructed from tree rings in the Urumqi River drainage, Tianshan Mts. over the last 370 years. Chin. Sci. Bull. 2003, 48, 1507–1510. [Google Scholar] [CrossRef]
  9. Liang, E.Y.; Shao, X.M.; Kong, Z.C.; Lin, J.X. The extreme drought in the 1920s and its effect on tree growth deduced from tree ring analysis: A case study in North China. Ann. For. Sci. 2003, 60, 145–152. [Google Scholar] [CrossRef] [Green Version]
  10. Li, J.B.; Chen, F.H.; Cook, E.R.; Gou, X.H.; Zhang, Y.X. Drought reconstruction for north central China from tree rings: The value of the Palmer drought severity index. Int. J. Climatol. 2007, 27, 903–909. [Google Scholar] [CrossRef]
  11. Wang, X.C.; Zhang, Q.B.; Ma, K.P.; Shao, X.M. A tree-ring record of 500-year dry-wet changes in northern Tibet, China. Holocene 2008, 18, 579–588. [Google Scholar] [CrossRef] [Green Version]
  12. Zhang, Y.; Tian, Q.H.; Gou, X.H.; Chen, F.H.; Leavitt, S.W.; Wang, Y. Annual precipitation reconstruction since AD 775 based on tree rings from the Qilian Mountains, northwestern China. Int. J. Climatol. 2011, 31, 371–381. [Google Scholar] [CrossRef]
  13. Fang, K.Y.; Gou, X.H.; Chen, F.H.; D’Arrigo, R.; Li, J.B. Tree-ring based drought reconstruction for Guiqing Mountain (China): Linkage to the Indian and Pacific Oceans. Int. J. Climatol. 2010, 30, 1137–1145. [Google Scholar] [CrossRef]
  14. Fang, K.Y.; Gou, X.H.; Chen, F.H.; Liu, C.Z.; Davi, N.; Li, J.B.; Zhao, Z.Q.; Li, Y.J. Tree-ring based reconstruction of drought variability (1615-2009) in the Kongtong Mountain area, northern China. Glob. Planet. Chang. 2012, 81–82, 190–197. [Google Scholar] [CrossRef]
  15. Zhang, T.W.; Zhang, R.B.; Jiang, S.X.; Bagila, M.; Ainur, U.; Yu, S.L. On the ‘Divergence Problem’ in the Alatau Mountains, Central Asia: A Study of the Responses of Schrenk Spruce Tree-Ring Width to Climate under the Recent Warming and Wetting Trend. Atmosphere 2019, 10, 473. [Google Scholar] [CrossRef] [Green Version]
  16. Gou, X.H.; Peng, J.F.; Chen, F.H.; Yang, M.X.; Levia, D.F.; Li, J.B. A dendrochronological analysis of maximum summer half-year temperature variations over the past 700 years on the northeastern Tibetan Plateau. Theor. Appl. Climatol. 2008, 93, 195–206. [Google Scholar] [CrossRef]
  17. Liang, E.Y.; Leuschner, C.; Dulamsuren, C.; Wagner, B.; Hauck, M. Global warming- related tree growth decline and mortality on the north-eastern Tibetan plateau. Clim. Chang. 2016, 134, 163–176. [Google Scholar] [CrossRef]
  18. Liu, Y.; Bao, G.; Song, H.M.; Cai, Q.F.; Sun, J.Y. Precipitation reconstruction from Hailar pine, Pinus sylvestris var. mongolica: Tree rings in the Hailar region, Inner Mongolia, China back to 1865 AD. Palaeogeogr. Palaeoclimatol. Palaeoecol. 2009, 282, 81–87. [Google Scholar] [CrossRef]
  19. Shao, X.M.; Xu, Y.; Yin, Z.Y.; Liang, E.Y.; Zhu, H.F.; Wang, S. Climatic implications of a 3585-year tree-ring width chronology from the northeastern Qinghai-Tibetan Plateau. Quat. Sci. Rev. 2010, 29, 2111–2122. [Google Scholar] [CrossRef]
  20. Peng, J.F.; Liu, Y.Z. Reconstructed droughts for the northeastern Tibetan Plateau since AD 1411 year and its linkages to the Pacific, Indian and Atlantic Oceans. Quat. Int. 2013, 283, 98–116. [Google Scholar] [CrossRef]
  21. Zhang, Q.B.; Evans, M.N.; Lyu, L.X. Moisture dipole over the Tibetan Plateau during the past five and a half centuries. Nat. Commun. 2015, 6, 8062. [Google Scholar] [CrossRef]
  22. Sun, C.F.; Liu, Y.; Song, H.M.; Cai, Q.F.; Li, Q.; Wang, L.; Mei, R.C.; Fang, C. Sunshine duration reconstruction in the southeastern Tibetan plateau based on tree-ring width and its relationship to volcanic eruptions. Sci. Total Environ. 2018, 628–629, 707–714. [Google Scholar] [CrossRef]
  23. Shi, J.F.; Lu, H.Y.; Wan, J.D.; Li, S.F.; Nie, H.S. Winter-half year temperature reconstruction of the last century using Pinus armandii Franch. tree-ring width chronologies in the eastern Qinling Mountains. Quat. Sci. 2009, 29, 831–836. (In Chinese) [Google Scholar]
  24. Shi, J.F.; Li, J.B.; Cook, E.R.; Zhang, X.; Lu, H.Y. Growth response of Pinus tabulaeformis to climate along an elevation gradient in the eastern Qinling Mountains, central China. Clim. Res. 2012, 53, 157–167. [Google Scholar] [CrossRef] [Green Version]
  25. Chen, F.; Yuan, Y.J.; Wei, W.S.; Yu, S.L.; Zhang, T.W. Correlations between the summer Asian-Pacific Oscillation Index and the tree-ring width of Pinus massiniana from Sha county Fujian Province. Quat. Sci. 2011, 31, 96–103. (In Chinese) [Google Scholar]
  26. Duan, J.P.; Zhang, Q.B.; Lv, L.X.; Zhang, C. Regional-scale winter-spring temperature variability and chilling damage dynamics over the past two centuries in southeastern China. Clim. Dynam. 2012, 39, 919–928. [Google Scholar] [CrossRef]
  27. Duan, J.P.; Zhang, Q.B.; Lv, L.X. Increased Variability in Cold-Season Temperature since the 1930s in Subtropical China. J. Clim. 2013, 26, 4749–4757. [Google Scholar] [CrossRef]
  28. Zheng, Y.H.; Zhang, Y.; Shao, X.M.; Yin, Z.Y.; Jin, Z. Temperature variability inferred from tree-ring widths in the Dabie Mountains of subtropical central China. Trees 2012, 26, 1887–1894. [Google Scholar] [CrossRef]
  29. Cai, Q.F.; Liu, Y. The June–September maximum mean temperature reconstruction from Masson pine (Pinus massoniana Lamb.) tree rings in Macheng, southeast China since 1879 AD. Chin. Sci. Bull. 2013, 58 (Suppl. I), 169–177. (In Chinese) [Google Scholar]
  30. Zhao, Y.S.; Shi, J.F.; Shi, S.Y.; Ma, X.Q.; Zhang, W.J.; Wang, B.W.; Sun, X.G.; Lu, H.Y.; Braeuning, A. Early summer hydroclimatic signals are captured well by tree-ring earlywood width in the eastern Qinling Mountains, central China. Clim. Past 2019, 15, 1113–1131. [Google Scholar] [CrossRef] [Green Version]
  31. Zhao, Z.; Fang, K.Y.; Cao, C.F.; Chen, D.L.; Liang, X.; Dong, Z.P.; Zhang, P. Responses of the radial growth of the endangered species Keteleeria fortunei to climate change in southeastern China. Trees 2019, 33, 977–985. [Google Scholar] [CrossRef]
  32. Liu, Y.; Li, C.Y.; Sun, C.F.; Song, H.M.; Li, Q.; Cai, Q.F.; Liu, R.S. Temperature variation at the low-latitude regions of East Asia recorded by tree rings during the past six centuries. Int. J. Climatol. 2020, 40, 1561–1570. [Google Scholar] [CrossRef]
  33. Mountain Research Initiative EDW Working Group. Elevation dependent warming in mountain regions of the world. Nat. Clim. Chang. 2015, 5, 424–430. [Google Scholar] [CrossRef] [Green Version]
  34. Jiang, Y.M.; Li, Z.S.; Fan, Z.X. Tree-ring based February-April relative humidity reconstruction since AD 1695 in the Gaoligong Mountains, southeastern Tibetan Plateau. Asian Geogr. 2017, 34, 59–70. [Google Scholar] [CrossRef]
  35. Yang, B.; He, M.H.; Shishov, V.; Tychkov, I.; Vaganov, E.; Rossi, S.; Ljungqvist, F.C.; Bräuning, A.; Grießinger, J. New perspective on spring vegetation phenology and global climate change based on Tibetan Plateau tree-ring data. Proc. Natl. Acad. Sci. USA 2017, 114, 6966–6971. [Google Scholar] [CrossRef] [Green Version]
  36. Bräuning, A. Combined view of various tree ring parameters from different forest habitats in Tibet for the reconstruction of seasonal aspects of Asian Monsoon variability. Palaeobotanist 2001, 50, 1–12. [Google Scholar]
  37. Körner, C. Alpine Treelines: Functional Ecology of the Global High Elevation Tree Limits; Springer: Berlin/Heidelberg, Germany, 2012. [Google Scholar]
  38. Chen, F.; Yuan, Y.J.; Wei, W.S.; Yu, S.L.; Wang, H. Tree-ring response of subtropical tree species in southeast china on regional climate and sea-surface temperature variations. Trees 2015, 29, 17–24. [Google Scholar] [CrossRef]
  39. Lyu, L.X.; Deng, X.; Zhang, Q.B. Elevation pattern in growth coherency on the southeastern Tibetan Plateau. PLoS ONE 2016, 11, e0163201. [Google Scholar] [CrossRef]
  40. Lyu, L.X.; Suvanto, S.; Nöjd, P.; Henttonen, H.M.; Zhang, Q.B. Tree growth and its climate signal along latitudinal and altitudinal gradients: Comparison of tree rings between Finland and Tibetan Plateau. Biogeosci. Discuss. 2017, 14, 3083–3095. [Google Scholar] [CrossRef] [Green Version]
  41. Peng, J.F.; Gou, X.H.; Chen, F.H.; Fang, K.Y.; Zhang, F. Influences of slope aspect on the growth of Sabina przewalskii along an elevation gradient in China’s Qinghai Province. Chin. J. Plant Ecol. 2010, 34, 517–525. (In Chinese) [Google Scholar]
  42. Wang, T.; Ren, S.Y.; Chen, Y.; Yuan, Z.L.; Li, L.X.; Pan, N.; Ye, Y.Z. Dynamic of carbon storage of Pinus armandii forest at different diameter levels based on tree ring data in the Baotianman National Nature Reserve, central China. Chin. Sci. Bull. 2014, 59, 3499–3507. (In Chinese) [Google Scholar]
  43. Wang, T.; Li, C.; Zhang, H.; Ren, S.Y.; Li, L.X.; Pan, N.; Yuan, Z.L.; Ye, Y.Z. Response of conifer trees radial growth to climate change in Baotianman National Nature Reserve, central China. Acta Ecol. Sin. 2016, 36, 5324–5332. (In Chinese) [Google Scholar]
  44. Liu, N.; Liu, Y.; Zhou, Q.; Bao, G. Droughts and broad-scale climate variability reflected by temperature-sensitive tree growth in the Qinling Mountains, central China. Int. J. Biometeorol. 2013, 57, 169–177. [Google Scholar] [CrossRef]
  45. Liu, Y.; Zhang, Y.J.; Song, H.M.; Ma, Y.; Cai, Q.F.; Wang, Y.C. Tree-ring reconstruction of seasonal mean minimum temperature at Mt. Yaoshan, China, since 1873 and its relevance to 20th-century warming. Clim. Past Discuss. 2014, 10, 859–894. [Google Scholar]
  46. Liu, Y.; Liu, H.; Song, H.M.; Li, Q.; Burr, G.S.; Wang, L.; Hu, S.L. A 174-year Asian summer monsoon related relative humidity record from tree-ring δ18O in the Yaoshan region, eastern central China. Sci. Total Environ. 2017, 593/594, 523–534. [Google Scholar] [CrossRef] [PubMed]
  47. Peng, J.; Li, J.; Yang, L.; Li, J.; Huo, J. A 216-year tree-ring reconstruction of April–July relative humidity from Mt. Shiren, central China. Int. J. Climatol. 2020, 40, 6055–6066. [Google Scholar] [CrossRef]
  48. Stokes, M.A.; Smiley, T.L. An Introduction to Tree Ring Dating; The University of Chicago Press: Chicago, IL, USA, 1968. [Google Scholar]
  49. Holmes, R.L. Computer-assisted quality control in tree-ring dating and measurement. Tree-Ring Bull. 1983, 43, 69–75. [Google Scholar]
  50. Cook, E.R.; Holmes, R.L. Users Manual for ARSTAN; Laboratory of Tree-Ring Research, University of Arizona: Tucson, AZ, USA, 1986. [Google Scholar]
  51. Cook, E.R.; Kairiukstis, L.A. (Eds.) Methods of Dendrochronology: Applications in the Environmental Sciences; Springer: Dordrecht, The Netherlands, 1990. [Google Scholar]
  52. Van der Schrier, G.; Briffa, K.R.; Jones, P.D.; Osborn, T.J. Summer moisture variability across Europe. J. Clim. 2006, 19, 2818–2834. [Google Scholar] [CrossRef]
  53. Lu, W.D.; Zhu, H.B. SPSS Statistical Analysis, 5th ed.; Electronic Industry Press: Beijing, China, 2015. [Google Scholar]
  54. Biondi, F.; Waikul, K. Dendroclim 2002: A C++ program for statistical calibration of climate signals in tree-ring chronologies. Comput. Geosci. 2004, 30, 303–311. [Google Scholar] [CrossRef]
  55. Wigley, T.L.; Briffa, K.R.; Jones, P.D. On the average value of correlated time series, with applications in dendroclimatology and hydrometeorology. J. Appl. Meteorol. Climatol. 1984, 23, 201–213. [Google Scholar] [CrossRef]
  56. Peng, J.F.; Gou, X.H.; Chen, F.H.; Li, J.B.; Liu, P.X.; Zhang, Y. Altitudinal variability of climate–tree growth relationships along a consistent slope of Anyemaqen Mountains, northeastern Tibetan Plateau. Dendrochronologia 2008, 26, 87–96. [Google Scholar] [CrossRef]
  57. Jiao, L.; Jiang, Y.; Wang, M.C.; Kang, X.Y.; Zhang, W.T.; Zhang, L.N.; Zhao, S.D. Responses to climate change in radial growth of Picea schrenkiana along elevations of the eastern Tianshan Mountains, northwest China. Dendrochronologia 2016, 40, 117–127. [Google Scholar] [CrossRef]
  58. Huo, Y.X.; Gou, X.H.; Liu, W.H.; Li, J.B.; Zhang, F.; Fang, K.Y. Climate–growth relationships of Schrenk spruce (Picea schrenkiana) along an altitudinal gradient in the western Tianshan Mountains, northwest China. Trees 2017, 31, 429–439. [Google Scholar] [CrossRef] [Green Version]
  59. Palmer, W.C. Meteorological Drought; Research Paper 45; U.S. Department of Commerce, Weather Bureau: Washington, DC, USA, 1965; p. 58.
Figure 1. Locations of the sampling region (square) and sampling sites (triangle) in Mt. Yao and the nearby meteorological stations (dots) in the Funiu Mountains, central China.
Forests 12 00780 g001
Figure 2. Residual chronologies and the sample depths of the four groups of samples at Mt. Yao, central China.
Forests 12 00780 g002
Figure 3. Monthly mean temperature (T) (SD: 0.9–1.91) and monthly total precipitation (P) (SD: 10.46–80.06) averaged from four meteorological stations near Mt. Yao during 1961–2016.
Forests 12 00780 g003
Figure 4. Correlations between chronologies and regional T (a) and P(b) from 1961 to 2016.
Forests 12 00780 g004
Figure 5. Correlations between PC1 and regional T and P from 1961 to 2016.
Forests 12 00780 g005
Figure 6. Correlations between PC1 and regional scPDSI (J–J: prior July to current June).
Forests 12 00780 g006
Figure 7. Comparison of PC1 with T and scPDSI in May from 1961–2016. The black rectangles represent higher scPDSI, while the grey rectangles represent higher T in May.
Forests 12 00780 g007
Table 1. Statistical characteristics of the chronologies from the four sampling sites at Mt. Yao, central China.
StatisticsYS01YS02YS03YS04
Samplings cores (Trees)38(20)53(36)40(26)34(19)
Latitude
Longitude
Elevation(M)
33°43′34″33°43′21″33°42′51″33°42′57″
112°14′42″112°14′36″112°14′56″112°14′53″
1851207020162050
SlopeNSWSNW
Mean Sensitivity(M.S.)0.2450.2130.2650.283
Standard Deviation (S.D.)0.2260.1870.2220.24
First year1785183119201855
Begin year of SSS > 0.80(year)1913186819611872
Common period (period)1980–2015
Mean correlation between all series(r1)0.2740.2990.4340.281
Mean correlation within a tree(r2)0.7430.60.7400.646
Mean correlation between trees(r3)0.2610.2940.4280.271
Signal-to-noise ratio(SNR)12.46918.35525.29711.699
Expressed population signal(EPS)0.9260.9480.9620.921
Table 2. Correlations among four residual chronologies from 1961–2016.
YS01YS02YS03YS04
YS011
YS020.437 **1
YS030.293 *0.370 **1
YS040.418 **0.621 **0.531 **1
** Significant at the 0.01 level * Significant at the 0.05 level.
Publisher’s Note: MDPI stays neutral with regard to jurisdictional claims in published maps and institutional affiliations.

