
Forest Dynamics after Five Decades of Management in the Romanian Carpathians
by
 ,
,
Gheorghe-Marian Tudoran
1,*, 
Avram Cicșa
1,2 ,
,
Maria Boroeanu
1,
Alexandru-Claudiu Dobre
1,2 and
Ionuț-Silviu Pascu
2 1
Department of Forest Engineering, Forest Management Planning and Terrestrial Measurements, Faculty of Silviculture and Forest Engineering, “Transilvania” University, 1 Ludwig van Beethoven Str., 500123 Brașov, Romania
2
Department of Forest Monitoring, “Marin Drăcea” Romanian National Institute for Research and Development in Forestry, 128 Eroilor Blvd., Voluntari, 077190 Ilfov, Romania
*
Author to whom correspondence should be addressed.
Forests 2021, 12(6), 783; https://doi.org/10.3390/f12060783
Submission received: 21 March 2021
/
Revised: 18 May 2021
/
Accepted: 11 June 2021
/
Published: 14 June 2021
(This article belongs to the Special Issue Long-Term Vegetation Dynamics and Forest Landscape Change)
Abstract
:Research Highlights: Management of the risks forests are exposed to is based on the dynamics of the composition and structure of the stands and the forest. Background and Objectives: This study aimed to document the dynamics of the composition and structure of stands and forest in the Romanian Carpathians over the last five decades, as well as estimate the forecast composition of the forest in the near future (i.e., 2070). Materials and Methods: The obtained results were based on long-term monitoring and analysis of the species and structures in the stands in long-term research areas (over five decades). We performed an inventory of all the trees (on 7.5 ha) in order to characterize the stand structure in sampling plots of 0.25–1.0 ha, located in representative stands of five forest formations. Bitterlich sampling was performed in order to determine the composition of each stand (on 2930.4 ha). The future composition was established in accordance with the characteristics of the natural forest types and was based on seedling dynamics and forest management plans. Results: In mixed beech–coniferous stands, over the last five decades, the area of beech has increased by 38%, while conifers have decreased proportionally—fir by 31% and spruce by 5%. The seedling area increased from 23% to 65%, with fir contributing 22% to the composition and beech 42%. Stand density decreased by an average of 14%, with the current increment decreasing by 3.8%. The slenderness index for fir decreased from 73 to 61. In the near future, there will be an increase in the proportion of fir, from 15 to 33%, and a reduction in beech, from 49 to 45%. The proportion of spruce will be reduced from 17 to 12%. Conclusions: Based on the forest dynamics, management adaptation strategies need to be developed to improve the stability of the forest ecosystems.
1. Introduction
Forest dynamics result from the application of management measures and the development of stands. Yield targets set at the level of stands and forests determine active interventions in the lives of forests that change their structure, production, and growth [1]. By applying silvicultural treatments, the structure and composition of a forest changes. These are considered fundamental factors in the dynamics [2,3]. The effect of treatments on future compositions and structures can be followed by long-term observation [4,5,6].
Management actions aim to maintain the stability of forests. Although trees have developed certain mechanisms to withstand change, forests are vulnerable to rapid change. In this sense, an important role can be played by forest management, through which various strategies can be applied [7]. Uneven-aged structures have become a target of management in many spruce monocultures. They may also create favorable conditions for maintaining fir in the current composition of forests [3,8]. Mixed stands are also much more resistant to disturbances than monocultures [9,10,11,12,13,14]. Consequently, management practices are attempting to convert several even-aged spruce forests (e.g., in Germany) [11,15]. The main alternative to clearcutting in Europe has been the application of a selection system in mixed stands where fir was the main species. This lends great stability to the forest due to its diversified structure, and also promotes conditions for abundant regeneration. Another advantage is the possibility of harvesting trees of various species, sizes, and quality that can be adapted to market requirements [10].
However, the yield process of forests is influenced by the actions of destabilizing factors, which produce major changes in the lives of forests, especially in cases of regeneration [16], such that the restoration of their structure is a long process [17]. In recent decades, climate change has become one of the main factors causing radical changes in forest structures [7,8,11,18,19,20,21,22]. It especially threatens conifers located in Southern and Central Europe [18,20,23,24,25]. Of these, spruce is being the most affected [14,24]. Against the background of climate change, factors such as vegetation fires [24,26,27], which, in already destabilized areas, can be added to the actions of insects [16,18,28,29,30], can also change the structure of forests.
Wind damage has also become more common, manifesting over large areas [3,14,17,24], and especially in forests with even-aged structures [29]. In the spruce stands of the Western Carpathians, the main disturbances are windthrow and insect attack [29,30]. As a result of climate change [3,20], forests located at lower-altitude sites have changed in composition, and there has been a considerable reduction in the proportion of fir [14,31].
In heavily populated areas, ungulates threaten regeneration [3,17,18,32,33,34], with fir being the most affected, compared to spruce [35]; therefore, fir should be promoted more at these sites [14]. In the future, the type of management and ungulates could have a much greater impact on forests than climate change [3].
Sulphur dioxide emissions have also influenced the decline of fir in Europe [20,36]. In the natural range of fir in Europe, the appearance of mistletoe has been widely reported, which may explain the decline, along with the predisposition of fir to attack by pathogens [18,20]. Due to the increasingly common mortality of fir in recent decades, it is much more prone to attack by insects and pathogens compared to spruce [37]. Long-term simulations have indicated that management and climate change are the main factors that will have a negative effect on conifer growth and regeneration, with beech being more favored [3,8,28,38]. For example, the application of characteristic treatments for even-aged stands in uneven-aged stands, or the application of treatments at inadequate intensities, has created light conditions that are not ecologically optimal for shade-tolerant species, such as fir [17,20]. However, the association of fir with beech in many European stands has contributed to its extension outside its distribution area [18], as well as the application of the selection system, whereby beech has been predominantly cut in favor of fir, which has been preserved due to its value. This dynamic has determined the appearance of fir outside its optimal area, where it has become vulnerable to fluctuations and disturbances [20,33]. Some studies have postulated that fir will become rare in the future, perhaps even extinct, with its fate depending very much on the management methods applied [3,28]. However, if the average amount of annual precipitation is over 800 mm in the future, fir populations may remain stable, even in the context of global warming [20]. Although disturbances have been considered to be a negative factor in forest ecosystems for many decades due to the damage they cause, they can also have positive effects on both regeneration [39] and species diversity [40].
In Romania, through forest management, the natural regeneration of stands and maintenance of the composition of the stands as close as possible to the composition of the natural forest types have been promoted as a priority. Diversifying the vertical structure and creating conditions for increasing biodiversity are goals promoted through management plans. The Curvature area of the Romanian Carpathians is recognized for its forest biodiversity. There are also fir populations that fulfil multiple protective functions. Since 1963, in the forests of this area, management plans have been aimed at promoting structures comprising several generations. During regeneration cuttings, treatments with a long regeneration period of 40–60 years were designed to diversify the structure of the stands. In recent decades, however, the most affected species has been fir. At its lowest altitude limit, fir mainly occurs in forests in silver fir–European beech stands. The continuity of the fir population is becoming more and more concerning in this area as it declines. The health of these fir trees, as well as isolated fir windthrows, has prompted civic interventions in the stands that have changed the compositional structure of the forest. Given that the management of stands has been affected through the application of long-term treatments and the promotion of natural regeneration, it is expected that their structures will have evolved in the direction of increasing biodiversity. This natural method of promoting original stands, under the canopy, is expected to ensure the maintenance of fir in future forest compositions. Being a shade-tolerant species, the management measures applied would need to have been the most suitable for its regeneration.
Against the backdrop of these aspects, through this study, we aimed to: (i) illustrate the dynamics of the composition and structure of a mixed beech–coniferous forest over the last five decades of management, and (ii) estimate the composition in the near future (i.e., in 2070). We determined several indicators that can characterize the forest dynamics at the stand and forest levels, and that can be used to evaluate their stability.
2. Materials and Methods
2.1. Study Area
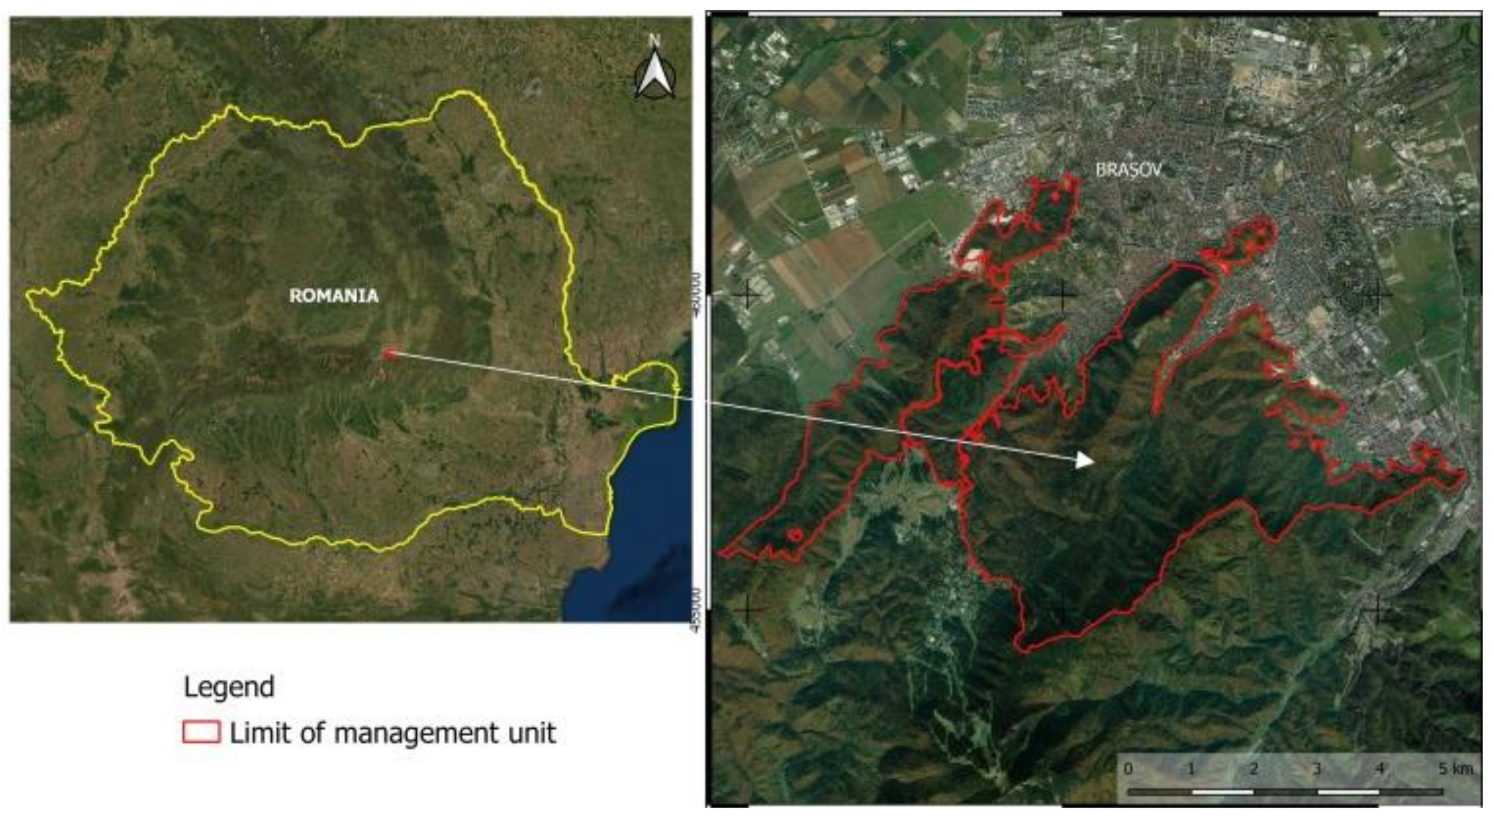
The study was carried out in the Postavaru Massif of the Romanian Carpathians in a management unit with an area of 2930.4 ha (Figure 1). The forests are located at altitudes of between 700 and 1400 m, on limestones and conglomerates, on predominantly sunny to partially sunny slopes (Table 1). The slopes often have inclinations of 20–35°. The area is characterized by multiannual average temperatures of between 5 and 7.8 °C and annual rainfall of between 750 and 950 mm.
The most common soils are eutricambosols and districambosols, with, to a lesser extent (18%), prepodzols and rendzine. The characteristic herbaceous plant species are represented by Galium odoratum–Cardamine bulbifera, Rubus hirtus, Symphytum cordatum, Festuca altissima, Luzula albida–Calamagrostis arundinacea, and Vaccinium myrtillus.
The first forest management plans for these forests were made in 1890. Starting in 1962, experimental plots were established in the forests to monitor the structure of the stands. The occurrence of drying (fir and pine) and wind disturbance (fir) led to the installation of a new sample area, starting in 2012.
Based on information recorded in the forest management plans (descriptions and thematic maps), we stratified the forest area in relation to altitude, exposure, and slope. We analyzed the forest composition, its age distribution (Table 1), the current character of the forest (natural or artificial), and the silvicultural works designed through the management plan.
2.2. Field Measurements
To characterize the stands structure, the field observations took the form of mapping in key areas, following documentation of the management unit. The key area was chosen to include the diversity of existing seasonal, vegetation, and forest management conditions in the management unit. In the key areas, we included plots that encompassed all the forest formations (i.e., mixed spruce—fir stands (8%), fir stands (5%), mixed beech—coniferous stands (40%), beech stands (44%), and mixed oak—beech stands (3%)). We selected stands mixed at different densities in which silvicultural works were either being carried out or not. This resulted in a 535.30-hectare key area, consisting of 36 stands. These stands were successively inventoried between 1962 and 2020 (see Supplementary Materials Table S1). In Table 2, we present the main biophysical characteristics of the representative stands from the forest formations in the management unit, determined through sample area inventories (0.25–1.0 ha) from 2012 to 2020 (see Supplementary Materials Table S2).
At the mixed beech—coniferous stand level included in the key area, major changes in the composition were observed, despite the similar fir and beech (predominant species) regeneration capacities (i.e., similar proportions of seedlings of the two species had been installed) (Table 3).
Silvicultural interventions had been made in most of the management unit stands and they profoundly changed their composition. In order to determine as accurately as possible the changes registered at the level of the forest and of the seedling composition, we extended the study to the entire area (2930.4 ha) of the management unit. In the data acquisition process (of all the stands that made up the management unit), in order to build phytogeographic profiles and describe the stands, the land was traversed with perpendicular transects following the valley and ridges. These transects were designed in such a way as to cross as many stands as possible (each transect included one to as many as five stands). The transects were not marked in the field, only their coordinates were recorded at the point where the measurement was performed. A total of 446 research areas were needed to describe all the stands (i.e., 23 from mixed spruce–fir stands, 50 from fir stands, 93 from mixed beech–coniferous stands, 247 from beech stands, and 33 from mixed oak–beech stands), and each point was marked on the nearest tree. All the stands in the management unit are described in Supplementary Materials Table S1) (the last survey). The positions of the research areas were established following the structure overview obtained through covering each entire stand [22]. In each research area, the seedling and stand structures were analyzed. In some cases, in order to achieve this, it was necessary to situate two distinct sample areas in one stand. The field measurements were made in the summer to autumn of 2020.
The seedlings were evaluated in all 446 stands of the management unit, in circular surveys of 100 m2. In each plot, the coverage of each species was visually estimated, and the composition and seedling vitality were assessed using the following criteria: (i) tree preservation—1 (alive) or 2 (dead); (ii) growth vigor—1 (individualized stem tip) or 2 (curled, bushy appearance); (iii) leaf appearance—1 (normally developed), 2 (injured by ungulates), or 3 (presence of necrotic leaves). The herbaceous plants (dominant and auxiliary) were also identified in the plots by coverage and type. The indicator plant type, seedling composition, stand composition, and productivity (site productivity indicated through stand height) were the main criteria for differentiating the forest types and establishing a stand’s goal composition to be achieved through silvicultural interventions.
A Bitterlich survey (of 446 plots) was performed in order to determine each stand’s composition and biophysical characteristics. Since most of the stands were mixed, multiplication factors of 1 and 2 were adopted to determine the composition. A total of 9047 trees were counted, 1033 of them in the key area (see Supplementary Materials Table S1). Diameters were measured only for stands in which regeneration cuttings had been applied or were planned to be carried out in the next 50 years. This was the case for 261 stands, constituting an area of 1904.9 ha (65% of the area of the management unit). To identify the trees of which the diameters were measured, a factor of two was adopted. The diameters were measured in 3727 trees (523 trees in the key area), and the mean basal diameter of each species was calculated (i.e., dg, the quadratic mean diameter or diameter of the mean-basal-area tree). During the Bitterlich inventory, two generations were distinguished in the stands, and for each generation, the mean diameter and mean height were determined, as well as the age, using cored samples (extracted from the mean trees). For the other stands, the ages were taken from the management plans. To determine the mean height (i.e., hg) of each species, three trees with diameters close to the mean diameter (i.e., dg) were measured (in 261 stands). In some cases, heights were also measured on trees outside the Bitterlich survey. In the Bitterlich survey, heights were measured in 1897 trees, 231 of them in the key area. In 2020, integral inventories were carried out, identifying 1524 trees (in three stands) on 2.25 ha (2 plots of 1.0 ha and one of 0.25 ha). To characterize the stand structures in each forest formation, we also used the integral inventories we carried out in the period 2012–2019 on another 5.5 ha (2929 trees) (see Supplementary Materials (1,2)). To determine the dynamics of the stand structures, we used inventories from previous years (i.e., 1963, 1969, and 1972). In the case of complete inventories, all trees with diameters greater than 1 cm were measured. For the measurements, we used a Criterion RD 1000 and a Vertex Laser.
The deadwood was evaluated during the complete inventories carried out in the studied areas in the 2012–2020 period. In the case of standing trees, the dimensions were measured, and the volume was determined using Equation (1). To determine the volume of fallen trees on the ground, the diameters at the midpoints of the sections and their lengths were measured. During the observations made during the Bitterlich surveys, one to three dead standing trees per hectare were registered.
2.3. Establishing the Future Forest Composition
In 2020, the composition was 63% European beech (EB), 34% silver fir (SF), 2% Norway spruce (NS), and 1% other deciduous (Norway maple—NM, sycamore—SY, common hornbeam—CH, sessile oak—SO), and this was present on 65% of the management unit area. To establish the 2070 target composition, we considered compositions established at the stand level, depending on the forest type. We established these compositions based on field evaluations in terms of stand composition, seedling composition, and vitality. These largely reflected the forest type compositions established in 1950, with differences related to climatic change. For each type of forest, we considered flexible goal compositions that would be possible to achieve. We present only the target compositions for the main types of forest in which fir has the highest proportion (notations used below: EB, NS, SF, SY, NM, as above; AH—European ash, EM—wych elm, EL—European larch, BP—Austrian black pine, SP—Scots pine, SO—sessile oak, LI—small-leaved lime, FM—field maple, CH—common hornbeam, WCH—wild cherry, and MA—manna ash): Mixed spruce–fir forest with herbaceous mull plants: 40–50% NS, 30–40% SF, 10–20% SY, WE, AH; Fir forest with herbaceous mull plants: 70–80% SF, 10–20% EB, 10% SY, NM; Mixed beech–fir stands: 50–60% SF, 30–40% EB, 10% SY, NM, AH, EM; and Mixed beech–spruce–fir forest: 30–40% NS, 30–40% SF, 30% EB, SY.
The target composition was established for each stand, based on the composition of the natural forest type, seedling composition and vitality, and the regenerative capacity of the stand. In the target composition simulation, we introduced the stand compositions from the harvesting plan (of the exploitable stands and those that will become exploitable in the next 50 years), the seedling composition, and the composition of the stands left out of the plan. To establish the target composition, we took into account the natural development of the yield process of the stands (i.e., the exploitation of the stands included in the plan, and their regeneration with species in proportions corresponding to the composition of the natural forest type). Another approach was also taken into account in which cuttings would no longer take place, according to the harvesting plan, and the environmental conditions would greatly influence the natural regeneration of the stands, based on a simulated climate scenario for the next 50 years.
2.4. Data Analysis
For each stand in the management unit, the mean diameter was determined for each species based on the diameter measurements included in the Bitterlich surveys (i.e., dg, diameter of the mean-basal-area tree). The volume of the trees was determined based on diameter and height by means of Giurgiu and Drăghiciu’s (2004) regression equation, which is used for these species in Romania:
log v = a0 + a1log d + a2log2d + a3log h + a4log2h
In this equation, a0 = −4.46414, a1 = 2.19479, a2 = −0.12498, a3 = 1.04645, a4 = −0.016848 (for fir); a0 = −4.18161, a1 = 2.08131, a2 = −0.11819, a3 = 0.70119, a4 = 0.148181 (for spruce); and a0 = −4.11122, a1 = 1.30216, a2 = 0.23636, a3 = 1.26562, a4 = −0.079661 (for beech).
To determine the stand structure dynamics, we used the complete inventories made in the management unit during previous studies (e.g., from 1962 and 1972 for the beech and mixed beech–coniferous formations, and from 2012–2020 for the other forest formations). For the stand structure dynamics, we took 1972 as the reference year for which we had data and, to ensure representativeness, we filled this in with information from the forest management plans. The dynamics of the stands were characterized by the evolution of the biophysical characteristics of the main stand, and stand stability was evaluated in terms of resilience to the actions of disturbance factors as a result of applied management [41]. Among the parameters used were stand composition, stand vertical structure, the mean-tree dimensions, the variation in standing tree shape, and the slenderness index.
For the forest dynamics, we took as the reference the most distant year, 1962, for which we had data regarding stand composition and seedlings in the key area. We introduced other years (1982, 1992, 2002) into the analysis for which we had information (growing stock indicators, harvested volume, stand composition, seedlings) only from the management plans. Knowing these variables made it possible to calculate the Shannon index and determine the correlations between them. Since the greatest changes were registered at the level of the mixed beech–coniferous formations, we also determined the dynamics at that level. The forest dynamics were characterized by an evolution in some of the indicators for growing stock and by composition. For the year 2020, we used forest composition, stand density, and field-measured seedlings. For 1962, we used measurement data taken in this year (see Supplementary Materials Table S1), which was completed using management-plan data corresponding to 1962. The same was the case for 1972 and 2002.
To determine the composition at the level of 2070, we considered two approaches. The first was based on computing the Manhattan distances [42] from 22 standardized World Climate [43] datasets for the past 50 years (i.e., monthly average minimum temperature, monthly average maximum temperature, monthly total precipitation, annual mean temperature, mean diurnal range, isothermality, temperature seasonality, maximum temperature of the warmest month, minimum temperature of the coldest month, temperature annual range, mean temperature of the wettest quarter, mean temperature of the driest quarter, mean temperature of the warmest quarter, mean temperature of the coldest quarter, annual precipitation, precipitation of the wettest month, precipitation of the driest month, precipitation seasonality, precipitation of the wettest quarter, precipitation of the driest quarter, precipitation of the warmest quarter, and precipitation of the coldest quarter) [44]. Together with per-species relative abundance maps, this allowed us to identify plots with present climatic conditions that were similar to those resulting from the HadGEM2 climate model [45] run using the RCP 8.5 scenario [46]. Following several iterations for each of the identified species, individual plot compositions were described in the form of normalized averages, weighted with the relative abundances of the seedlings. The second option considered the correlation between the target composition and the regeneration cuttings projected through the management plan (starting from 2015) in exploitable stands over the next 50 years. Application of the first approach is only possible with frequent deviations from the management plan due to the action of destabilizing factors. If no disturbances occur and the provisions of the management plan are observed, then the second approach remains valid (see Supplementary Materials Table S4) for a check on the accuracy of the target composition).
The relationships between the analyzed variables in the study were highlighted by multiple regression. However, the lack of strong correlations between all the variables that had a role in establishing the forest goal composition did not allow for the development of a model with a high predictive capacity. At the stand level, the model parameters were significant (p-value < 0.05) (see Supplementary Materials Table S3).
3. Results
3.1. Stand Structure
Analysis of the stand structure for the period 1962–2020 highlighted a series of changes at the level of the dendrometric characteristics of the trees and at the stand level.
The composition of the stands was the most dynamic element. The change in composition was notable in all forest formations. In pure beech stands (Figure 2a), fir tended to penetrate under their canopy. Mixed beech–coniferous formations showed a high regeneration capacity (Figure 2 and Table 4). The seedlings of these two species were found in different proportions, and frequently in numbers of around 1–3 seedlings per m2. Under the canopy (Figure 2a), and especially in the gaps opened by silvicultural interventions, in the last 50 years, an abundant and vigorous youth had developed (Figure 2b).
In the studied area, beech–oak stands were found only on sunny slopes, at altitudes of 700–750 m. In such mixtures, sessile oak remained the disadvantaged species. In these mixtures, the beech had settled easily under the massif and achieved an abundant youth (see Supplement Materials (Table S2), S33). At the composition level, the correlation between the area occupied by seedlings and the stand density was significant. There was also a relationship between the proportion of seedling species and the species proportions in the current composition. There was no statistical link to demonstrate a preference of fir seedlings for the beech canopy or vice versa, although such situations were observed in the stands. Instead, an increase in the proportion of spruce seedlings with altitude was statistically demonstrated.
The relationship between the mean diameters determined at different times in the development of the stands can be expressed by a straight line (Figure 3). For example, for fir species, 50 years ago (i.e., at the level of 1972), this line indicates a mean diameter of 35.8 cm, compared to 50 cm for the stands in 2020 (Figure 3a). At the same site, the diameter line indicates a 9% increase in diameter in beech (Figure 3c) compared to fir. The relationship with height can also be expressed by a straight line (Figure 3d).
The slenderness index indicated values between 40 and 100 (Figure 4). For this, however, the coefficient of variation was between 14 and 16%. As the stands developed, they became more stable against wind action.
The slenderness index for the mean diameter of the same stand has almost the same value, despite the year in which it was calculated (e.g., 1972 or 2020) (Figure 5a).
The form factor has curves that decrease with age, whilst the curves show the same decreasing tendency in relation to diameter (Figure 5b).
Significant correlations were observed between age, mean stand diameter (i.e., the quadratic mean diameter), and the slenderness index or form factor (see Supplementary Materials Table S3).
Deadwood, at the level of 2020 in the mixed beech–coniferous and pine stands, had an average volume of around 24 m3 ha−1—l7 m3 on the ground and 7 m3 standing volume. The inventory of areas from 2012 showed that, in the examined area, between 2012 and 2019, dead trees accounted for 15% in pine stands and 30% in mixed beech–coniferous stands located in the upper parts of sunny slopes. In the other forest formations, the annual percentage of dead trees was maintained at between 1 and 2%, on average.
3.2. Changes in the Forest Growing Stock
The changes registered at the level of the forest resulted from the evolution of the structure of the stands, as highlighted by an analysis of the main indicators that characterized the growing stock fund (Table 5). Through such interventions, at the level of the period 2005–2016, a volume even greater than the yield production (i.e., annual allowable cut) established by the forest management plans was extracted (Figure 6a). The consequences were the postponement of pruning in the planned stands and ageing of the stands. Thus, by 2020, more than 50% of the stands were over 100 years old.
The silvicultural interventions carried out in the stands were favorable to biodiversity, which reached its highest level in two decades (after 2002) (Figure 6b). Significant correlations were observed between the CAI and the average age of the stands, or between the Shannon index and the stand density.
3.3. Forest Composition Dynamics
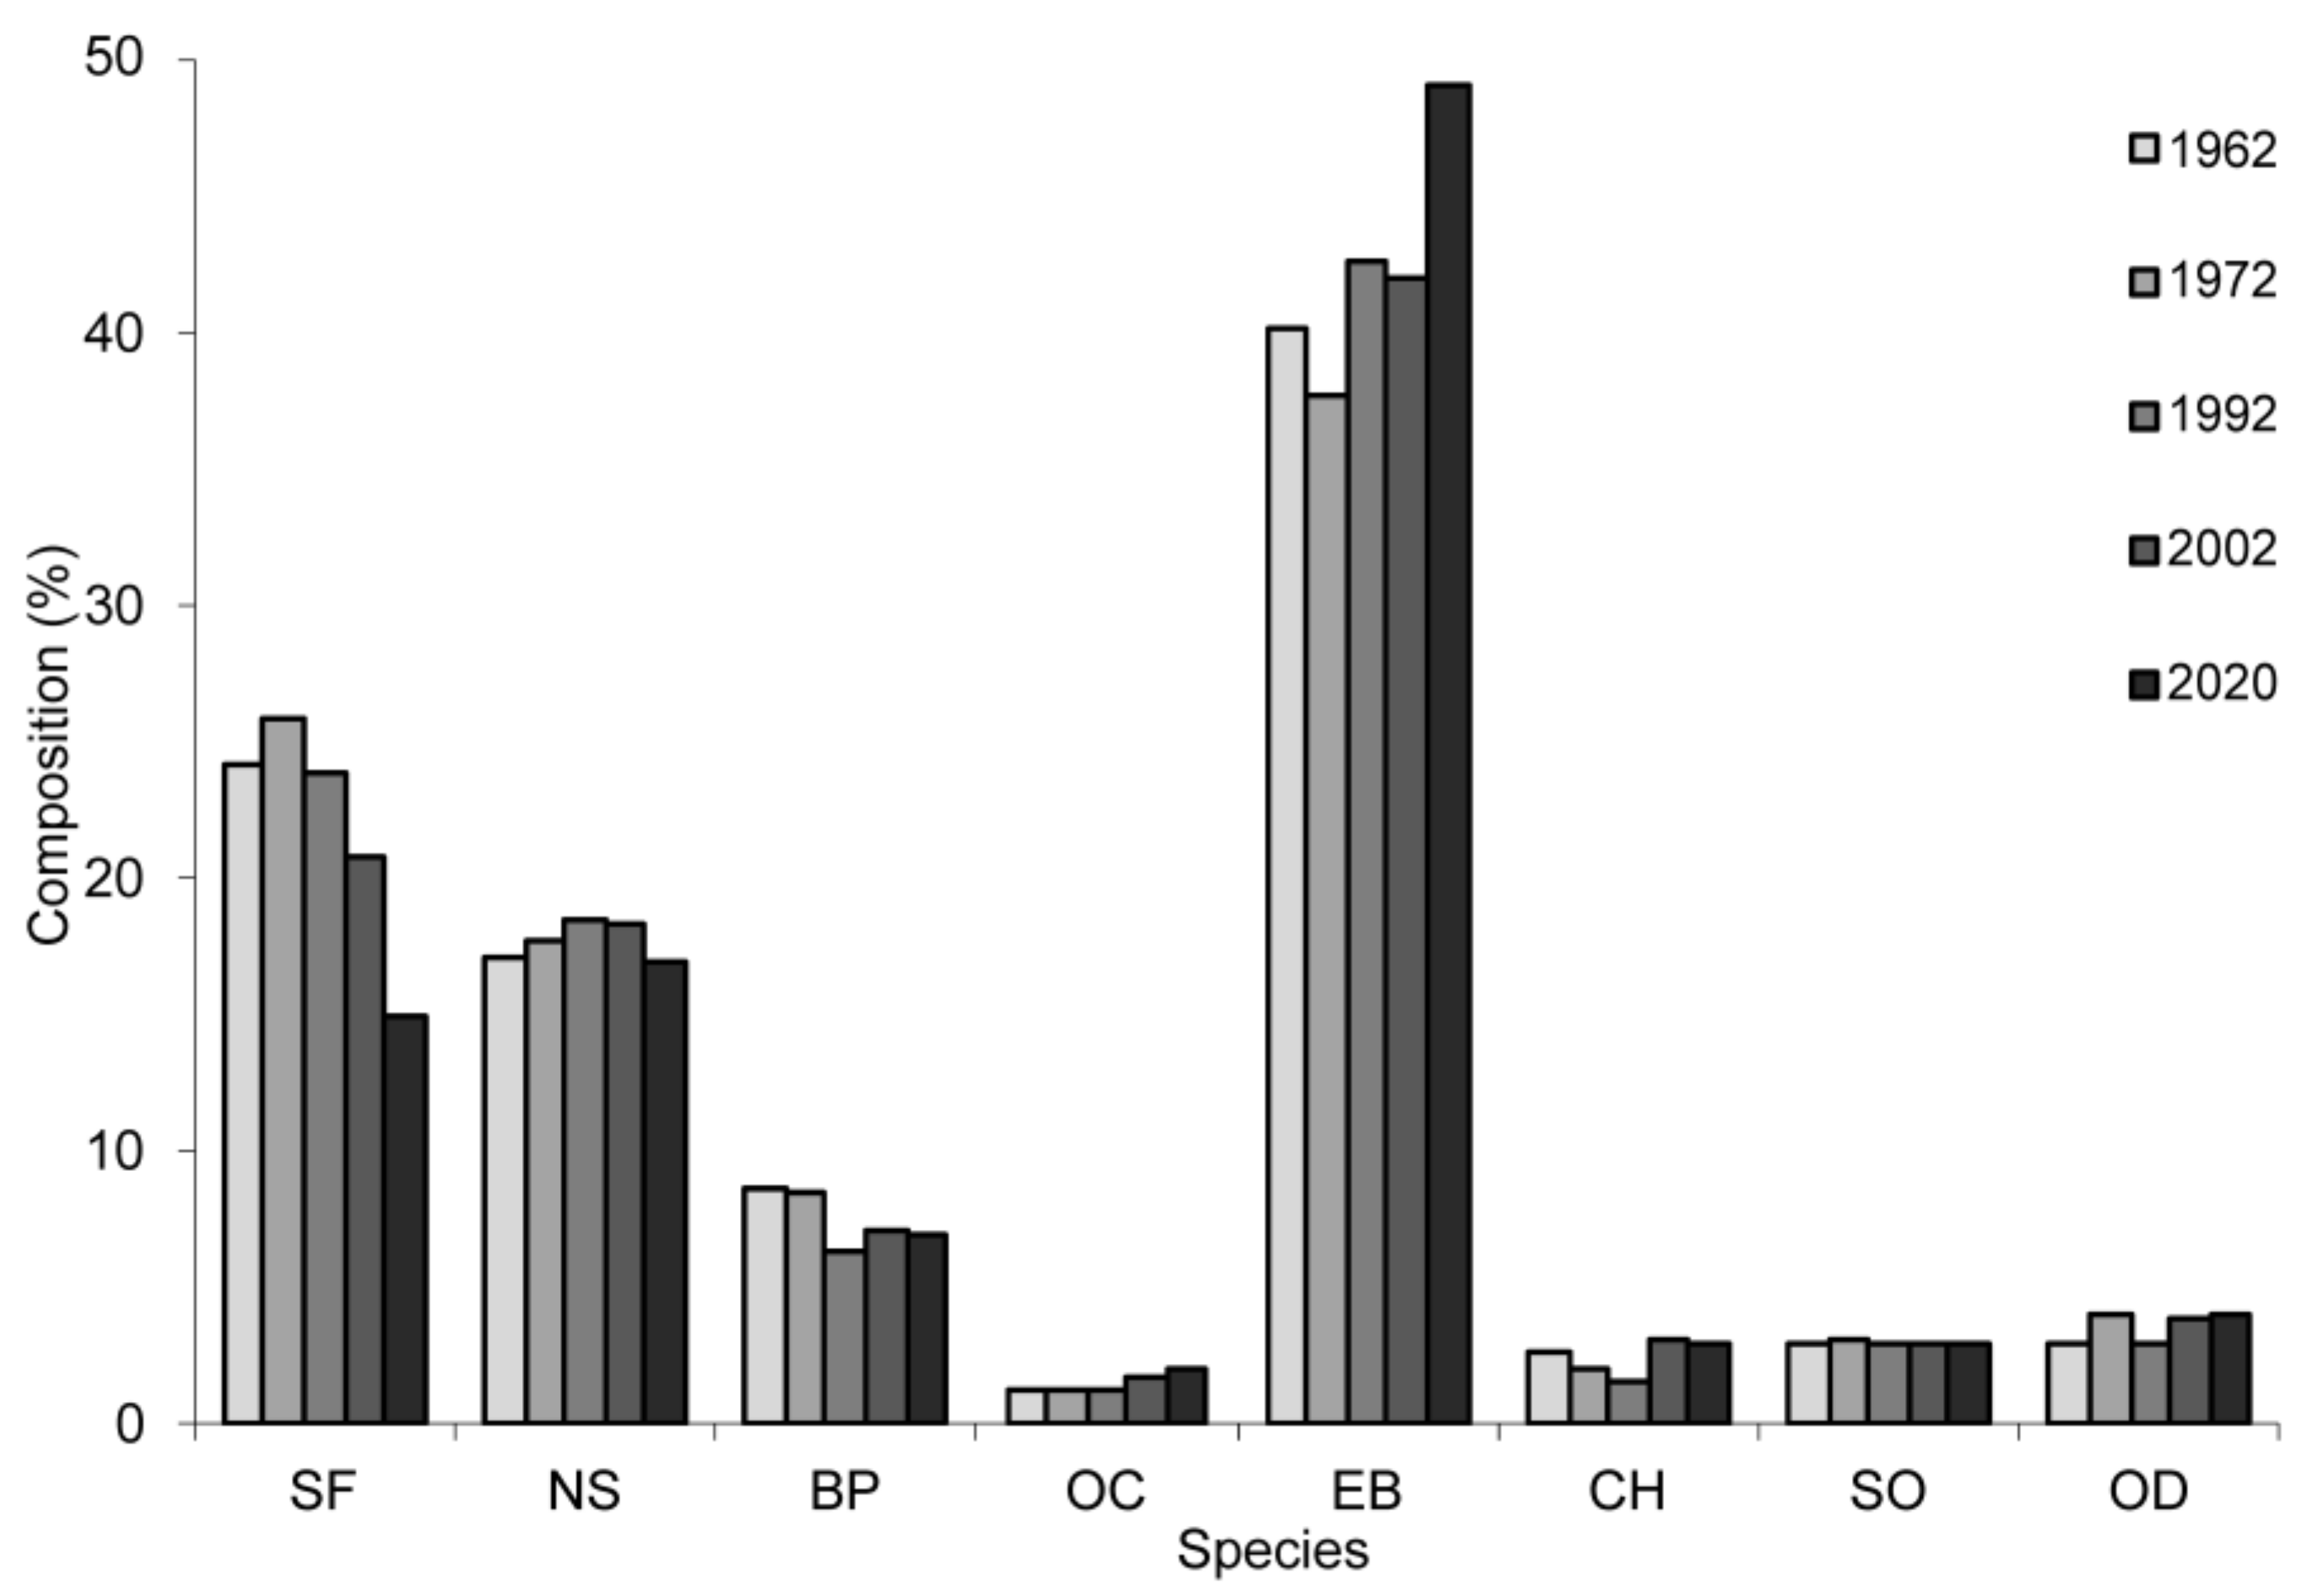
When compared to 1962, the more recent composition of the forest has changed, especially in terms of fir and beech; for example, compared to the target composition forecast for 1962, in 2020, fir had the biggest deficit—21% (Figure 7).
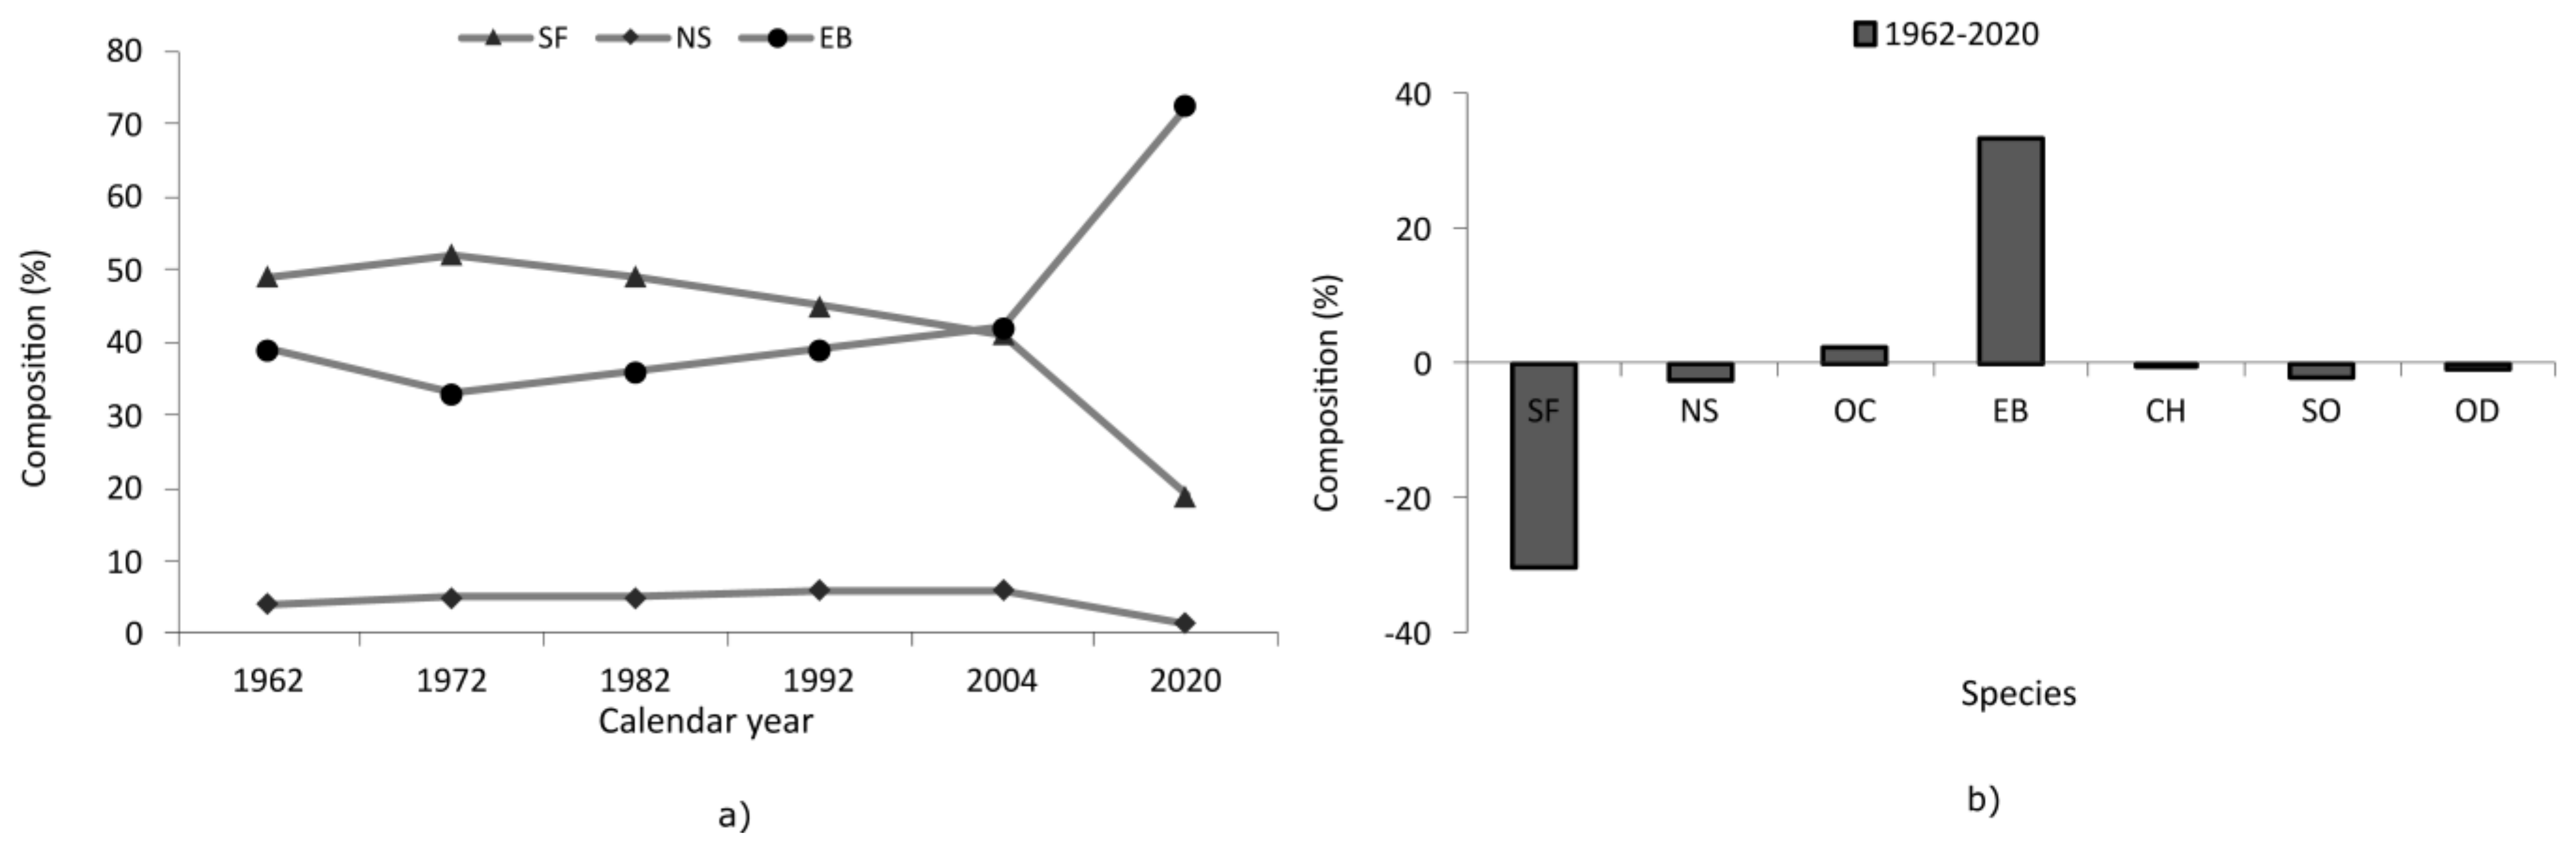
Major changes were recorded for mixed beech–coniferous stands, with beech increasing its proportion in areas where mixtures were concentrated. In such mixtures, fir was reduced in area from 49% in 1962 to 19% in 2020 (Figure 8a). From this study, we found that, after 1962 and up to 2020, beech registered an increase of 33% by area, while fir was reduced by 30% and spruce by 3% (Figure 8b).
3.4. Establishing the Future Forest Composition
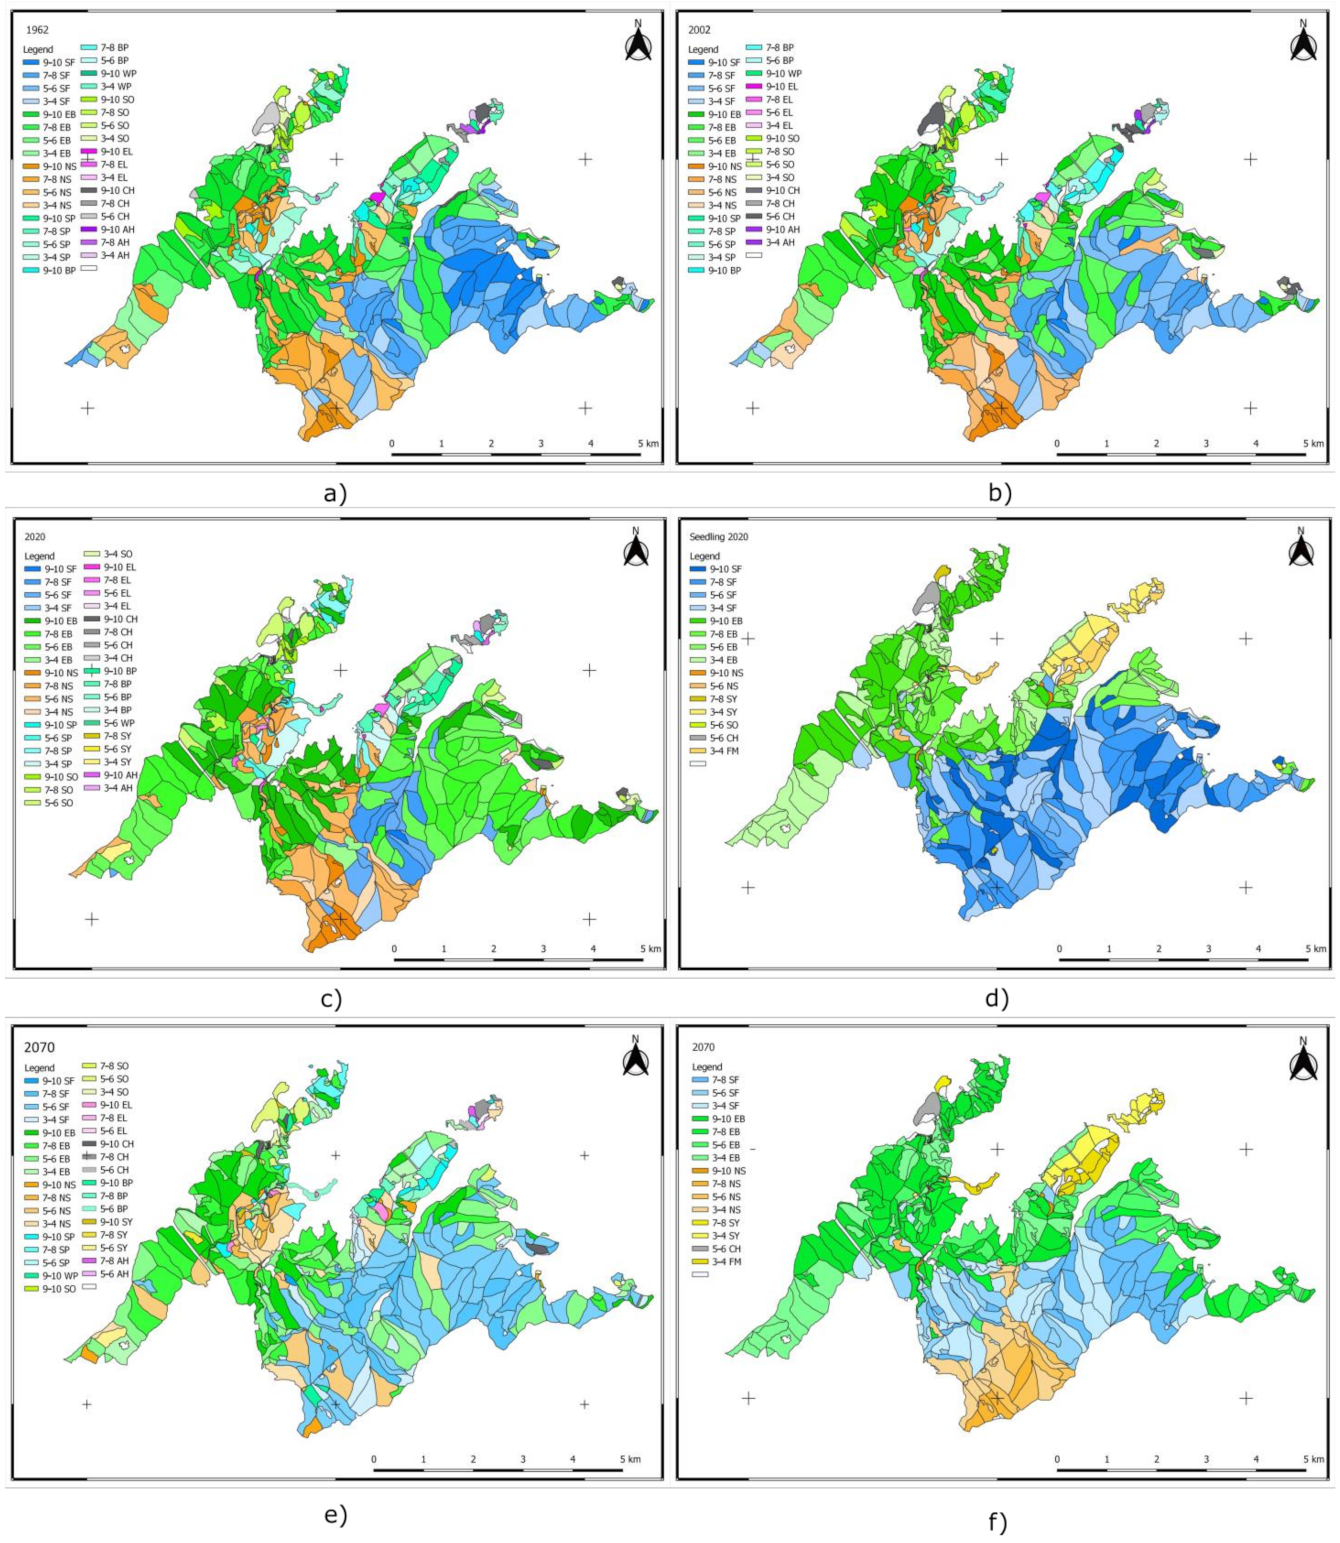
The target composition at the level of 2070 indicates a change in the proportions of the species compared to those existing at the levels of 1962, 2002, and 2020. We generated maps illustrating the spread of species between 1962 and 2020, and for 2070 (Figure 9).
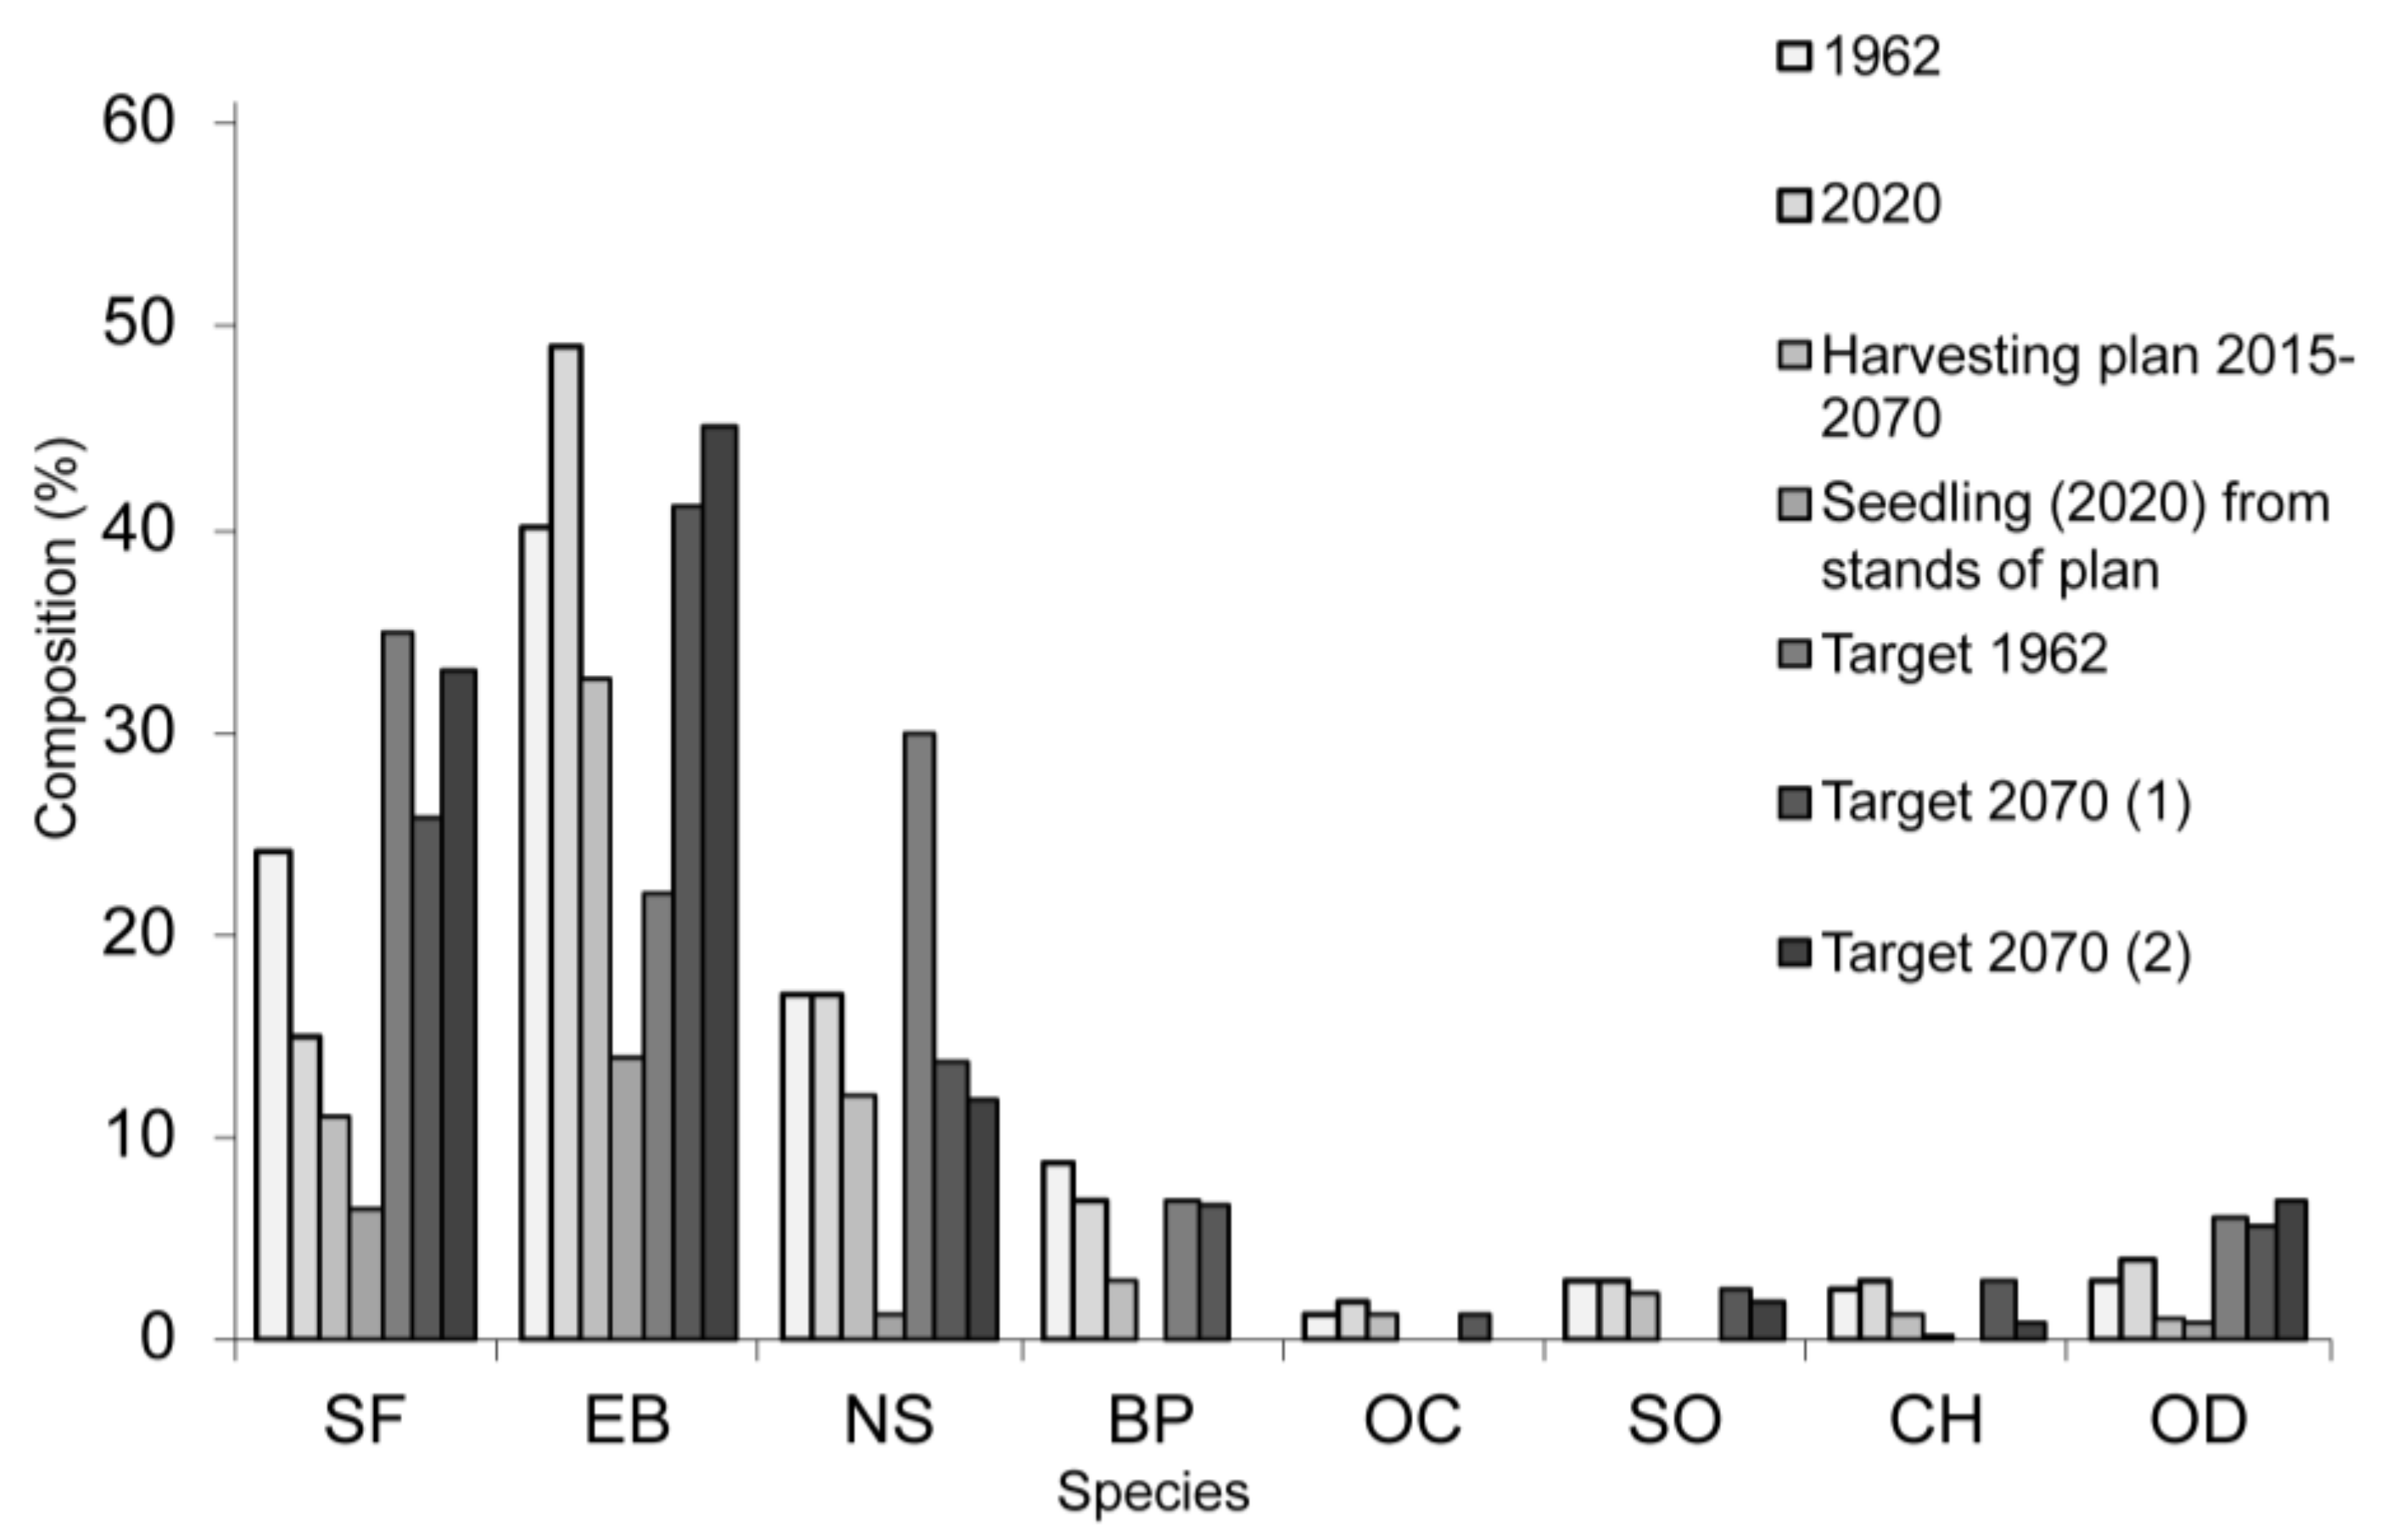
In 2070, the proportion of fir is expected to increase by 18%. Pine, most of which is now 90–120 years old, will be replaced by native species, and spruce will reduce its proportion by 5%. Sessile oak will maintain its proportion, increasing the proportion of deciduous species by 3%, to the detriment of beech (Figure 10).
To check the accuracy of the target composition, we took into account the stand composition that will be covered with regeneration cuttings ((b) in Supplementary Materials Table S4) and the composition of the existing seedlings ((c) in Supplementary Materials Table S4). If the regeneration process proceeds normally, and after implementation of the harvesting plan ((d) in Supplementary Materials Table S4), the current seedlings will retain their proportions ((c) in Supplementary Materials Table S4), and then, in the next 50 years, it may be possible to achieve the target composition ((h) in Supplementary Materials Table S4) by natural regeneration of the stands alone ((g) in Supplementary Materials Table S4). This approach is preferable to planting (f) in Supplementary Materials Table S4).
Without the information regarding the stands in which regeneration cuttings are to be carried out (included in the harvesting regeneration plan), the model of the first approach predicted a composition in which fir had a proportion of 26%, beech 41%, spruce 14%, black pine 7%, other conifers 6%, sessile oak 3%, common hornbeam 2%, and other deciduous 1%. In the second approach, we predicted an increase in the proportion of fir to 33%, beech to 45%, other deciduous to 7%, spruce remaining at 12%, sessile oak at 2%, and common hornbeam at 1%. This outcome would be possible if the harvesting plan established using the forest management plans was applied. In the last 50 years, natural regeneration has occurred on 42% of the management unit area. To achieve the 2070 target composition, we relied on the same percentage (i.e., 42%) for the next 50 years (see Supplementary Materials Table S4). Given that the yield process of the trees will continue to be affected by the action of destabilizing factors that will cause deviations from the management plan, this approach is the most appropriate.
4. Discussion
The stand dynamics indicate changes in the structure as a result of ageing, but also due to the interventions performed. Among spruce, fir, and beech, beech has been the most favored in the last five decades of management. The area occupied by seedlings increased from 23% to 65%, with beech seedlings occupying 42% of the unit area by 2020, and fir seedlings only 22%. Under the canopy, there is a tendency for beech to regenerate under fir, and fir under beech-dominated stands [3,8,28,31,33,47,48].
In mixed beech stands, it is known that the competition between species has a decisive impact on the current stand composition [33,47]. The dynamics of these stands indicate a greater capacity to regenerate sessile oak in stands located in sunny sites where there are no competitive species, such as beech, hornbeam, or maple. Spruce prefers higher altitudes, so in mixed fir–beech stands at altitudes below 1000 m, it is disadvantaged, especially on slopes with south and southwest exposures.
The dynamics of biometric indicators can be useful for understanding the evolution of their values during tree development under real management conditions. The average slenderness index values of the mean trees of the stands indicate high stability in the case of all species. It can also be considered to be an indicator of the functional efficiency of the stands [49,50], given that all the stands in the studied management unit had priority protection functions. Its values statistically correlate with stand age. At the same mean-tree size, the stands showed very close stability values, regardless of the year in which the analysis was performed. The form factor showed a decreasing trend, explained by an increase in tree size.
The forest dynamics highlighted changes in structure and composition. Biometric indicators showed an increase in the average age of the forests, from 64 years in 1962 to 107 years in 2020, and a concomitant reduction in average density from 0.77 to 0.66, which was also reflected in the size of the current increment. The average density had decreased by 38% in 2020 compared to 1962. This reduction in density was a favorable factor for biodiversity, which increased in the forests over the last two decades, reaching a maximum value (1.72) for the analyzed period. It is known that disturbances also have positive effects on stand structure by allowing the installation of a much greater number of species [40,51].
The dynamics of the composition in mixed coniferous–beech stands indicated an increase in the proportion of beech in 2020, by 33%, and a decrease in fir, by 30%, compared to 1962. This situation was favored especially by silvicultural interventions. Beech has increased its proportion in the last two decades as a result of the extraction of the fir; proof, in this sense, being the abundant fir seedlings installed under the massif. To this can be added the influence of destabilizing factors that, in mixed coniferous–beech stands, can influence the composition, most often in favor of beech. Wind action and drying of the trees in the last two decades have disrupted the yield process of the forest. Thus, silvicultural interventions have mainly focused on extracting the wood felled by the winds and the standing deadwood from the stands, outside of the forest management plans. The silvicultural interventions were followed by a reduction in the density of the stands and, implicitly, of the volume CAI (Table 5). The increase in the proportion of beech in mixed beech–fir–spruce stands has been reported for about seven decades [17,28]. This increase is likely due to the conditions generated by climate change [8,31], silvicultural interventions, and natural disturbances [13,33], such as windthrows or insect attacks, all of which have greatly contributed to a decline in spruce [2,23].
Under the conditions of the study area, the advanced age of the trees may have been a factor in favoring an increase in the mortality rate of the trees. This is manifested by a reduced vitality in the trees, which can increase their vulnerability to the actions of biotic factors, such as mistletoe, fungi, or insects. It is known that biotic factors can play an important role in the decline of conifers, and especially fir [3,18,20]. In the studied management unit, most of the trees (66%) were over 100 years old, with 36% being between 120 and 140 years old. Field research has also highlighted the presence of mistletoe in the crowns and “stork nests” of older trees, leading to an increased sensitivity to the action of destabilizing factors.
Applying silvicultural treatments at too-high intensities, in tandem with disturbances of a certain intensity and frequency, can create too-high light intensities in stands, which are not favorable to shade-tolerant species, such as fir [17,20]. Therefore, the application of close-to-nature treatments that adopt sustainable principles for forest management are recommended in the context of climate change [11]. The application of treatments with long regeneration periods leads to the formation of much more stable stands with complex structures [10,13,50]. Treatments with long regeneration periods had been applied in the studied forests, but the increase in the percentage of standing deadwood over the last 20 years has led to unplanned silvicultural interventions. This explains the large volume of wood extracted from the management unit over the last 20 years, which is higher than the established allowable cut. This has led to the postponement of cuttings in the planned stands, and the further ageing of those stands. If older stands are more vulnerable [52], the current situation, in terms of age class, indicates that the forests are at increased risk of further destabilizing factors. The Romanian Technical Instructions set the amount of yield production (i.e., allowable cutting) at the level of growth. As the volume of harvested wood cannot exceed this amount, there will be an accumulation of older trees. Therefore, forest management needs to be much more flexible in order to adapt to these situations.
5. Conclusions
The risks to which forest stands in Romania are exposed highlight the importance of stand structure in maintaining their stability. Forest dynamics indicate important changes in their composition and structure. Seedling composition, area, and vitality are key elements in determining future stand composition. In the studied forests, the area occupied by seedlings has increased from 23% in 1962 to 65% in 2020. In forest composition, major changes have occurred in mixed beech–coniferous stands, including the proportion of fir decreasing by 30%, spruce by 3%, and beech increasing by 33%. We established the target composition based on the compositions of the natural forest types, harmonizing the seedling dynamics with harvesting plan provisions, against the background of a 50-year simulated climatic scenario. Thus, for the established target composition, we expect an increase in the proportion of fir by 18%, of various deciduous species by 3%, a decrease in beech by 4%, and spruce by 5%. Management of the risks to which the forest is exposed may be achieved through a flexible plan that can adapt to unforeseen situations. Such situations should not prevent the timely application of silvicultural works in stands, however. Under the conditions of mixed beech–fir formations, maintaining the species in proportions that correspond to natural forest types, and allowing the natural regeneration of local species and the realization of stands comprising several generations of trees can all contribute to an increase in stand stability. Such measures should be integrated into the strategies used to adapt the provisions of forest management plans.
Supplementary Materials
The following are available online at https://www.mdpi.com/article/10.3390/f12060783/s1. Table S1: Research areas, Table S2: Stands structure. Dendrometric characteristics of the stands inventoried, Table S3: Statistical analysis, Table S4: Composition analysis summary.
Author Contributions
Conceptualization, G.-M.T.; data curation, G.-M.T., A.C., M.B. and A.-C.D.; investigation, G.-M.T., A.C., M.B., A.-C.D. and I.-S.P.; methodology, G.-M.T.; validation, G.-M.T. and A.C.; writing—original draft, G.-M.T.; writing—review and editing, G.-M.T., M.B., A.-C.D. and I.-S.P. All authors have read and agreed to the published version of the manuscript.
Funding
This research received no external funding.
Data Availability Statement
Not applicable.
Acknowledgments
The authors thank RPLP Kronstadt for allowing access to the forest database.
Conflicts of Interest
The authors declare no conflict of interest.
References
- Hanson, J.J.; Lorimer, C.G.; Halpin, C.R.; Palik, B.J. Ecological forestry in an uneven-aged, late-successional forest: Simulated effects of contrasting treatments on structure and yield. For. Ecol. Manag. 2012, 270, 94–107. [Google Scholar] [CrossRef]
- Gratzer, G.; Canham, C.; Dieckmann, U.; Fischer, A.; Iwasa, Y.; Law, R.; Lexer, M.J.; Sandmann, H.; Spies, T.A.; Splechtna, B.E.; et al. Spatio-temporal development of forests—current trends in field methods and models. Oikos 2004, 107, 3–15. [Google Scholar] [CrossRef] [Green Version]
- Klopčič, M.; Mina, M.; Bugmann, H.; Bončina, A. The prospects of silver fir (Abies alba Mill.) and Norway spruce (Picea abies (L.) Karst) in mixed mountain forests under various management strategies, climate change and high browsing pressure. Eur. J. For. Res. 2017, 136, 1071–1090. [Google Scholar] [CrossRef]
- Pukkala, T.; Lähde, E.; Laiho, O. Growth and yield models for uneven-sized forest stands in Finland. For. Ecol. Manag. 2009, 258, 207–216. [Google Scholar] [CrossRef]
- Munteanu, C.; Nita, M.D.; Abrudan, I.V.; Radeloff, V.C. Historical forest management in Romania is imposing strong legacies on contemporary forests and their management. For. Ecol. Manag. 2016, 361, 179–193. [Google Scholar] [CrossRef]
- Čavlović, J.; Božić, M.; Boncina, A. Stand structure of an uneven-aged fir-beech forest with an irregular diameter structure: Modeling the development of the Belevine forest, Croatia. Eur. J. For. Res. 2006, 125, 325–333. [Google Scholar] [CrossRef]
- Mina, M.; Bugmann, H.; Klopcic, M.; Cailleret, M. Accurate modeling of harvesting is key for projecting future forest dynamics: A case study in the Slovenian mountains. Reg. Environ. Chang. 2017, 17, 49–64. [Google Scholar] [CrossRef]
- Mina, M.; Bugmann, H.; Cordonnier, T.; Irauschek, F.; Klopcic, M.; Pardos, M.; Cailleret, M. Future ecosystem services from European mountain forests under climate change. J. Appl. Ecol. 2017, 54, 389–401. [Google Scholar] [CrossRef]
- Szwagrzyk, J.; Gazda, A. Above-ground standing biomass and tree species diversity in natural stands of Central Europe. J. Veg. Sci. 2007, 18, 555–562. [Google Scholar] [CrossRef]
- Boncina, A. History, current status and future prospects of uneven-aged forest management in the Dinaric region: An overview. Forestry 2011, 84, 467–478. [Google Scholar] [CrossRef]
- Brang, P.; Spathelf, P.; Larsen, J.B.; Bauhus, J.; Boncčìna, A.; Chauvin, C.; Drössler, L.; Güemes, C.G.; Heiri, C.; Kerr, G.; et al. Suitability of close-to-nature silviculture for adapting temperate European forests to climate change. Forestry 2014, 87, 492–503. [Google Scholar] [CrossRef] [Green Version]
- Curovic, M.; Stijovic, A.; Spalevic, V.; Dudic, B.; Pajic, M. Structural characteristics of the mixed spruce-fir-beech forests on Mountain Bjelasica in Montenegro. Not. Bot. Horti Agrobot. Cluj Napoca 2020, 48, 1699–1708. [Google Scholar] [CrossRef]
- Hilmers, T.; Biber, P.; Knoke, T.; Pretzsch, H. Assessing transformation scenarios from pure Norway spruce to mixed uneven-aged forests in mountain areas. Eur. J. For. Res. 2020, 139, 567–584. [Google Scholar] [CrossRef] [Green Version]
- Pretzsch, H.; Hilmers, T.; Biber, P.; Avdagić, A.; Binder, F.; Bončina, A.; Bosela, M.; Dobor, L.; Forrester, D.I.; Levesque, M.; et al. Evidence of elevation-specific growth changes of spruce, fir, and beech in European mixed mountain forests during the last three centuries. Can. J. For. Res. 2020, 50, 689–703. [Google Scholar] [CrossRef]
- Remes, J. Transformation of even-aged spruce stands at the School Forest Enterprise Kostelec nad Černými lesy: Structure and final cutting of mature stand. J. For. Sci. 2006, 52, 158–171. [Google Scholar] [CrossRef] [Green Version]
- Szewczyk, J.; Szwagrzyk, J.; Muter, E. Tree growth and disturbance dynamics in old-growth subalpine spruce forests of the Western Carpathians. Can. J. For. Res. 2011, 41, 938–944. [Google Scholar] [CrossRef]
- Diaci, J.; Rozenbergar, D.; Anić, I.; Mikac, S.; Saniga, M.; Kucbel, S.; Višnjić, Ć.; Ballian, D. Structural dynamics and synchronous silver fir decline in mixed old-growth mountain forests in Eastern and Southeastern Europe. Forestry 2011, 84, 479–491. [Google Scholar] [CrossRef] [Green Version]
- Ficko, A.; Poljanec, A.; Boncina, A. Do changes in spatial distribution, structure and abundance of silver fir (Abies alba Mill.) indicate its decline? For. Ecol. Manag. 2011, 261, 844–854. [Google Scholar] [CrossRef]
- Van Der Maaten-Theunissen, M.; Kahle, H.-P.; Van Der Maaten, E. Drought sensitivity of Norway spruce is higher than that of silver fir along an altitudinal gradient in southwestern Germany. Ann. For. Sci. 2013, 70, 185–193. [Google Scholar] [CrossRef] [Green Version]
- Čavlović, J.; Bončina, A.; Božić, M.; Goršić, E.; Simončič, T.; Teslak, K. Depression and growth recovery of silver fir in uneven-aged Dinaric forests in Croatia from 1901 to 2001. Forestry 2015, 88, 586–598. [Google Scholar] [CrossRef] [Green Version]
- Löf, M.; Madsen, P.; Metslaid, M.; Witzell, J.; Jacobs, D.F. Restoring forests: Regeneration and ecosystem function for the future. New For. 2019, 50, 139–151. [Google Scholar] [CrossRef] [Green Version]
- Tudoran, G.M.; Zotta, M. Adapting the planning and management of Norway spruce forests in mountain areas of Romania to environmental conditions including climate change. Sci. Total Environ. 2020, 698, 133761. [Google Scholar] [CrossRef]
- Hanewinkel, M.; Cullmann, D.A.; Schelhaas, M.-J.; Nabuurs, G.-J.; Zimmermann, N.E. Climate change may cause severe loss in the economic value of European forest land. Nat. Clim. Chang. 2013, 3, 203–207. [Google Scholar] [CrossRef]
- Seidl, R.; Thom, D.; Kautz, M.; Martin-Benito, D.; Peltoniemi, M.; Vacchiano, G.; Wild, J.; Ascoli, D.; Petr, M.; Honkaniemi, J.; et al. Forest disturbances under climate change. Nat. Clim. Chang. 2017, 7, 395–402. [Google Scholar] [CrossRef] [Green Version]
- Dănescu, A.; Kohnle, U.; Bauhus, J.; Weiskittel, A.; Albrecht, A.T. Long-term development of natural regeneration in irregular, mixed stands of silver fir and Norway spruce. For. Ecol. Manag. 2018, 430, 105–116. [Google Scholar] [CrossRef]
- Pretzsch, H.; Grote, R.; Reineking, B.; Rotzer, T.; Seifert, S. Models for Forest Ecosystem Management: A European Perspective. Ann. Bot. 2008, 101, 1065–1087. [Google Scholar] [CrossRef]
- Nogueira, D.S.; Marimon, B.S.; Marimon-Junior, B.H.; Oliveira, E.A.; Morandi, P.; Reis, S.M.; Elias, F.; Neves, E.C.; Feldpausch, T.R.; Lloyd, J.; et al. Impacts of Fire on Forest Biomass Dynamics at the Southern Amazon Edge. Environ. Conserv. 2019, 46, 285–292. [Google Scholar] [CrossRef] [Green Version]
- Vrška, T.; Adam, D.; Hort, L.; Kolář, T.; Janík, D. European beech (Fagus sylvatica L.) and silver fir (Abies alba Mill.) rotation in the Carpathians—A developmental cycle or a linear trend induced by man? For. Ecol. Manag. 2009, 258, 347–356. [Google Scholar] [CrossRef]
- Holeksa, J.; Jaloviar, P.; Kucbel, S.; Saniga, M.; Svoboda, M.; Szewczyk, J.; Szwagrzyk, J.; Zielonka, T.; Żywiec, M. Models of disturbance driven dynamics in the West Carpathian spruce forests. For. Ecol. Manag. 2017, 388, 79–89. [Google Scholar] [CrossRef]
- Bodziarczyk, J.; Szwagrzyk, J.; Zwijacz-Kozica, T.; Zięba, A.; Szewczyk, J.; Gazda, A. The structure of forest stands in the Tatra National Park: The results of 2016–2017 inventory. Sciedo 2019, 80, 13–21. [Google Scholar] [CrossRef] [Green Version]
- Maxime, C.; Hendrik, D. Effects of climate on diameter growth of co-occurring Fagus sylvatica and Abies alba along an altitudinal gradient. Trees 2011, 25, 265–276. [Google Scholar] [CrossRef]
- Szewczyk, J.; Szwagrzyk, J. Spatial and temporal variability of natural regeneration in a temperate old-growth forest. Ann. For. Sci. 2010, 67, 202. [Google Scholar] [CrossRef]
- Klopcic, M.; Boncina, A. Stand dynamics of silver fir (Abies alba Mill.)-European beech (Fagus sylvatica L.) forests during the past century: A decline of silver fir? Forestry 2011, 84, 259–271. [Google Scholar] [CrossRef] [Green Version]
- Bottalico, F.; Travaglini, D.; Fiorentini, S.; Lisa, C.; Nocentini, S. Stand dynamics and natural regeneration in silver fir (Abies alba Mill.) plantations after traditional rotation age. iForest Biogeosci. For. 2014, 7, 313–323. [Google Scholar] [CrossRef] [Green Version]
- Cailleret, M.; Heurich, M.; Bugmann, H. Reduction in browsing intensity may not compensate climate change effects on tree species composition in the Bavarian Forest National Park. For. Ecol. Manag. 2014, 328, 179–192. [Google Scholar] [CrossRef]
- Elling, W.; Dittmar, C.; Pfaffelmoser, K.; Rötzer, T. Dendroecological assessment of the complex causes of decline and recovery of the growth of silver fir (Abies alba Mill.) in Southern Germany. For. Ecol. Manag. 2009, 257, 1175–1187. [Google Scholar] [CrossRef]
- Szwagrzyk, J.; Szewczyk, J. Tree mortality and effects of release from competition in an old-growth Fagus-Abies-Picea stand. J. Veg. Sci. 2001, 12, 621–626. [Google Scholar] [CrossRef]
- Szewczyk, J.; Szwagrzyk, J. Tree regeneration on rotten wood and on soil in old-growth stand. Vegetatio 1996, 122, 37–46. [Google Scholar] [CrossRef]
- Spînu, A.P.; Petrițan, I.C.; Mikoláš, M.; Janda, P.; Vostarek, O.; Čada, V.; Svoboda, M. Moderate- to High-Severity Disturbances Shaped the Structure of Primary Picea Abies (L.) Karst. Forest in the Southern Carpathians. Forests 2020, 11, 1315. [Google Scholar] [CrossRef]
- Thom, D.; Rammer, W.; Dirnböck, T.; Müller, J.; Kobler, J.; Katzensteiner, K.; Helm, N.; Seidl, R. The impacts of climate change and disturbance on spatio-temporal trajectories of biodiversity in a temperate forest landscape. J. Appl. Ecol. 2016, 54, 28–38. [Google Scholar] [CrossRef]
- Larsen, J.B. Ecological stability of forests and sustainable silviculture. For. Ecol. Manag. 1995, 73, 85–96. [Google Scholar] [CrossRef]
- Black, P. Dictionary of Algorithms and Data Structures. 2006. Available online: https://xlinux.nist.gov (accessed on 15 March 2021).
- Fick, S.E.; Hijmans, R.J. WorldClim 2: New 1-km spatial resolution climate surfaces for global land areas. Int. J. Climatol. 2017, 37, 4302–4315. [Google Scholar] [CrossRef]
- Buras, A.; Menzel, A. Projecting Tree Species Composition Changes of European Forests for 2061–2090 Under RCP 4.5 and RCP 8.5 Scenarios. Front. Plant Sci. 2019, 9, 1986. [Google Scholar] [CrossRef] [PubMed] [Green Version]
- Samadi, S.Z.; Sagareswar, G.; Tajiki, M. Comparison of General Circulation Models: Methodology for selecting the best GCM in Kermanshah Synoptic Station, Iran. Int. J. Glob. Warm. 2010, 2, 347. [Google Scholar] [CrossRef]
- Riahi, K.; Rao, V.; Krey, C.; Cho, V.; Chirkov, G.; Chirkov, V.; Fischer, G.; Kindermann, G.; Nakicenovic, N.; Rafaj, P. Fischer The Shared Socioeconomic Pathways and their energy, land use, and greenhouse gas emissions implications: An overview. Glob. Environ. Chang. 2011. [Google Scholar] [CrossRef] [Green Version]
- Woziwoda, B.; Kopeć, D. Changes in the silver fir forest vegetation 50 years after cessation of active management. Acta Soc. Bot. Pol. 2015, 84, 177–187. [Google Scholar] [CrossRef] [Green Version]
- Pretzsch, H.; Hilmers, T.; Uhl, E.; Bielak, K.; Bosela, M.; del Rio, M.; Dobor, L.; Forrester, D.I.; Nagel, T.A.; Pach, M.; et al. European beech stem diameter grows better in mixed than in mono-specific stands at the edge of its distribution in mountain forests. Eur. J. For. Res. 2020, 140, 127–145. [Google Scholar] [CrossRef]
- Mihai, R.G.; Mihăilă, V.V.; Cicşa, A.; Dobre, A.C.; Tudoran, G.M. Features of the structure of sessile-oak stands located at the superior range border. In Proceedings of the Biennial International Symposium, Forest and Sustainable Development, Brașov, Romania, 7–8 October 2016. [Google Scholar]
- Cicşa, A.; Tudoran, G.M.; Dobre, A.C.; Mihăilă, V.V.; Mihai, R.G.; Mărgălinescu, A.M.; Farcaș, C.Ș.; Comaniță, I.; Boroeanu, M. Structure models for beech-conifers stands with protective functions. In Proceedings of the Biennial International Symposium, Forest and Sustainable Development, Brașov, Romania, 25–27 October 2018. [Google Scholar]
- Franklin, J.F.; Spies, T.A.; Van Pelt, R.; Carey, A.B.; Thornburgh, D.A.; Berg, D.R.; Lindenmayer, D.B.; Harmon, M.E.; Keeton, W.S.; Shaw, D.C.; et al. Disturbances and structural development of natural forest ecosystems with silvicultural implications, using Douglas-fir forests as an example. For. Ecol. Manag. 2002, 155, 399–423. [Google Scholar] [CrossRef]
- Lech, P.; Żółciak, A.; Hildebrand, R. Occurrence of European Mistletoe (Viscum album L.) on Forest Trees in Poland and Its Dynamics of Spread in the Period 2008–2018. Forests 2020, 11, 83. [Google Scholar] [CrossRef] [Green Version]
Figure 1.
Location of the forest management unit.

Figure 2.
Frequency distributions of tree diameter in beech (a) and mixed fir–beech (b) stands over the last several decades (1962/1972–2020). EB—European beech, SF—silver fir, and SY—sycamore. In the pure beech stand (a), 50 years ago, in the sample area, there were only two fir trees with diameters of 2 cm. Now, those trees have diameters of 16 and 18 cm and a second fir floor is already developing in the stand. In the fir–beech stand (b), over 50 years, a vigorous stand of fir and beech (around 50,000 seedlings per hectare) have been installed. The data are from the complete inventory performed on 0.25 ha (for the stand in Figure 2a) and on 1.0 ha (for the stand in Figure 2b). See Supplementary Material (Tables S1 and S2), S27 and S28.

Figure 3.
Relationship between the mean diameters (i.e., quadratic mean diameters) of the stands in 1972 and 2020 in high- (a) and medium-productivity (b) fir, and in medium-productivity beech (c) sites, and the relationship between the mean heights (i.e., hg) in those two years in medium-productivity beech sites (d) (SF—silver fir and EB—European beech). Results achieved through processing the data obtained from the plot inventories.

Figure 4.
Variation in the mean-tree slenderness index for fir, beech, and spruce from mixed stands in 2020 in relation to the mean diameter of the stands (a) and their ages (b). The diameter and height of the mean-basal-area tree were used in the calculations (SF—silver fir, EB—European beech, and NS—Norway spruce).

Figure 5.
Tendency of the slenderness index of the stands, calculated at the level of 2020 compared to 1972, for fir (a), and variation in the form factor in relation to diameter (i.e., dg) for fir and spruce at the 2020 level (b). The form factor values were deduced from the mean-tree volumes (i.e., from the volume of the mean-basal-area trees) (SF—silver fir, EB—European beech, and NS—Norway spruce).

Figure 6.
Volume of wood from wind damage and deadwood compared to the level of yield production (i.e., annual allowable cut) (a) and the Shannon index values at the unit management level in 1962–2020 (b). For 2020, the Shannon index values came from the composition of the forest as determined by the inventory works. For previous years, the values were determined based on information provided by the forest management plans. The 2015–2020 damaged wood volume was estimated based on data obtained from permanent plot measurements.

Figure 7.
Dynamics of the current composition for 1962–2020 compared to the target composition forecast for 1962 (values extracted from forest management plans). SF—silver fir, NS—Norway spruce, BP—Austrian black pine, OC—other conifers, EB—European beech, CH—common hornbeam, SO—sessile oak, and OD—other deciduous. For 2020, the values came from the composition of the forest determined by inventory. For previous years (i.e., 1962, 1972, 1982, 1992 and 2002), the compositional values came from the management plans.

Figure 8.
Dynamics of spruce, fir, and beech species in mixed beech–coniferous formations between 1962 and 2020 (a), and a comparison between the proportions of species in 2020 compared to 1962 (b). SF—silver fir, NS—Norway spruce, EB—European beech, OC—other conifers, CH—common hornbeam, SO—sessile oak, and OD—other deciduous.

Figure 9.
Species distribution maps (based on the predominant species in each stand) between 1962 and 2020, and at the level of 2070. Forest composition in 1962 (a), 2002 (b), and 2020 (c); seedling composition in 2020 (d); target composition in 2070 (1) (e); and target composition in 2070 (2) (f). SF—silver fir, EB—European beech, NS—Norway spruce, SP—Scots pine, BP—Austrian black pine, WP—white pine, SO—sessile oak, EL—European larch, CH—common hornbeam, AH—European ash, SY—sycamore, and FM—field maple. The figure illustrates: the pronounced change in forest composition between 2002 (b) and 2020 (c); the promotion of seedlings in the composition forecast for 2070 (target composition (1)) based on the chosen climate scenario (e); target composition (2)—promotion of a composition of natural forest types, a reduction in the proportion of spruce in mixtures located at altitudes below 1000 m (maintaining spruce stands through natural regeneration and replacing those planted outside their area), and correlation of the target composition with the harvest regeneration plan for the next 50 years (f).

Figure 10.
Current forest composition and composition in 2070. SF—silver fir, EB—European beech, NS—Norway spruce, BP—Austrian black pine, OC—other conifers (Scots pine and European larch), OD—other deciduous (sycamore, Norway maple, field maple, European ash, manna ash, wych elm, wild cherry, and small-leaved lime), CH—common hornbeam, and SO—sessile oak. The figure shows the target composition at the level of 1962, the composition established at the level of 2020, the composition of the stands to be exploited in the next 50 years (Harvesting plan 2015–2070), the composition of the existing seedlings in the exploitable stands (Seedlings 2020), the target composition designed by the 1962 management plan (Target 1962), and the two variants for the composition in 2070 (Target 2070 (1) and Target 2070 (2)).


Table 1.
Characteristics of the management unit.
| Altitude (m) | 700–800 | 801–1000 | 1001–1200 | 1201–1400 | |||
| Area (%) | 38 | 45 | 13 | 4 | |||
| Exposure | N, NW | S, SW | W, NW, E, SE | ||||
| Area (%) | 14 | 34 | 52 | ||||
| Inclination (degrees) | <16 | 16–30 | 31–40 | ||||
| Area (%) | 6 | 61 | 33 | ||||
| Species | EB | NS | SF | OC | OD | ||
| Area (%) | 49 | 17 | 15 | 10 | 9 | ||
| Age class (20 y) | I | II | III | IV | V | VI | VII |
| Area (%) | 1 | 1 | 7 | 5 | 20 | 30 | 36 |
EB—European beech, NS—Norway spruce, SF—silver fir, OC—other conifers (Austrian black pine, Scots pine, white pine, and European larch), and OD—other deciduous (sycamore, Norway maple, European ash, hornbeam, and sessile oak).
Table 2.
Characteristics of the stand structures in the key area.
| Research Area | Area Sample (ha) | Stand Area (ha) | Species | dg (cm) | hg (m) | G (m2ha−1) | N | d Min (cm) | d Max (cm) | Thousand Seedlings, h ≤ 50 cm | Thousand Saplings, h > 50 cm, d ≤ 1 cm |
|---|---|---|---|---|---|---|---|---|---|---|---|
| S27 | 0.25 | 18.70 | EB | 32.0 | 21.2 | 7.14 | 89 | 11.00 | 54.80 | – | – |
| SF | 17.3 | 10.3 | 0.05 | 2 | 16.50 | 18.50 | – | 0.04 | |||
| S28 | 1 | 6.80 | EB | 49.7 | 38.7 | 51.36 | 364 | 2.65 | 76.95 | 13.4 | 1.1 |
| OD | 4.1 | 5.5 | 0.01 | 6 | 3.15 | 4.75 | 0.01 | – | |||
| S29 | 1 | 8.20 | SF | 44.4 | 29.7 | 17.98 | 345 | 1.30 | 65.55 | 31.8 | 0.2 |
| EB | 34.1 | 28.0 | 15.20 | 640 | 1.70 | 59.25 | 9.7 | 6.1 | |||
| NS | 43.1 | 30.8 | 1.89 | 13 | 33.55 | 58.25 | 0.4 | – | |||
| SY | 4.6 | 5.0 | 0.01 | 7 | 2.00 | 10.35 | 0.06 | – | |||
| S30 | 1 | 5.40 | BP | 32.1 | 18.2 | 30.16 | 373 | 12.55 | 53.10 | – | – |
| DS | 13.9 | 8.3 | 0.87 | 57 | 1.00 | 31.00 | – | 1.8 | |||
| S31 | 0.25 | 16.90 | SF | 38.8 | 27.6 | 7.4 | 64 | 5.4 | 58.4 | 0.02 | – |
| NS | 31.3 | 26.0 | 1.08 | 17 | 17.2 | 43.6 | – | ||||
| EB | 20.2 | 17.1 | 1.4 | 38 | 4.7 | 44.5 | 0.08 | – | |||
| S32 | 0.25 | 7.90 | SF | 51.7 | 32.9 | 8.5 | 40 | 6.2 | 77.6 | 0.09 | – |
| EB | 22.2 | 22.9 | 4.1 | 131 | 3.8 | 48.8 | 0.05 | – | |||
| S33 | 1 | 11.10 | SO | 32.3 | 22.9 | 19.58 | 244 | 6.50 | 51.50 | – | – |
| EB | 25.9 | 14.1 | 11.08 | 210 | 2.30 | 67.50 | 0.06 | – | |||
| CH | 15.4 | 12.3 | 4.92 | 264 | 3.30 | 37.65 | – | – | |||
| OD | 19.3 | 10.0 | 0.32 | 11 | 3.25 | 39.55 | 0.01 | – | |||
| S34 | 1 | 8.20 | SF | 45.0 | 30.1 | 21.14 | 143 | 2.95 | 78.45 | 16.2 | 0.1 |
| NS | 40.4 | 31.6 | 2.18 | 17 | 23.85 | 57.75 | 0.01 | – | |||
| EB | 33.3 | 26.9 | 12.71 | 364 | 1.11 | 67.00 | 7.1 | 1.3 | |||
| SY | 20.9 | 13.2 | 0.03 | 1 | – | 20.85 | – | – | |||
| S35 | 1 | 22.50 | EB | 34.3 | 28.9 | 27.58 | 318 | 5.0 | 66.8 | 0.4 | 0.2 |
| SF | 36.9 | 29.0 | 9.02 | 113 | 4.4 | 58.1 | 1.1 | 0.9 | |||
| NS | 27.1 | 24.2 | 0.74 | 7 | 9.2 | 62.0 | – | – | |||
| S36 | 1 | 5.2 | NS | 43.4 | 32.8 | 52.29 | 353 | 8.30 | 92.60 | 1.5 | – |
| SF | 44.2 | 27.4 | 2.46 | 16 | 19.70 | 67.65 | 0.4 | – | |||
| OC | 19.1 | 16.1 | 1.00 | 39 | 12.00 | 67.10 | – | – | |||
| EB | 39.4 | 24.2 | 4.76 | 35 | 7.60 | 40.85 | 0.2 | – | |||
| SY | 26.9 | 26.0 | 0.40 | 7 | 15.75 | 36.35 | 0.03 | – | |||
| Total | 7.75 | 110.90 | 4328 |
Data obtained through plot inventories from 2010 to 2020. SF—silver fir, EB—European beech, NS—Norway spruce, dg–mean diameter, and hg—mean height.
Table 3.
Forest composition at the mixed beech–coniferous stand level in the key area.
| Composition | SF | EB | NS | SP | OD |
|---|---|---|---|---|---|
| Forest composition 1962 | 77.7 | 18.4 | 3.4 | 0.1 | 0.4 |
| Forest composition 2020 | 31.5 | 61 | 6.3 | 0.1 | 1.1 |
| Seedling composition 2020 | 44.9 | 52.7 | 0.5 | – | 1.9 |
Data obtained through plot inventories. SF—silver fir, EB—European beech, NS—Norway spruce, SP—Scots pine, and OD—other deciduous.
Table 4.
Structural characteristics of two fully inventoried plots.
| Research Area | S27 First Inventory: 1962 Last Inventory: 2020 | S29 First Inventory: 1972 Last Inventory: 2020 | |||||||
|---|---|---|---|---|---|---|---|---|---|
| Species | EB | SF | Total | SF | EB | NS | SY | Total | |
| dg (cm): Last inventory (2020) First inventory | 32.0 10.3 | 17.3 2 | - | 44.4 30.2 | 34.1 22.0 | 43.1 32 | 4.6 | - | |
| hg (m): Last inventory (2020) First inventory | 21.2 13.8 | 10.3 3.0 | - | 29.7 23.0 | 28.0 22.0 | 30.8 24 | 5.0 | - | |
| G (m2ha−1) | 28.6 | 0.19 | 28.8 | 17.98 | 15.20 | 1.89 | 0.01 | 35.1 | |
| Number of trees per hectare | 356 | 8 | 364 | 345 | 640 | 13 | 7 | 1005 | |
| V, (m3ha−1) | 233.2 | 1.20 | 234.4 | 250.1 | 164.2 | 23.8 | - | 438.1 | |
| d min (cm) | 11.00 | 16.50 | - | 1.30 | 1.70 | 33.55 | 2.00 | - | |
| d max (cm) | 54.80 | 18.50 | - | 65.55 | 59.25 | 58.25 | 10.35 | - | |
| Thousand seedlings, h < 50 cm | - | - | - | 31.8 | 9.7 | 0.4 | 0.06 | - | |
| Thousand saplings, h > 50 cm, d ≤ 1 cm | - | 0.04 | - | 0.2 | 6.1 | - | - | - | |
| % number of trees by category of diameter/ % volume by category of diameter | 2–6 cm | - | 90/0 | - | 63/0 | 64/1 | - | 86/25 | - |
| 8–16 cm | 12/1 | 5/50 | - | 3/0 | 8/12 | - | 14/75 | - | |
| 18–24 cm | 24/11 | 5/50 | - | 2/1 | 5/7 | - | - | - | |
| 28–36 cm | 37/37 | - | - | 8/12 | 16/50 | 31/16 | - | - | |
| 40–48 cm | 22/37 | - | - | 14/41 | 5/34 | 54/56 | - | - | |
| ≥50 cm | 4/14 | - | - | 9/46 | 1/7 | 15/28 | - | - | |
Results from processing data obtained from plot inventories. dg—mean diameter, hg—mean height.
Table 5.
Indicators for characterizing the growing stock.
| Calendar Year | Average Age (Years) | Density | Current Annual Volume Increment (CAI) (m3 an−1 ha−1) |
|---|---|---|---|
| 1962 | 64 | 0.77 | 6.8 |
| 1972 | 75 | 0.78 | 6.3 |
| 1982 | 89 | 0.75 | 6.2 |
| 2002 | 99 | 0.70 | 5.0 |
| 2020 | 107 | 0.66 | 4.2 |
Except for the 2020 density value (computed through field inventory data processing), the indicators were determined using forest management plan data.
Publisher’s Note: MDPI stays neutral with regard to jurisdictional claims in published maps and institutional affiliations. |
© 2021 by the authors. Licensee MDPI, Basel, Switzerland. This article is an open access article distributed under the terms and conditions of the Creative Commons Attribution (CC BY) license (https://creativecommons.org/licenses/by/4.0/).
Share and Cite
MDPI and ACS Style
Tudoran, G.-M.; Cicșa, A.; Boroeanu, M.; Dobre, A.-C.; Pascu, I.-S. Forest Dynamics after Five Decades of Management in the Romanian Carpathians. Forests 2021, 12, 783. https://doi.org/10.3390/f12060783
AMA Style
Tudoran G-M, Cicșa A, Boroeanu M, Dobre A-C, Pascu I-S. Forest Dynamics after Five Decades of Management in the Romanian Carpathians. Forests. 2021; 12(6):783. https://doi.org/10.3390/f12060783
Chicago/Turabian StyleTudoran, Gheorghe-Marian, Avram Cicșa, Maria Boroeanu, Alexandru-Claudiu Dobre, and Ionuț-Silviu Pascu. 2021. "Forest Dynamics after Five Decades of Management in the Romanian Carpathians" Forests 12, no. 6: 783. https://doi.org/10.3390/f12060783
Note that from the first issue of 2016, this journal uses article numbers instead of page numbers. See further details here.