

Abstract
The enhancement of the electric field in a hollow metallic cylinder is optimized as a function of the angular frequency of incident light. A resonant enhancement occurs by exciting azimuthal surface plasmon (SP) and the enhancement is uniform inside the cylinder which is useful for spectroscopy. The enhancement of the electric field is numerically calculated by solving the Helmholtz equation as a function of the inner and outer radii of the cylinder from which an empirical formula for the enhancement is obtained by fitting the numerical results. The maximum enhancement occurs near the resonant condition of the SP but it is not exactly at the resonant frequency of the SP. The calculated induced charge density at the inner and outer surfaces show that the maximum enhancement occurs when the induced charge density at the outer surface becomes minimum. We suggest that such suppression of charge density at the outer boundary of the cylinder is the result of the linear combination of two intrinsic modes of the cylindrical SP.
Export citation and abstract BibTeX RIS
1. Background
In surface enhanced Raman spectroscopy (SERS) or tip-enhanced Raman spectroscopy (TERS), the electric field near a metallic particle or a tip, respectively, is enhanced by the induced near-field (NF) [1, 2]. Since the enhancement of the NF is spatially localized within several nm and generates a local Joule heat at the metallic surface, the NF can be applied in medical science and processing of the material [3–5]. The NF is not-propagating but locally oscillating electro-magnetic wave (EM) which spatially decays within a few nm from the metallic surface [6]. Since the NF is a solution of the Helmholtz equation for EM near the metallic surface, we can solve the equation by so-called finite-difference time-domain method for the EM analysis [6–8]. Zhao et al discuss in detail about how a Au coated array can be used to improve the Raman intensity and sensitivity [9, 10]. However, since it is not easy to design the shape of tip or particle size in the experiment, the NF is not well-controlled experimentally. Further, since the enhancement is given as a function of distance of materials to the metal surface, controlling the distance within several nm is hard, either, which decreases the reproducibility of SERS [11] and TERS and also prevents quantitative analysis of intensity for SERS and TERS. Here we theoretically propose that a hollow core in a metallic cylinder is useful for obtaining a uniform NF. Such a uniform NF is especially helpful for reproducible SERS intensity.
It is known that the enhancement becomes large when the angular frequency of EM is resonant to eigen frequency of the surface plasmon (SP) [12, 13]. The SP is a collective oscillation of charge density that is localized in the direction normal to the surface [14]. By exciting SP, the induced charge and the NF become enhanced resonantly. Pratama et al have pointed out that a conical tip with a smaller conical angle gives a larger enhancement of electric field surrounding the tips, suggesting that a needle-shaped cylindrical tip provides the larger enhancement [15].
For SP in a metallic hollow cylinder, the enhancement exists not only at the outside of the cylinder but also inside of the hollow core of the cylinder. A merit for using inside of the hollow core is that we get a uniform electric field for the relative large space up to more than 100 nm. If we optimize the enhanced field inside the hollow cylinder, we can float a sample inside the hollow cylinder for the TERS, or for photoelectric cells [16–18]. A difficulty for using the hollow core is that we can not easily design the largest enhancement in the hollow core for a given angular frequency of the incident light since the calculated results are generally given numerically. In this paper, by fitting the numerical results to empirical formula, we will discuss optimized geometry of the metallic hollow cylinder which should be useful for experimentalists.
In this paper, we theoretically calculate the enhancement of the electric field inside the hollow cylinder excited by incident light with a linear polarization in the direction perpendicular to the axis of the cylinder. We show the fitted functions for the enhancement as a function of the inner radius and the thickness of the cylinder, from which we get the optimized geometry and enhancement of the metallic hollow cylinder. We analyze the optimized enhancement by calculating the induced charges on the inner and outer surfaces of the cylinder. The present calculated results show that the optimized geometry for the enhancement corresponds to frequency that is close (but not exactly) to the resonant frequency of the lowest SP plasmon mode. At the optimized frequency of light, the two excited modes of SP cancel the induced charge density on the outer surface but enhance that only on the inner surface. In this situation, the enhancement of electric field mainly occurs only inside of the hollow cylinder which is an ideal situation of nano-spectroscopy.
The organization of the paper is as follows. In section 2, we show the method of calculation. In section 3, we present the calculated results of numerical calculation and fitting expressions of the enhancement. We also analyze the optimized enhancement by discussing the induced charge density. In section 4, we analyze the optimized geometry and the largest possible enhancement. In section 5 the summary is given.
2. Method of calculation
We consider a hollow cylinder as shown in figure 1(a), where a1 and a2 are inner and outer radii of the hollow cylinder, respectively, and  i
's (i = 1, 2, 3) denote relative permittivity for the inner (i = 1), the metallic cylinder (i = 2) and the outer media (i = 3). Hereafter, we define thickness of the hollow cylinder as
i
's (i = 1, 2, 3) denote relative permittivity for the inner (i = 1), the metallic cylinder (i = 2) and the outer media (i = 3). Hereafter, we define thickness of the hollow cylinder as  . We put the value of 3 = 1 and 1 = 2.25 (glass) for the outer space and the hollow core, respectively. We imagine to make a glass fiber coated by metal and at the end of the fiber, we put a dielectric liquid with 1 = 2.25 to accept a molecule. For 2, we adopt the Drude mode for gold [19, 20],

where ω is angular frequency of light,  is the relative permittivity for
  ,
,  Hz is the volume plasmon frequency, and γ = 1.15 × 10¹⁴ Hz represents the scattering rate of an electron [21].

Figure 1. (a) Geometry of the hollow cylinder. For the outer region, we adopt the relative permittivity 3 = 1 (vacuum). The hollow space is filed with glass with 1 = 2.25. The cylinder region is gold with 2(ω) given by the Drude model in equation (1). (b) An incident light with polarization direction (Ey
) perpendicular to the cylinder axis.
Download figure:
Standard image High-resolution imageIn figure 1(b), we show an incident light as a solid black arrow which propagates in the direction of x and whose polarization direction (Ey ) lies in the direction perpendicular to the axis of the cylinder (z). For this geometry, we excite the azimuthal transverse-magnetic (TM) mode of SP [6], whose electric and magnetic fields are, respectively, given in the cylindrical coordinate by,


where ρ and ϕ ( and
and  ) denote variables (unit vectors) for radial and azimuthal directions, respectively, and the integers n = 0,±1,±2, ... correspond to the eigenmodes of TM mode. The
  in equation (3) is a solution of the Helmholtz or Bessel differential equation given as follows:
where  (k0 = ω/c), and k is the wave vector of the light.
  is the linear combination of the first and second kinds of the nth Bessel functions, Jn
(x) and Yn
(x), respectively. Using the obtained
is the linear combination of the first and second kinds of the nth Bessel functions, Jn
(x) and Yn
(x), respectively. Using the obtained  ,
,  and
and  in equation (2) are expressed by
  as follows [22, 23]:

When we use the fact that Yn
(x) is singular at x = 0, we get the following forms of  ,
,  and
and  as a function of ρ for the ith region (i = 1, 2, 3),
- (a)for
 , (i = 1):
 - (b)for, (i = 2):
- (c)and for, (i = 3):


where αn
, βn
, γn
and δn
are coefficients to be solved by the boundary conditions, and  is the wave vector in the ith medium.
  is the nth order Hankel function of the first kind which represents the out-going EM in the third region [24].
In the third region, we consider the EM field of the incident light  and
and  in form of a planar wave propagating towards x-direction and polarized in the y-direction:

where E0 is the amplitude of the electric field. Since the plane wave of the incident light can be expanded by the Bessel functions in the cylindrical coordinate as follows [25]:
we get the following expansions of equations (16) and (17) as a function of ρ,

Here,  ,
,  and
and  are expressed by the Bessel function as follows:


The boundary conditions are given by the fact that  and
and  are continuous as follows:

By substituting equations (7)–(15) and equations (19)–(24) to equation (25), we obtain the following matrix equation,
The coefficients αn , βn , γn and δn in equations (7)–(15) are obtained by solving equation (26). By substituting the coefficients into equations (7)–(15), we can get the expression of EM field in each region.
The enhancement of the incident electric field in the first and the second regions,  , (i = 1, 2), is expressed by:

The  in the third region is given by including the electric field of the incident light as follows:
Using the Gauss law, the induced surface charge density at ρ = a1 and ρ = a2 which are denoted by σ1 and σ2, respectively, are expressed as a function of ϕ and t by,


3. Calculated results
In figure 2, we show the enhancement of electric field as a function of position in a xy plane for a1 = 70 nm, a2 = 90 nm and incident light frequency ω = 2.71 PHz. As we can see in figure 2, the electric field is enhanced more than two times of that for the incident EM at the outer surface of the cylinder, and the enhancement inside the hollow cylinder is nearly uniform with enhancement more than four times. This uniform enhancement is useful for applications, such as putting a sample inside the hollow cylinder for the Raman spectroscopy or heating of a sample. Thus, we focus on the enhancement inside the hollow cylinder. In the following content of this work, we mainly discuss the field enhancement, in particular at the center of the cylinder (ρ = 0).

Figure 2. The enhancement of electric field as a function of position in a xy plane. Here, we use a1 = 70 nm, a2 = 90 nm, and ω = 2.71 PHz.
Download figure:
Standard image High-resolution image3.1. Expression for the enhancement of electric field
In figure 3, we plot the calculated  at ρ = 0 (dots) as a function of ω for several values of (a1, d), in which we fix d = 30 nm in figure 3(a) and a1 = 70 nm in figure 3(b), which are fitted to the following function (solid lines):

Figure 3. Calculated  at ρ = 0 are plotted by the colored dots for several geometries while fitted function given by equation (31) are plotted by solid lines with the same color. (a) Thickness d is fixed as d = 30 nm, and (b) the inner radius a1 is fixed as a1 = 70 nm.
Download figure:
Standard image High-resolution image
where  denotes the maximum enhancement for a given geometry, ω0 represents the frequency that gives maximum enhancement (resonant frequency), while ωw
is the half width of the spectrum. In order to find a general expression of enhancement, the parameters
denotes the maximum enhancement for a given geometry, ω0 represents the frequency that gives maximum enhancement (resonant frequency), while ωw
is the half width of the spectrum. In order to find a general expression of enhancement, the parameters  and ωw
in equation (31) are fitted as functions of a1 and d. Hereafter, we refer a1 and d as the geometry of the cylinder.
and ωw
in equation (31) are fitted as functions of a1 and d. Hereafter, we refer a1 and d as the geometry of the cylinder.
In figure 3(a) we fix d = 30 nm while in figure 3(b) we fix a1 = 70 nm. The fitting function given in equation (31) reproduces the numerical result well. We can see that the geometry of the cylinder determines the enhancement spectrum, in particular, the resonant frequency ω0. Therefore, by obtaining the analytical expression of  , we can determine the optimized geometry that gives the largest enhancement for a given
  . We can see from figure 3(a) that, for a given d, the ω0 increases with decreasing a1. On the other hand, as is shown in figure 3(b), for a given a1, the ω0 increases with increasing d. It is noted that we consider ranges of a1 and d as
  and
and  , since we can obtain a good fitting with the Lorenztian function and that the Drude permittivity in equation (1) is valid within these range of geometry parameters, for the ω0 is smaller than 3.43 PHz, thus the contribution to the permittivity from the inter-band transition is minimized.
The enhancement ratios expressed in equations (27) and (28) are given as a linear combination of nth order Bessel functions, Jn
and Yn
, which correspond to an oscillation mode of SP. Hereafter, we refer the mode expressed by nth order Bessel function as nth mode. In order to understand the physics behind the enhancement and SP, we first identify the dominant nth mode that contributes to the enhancement. In figure 4 we plot the contribution of each mode to the  at ρ = 0 for n = ±1 as blue dots, while the total enhancement ratio is plotted in black line for comparison. It is clear that at the center of the cylinder (ρ = 0) the n = ±1 modes give the dominant contribution to the enhancement. Since Jn
(kρ) = 0 for n = ±2 or higher at ρ = 0, there is no contribution for n ≠ 1 at ρ = 0. Even when we analyse in a general ρ ≠ 0, the contribution from n = ±2 and ±3 are 10−2 and 10−4 times smaller than that for n = ±1 near the center of the cylinder, which is the origin of the uniform distribution of
at ρ = 0 for n = ±1 as blue dots, while the total enhancement ratio is plotted in black line for comparison. It is clear that at the center of the cylinder (ρ = 0) the n = ±1 modes give the dominant contribution to the enhancement. Since Jn
(kρ) = 0 for n = ±2 or higher at ρ = 0, there is no contribution for n ≠ 1 at ρ = 0. Even when we analyse in a general ρ ≠ 0, the contribution from n = ±2 and ±3 are 10−2 and 10−4 times smaller than that for n = ±1 near the center of the cylinder, which is the origin of the uniform distribution of  in the hollow core.

Figure 4. The enhancement ratio  at the center (ρ = 0) is plotted as a function of ω. The total enhancement ratio as shown in equation (16) are given by the black solid line, while the contribution of n = ±1 mode is plotted in blue dots, for comparison. Geometry parameters for this plot are a1 = 70 nm and d = 20 nm. Schematic drawings of charge distribution of n = ±1 mode and n = ±2 mode are shown. The charge distribution of the n = ±2 mode has four nodes, which correspond to zero field intensity at the center.
Download figure:
Standard image High-resolution imageBy substituting  and corresponding n values into equations (7) and (8), we can calculate the value of the electric field for each mode at the center of the cylinder. Noting the derivative equation for Bessel functions [22]:

Also noting that:

we understand that only the n = ±1 modes give non-zero  at
at  .
.
The n = ±1 modes correspond to the oscillation of an electric dipole, while the n = ±2 and n = ±3 modes correspond to a quadrupole and an hexapole, respectively, as shown in the inserts of figure 4. Higher modes are highly symmetrical in the distribution of the charge density, preventing them from contributing towards the electric field enhancement at  . In the following sections, we discuss more about the nature of the n = ±1 modes, since we are interested in optimizing the enhancement inside the cylinder.
3.2. Enhancement and the charge density
Now, we explain the relation between the enhancement and the charge density induced on the boundaries of the cylinder to understand the nature of the enhancement. In figure 5(a), we show the surface charge density in inner (σ1) and outer (σ2) boundaries as a function of ω at ϕ = 90∘. The enhancement ratio  is also shown in black solid line in figure 5(a). As seen in figure 5(a), the enhancement peak occurs when the σ2 has a local minimum value. At the ω = ω0, the electric field is enhanced compared with that at the other frequencies, not only at the center, but also in the metallic part of the cylinder. The enhanced electric field in the metallic part generates the Joule's heat, which is observed as the peak of absorption of the EM wave. Therefore, the incident wave is absorbed in the metal instead of being scattered when the σ2 is minimum.
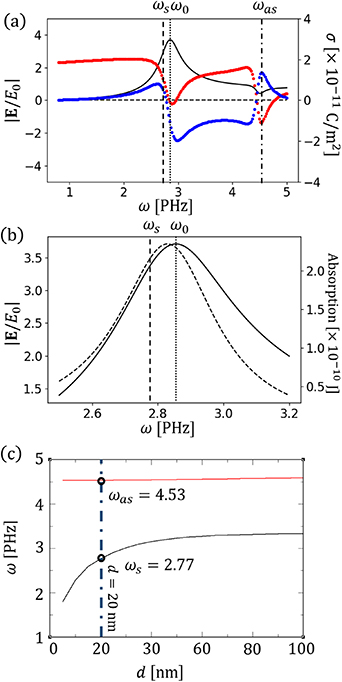
Figure 5. (a) by numerical calculation are plotted as a function of ω in black solid line, with charge density at the outer boundary σ2 and inner boundary σ1, respectively plotted in red and blue dotted lines. The vertical dashed, dash-dotted and dotted lines denote the frequencies for symmetric (ωs), anti-symmetric (ωas) modes and the resonant frequency (ω0), respectively. Here we adapt a geometry of a1 =60 nm, d=20 nm. (b)
 and absorption as a function of ω given by solid and dashed lines, respectively. The absorption is calculated by using equation (34). (c) The frequency of SPs on a hollow cylinder as a function of d for a1 =60 nm. The symmetric and anti-symmetric modes are plotted in black solid and red dashed line, respectively. The vertical blue dot-dashed line denotes d=20 nm (the case of figure 5(a)), with the corresponding frequencies given by circles.
Download figure:
Standard image High-resolution imageFor n = ±1 modes, there are two modes, each of which corresponds to a distribution of charge in outer and inner boundaries. The lower frequency mode is symmetric mode, where the sign of charge densities in both boundaries are the same. The higher frequency mode is anti-symmetric mode, where the sign of charge densities in the two boundaries are opposite. The frequencies of symmetric and anti-symmetric modes are denoted by  and
and  , respectively. Values of
  and
and  are obtained by solving the zeros of determinant of the 4 × 4 matrix in equation (26), and are shown in dashed and dash-dotted lines in figure 5(a), in which we can also find that
  for ωs
, while
for ωs
, while  for ωas
. It is clear that ω0 lies between ωs
and ωas
. In figure 5(b), we plot the absorption as a function of ω by a dashed line, while
for ωas
. It is clear that ω0 lies between ωs
and ωas
. In figure 5(b), we plot the absorption as a function of ω by a dashed line, while  is plotted by a solid line for comparison. Maximum absorption is achieved at a frequency close to the ω0, which proves that the largest enhancement ratio corresponds to the minimum scattered electric field. Here the absorption (per unit length) is obtained by calculating the integrated, time-averaged Poynting vector of the n = 1 mode pointing toward the cylinder at a2 (u), given as follows:

where  and
and  are, respectively, the electric fields and magnetic fields given by equations (2) and (3).
In figure 5(c) The  and
and  are plotted as a function of d for a1 = 60 nm as black and red solid lines, respectively. The
  is always smaller than
  for any d. Furthermore, the
  is dispersive with respect to d, while
  is almost constant with d. We can find the similar modes in phonon, where the
  and
and  correspond to acoustic and optical phonons. From figure 5(c), we take the values of
  PHz and
  PHz for d = 20 nm. These frequencies are shown in figure 5(a) as vertical dashed lines. We can see that the ω0 = 2.86 PHz lies between
  and
and  , and ω0 is closer to
  .
.
In figures 6(a) and (b), we show the distributions of the surface charge density for  and
and  modes, respectively. It is obvious that figures 6(a) and (b) correspond to the symmetric and anti-symmetric distributions of charge density, respectively. In figure 6(c), we show the distribution of the charge density at ω = ω0, where we can see that the charge density exists only on the inner boundary as we explain before by the minimum of the scattered electric field. We can also understand this phenomenon by considering the fact that the ω0 lies between
  and
and  . Consequently, the distribution of the charge density for ω = ω0 is a linear combination of the symmetric and anti-symmetric modes. Therefore, the charge distribution in figure 6(c) is obtained by subtracting figure 6(a) with (b) with a weighting factor.

Figure 6. The distributions of the surface charge density for (a) symmetric ( ) and (b) anti-symmetric modes (
 ). (c) The distribution of the charge density at ω = ω0. It is noted that at ρ = a2, the surface charge density σ2≈ 0. Minimum charge density at the outer boundary leads to a minimum scattered electric field and a maximum absorption as shown in figure 5(b). Geometry parameters are a1 = 60 nm, d = 20 nm.
Download figure:
Standard image High-resolution imageIt is noted that from figure 5(a), the anti-symmetric mode corresponds to a minimum of the enhancement ratio in the center of the cylinder. This is because the anti-symmetric distribution of the charge density of two boundaries creates two electric dipoles each pointing in opposite directions, which cancel the induced electric field at the center of the cylinder. This effect is generally understood by depolarization effect for metallic hollow cylinder.
4. Optimized geometry
Let us obtain empirical formula for  and ω0 as functions of d and a1. The numerically obtained enhancement ratio given in equation (31) implies that for all possible given geometries (a1, d), maximum enhancement is achieved at
  . The fitted expression for
  is given as follows:
where  and
and  are, respectively, saturated value of ω0 for
  , a constant for change of ω0, and a characteristic length for the thickness. Equation (35) is obtained from fitting procedure explained in section 3.1.
For a given incident light frequency  , the optimized geometry can be obtained by substituting
  in equation (35). As there are two parameters, a1 and d, for a given
  , we obtain an optimized thickness
  as a function of a1, which is the thickness of the cylinder that gives the maximum enhancement for a given
  and a1. An empirical formula for
  is given as follows:

Let us call a geometry with  for corresponding a1 as a optimized geometry for the given
  . The enhancement ratio at the optimized geometry is thus obtained by substituting the expression of
  into
into  which is given in supplemental material (available online at stacks.iop.org/JPD/54/325303/mmedia).
It is noted that from equation (36),  must be larger than
  for
for  to be physically meaningful. Otherwise,
  will have an imaginary value when
  . From the fitting procedure, we obtain the expression for
  as follows:

In equation (37), the units of  and a1 are PHz and nm, respectively. Since
  can not be larger than
  , equation (37) gives a largest possible a1 for a given
  . We denote the largest a1 as
  . The expression of the
  is given by substituting
  in equation (37) and by solving for a1. Thus
  in nm is fitted to:
In figure 7(a) we plot  and in (b) the corresponding
  for several
  as a function of a1. The
  are given by vertical lines. From figure 7, we understand that the
  increases with decreasing
  . Figure 7(a) shows that for a given
  ,
,  increases with increasing a1 and for a given a1,
  increases with increasing
  . Therefore, it is possible to generate enhancement for a large cylinder, which is easier to fabricate in the experiment. From figure 7(b), it is inferred that in the given range of
  –3 PHz, there is at least around 3 times of
  when the optimized geometry provided in equation (36) is achieved. From figure 7(b), we notice that
  increases when a1 approaches
  , with more than 4.5 times of
  for all three frequencies. For example, when a1 = 105 nm and
  nm for
  PHz, the
  . We thus suggest to engineer a system with a1 close to
  with the corresponding
  .
.

Figure 7. (a) The  for several
  are plotted as a function of a1. (b) The corresponding optimized
  . The vertical lines denote the
  for the corresponding
  .
.
Download figure:
Standard image High-resolution image
It should be mentioned that we need to consider additional contribution to γ in equation (7) from the boundary scattering of the electron. When we adapt the mean free path of the electron in gold as vF
/γ = 76.56 nm, where  nm s−1 is the Fermi velocity, the mean free path is comparable to the
  . Thus, the γ should be modified to include the boundary effect. We can adjust the Drude model to incorporate this effect, by replacing γ in equation (7) with
  , where
  . A = 0.33 denotes the probability of an electron to scatter at the boundary, and
  represents the effective mean free path [15, 26–28]. For simplicity, here we use
  . We examine the enhancement spectra by using the
  . By using
  in the Drude model, despite the enhancement peak decreases by 5% in magnitude, the position of the peak does not change and the spectra remain Lorentzian.
5. Conclusion
We theoretically investigate the enhancement of electric field generated by the resonance of SP excited by an incident light. A strong and uniform enhancement of the electric field inside the cylinder is obtained by minimizing induced charge at the outer metallic surface. The enhancement is mainly generated by the electric dipole of the n = ±1 SP modes. The enhancement ratio inside cylinder reaches its peak at frequency that is slightly higher than the resonance frequency of the symmetric mode of SP. The enhancement peak corresponds to a maximum absorption rate, as charge distribution at outer boundary is minimized. This phenomenon might be the result of linear combination of the symmetric and the anti-symmetric modes of SP that enhances the charge density on the inner boundary and diminishes that of the outer boundary.
By fitting the numerical spectra of the enhancement, we obtain an empirical formula of the enhancement as a function of frequency, radius and thickness of the hollow cylinder, which should be useful for designing the metallic hollow core. The peak frequency is also given analytically from which we can determine the optimized geometry for a given frequency of the incident light. We also find that there is an upper limit of inner radius, above which the enhancement peak does not exist. The largest enhancement occurs when inner radius approaches this upper limit.
We find that the enhancement of the electric field inside a hollow metallic cylinder generated by the SP is uniform. This phenomenon can be used for evaluating the intensity of the SERS and TERS quantitatively.
Data availability statement
The data that support the findings of this study are available upon reasonable request from the authors.
Acknowledgments
T Y acknowledges support from GP-Spin at Tohoku University. M S U and R S acknowledge JSPS KAKENHI Grant No. JP18H01810, and CSIS, Tohoku University.