
Abstract
The electron dynamics in a stable and non-filamentary Argon plasma jet, generated using AC excitation at kHz frequencies and interacting with a liquid surface either at floating potential or electrically grounded were examined using laser Thomson scattering. In the case of a floating liquid, two discharge events were observed during each half-cycle of the applied sinusoidal voltage. In the grounded liquid case only one discharge event was observed, which occurred during the positive half period. Through spatio-temporal imaging of the discharge, its repetitive breakdown behavior was analyzed and divided into pre-, main-, and post-breakdown phases. The dynamics and presence of the various phases differed depending upon the grounding of the liquid. Thomson scattering measurements revealed maximum electron densities and temperatures of 6.0–6.3 × 1014 cm−3 and 3.1–3.3 eV for the floating liquid case and 1.1 × 1015 cm−3 and 4.3 eV in the grounded liquid case. Electron-driven reactions are the primary source of reactive chemical species in a plasma jet. Therefore, the electrical characteristics of the liquid sample can impact the fundamental physicochemical processes at play in the discharge, ultimately influencing its chemical composition.
Export citation and abstract BibTeX RIS

Original content from this work may be used under the terms of the Creative Commons Attribution 4.0 license. Any further distribution of this work must maintain attribution to the author(s) and the title of the work, journal citation and DOI.
1. Introduction
Atmospheric pressure discharges are used for a large variety of applications [1]. When the plasma is categorized as cold or non-equilibrium, the heavy particles are at a much lower temperature than the electrons and many possibilities come into play where the plasma can be used for e.g. the treatment, modification, or functionalization of a surface/sample [2, 3].
In contrast to low-pressure plasmas, many of the emerging applications of atmospheric pressure plasma rely on the generation of reactive chemical species. Typically, when an atmospheric pressure plasma is created in the presence of air, a plethora of reactive oxygen and nitrogen species (RONS) are created [4, 5]. Such species are known to be highly beneficial in healthcare related applications, such as the disinfection of surfaces, the treatment of cells, and the exposure of human tissues [6, 7].
In many application domains, including both healthcare and agriculture, it is likely that the plasma will interact directly with a liquid layer or with a sample that consists for a large part of water [8]. A liquid layer is known to significantly influence the behavior of the plasma compared to a situation when a dry target, or indeed, no target is used, i.e. a freely expanding plasma [9, 10]. With the electrical characteristics of the liquid, such as its conductivity, having a major impact on the behaviour of the plasma [11]. From an application perspective, this poses a challenge as the nature of the target is not always clearly defined. In the field of plasma medicine the liquid target is typically electrically floating, be it microorganisms in a Petri-dish or a patient [12]. Whereas in other application domains, the liquid may be in contact with a grounded metallic object, for example in the decontamination of food-processing machinery. Therefore, having a clear understanding of how the underpinning physicochemical properties of the plasma vary with the liquid target characteristics is of paramount importance.
Furthermore, atmospheric pressure plasma is being increasingly used for the generation of plasma activated water (PAW). A key advantage of PAW is that it can maintain some of its reactivity long after the plasma has been extinguished due to the generation of longer-lived reactive species in the aqueous phase, including hydrogen peroxide, nitrates, and nitrites. Such species can make PAW attractive for use in some agricultural applications [13]. A large number of plasma systems have been developed to create PAW, e.g. plasma jets or a dielectric barrier discharge (DBD), with some of them operating with the liquid at the floating potential while others employ grounded liquid targets.
Another application which exploits plasma-liquid interactions is the electrochemical cell [14, 15]. Where a conventional electrochemical cell is modified to use a plasma electrode rather than a conventional solid metallic electrode. In this scenario, electron transport from the plasma electrode to the metal electrode via the liquid (or vice versa) is of paramount importance. By controlling the current transfer of the plasma, chemical reaction rates in the liquid can be controlled as well as the synthesis of nano-particles [16]. The plasma-liquid interface, however, is complex and several important aspects that have been hypothesized as important are still being examined experimentally, such as secondary electron emission from the liquid [17] and the solvation of electrons themselves [18].
This study explored the electron dynamics in an argon plasma jet interacting with a liquid surface under two specific operating regimes: (a) the liquid target electrically floating, and (b) the liquid target electrically grounded via a 1 kΩ resistor. Such conditions mimic several of the emerging applications areas where plasma is currently being explored whilst providing a convenient means to study how the electron dynamics in the discharge are affected by the liquid target. The remainder of the manuscript is divided as follows: section two describes the diagnostics techniques adopted, section 3 presents a discussion of the results for the two cases examined and finally, section 4 provides a conclusion.
2. Experimental setup
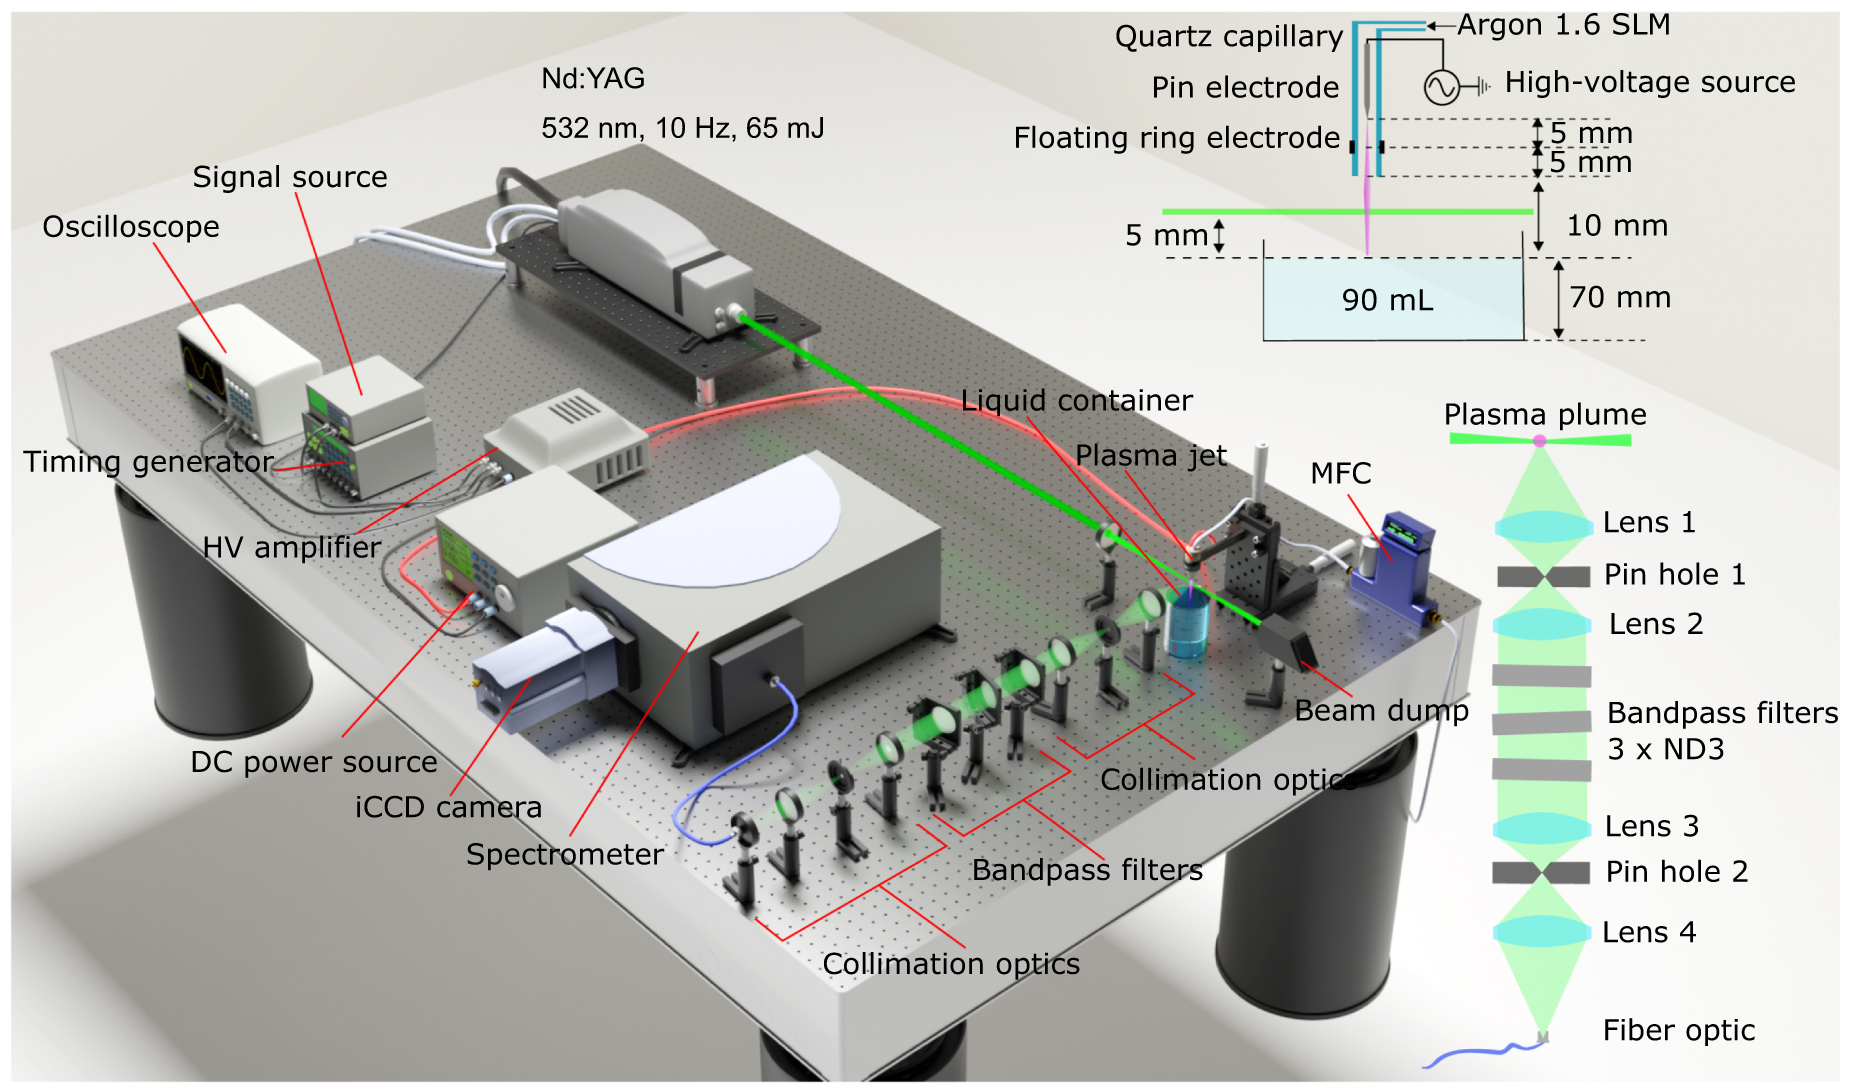
Figure 1 shows the arrangement of the plasma reactor and the Thomson setup used throughout this work. The same setup was slightly altered and simplified for fast iCCD imaging, which will be discussed separately.

Figure 1. The experimental Thomson scattering setup used throughout this work to investigate a kHz driven AC argon plasma jet interacting with a liquid surface at either floating or grounded potential.
Download figure:
Standard image High-resolution imageThe plasma jet consisted of a quartz capillary tube (inner diameter 3 mm) with an inner needle that acted as the powered electrode. Argon gas flowed through the capillary into open air at atmospheric pressure with a flow rate of 1.6 slm (standard liter per minute). A metal ring of 5 mm width at floating potential was attached around the capillary at 5 mm downstream from the end of the inner needle. This left another 5 mm from the metal ring to the end of the capillary. Therefore, the plasma jet was operated in coaxial configuration as can be seen in figure 1.
The plasma jet was oriented in a vertically downward position at approximately 10 mm from a liquid surface. A glass beaker filled with tap water (90 ml) was placed on a vertical translation stage directly beneath the jet orifice. The conductivity of the liquid was measured as 220 µS cm−1.
To operate the plasma jet and synchronize the iCCD camera (Andor iStar DH734-18u-03), a function generator was used to generate a 0–5 V square-wave at 23 kHz. This was transformed to a high-voltage sine-wave that generated the plasma jet. A DC power supply powered the high-voltage generator delivering between 20 and 30 V DC at 0.08 to 0.35 A. The voltage and current was monitored on a Tektronix DPO4054 oscilloscope using a Tektronix P6015A probe and a Pearson Rogowski current probe. The gating of the iCCD camera was monitored on the oscilloscope as well as the current through the resistor in the grounded case.
This work focuses on the difference in operating dynamics of the discharges depending on the grounding of the liquid. The two cases were compared while monitoring that the input power was similar and it was verified that the non-equilibrium discharges were of comparable gas temperature.
2.1. Thomson scattering
The Thomson scattering experiment performed in this work was done using a 10 Hz, 6 ns laser (Litron laser Nano-S-130-10), as shown in figure 1. The 23 kHz square signal was used to operate two pulse generators needed to trigger both the laser and the iCCD camera at the correct frequency, with the freedom to vary the relative delay of both to perform time resolved measurements within the applied kHz-sinusoidal voltage. The laser beam was focused to a 50 µm spot using a 15 cm lens. The plasma jet was placed at this focus point and the scattered light was captured at a 90 degree angle. A series of reflective volume Bragg gratings were used to filter out the Rayleigh scattered light component. The remaining Thomson scattered light was accumulated and analyzed with an Andor iCCD Spectrometer system (Andor Shamrock SR-500i-A) using a 300 µm slit and a grating of 2400 lines per mm.
The electronic properties (electron density and temperature) of the plasma jet were probed at the half way point between the jet exit and liquid surface, i.e. at approximately 5 mm from both the liquid and the end of the capillary. The plasma jet was mounted on three translation stages, which allowed precise movement of the jet in order to align it with the laser beam and the line of sight from the collecting light optics. The position on the laser line was optimized by finding the maximum light emission observed through the collecting optics of several argon lines when the plasma jet was active. The position on the line of sight was optimized by performing relatively fast Thomson measurements (2 min capture time), while varying the position of the jet. When the signal was highest the jet alignment was considered complete.
In order to analyze the Thomson signal and obtain the electron density a calibration of the system was performed. In this work the system was calibrated by analyzing the rotational Raman spectrum of air when the plasma jet and argon flow were inactive. In general, the scattering intensity detected by the iCCD camera is given by [19–21]:
with n the number density, dσ/dΩ the differential cross-section, and  the spectral distribution with normalized area. The calibration constant C depends on the efficiency constant f, the detection volume length l, laser intensity I, and detection solid angle ΔΩ.
For rotational Raman scattering the observed intensity is caused by rotational excitation of oxygen and nitrogen molecules in the ambient air. The wavelength and intensity of these transitions was calculated using literature [19–21] and since the number density at atmospheric pressure is fixed a calibration was performed. This gave the observed broadening of the system as well as the calibration constant C needed to analyze the Thomson signal.
The Thomson scattering signal appears as a Gaussian when a Maxwellian temperature distribution is assumed. As a result, by fitting a Gaussian profile the electron density and temperature can be obtained. The electron density scales with the area of the Gaussian profile while the electron temperature relates to the Gaussian width, Δλ, according to:

where  is the electron mass, c the speed of light,
  the Boltzmann constant and
  the incident laser wavelength. An example of the obtained spectra can be found in the supplementary materials (available online at stacks.iop.org/JPD/54/325201/mmedia) for the Raman signal of air (figure S1) used as calibration and the Thomson signal (figure S2) when the plasma jet was examined.
2.2. Fast iCCD imaging
The setup shown in figure 1 was simplified to perform fast iCCD imaging of the plasma-liquid interaction. The camera was removed from the spectrometer and placed in front of the plasma jet. The 23 kHz square signal was directly used to trigger the iCCD gate within the camera. Using the function integrate on chip from the Andor iCCD camera, the light emission from the plasma jet was accumulated during every period at a fixed delay. A kinetic series was used to vary the delay automatically from a starting delay with a fixed TTL gating time and step size. The camera acquisition settings, e.g. the exposure time and number of accumulations, are given in the text when the results are presented.
For part of the investigation, several different band-pass filters (BPFs) were placed in front of the iCCD camera lens to capture specific emission lines. The BPFs used throughout this work had an operating wavelength of 310 nm, 340 nm, and 780 nm to observe excited hydroxyl OH (A-X), molecular nitrogen N2 SPS(0,0), and atomic oxygen O, respectively. Each BPF had a bandwidth of 10 nm.
3. Results
3.1. Floating potential
The voltage and current waveforms used to generate plasma are shown in figure 2(a) for the first case where the liquid was at floating potential. A voltage amplitude of 4.8 kV was applied to generate the plasma and two current peaks of +19 and −16 mA were observed during the rising (at −2.6 µs) and falling (at 19.1 µs) of the voltage slope. The breakdown of the plasma caused a small distortion in the applied voltage profile  at those time instances.

Figure 2. (a) The applied voltage  measured with the high voltage probe when the liquid was at floating potential, together with the estimated memory voltage
  and resulting gas voltage
  . The measured current is shown in red. Enumerated letters (a)–(q) are shown at various time instances that correspond to light emission images shown in figure 3. (b) The Lissajous figures corresponding to charge-voltage characteristics for both the floating potential and grounded liquid case.
Download figure:
Standard image High-resolution imageThe breakdown characteristics of the plasma jet follow the basic principles of a dielectric barrier discharge (DBD). This is exemplified by the charge-voltage characteristics shown in figure 2(b), which is more typically known as a Lissajous figure. The charging of the system was acquired by integrating the current profile. A linear compensation in time was needed to counteract the integration of noise in order to ensure that the charging remains periodical. Figure 2(b) also includes the Lissajous figure for the second grounded-case, which will be discussed later in the manuscript.
It can be seen in figure 2(a) that the plasma breakdown does not occur at the maximum of the applied voltage, a typical feature of an AC excited DBD. Due to the presence of deposited surface charges, the potential distribution in the gas is not the same as the applied voltage. An estimated behavior of the gas voltage  was obtained by defining a memory voltage
  relating to the voltage arising from charges deposited on dielectric surfaces and within the gas gap from the previous breakdown cycle [22].
The charge profile was used for this as shown in equation (3) with I(t) the current and C the capacitance of the system. From figure 2(b) it was estimated that the capacitance of the system is approximately 5.5 pF. The memory voltage starts at offset  , which was chosen to ensure that the average of the gas voltage
  is zero over one period

Both the memory voltage and the estimated gas voltage are shown in figure 2(a) as well. It can be seen that the greatest potential, and thus highest electric field, in the gas is reached just before breakdown, at ±1.8 kV at −2.6 µs and 19.1 µs.
The enumerated letters (a–q) shown in figure 2(a) correspond to the moment of acquisition (delay at iCCD camera) for the obtained plasma jet images of light emission shown in figure 3. Each image was obtained using a exposure time of 50 ns and an accumulation of 1150 exposures. The end of the capillary was at distance zero, while the liquid target was at approximately 10 mm. The images are shown in a normalized manner with the maximum count number of each frame given by in the legend on the side.
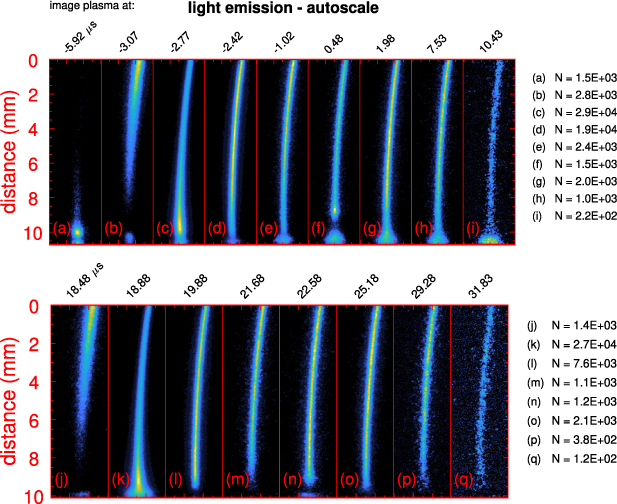
Figure 3. Acquired images of the light emission by the plasma jet interacting with the liquid surface (at 10 mm). Each image consists of 1150 exposures taken at a specific delay/timing, with a exposure time of 50 ns. The enumerated letters can be found in figure 2(a) for the corresponding timing during the voltage–current waveform. Normalization factor N gives the highest number of counts in each image.
Download figure:
Standard image High-resolution imageThe images shown in figure 3 are part of a kinetic series that was captured by starting the delay at −6.7 µs for the rising voltage slope (top row) and 16.3 µs for the falling slope, with respect to t = 0 µs when the applied voltage is zero. The delay was varied in steps of 50 ns in order to obtain a detailed overview of the dynamics involved. These dynamics are more easily observed in a spatio-temporal image (also called photostreak or streak image), rather than the individual images as shown in figure 3. What can be noticed from figure 3 is that this argon plasma jet system creates a stable, thin, single filament discharge for which the width (approximately 250 µm) of the plume did not appear to vary across the channel, except for when it reached the liquid surface.
The spatio-temporal image of plasma light emission can be seen in figure 4. It was created by horizontally binning each individual image (examples shown in figure 3) to obtain a vertical line at a specific time delay. Again, enumerated letters have been placed to indicate where the individual frames of figure 3 are located.
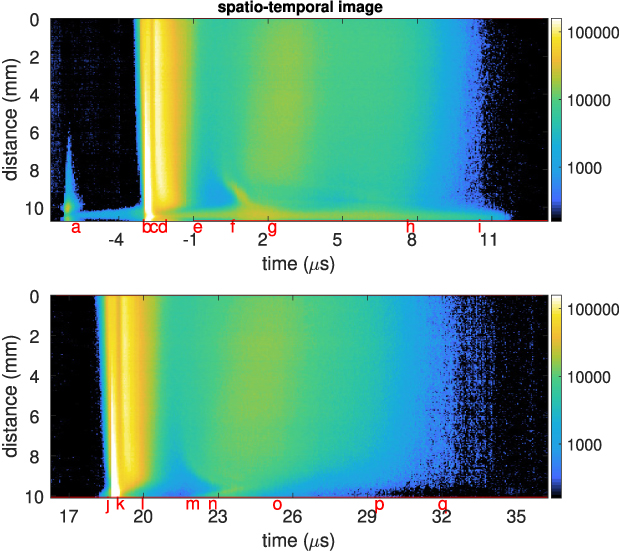
Figure 4. Spatio-temporal images of the light emission from the plasma jet impinging on a floating liquid target, constructed using all the individual images obtained from a kinetic series. See text and figure 3 for more detail.
Download figure:
Standard image High-resolution imageFirst, the discharge dynamics will be described that occur during the rising of the voltage slope (figures 3(a)–(i)) i.e. between the minimum voltage of the applied sine wave and its maximum. Various distinct light emission events are visible in the top row of figure 4 that can be categorized as being part of either the pre-, main-, or post-breakdown phase of the discharge. The light emission was only analyzed from the plasma plume region since the powered electrode inside the capillary cannot be seen.
The pre-breakdown phase is visualized by figure 3(a) at −5.9 µs. During this phase, the high voltage potential in the gas was rising and positive as can be seen in the voltage–current characteristics. Light appeared close to the liquid with two distinct features. The first was short-lived and appeared up to 4 mm away from the liquid (see figure 4). The second feature appeared close to the liquid and remained constantly present until the main-breakdown phase initiated. Since an overall positive potential was applied to the powered electrode, these discharge phenomenon from the liquid shall be called cathode-glow events.
The main breakdown occurred at approximately −2.7 µs and is characterized by the largest current peak, shown in figure 2(a). This phase was initiated because the potential in the gas had passed a certain threshold, i.e. the breakdown value which appears to be ±1.8 kV for this jet geometry. The breakdown can be observed over figures 3(b)–(d). The normalization factor N and figure 4 show that the light emission during this phase is an order magnitude greater than in the other phases.
The breakdown developed rapidly and figure 3(b) shows that the maximum light emission was at the tip of the capillary and not in the streamer head which had already moved 8 mm away from the capillary. This does not relate to the conventional propagation dynamics of a steamer head, often also referred to as a plasma bullet [23].
When contact with the liquid had been made (figure 3(c)), the maximum light emission shifted to the liquid surface. While the current increased rapidly, the light emission dropped slightly, for it to return again quickly to high levels (shown in figure 3(d)). In this DBD-like system, such a discharge cannot be maintained indefinitely because charge build-up compensates the potential difference in the gas causing a decrease of electric field. This means that the light emission decreased until −1.0 µs (3(e)), when a post-breakdown phase began.
The post-breakdown phase lasted the longest as shown in figures 3(e)–(i). From the voltage–current characteristics in figure 2(a) it can be seen that during this phase the resulting gas voltage did not change significantly, even though the applied voltage did. This is because a conductive channel had already been formed. Nevertheless, distinct plasma features were also present in this phase.
The first is shown in figure 3(f) where a 'secondary' ionization front appeared in the vicinity of the liquid, moving towards it (cathode directed streamer). Before this occurred, an increased light emission was observed at the liquid (negative / cathode glow) while at 8–9 mm from the capillary the light emission had decreased significantly. Figure 2(a) shows the gas voltage increased slightly from figures 2(e) to (f) to decrease again towards figure 2(g). This matches the appearance of this new cathode directed ionization front at the vicinity of the liquid. Then during figure 3(g), it can be observed that there was an increase in light emission on the top part of the plasma channel. This coincided with a local maximum in the current profile. The end of the post-breakdown phase is observed between figures 3(h) and (i) and is caused by reaching the maximum of the AC applied voltage. Since the applied voltage was not increasing anymore and in fact became smaller than the gas voltage, the discharge was no longer sustained and light emissions dropped rapidly.
The second discharge event from the liquid at floating potential case appeared during the falling of the voltage slope, i.e. between the maximum voltage of the applied sine wave and its minimum. A similar distinction in phase dynamics can be made as the first discharge, however, now a generally negative potential is applied meaning the liquid acts as anode. This must relate to the first distinction, which is that a pre-breakdown phase was not observed.
The main breakdown phase, however, shares a great similarity with the one observed during the rising voltage slope. Again, the maximum light emission was not in the streamer head (figure 3(j)) but at the capillary. A small difference was noticed when contact was made to the surface at figure 3(k). The plasma channel had become much wider at the liquid than compared to figure 3(c).
The post-breakdown phase lasted again the longest, from approximately 38 µs to 49 µs. The main feature of this phase is an increase of light emission in the plasma channel, best seen at figure 3(o). Similar to the rising of the voltage slope, this coincided with a local extreme of the current profile. Throughout this phase, there was almost no light emission coming from the vicinity of the liquid. That means that there was no anode/positive-glow region. Only during a short instance, starting at figure 3(n) an ionization front was seen coming from the liquid, reconnecting with the anode-directed front of the plasma channel. This anode-directed front was less luminous than the cathode-directed ionization front observed during the rising voltage slope (figure 3(f)). Similar as before, the post-breakdown phase ended when the applied voltage surpassed its extreme and the gas voltage became larger than it.
3.2. Band-pass filters
The spatio-temporal emission images are shown in figure 5 while using various BPFs to look at specific emission lines/bands as explained earlier. The results are shown for the discharge occurring during the rising of the voltage slope. The acquisition settings are different from the ones used to obtain figures 3 and 4, since less light is reaching the detector. The gain of the iCCD camera was increased from 100 to 200 (iCCD max gain is 255) and 4600 exposures were accumulated at each delay instead of 1150.
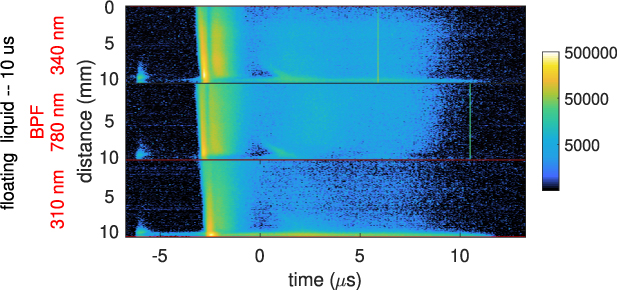
Figure 5. Spatio-temporal images of the discharge dynamics during the rising slope in the floating potential case captured using various BPFs to observe specific emission lines/bands, i.e. N2 SPS(0,0) (340 nm BPF), atomic oxygen (780 nm BPF), and hydroxyl radical OH (310 nm BPF).
Download figure:
Standard image High-resolution imageAll features that were described previously during the different phases are visible in figure 5. Emission from N2 SPS(0,0) looked at first very similar to the general light emission profile from figure 4. However, when compared to the emission from atomic oxygen it was observed that the nitrogen band was slightly more luminous in the bottom half of the plasma channel, while atomic oxygen was more present in the top half. Excited OH was mostly present during the main-breakdown phase as well as the cathode-glow (from −7 to −2 µs) close to the liquid throughout all three phases.
The results obtained using the BPFs during the falling voltage slope are not included in this manuscript, since they provide no extra information. The same gentle division between the top part and bottom part in molecular nitrogen emission and atomic oxygen emission was observed. Excited OH was only observed during the main breakdown phase, since there was no light emission close to the surface as was already shown in figure 4 except for shortly during figure 3(n).
3.3. Grounded potential
Next, the results from the second case will be presented, where the liquid was connected via a 1 kΩ resistor to ground. The current that flowed through this resistor, named  , was monitored as well. The measured voltage-current waveforms can be seen in figure 6. The terms anode and cathode are used in the conventional physical way, where the anode is considered positive and cathode negative, instead of the definition used for electrochemical cells based on where oxidation/reduction occurs.
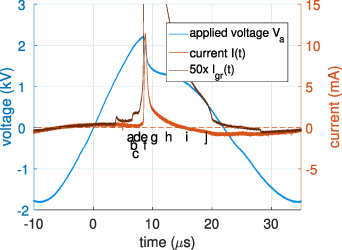
Figure 6. The voltage-current characteristics for the case where the liquid is electrically grounded through a 1 kΩ resistor. The current through this resistor,  , is shown multiplied by 50 to visualize the pre-breakdown events. Enumerated letters are placed at distinct times/delays, corresponding to the images shown in figure 7.
Download figure:
Standard image High-resolution imageIt can be seen in the Lissajous plot in figure 2(b) that the charge-voltage dynamics of this case are distinctively different from the floating case. Instead of a parallelogram/elliptical figure typical for a DBD, a triangular shape was observed.
This is a direct consequence of grounding the liquid and it can be seen in figure 6 that only one major current peak of 11.3 mA was observed at approximately 8.7 µs. When a discharge occurs that makes contact with the liquid, as will be seen in the following figures, the system no longer behaves as a true DBD. This is because charge cannot be accumulated as it did in the floating case since it leaks away through the resistor.
The maximum peak of  cannot be seen in figure 6, since it is multiplied by 50 to highlight that two pre-breakdown current events that occur. Without multiplication the peak appears at 2.2 mA and the pre-breakdown signatures are not noticeable. Since the dielectric barrier behavior is partially inhibited, it can be argued that the memory effect (during the mean breakdown) is negligible. This means that the potential in the gas is close to the applied voltage, unlike the case of the floating potential. A significant distortion of the applied voltage was observed due to the discharge that occurred.
The enumerated letters (a)–(j) represent the time/delay of the images shown in figure 7. The images are again part of a kinetic series that has been used to construct the spatio-temporal image. The same acquisition settings have been used as during the floating potential case (figure 4), but the starting delay was 4.8 µs relative to start of sinusoidal voltage profile.
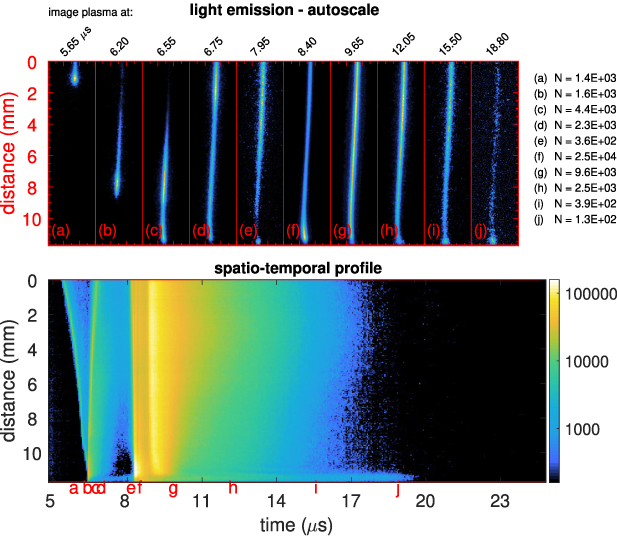
Figure 7. Light emission captured from the plasma at distinct times/delays with respect to the voltage-current waveforms. The images (top) were used to construct the spatio-temporal profile (bottom). The same acquisition settings were used as those in figure 3.
Download figure:
Standard image High-resolution imageFrom the individual images (top row figure 7) it can be seen that the grounded case was stable in time and the width of the single filament discharge along the channel appeared constant at approximately 250 µm.
The plasma dynamics shown in the spatio-temporal image can again be divided into various phases. The pre-breakdown phase includes figures 7(a)–(d). In this case, a more conventional ionization wave/front (i.e. plasma bullet) was observed moving from the capillary towards the liquid. The maximum light intensity was in the head of the cathode directed streamer. Upon impact with the surface, a rebound ionization front was observed causing an anode directed streamer [24]. These two features did not cause a significant increase in current, as can be seen in figure 6, but only a minor change of 20 and 40 µA through the grounded resistor, respectively.
The main-breakdown event was observed around the current peak at 8.8 µs and included figures 7(e)–(g). The maximum light emission, observed in figure 7(f), was close to the liquid surface. During the time the current reached it maximum, the light emission temporarily decreased to rise again until 9.6 µs (figure 7(g)).
In this case there is no clear post-breakdown phase. The light emission simply decreased back to zero, which took approximately 8 µs. The reason why this phase of the plasma dynamics was missing is related to the applied voltage profile. The applied voltage had already passed its extreme and was decreasing back to zero, which prevented any new discharge features to appear. The last light emission feature to disappear was the continuous cathode-glow close to the liquid surface that had been present since the pre-breakdown phase.
The spatio-temporal images obtained for the grounded case while using various BPFs were very similar to the ones observed in figure 5, following the features as shown in figure 7. For this reason they are not included in this manuscript. Besides the main-breakdown, emission from excited OH was observed continuously at the liquid as part of the cathode-glow.
4. Thomson scattering results
The Thomson scattering results are shown in figure 8 for the case where the liquid was at floating potential and figure 9 for the grounded case. The timing is relative to the change of polarity of the applied sinusoidal voltage. The temporal Thomson scattering results were obtained at a spatial position in the center of the gap, at approximately 5 mm from both the liquid and the edge of the capillary.

Figure 8. Thomson scattering results for the plasma jet impinging on the liquid at floating-potential, (a) during the rising of the voltage slope and (b) during the falling. Grey traces of the current peaks are added for visualization and the time is relative to the change in polarity of the applied sinusoidal voltage.
Download figure:
Standard image High-resolution image
Figure 9. Thomson scattering results for the plasma jet impinging on the liquid grounded via a 1 kΩ resistor, during the positive half period. A grey trace of the current peak is added for visualization and the time is relative to the change in polarity of the applied sinusoidal voltage.
Download figure:
Standard image High-resolution image
Generally, when the electron density is relatively high, i.e. between 5 × 10¹⁴ and 1 × 1015 cm−3, a fast acquisition of 2 min (containing 1200 exposures) was sufficient to obtain the Thomson signal. For lower densities, more exposures were required, up to 12000, taking 20 min to acquire.
In the floating potential case, during the rising of the voltage slope, a maximum electron density was detected of 6.3 × 1014 cm−3 and a temperature of 3.3 eV. This coincided with the positive current peak and thus the main-breakdown phase that appeared approximately 2.5 µs before the polarity of the applied sinusoidal voltage changed from negative to positive. The electron temperature decreased to 1.3 eV within 500 ns. The electron density decreased rapidly as well, but rose to 1.2 × 1014 cm−3 during the post-breakdown phase at 3 µs. During this last phase the electron temperature increased only mildly to 1.5 eV.
During the falling of the applied voltage slope similar results were obtained. The maximum electron density was 6.0 × 1014 cm−3 during the main-breakdown phase indicated by the trace of the negative current peak shown in figure 8(b) in grey. It decreased to 3.5 × 1013 cm−3 in 1.6 µs. The electron temperature decreased from 3.1 eV to 0.9 eV in 1.1 µs. During the post-breakdown phase, between 2 and 6 µs after the polarity had changed from positive to negative, the electron density rose to 5.9 × 1013 cm−3 and the temperature to 1.5 eV.
For the second examined case where the liquid was grounded via a 1 kΩ resistor, the obtained electronic properties during the main-breakdown phase are shown in figure 9. The maximum electron density and temperature were 1.1 × 1015 cm−3 and 4.3 eV. The temperature decreased within 1 µs to 1.4 eV, while the electron density took 2.5 µs to decrease to 4.9 × 1013 cm−3.
5. Discussion
For the floating-case, two main discharge events were observed respectively during the rising and falling of the applied voltage slope. This follows typical DBD behavior and can be understood by estimating the gap voltage using a memory potential (equation (3)). For the grounded-case, the DBD-like behavior was altered as was visualized in the charge-voltage Lissajous figure 2(b). This could explain why only one discharge was observed during the positive half period.
The structure of the discharges were remarkably similar, since they consisted of thin (250 µm) repetitively stable, single filament spanning from the capillary to the liquid. For argon discharges it is normally more common to observe non-repetitive branching during the propagation of an ionization wave but that was not observed in this investigation. Due in part to careful optimisation of the gas flow, electrode geometry and applied voltage parameters. This made it ideal to perform laser diagnostics on, such a Thomson scattering experiments.
Both discharge events in the floating case and the single event in the grounded case were examined by dividing them in distinct breakdown phases. In this context, 'breakdown' refers to a semi steady state periodic behavior, and not the initial 'breakdown' when the jet is turned on for the first time [25]. The latter and initialization of the jet is out of the scope of this work. It has been shown that the rising-floating-case had a (liquid) cathode-glow pre-breakdown phase, that the falling-floating-case lacked. The grounded-case had a more conventional 'plasma bullet'-like pre-breakdown phase. These three different pre-breakdown phases show the importance of the applied voltage polarity in conjunction with pre-existing surface charges.
Limited experimental research has been done on the deposition of surface charge by plasma jets, since it is a non-trivial measurement to perform. Experiments exploiting the Pockels effect using electro-optic BSO crystals have shown some insight in the dynamics of the (surface) memory effect. It was shown for both AC and pulsed excited jets that the positive charges deposited during the positive current peak remain at the targeted surface until a negative discharge reaches it which then deposits negative charges [25–28]. This could suggest that the (liquid) cathode-glow pre-breakdown is caused by negative surface charges (deposited in previous period) in a positive potential environment. During the falling voltage slope, positive surface charges are present in a negative potential environment, but no anode-glow pre-breakdown was observed. This could be because a higher potential is needed to initiate this pre-breakdown or the mobility of the positive charges is different from negative ones.
For the second examined case (grounded potential) there are likely no or less surface charges remaining from a previous discharge since the liquid is electrically grounded. This means that the pre-breakdown phase is altered and a more conventional plasma bullet behavior is seen.
The main breakdown was similar for both discharges in the floating case and the grounded case, lasting for approximately 2–3 µs. The light emissions were comparable and an order of magnitude higher than the other phases. A temporal decrease of light emission was observed when the current reached its maximum.
Thomson scattering experiments performed in the center of the plasma plume revealed that electron densities follow the general trend of the light emission. During the main-breakdown phase the maximum densities and temperatures were 6.0 − 6.3 × 1014 cm−3 and 3.1–3.3 eV for the two discharges in the floating case and 1.1 × 1015 cm−3 and 4.3 eV for the discharge in the grounded case. Two possible reasons for the higher values of electron densities and temperatures in the grounded case can be given. The first is a higher breakdown electric field in the gap, because the potential in the liquid is not floating but grounded via a 1 kΩ resistor. The second reason is related to left-over charges, thus the memory effect. Since there is only one discharge per period instead of two and charges in the liquid can flow to the ground it is reasonable to assume that there are less left-over charges that normally would assist in the breakdown and to a lowering of electron densities and temperature.
Most research related to argon jets with Thomson scattering involved plasma torches (i.e. hot plasmas) operated at radio-frequencies [19, 29, 30]. These show similar electron densities (1 − 10 × 1014 cm−3) but lower electron temperatures (0.3–2 eV). Pulsed jets in the kHz regime offer perhaps a better comparison, but most of them have been operated in helium rather than argon [31–33]. Interestingly, electron temperatures are reported in the same range (1–3.4 eV), while electron densities are an order of magnitude lower (2 × 10¹²–1 × 1014 cm−3). The latter might be a direct consequence of helium being used; however, since the applied voltage is pulsed instead of sinusoidal a true comparison is difficult to make. A pulsed argon jet operated at 5 kHz showed densities of 2 × 10¹²–7 × 1013 cm−3 and a temperature of 0.2–4.5 eV [34], but this jet was operated without a target. In this study, the jet used is different from these kind of jets since its operation, stability and properties are directly dependent on the presence of the liquid target. Without the liquid target the stable single filaments would not be present thus there would be no stable free jet.
In the floating-case, the main-breakdown phase was followed by a post-breakdown phase, which was not observed in the grounded-case. This is because the post-breakdown phase is generated by a continuation of increasing applied voltage. This does not occur for the grounded case since the maximum voltage was already reached during the main-breakdown phase. The post-breakdown light emission coincided with a rise in electron density to 1.2 × 1014 cm−3 during the rising voltage slope and 5.9 × 1013 cm−3 during the falling slope. The electron temperature did not increase above 1.5 eV.
This result is due to a balance between the increase of applied voltage, charge accumulation at the surface and the plasma discharge dynamics coupling the two. This balance is the reason for the timing/dynamics of the post-breakdown phase as well as the value of electron temperature and density that is reached and detected. The factors that influence this balance and thus these values are yet to be examined, but it is likely many factors play a role e.g. argon-in-air gas mixing, liquid volume/surface area, and/or gap distance.
Another similarity between the rising-floating-case and the grounded-case was the existence of a luminous area at the liquid surface during the main- and post-breakdown phase, which did not appear in the falling-floating-case. This suggests it was caused by the positive potential distribution, hence the name (liquid) cathode-glow layer. This implies secondary electron emission from the liquid may play a role [17]. The cathode-glow layer is a major contributor to the light emission of excited OH, together with the main-discharge phase. This likely has direct consequences for the production of hydrogen peroxide in the liquid, which is an important chemical for applications based on plasma activated water [8, 35].
6. Conclusions
A comprehensive study of a kHz-driven AC argon jet interacting with a liquid target has been discussed in this manuscript for two cases. In the first case, the liquid surface was at a floating potential, while in the second case it was grounded through a 1 kΩ resistor. These cases have been chosen to represent various conditions found in applications ranging from biomedical treatment of samples and plasma activated water to electrochemical cells.
The electrical characteristics of the discharges and the light emission showed that the two cases share some similarities but also have distinct differences. The main-breakdown phase for the two discharges in the floating potential case and the single discharge in the grounded potential case appear similar in dynamics although the electron density and temperature are higher for the grounded case. The pre-breakdown phase that precedes the main phase however is different for all three breakdown events and a post-breakdown phase was only present when the liquid was at floating potential. This shows the effect on plasma dynamics of the presence of a conductive path between the liquid and a ground preventing a rise in potential at the surface due to charge buildup.
As stated, sinusoidal jets are often used for applications but insight into their electronic characteristics such as the temporal behavior of the electron density and temperature are limited in the literature. This work demonstrated that the interaction of a kHz-AC plasma jet with a liquid target is complex, and the discharge dynamics are extremely sensitive to the coupling between the plasma, the target and the external ground.
Acknowledgment
The authors would like to acknowledge the UK Engineering and Physical Sciences Research Council for their support through grants: EP/S025790/1, EP/N021347/1, and EP/R041849/1.
Data availability statement
The data that support the findings of this study are available upon reasonable request from the authors.