

Abstract
Renewable electricity will likely play a substantial role in a decarbonized energy system, and there are well-known seasonal patterns to renewable electricity output. We can manage these seasonal fluctuations by overbuilding our electricity generation capacity, implementing seasonal storage, or managing our energy demands seasonally. If industrial processes are more integrated with the broader energy system, they could play a role in managing these seasonal patterns, as they do not directly serve life-sustaining energy demands, and their products may be stored and sold at a later date. Here, we combine GDP, manufacturing, and energy consumption data to look at how existing manufacturing facilities operate, focusing on the utilization of their operating capacity and how utilization correlates with state-level energy consumption. Of the 12 states with the largest manufacturing energy demand, we find that they use an average of 75%–81% of operating capacity between 2014–2018. In most of these states, there is a positive relationship between energy consumption and capacity utilization, and decreasing 10% of manufacturing capacity utilization could translate into energy savings that are relatively large when compared to electricity sales for the same time period, implying that seasonal ramping of industrial production could play a substantial role in adjusting to seasonal energy trends.
Export citation and abstract BibTeX RIS

Original content from this work may be used under the terms of the Creative Commons Attribution 4.0 licence. Any further distribution of this work must maintain attribution to the author(s) and the title of the work, journal citation and DOI.
1. Introduction
Decarbonizing our energy systems will require substantial changes across many sectors of our economy. Many processes that make use of fossil fuels will need to transition to using electricity, and our electricity must be generated using zero-carbon sources [1]. Renewable electricity sources are low-cost zero-carbon resources, but they introduce new challenges for maintaining grid reliability. The variability of renewable resources occurs on different timescales: there are short-term variations (on the order of minutes to hours) in solar and wind output, but also seasonal trends that dictate how much electricity can be generated (summer doldrums, winter). While we have made progress to develop technologies and policies that are effective for controlling short-term variability (e.g. battery energy storage, demand response policies), we have fewer existing tools for long-duration seasonal storage: geological hydrogen or compressed air sequestration and new battery chemistries, are some potential solutions, though projects for long storage durations are still in early stages.[2, 3] Estimates of the amount of long-duration storage necessary vary depending on assumptions about the expansion of transmission, the exact mix of zero carbon sources (e.g. wind, solar PV, and nuclear) and the availability of direct air capture and carbon capture and sequestration to keep fossil fuel plants online [2, 4, 5].
Long-duration storage cycles infrequently (a few times per year), and thus to maintain a low overall cost of electricity, standalone long-duration storage must have exceptionally low capital costs to compensate for the low capacity utilization. Even if long-duration storage only cost $10 kWh−1 of storage capacity and charging is free, cycling twice per year for 20 years at 10% discount rate results in a stored electricity cost of nearly $0.60 kWh−1 (see notes in SI). However, the manufacturing sector may provide an alternative pathway for shifting energy demand. Although some post-WWII manufacturing capacity utilization was near 100%, more recent utilization has been lower, averaging 75% between 2010 and 2018, as shown in figure 1. This remains true even as overall industrial output has grown, implying a combination of expanded facilities and efficiency improvements. Given the low capacity utilization, it could be feasible to transition some U.S. manufacturing energy use to increase energy demand during times of abundant renewable electricity, and design new demand response programs to incentivize curtailments of energy use in the seasons when renewable electricity is less abundant, especially since these are often predictable, seasonal patterns. A factory that currently averages 75% capacity utilization in all 12 months of the year could reduce capacity utilization to 50% in one month and increase utilization to 100% in a month when renewables are abundant, and still average 75% capacity utilization over the year. This is different from other analyses, which aim to estimate how industrial processes could adapt to use variable renewable energy for short durations. Instead, this is more similar to how manufacturing facilities have previously used fluctuations in product prices (e.g. metal prices) to schedule holidays [6].

Figure 1. Monthly manufacturing capacity utilization and indexed production for the US from 1972-2020. Capacity utilization is well below 100%, even as overall production capacity has increased. Economic recessions are shown in shaded gray regions [7, 8].
Download figure:
Standard image High-resolution imageHere, we examine the recent (2014–2018) state-level manufacturing capacity utilization, and compare this with monthly trends in industrial energy consumption. We find that in many states there is a correlation between industrial energy consumption and manufacturing capacity utilization, and that relative to electricity demand for homes and businesses, small changes in manufacturing output can have large changes in monthly energy consumption, indicating that there is potential for shifting industrial capacity based on seasonal trends to reduce energy consumption during times of scarcity, and potentially reducing the need for new, single-purpose long-duration storage systems cycled a handful of times per year.
2. Methods
The primary data sources were EIA's state energy data series, St. Louis Federal Reserve Economic Data (FRED) reports on industrial production and industrial capacity utilization, and the Bureau of Economic Analysis state-level real GDP data. Additional details about the EIA data used are available in the SI.
2.1. FRED data
The Federal Reserve calculates industry-specific estimates of manufacturing output (indexed to 2012) and manufacturing capacity utilization, and combines these estimates into an overall capacity utilization for the whole U.S. manufacturing sector. Using these sector-specific capacity utilization estimates  and GDP data
  they use a Fisher index to impute monthly capacity [9]. We use the same formula (equation (1)) to calculate the state-level aggregate utilization factors,

We combine state-level real GDP data (indexed in 2012 dollars) and the sector-specific capacity utilization to estimate state-level manufacturing capacity utilization and indexed output. We combine these two figures to estimate an index of the total manufacturing capacity (normalized to 2012) in each state [10].
Finally, we combine the monthly energy consumption estimates with the monthly industrial capacity utilization factors for each state, for 2014–2018. Using these estimates, we estimate the strength of a simple linear relationship between overall manufacturing capacity utilization and energy consumption for each state.
3. Results & discussion
Figure 2(A) shows the annual estimate for each state's manufacturing energy consumption in 2018, adjusted to remove natural gas and oil production. Without fossil fuel production energy, several states have a smaller manufacturing energy consumption when compared with EIA industrial energy consumption. Figure 2(B) shows the percentage of the manufacturing energy consumption for which we have monthly or quarterly consumption data, and compares them to the US average. Where we don't have monthly or quarterly consumption data, we average the remaining annual manufacturing energy consumption data over the year. While Texas and Louisiana consumed the most manufacturing energy, energy sources with monthly and quarterly energy data available for both states is below the U.S. average. Both Texas and Louisiana consume a substantial amount of ethane, naphtha, propylene, and other petrochemicals which are not accounted for on a monthly basis at the state level [11, 12].
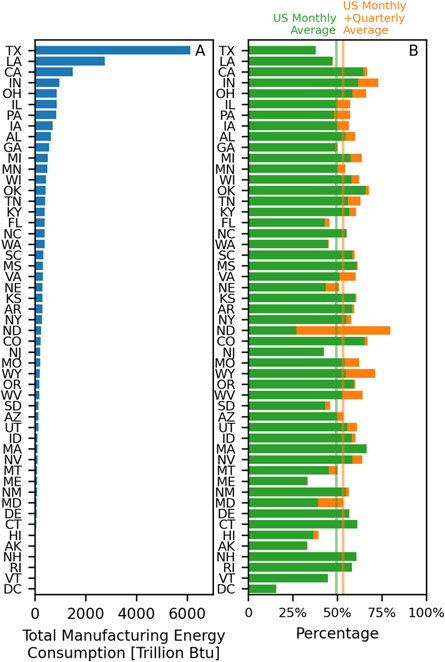
Figure 2. Total annual manufacturing energy consumption by state (A) in 2018 and percentage of annual manufacturing energy accounted for in monthly (natural gas and electricity), and quarterly (coal) data (B). Remaining manufacturing energy is averaged over the 12-month period.
Download figure:
Standard image High-resolution imageWe constructed estimates of the overall capacity utilization based on state-level GDP and sector specific information. We then plot these capacity utilization factors against the monthly manufacturing energy consumption for each state. The 12 states in figure 3 account for at least 2% of the 2018 U.S. manufacturing energy consumption (all 50 are shown in the SI). The data in figure 3 have been normalized to the average capacity utilization in each state. Of the states with substantial manufacturing energy consumption, only Michigan showed a weakly inverse relationship between energy consumption and capacity utilization, other states all showed a positive correlation between energy consumed and manufacturing utilization. Average capacity utilizations varied between 75%–81% over the time period considered. The inverse relationship between energy consumption and capacity utilization in Michigan may be a result of the type of manufacturing in the state: much of their manufacturing capacity is for durable goods, with vehicle manufacturing accounting for approximately 40% of manufacturing output (nationally, it is 6%). The trend could indicate either improved energy efficiencies from maximizing output at automotive factories or using more efficient facilities, or there may have been other improvements within the industry over the time period considered. For the other states in figure 3, nondurable goods manufacturing, which includes petroleum, plastics, and chemical manufacturing, is more balanced with durable goods manufacturing.

Figure 3. State-level energy consumption as a function of industrial capacity utilization from 2014–2018. Data are plotted for individual months, for the 12 states with the highest manufacturing energy consumption in 2018. We also plot a line of best fit with 95% prediction intervals for each state.
Download figure:
Standard image High-resolution imageFigure 4(A) shows the monthly energy savings possible if capacity utilization is reduced by 10% (in green) for each of the states. This is compared to the monthly electricity sales (for all sectors, in blue) and monthly manufacturing energy consumption. Estimates are shown for the mean and 95% confidence intervals. Figure 4(B) shows how the energy savings from utilization reduction compares to electricity sales and manufacturing energy consumption overall as a percentage. In some states, there isn't a significant energy savings because of the weak relationship between capacity utilization and manufacturing energy consumption. In many states, the mean energy savings from a 10% reduction in capacity utilization is equal to nearly 25% of the monthly electricity sales. In Iowa, reducing capacity utilization by 10% exceeds monthly electricity consumption. Iowa has a relatively small population (which keeps electricity sales low) but a large manufacturing sector, with ammonia and chemical plants, agricultural processing facilities (primarily for corn), and heavy machinery manufacturing.

Figure 4. Monthly industrial energy consumption, total electricity sales, and change in energy consumption associated with a 10% change in capacity utilization (A) for the 12 states with the highest industrial energy consumption. In many of the states with large manufacturing sectors, reducing capacity utilization by 10% reduces energy demand by an amount comparable to 25% or more of monthly electricity demand.
Download figure:
Standard image High-resolution image
4. Conclusions
This analysis is a first step to understanding the role of the industrial sector in providing seasonal arbitrage for a decarbonized energy system. We find that national trends in manufacturing capacity utilization translate to state-level data, with average capacity utilizations of 75%–80% in the 12 states with the highest manufacturing energy consumption. While the correlation between monthly manufacturing energy consumption and capacity utilization varies from state to state, we find that in many states, a 10% change in industrial output results in a change in energy consumption on the order of ¼ of the state's overall monthly electricity demand, although this is not true across all states. Given the underutilization of existing manufacturing capacity, it is possible that if manufacturing were scheduled around seasonal patterns in renewable electricity output, there is capability to manufacture and store goods at other points throughout the year without increasing the manufacturing capacity. How these manufacturing facilities will meet these seasonal trends may vary: some plants may idle or schedule routine maintenance, greatly reducing energy consumption and output for several days (a 3-day idling could account for 10% of energy consumption in a 30-day month), while some facilities may have the capability to vary their production, and thus energy consumption to be consistently lower across a whole month. All of these options are less demanding than ramping daily production to match solar or wind output, but the most appropriate strategy may vary depending on the manufacturing process and the type of good being produced. In states with large manufacturing sectors, this reduction in manufacturing energy consumption is large relative to current electricity demand, and a 25% reduction in electricity use is comparable to other estimates of monthly electricity provided by long-duration storage resources 13 . Future work will also examine which manufactured goods can be most readily and inexpensively produced with a variable schedule and stored on a seasonal basis. From our results, it seems that many non-durable goods may be good candidates, and there is already substantial storage capacity for petroleum products and other chemicals. However, some durable goods, like metals, may also be good candidates given their embodied energy.
It is also important to understand why capacity utilization rates have remained at approximately 75% in the post-war period, and whether this choice is intentional. If so, it is reasonable to expect that even industrial facilities that have not yet been constructed, but make use of decarbonized energy sources would want to incorporate this feature, and thus continue to serve as a resource for managing seasonal energy variability. Market mechanisms and incentives should also be designed to entice manufacturers to provide this seasonal flexibility and match the available resources with grid demands. Given the challenge of creating a net-zero energy system, we should not overlook the existing flexibility potential within the industrial sector.
Data availability statement
No new data were created or analysed in this study.