

Abstract
In response to the 2020 COVID-19 pandemic, policymakers worldwide adopted unprecedented measures to limit disease spread, with major repercussions on economic activities and the environment. Here we provide empirical evidence of the impact of a lockdown policy on satellite-measured agricultural land greenness in Badung, a highly populated regency of Bali, Indonesia. Using machine learning and satellite data, we estimate what the Enhanced Vegetation Index (EVI) of cropland would have been without a lockdown. Based on on this counterfactual, we estimate a significant increase in the EVI over agricultural land after the beginning of the lockdown period. The finding is robust to a placebo test. Based on evidence from official reports and international press outlets, we suggest that the observed increase in EVI might be caused by labour reallocation to agriculture from the tourism sector, hardly hit by the lockdown measures. Our results show that machine learning and satellite data can be effectively combined to estimate the effects of exogenous events on land productivity.
Export citation and abstract BibTeX RIS

Original content from this work may be used under the terms of the Creative Commons Attribution 4.0 licence. Any further distribution of this work must maintain attribution to the author(s) and the title of the work, journal citation and DOI.
1. Introduction
Bali is an important agriculture hotspot (see figure appendix A.1 available online at stacks.iop.org/ERC/3/051007/mmedia). 72% of its land is used for agricultural activities, and the agricultural sector was the second largest contributor to Bali's income in 2020 (BPS 2020). Aside from rice—the main cultivated crop -, farmers cultivate several horticulture commodities such as chayote, cabbage, and chilli (BPS 2018). The main source of income for the 4.4 Balinese people is however tourism: Bali is Indonesia's tourism engine and more than half of its economy depends directly on tourism (BPS 2020).
In response to the 2020 COVID-19 pandemic, policymakers adopted unprecedented measures to limit disease spread, with major repercussions on labour markets and economic activity. Tourism-dependent economies—where a large share of the local gross domestic product and of the workforce is employed in the touristic sector—have been among the worst hit by the restrictions. In fact, since COVID-19 outbreak in Bali, Indonesia, the tourism sector has been heavily affected by the restriction measures that the Indonesian government has taken following the rest of the world (BPS 2020). In April, Indonesia banned all foreign tourists (Minister of Law and Human Rights 2020). Nonetheless, the number of cases has kept increasing and as per the 27th of November 2020, there have been 13,730 cases reported according to the Bali Provincial Health Office (Kesehatan 2020). Travel restrictions, limited social activities, and interactions caused a dramatic drop down in the number of tourists in the island.
According to a report by the UN World Food Programme (UN World Food Programme 2020), to cope with the dramatic condition of the tourism industry, formerly the first source of income (Antara and Sumarniasih 2017), the Balinese labour force reallocated towards the primary sector. As stated by UN World Food Programme (2020), in Indonesia, 'the agriculture sector has served as a buffer during the pandemic, by absorbing labour released by other sectors' [and] 'the number of workers in the agriculture sector increased by 2.8 million between August 2019 and August 2020, while total employment in the country decreased. 'The UN report also highlights that Bali reported the highest increase in unemployment, from 1.6% in August 2019 to 5.6% in August 2020, and the sharpest decline in wages (−18%), which dropped below the minimum wage (CNN Indonesia 2020). These dynamics have also been widely reported by the international press, such as the New York Times (Laula and Paddock 2020), The Guardian (Firdaus 2020) and the Deutsche Welle (Deutsche Welle 2020), as well as by local universities (Udayana 2020). The process also coincided with a quick deurbanization. These dynamics have made agriculture-related activities central in people's daily lives as a financial lifeline.
Irrespective of this rich evidence background, due to the lack of official statistics there has been no empirical assessment of the impact of the COVID-19 lockdown on agricultural activity. This is also because the vast majority of the agricultural employment is either informal or family-run.
To empirically evaluate the short-run impact of the COVID-19 lockdown on agricultural land greenness (a proxy for agricultural productivity) in the Badung regency of Bali, here we leverage machine learning to analyse a time series of Moderate Resolution Imaging Spectroradiometer (MODIS) measured Enhanced Vegetation Index (EVI) and generate a counterfactual synthetic EVI based on gradient boosted decision trees trained on a set of environmental variables assuming no lockdown occurrence.
The key novelty of our analysis lies in the use of statistical analysis of satellite data to generate a counterfactual index of vegetation health over agricultural land and detect and statistically measure the impact of an exogenous event such as a lockdown policy. Our findings are consistent with the evidence provided by an UN report and several international news outlets of a labour market reallocation towards the agricultural sector driven by an exogenous shock (the COVID-19 pandemic).
The paper contributes to the multidisciplinary literature linking remote sensing of the environment, machine learning, and the econometric toolkit for policy evaluation.
2. Background
2.1. Estimating agricultural productivity with satellite data
The literature on the assessment of agricultural systems and productivity through the use of satellite data has proven the role that satellite imagery can play at a variety of scales (Jia et al 2019) and the depth of the insights that they can provide. This is especially true for developing countries (Lobell et al 2018), such as Indonesia (Yamamoto et al 2019). For instance, a large body of literature has shown that composite indexes based on multi-spectral satellite observations—such as the NDVI and EVI indexes—can be effective proxies to detect and forecast yield variation of a multitude of crops such as soybeans, rice, and wheat, even in smallholder agriculture, with results consistent with official yield statistics and correlation maps of historical yield data. Vegetation indexes are also well suited to study scattered agricultural topography and to inform management decisions on the optimal timing for planting and harvesting.
A recent review by Jia et al (2019) points out how advances in machine learning and the availability of data from earth observing satellites can dramatically improve the ability to map croplands over long periods and over large regions. This includes the capacity to link vegetation productivity to remotely sensed estimates of absorbed photosynthetically active radiation.
Lobell et al (2018) use data from a survey experiment in Uganda to evaluate the accuracy of Sentinel-2 remotely-sensed plot-level maize yields with respect to ground-based measures relying on farmer self-reporting. Similarly, Wolanin et al (2019) apply machine learning to a process-based model to estimate crop primary productivity from Sentinel-2 and Landsat 8 satellite data. They highlight the benefit of using the red edge bands from Sentinel-2 in increasing estimation accuracy. Cai et al (2019) integrate satellite and climate data to predict wheat yield in Australia using machine learning approaches. They highlight a generally very high estimation accuracy, with optimal prediction performance can be achieved two-month lead time before harvest. Burke and Lobell (2017) demonstrate the potential to track smallholder maize yield variation in western Kenya using a combination of 1-m Terra Bella imagery and intensive field sampling on thousands of fields over 2 years. They obtain R2 coefficients of up to 0.4. Their method can also detect positive yield responses to fertilizer and hybrid seed inputs.
Kubitza et al (2020) review literature on the use of satellite data to assess adoption and impacts of agricultural management practices in developing countries. They find that in general satellite data are successful in detecting cropping intensity, tillage, crop residue cover, irrigation, and soil and water conservation. They highlight that only a limited number of studies has engaged with estimating yield impacts and the economic implications, irrespective of solid methodologies having been developed. Sjöström et al (2011) appraised the potential of MODIS EVI for modeling gross primary production across African Savannah ecosystems. In their study, EVI was found to correlate well with estimated GPP on a site-by-site basis.
Son et al (2014) carry out a comparative analysis of multitemporal MODIS EVI and NDVI indexes data for large-scale rice yield estimation in the Mekong River Delta. They find that the approach could be used to estimate rice production prior the harvesting period through the use of physical crop yield models, and that EVI-based models were more accurate than those from NDVI-based models. Their correlation coefficients (R2) range from 0.62 to 0.71 for spring-winter and 0.4 to 0.56 for summer-autumn rice crops, respectively. Figueiredo et al (2016) estimated correlation maps to assess historical yield during the soybean crop cycle from EVI data in Paraná State, Brazil. Their model was able to explain 96% to 98% of the variance in estimated yield from correlation maps.
Duveiller et al (2012) demonstrated how it is possible to monitor the growth and evolution of winter wheat over a decade using the green area index (GAI) even on a highly fragmented topography characterized by non-wheat areas within the spatial resolution of MODIS. Their results are congruent with ground trough data at both the regional and the filed level with a relative root mean square error (RRMSE) of 25.7% and 37.6%, respectively.
Jain et al (2017) developed a 30-meter resolution yield maps to explore the causes of yield gaps of smallholders in the Indo-Gangetic Plains, India. Using a crop model simulation, the authors were able to rely only on satellite vegetation indices without the need for any ground data. Finally using Random forest the authors proved that roughly 80% of the variance in yields is explained by differences in the weather conditions and management practices (such as the saw timing)Their results suggest that yield could be increased by 11 to 32% if more focus is given to the later.
2.2. The impact of COVID-19 on labour markets
The COVID-19 pandemic is exerting enormous pressure on the global economy in both higher and lower income countries. The observed labour market responses have however been remarkably different (Bartik et al 2020): in high income countries a significant share of the population is employed in the tertiary sector and could therefore move to home working without significant changes in the work productivity. Workers of more affected sectors could receive compensation and income support schemes from national governments, which overall mitigated the short-run household income plunge.
Conversely, in middle and lower income countries many people's incomes largely depend on agriculture, handcraft or tourism (Danquah et al 2020). The latter was one of the most affected sectors: according to recent estimates (WTTC 2020), up to 75 million tourism sector workers are at immediate job risk as a result of COVID-19, with a travel tourism GDP loss in 2020 of up to $2.1 trillion. Yet, lower income countries' governments often lack the means to support workers who lost their jobs as a consequence of COVID-19 limitations on social interactions. In these regions, populations were thus hit more harshly by the pandemic, and faced the necessity to adopt autonomous adaptation actions to try to compensate for the reduction or lack of their previous income (Ataguba 2020). Reports have shown that many tourist workers have decided to go back to their towns of origin to pursue agricultural activities and mitigate the labour demand shock in their previous employment sectors (UN World Food Programme 2020, Laula and Paddock 2020).
2.3. Study area
Badung is one of the 9 regencies in the island of Bali, Indonesia. It spans over 418.52 km2 (figure 1) from north to south and consists of 6 districts and 46 villages (table 1. Like the rest of the island, Badung Regency relies on tourism as its main source of income but according to Indonesian Central Bureau of Statistics (BPS 2020), it is also the richest regency (the revenues in 2019 Badung were higher than the total revenues from other 8 regencies in Bali), the one with the highest minimum wage (IDR 2,9 million), the lowest percentage of people in poverty (1.78%) and the one that has experienced the highest annual population growth rate from 2010-2019 (2.36%). Based on recent statistics, around 140,000 people in Badung regency work in the tourism sector, and only 3,000 work in agricultural-related activities (BPS 2020).
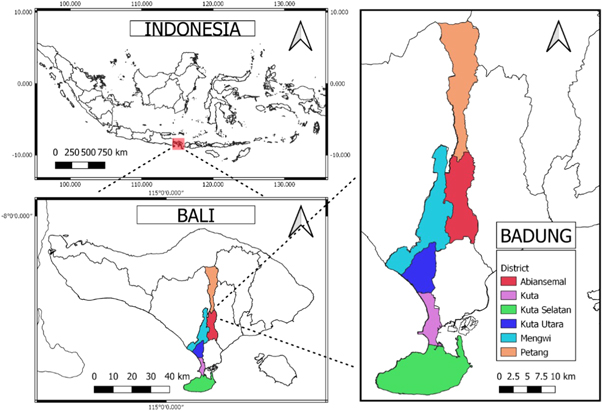
Figure 1. Map of the Badung Regency and its geographical position.
Download figure:
Standard image High-resolution imageTable 1. Districts of Badung.
| District | Area (km2) | Percentage of Area | Avg. distance to Denpasar (km) |
| Kuta Selatan | 101.13 | 24.16 | 18.3 |
| Kuta | 17.52 | 4.19 | 9.5 |
| Kuta Utara | 33.86 | 8.09 | 6.6 |
| Mengwi | 82 | 19.59 | 15 |
| Abiansemal | 69.01 | 16.49 | 15 |
| Petang | 115 | 27.48 | 30 |
Note. Source: Central Bureau of Statistics Indonesia Badung Regency (2020).
According to the Central Bureau of Statistics (BPS 2020), its two biggest districts are Petang and Kuta Selatan. The southern districts (Kuta, Kuta Selatan, Kuta Utara) are characterised by a strong tertiary sector that has been constantly growing together with the population living in the three districts. On the other hand, the northern districts (Mengwi, Abiansemal, Petang) are mostly agricultural areas where the population has remained overall steady in the last few years and tourism has grown slowly as compared with the south. The population of Kuta Selatan, the center of tourism activities of the island, grew by 4.4% in 2018-2019, while the population of Petang, the center of agricultural activities declined by −0.22% in the same period.
Badung, and in particular its northern districts, is also an important agriculture hotspot: 45% (190.49 km2) of its territory (418.52 km2) is devoted to agricultural activities (see figure appendix A.1). Most rice fields are located in the southern area of Badung (which has lower altitude). In contrast, non-paddy commodities are located in the northern area of the regency, where the most important horticulture commodities are coconut (201,840 ha), rice (12,943.13 ha), chayote (152 ha) and chilli (105 ha) (BPS 2020).
A tropical climate characterises Badung and more in general Bali, with monsoon from October to April (wet season). According to data from Meteorogical, Climatological, and Geophysical Office—Region III Denpasar (BPS 2020), January is the period with the most abundant precipitations (about 340 mm) and highest number of rainy days (18 days).
3. Materials and methods
3.1. Data sources and processing
The analysis is based on remotely sensed environmental and atmospheric data detailed in table 2. The data includes the MODIS EVI and the variables used as predictors in the model. A time series is assembled based on data from the beginning of 2010 to 9th of July 2020. Raw data is processed in Google Earth Engine (Gorelick et al 2017), where each remotely-sensed variable is first masked over cropland pixels (as from the GFSAD1000 gridded cropland product (Teluguntla et al 2015); then, the mean value of each variable is extracted for each of the 6 districts of Badung for each day of the period considered.
Table 2. Input data table.
| Data product | Variable | Source |
|---|---|---|
| GFSAD1000: Cropland Extent 1km Multi-Study Crop Mask | landcover | Teluguntla et al (2015) |
| MODIS Terra Daily EVI | EVI | Huete et al (2002) |
| CHIRPS Daily: Climate Hazards Group InfraRed Precipitation with Station Data (version 2.0 final) | precipitation | Funk et al (2015) |
| MOD11A1.006 Terra Land Surface Temperature and Emissivity Daily Global 1km | LST_Day_1km | Wan et al (2015) |
| ERA5 Daily aggregates—Latest climate reanalysis produced by ECMWF / Copernicus Climate Change Service | u_component_of_wind_10m, v_component_of_wind_10m | Cucchi et al (2020) |
| CFSV2: NCEP Climate Forecast System Version 2, 6-Hourly Products | Maximum specific humidity 2 m above ground, 6-hour interval | (Saha et al 2011) |
| MOD16A2.006: Terra Net Evapotranspiration 8-Day Global 500 m | Total evapotranspiration | Running et al (2017) |
| Bali shapefile | Administrative boundaries | Center for the Management and Dissemination of Geospatial Information. Indonesia Geospatial Information Agency Accessed 2020-11-27 from https://tanahair.indonesia.go.id/portal-web/download/perwilayah |
The processed data are imported into the R scientific programming environment, where the data. Table (Dowle et al 2019), caret (Kuhn et al 2008), and Xgboost (Chen et al 2015) packages are used for statistical analysis.
Before the model training stage, missing data (19%) are imputed through a chained random forest Stekhoven and Buhlmann (2011) as implemented in the package MissRanger Mayer (2019) where each variable containing missing values are imputed by using all the other variables as predictors iteratively until the mean out-of-bag (OOB) error reach its minimum value. Finally, a Savitzky-Golay filter is applied to remove the noise that characterises satellite data (see Chen et al (2004)).
3.2. Agricultural indexes considered
The technological advances and the need to account for the specific features of a given study area have brought researchers to develop a multitude of vegetation indexes (Viña et al 2011). For example, the EVI (Enhanced Vegetation Index, equation (1)) was developed to better account for atmospheric conditions and light reflection from the ground that causes several issues with the traditional NDVI (Normalized Difference Vegetation Index) measurement (equation (2)).


where NIR, RED, and BLUE represent the wavelength bands measured by a satellite.
In particular, the EVI includes additional wavelengths and adjustment parameters to correct for the inaccuracies of NDVI (Huete et al 2002). Variations in solar incidence angle, atmospheric conditions like distortions in the reflected light caused by the particles in the air, and signals from the ground cover below the vegetation are corrected for using EVI. Moreover, the NDVI is mostly chlorophyll sensitive, while the EVI is more responsive to canopy structural variations (Morcillo-Pallarés et al 2019).
3.3. Statistical modelling
3.3.1. Time-Series Prediction of EVI in a machine learning framework
In order to estimate the causal effect of the lockdown on cropland greenness, we compare the factual EVI time series of the study area of interest with a simulated EVI time series based on gradient boosted decision trees. In other words, we use historical data to build a counterfactual. The difference between observed values of EVI and the counterfactual is the effect of the lockdown on cropland greenness, a proxy of agricultural activity and productivity.
We applied the extreme gradient boosted decision trees algorithm (Friedman 2001) on the first 9 years (from the 1st of January 2010 to 1st April 2019) of data for each of the 6 districts of Badung. To enhance the accuracy of the model and to account for trends and seasonality, we generate several lagged features for each predictor and calculated the average values of temperature and humidity over the previews 15 and 30 days and the precipitation accumulation for the same time period. We also include year, month, day, week of the year, day of the year, and sine and cosine function of time (for week, month, and year) as additional predictors. We use a 10 fold cross-validation with a random search over 100 parameters to find the best hyperparameters (Wright and Ziegler 2015) and evaluate the model performance with the root mean square percentage error (RMSPE). Finally, the year preceding the lockdown (from the 2nd of April 2019 to the 1st of April 2020) is used as a test set.
3.3.2. Lockdown effect on EVI estimation
After model training and testing to generate the synthetic projection, we estimate the effect of the lockdown as the difference between the synthetically estimated time series and the actual data (ΔObserved,Counterfactual ) before and after the lockdown. An analogous methodology is applied in Granella et al (2020) to estimate the effect the lockdown on pollution levels.
We subtract our prediction to the observed value of EVI and we estimate the difference-in-differences linear regression using ordinary least squares (OLS) as per equation (3):

where yit is EVI measured on district i on day t, ρit is the predicted value, and T is a dummy equal to 1 during the lockdown (from 1st April 2020 to the 9th July 2020) and 0 prior to it (from 2nd April 2019 to the 31st March 2020). We weight each observation based on the cropland area (measured in square meters) for each district to account for differences in agricultural land surfaces.
Several consideration support our choice of assessing the lockdown impact starting from April 1st 2020:
- It is the date of the official lockdown beginning in Bali.
- It roughly ( ± one week) coincided with the date when most EU countries, the United States, and Australia—the main origin countries of international tourists—put their lockdown policies into force (Hale et al 2021).
- Even for the few countries where the lockdown begun about two weeks earlier (e.g. Italy), many tourists were still in Bali when the lockdown had begun in their countries of origin.
We consider the formal conclusion of the lockdown of July 9th, as after that date the Indonesian government allowed internal flights. Hence local tourists were able to come to Bali. Extending our analysis further would capture a mix of effects, namely the lockdown effect and the local tourism effect.
3.4. Robustness checks
To ensure that our results are not driven by a different treatment than the lockdown, we run a placebo test. We estimate equation (3) from April 2nd 2019 to March 31st 2020, with T being equal to 1 from April 2nd 2019 to July 9th 2019 and 0 afterwards. To carry out the test we: (i) drop all the outcomes for treated observations after they receive treatment (the beginning of the lockdown); (ii) insert a phantom treatment event in the middle of the remaining data (we select one year before the lockdown); (iii) run the linear estimation model and evaluate the significance of the β coefficient from equation (3).
To further appraise the attribution of the measured effect to the lockdown, we test additional specifications of equation (3) where monthly, weekly, and daily fixed effects are included as additional regressors.
4. Results
4.1. ML model training and testing
Table 3 presents the R-squared (R2), root mean square percentage error (RMSPE), and mean absolute percentage error (MAPE) for both the training dataset (from the 1st of January 2010 to 1st April 2019) and test dataset (from the 2nd of April 2019 to the 1st April 2020) for the whole study area as an average of the 6 districts. Figure 2 illustrates the average observed and predicted value of EVI for the whole regency of Badung before and after the lockdown.
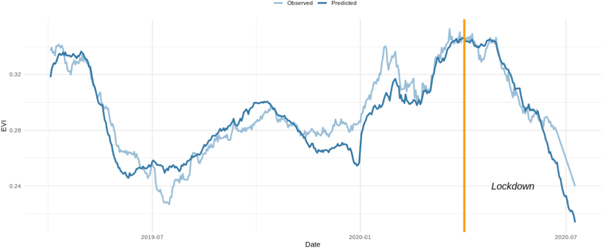
Figure 2. Time series of EVI index (observed and counterfactual) in Badung.
Download figure:
Standard image High-resolution imageTable 3. Model training and testing benchmarks.
| Dataset | R2 | RMSPE | MAPE |
|---|---|---|---|
| Train | 0.948 | 0.040 | 0.030 |
| Test | 0.738 | 0.067 | 0.053 |
The results show that our model is able to closely learn the historical EVI variation over agricultural land in Badung based on our set of atmospheric and seasonal predictors, with a training accuracy of 95%. When testing the trained model on unseen data (the future, compared to the training data time span), the model performs relatively well, with a testing accuracy of 74%.
4.2. Lockdown impact on agricultural activity
Table 4 reports the results of the effect estimation model of equation (3). We find that the lockdown has on average increased the value of EVI on the whole Badung regency by 0.003 52 which corresponds to an increase of 1.17%, from the average values that would have been observed had the epidemic not occurred. This result is highly statistical significant.
Table 4. Lockdown impact on ΔObserved,Counterfactual and heterogeneity effect on Northern and Southern Districts.
| Badung | North | South | |
|---|---|---|---|
| Lockdown | 0.003 52*** | 0.003 72** | 0.002 86 |
| (0.00103) | (0.00124) | (0.00164) | |
| Intercept | 0.003 47*** | 0.005 18*** | −0.00200*** |
| (0.00055) | (0.00069) | (0.00055) | |
| N | 2790 | 1395 | 1395 |
Note. Standard errors are heteroskedasticity robust. *** p < 0.001; ** p < 0.01; * p < 0.05.
The results of additional specifications of equation (3) where monthly, weekly, and daily fixed effects are added as additional regressors are found in the table appendix A.1. The coefficient for the lockdown remains positive and highly significant, reinforcing our attribution of the observed increase in the EVI index to the lockdown.
To explore the heterogeneity effect of the lockdown on the north and southern districts we run separate regression models for the two areas. It must be remarked that in the study area, the South is dominated by tourism and the tertiary sector while the North is mostly agricultural. Figures 3–4 illustrate the average observed and predicted value of EVI for the two geographical areas before and after the lockdown.
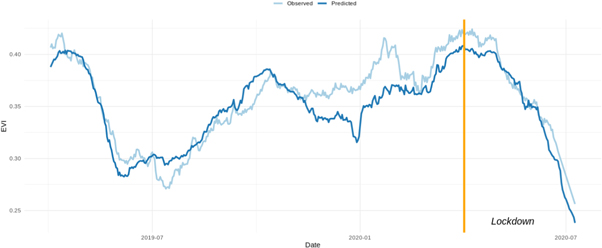
Figure 3. Time series of EVI index (observed and synthetic counterfactual) in North Badung.
Download figure:
Standard image High-resolution image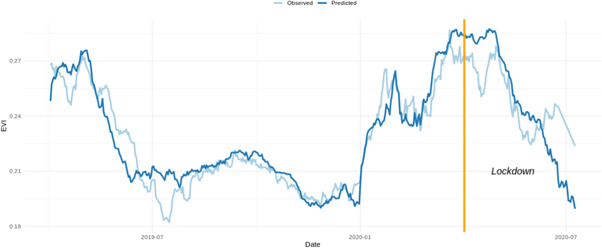
Figure 4. Time series of EVI index (observed and synthetic counterfactual) in South Badung.
Download figure:
Standard image High-resolution imageIn the north the EVI has increased by 1.06% while no statistically significant effect is measured in the south. This is coherent with the hypothesis that workers formerly employed in the tourism sector in the south might have moved back to their region of origin in the north to work in the fields and partially compensate for the income lost from previous employment.
4.3. Placebo test
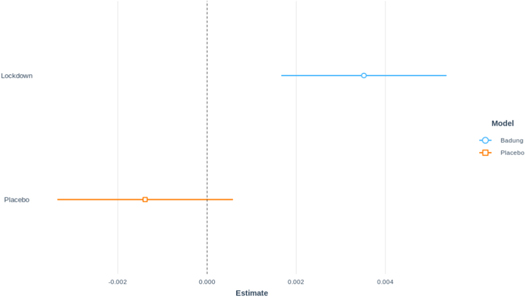
Table 5 and figure 5 report the result of the regression model based on equation (3) used to estimate the lockdown effect alongside the result of the placebo test in which the pseudo treatment is set one year before the real lockdown period.
Figure 5. Estimated impact of lockdown and of placebo test on EVI over agricultural land in Badung (95% confidence interval).
Download figure:
Standard image High-resolution image
Table 5. Lock-down effect (ΔObserved,Counterfactual ) on Badung and Placebo Test.
| Badung | Placebo | |
|---|---|---|
| Lockdown | 0.003 52*** | −0.00139 |
| (0.00103) | (0.00111) | |
| Intercept | 0.003 47*** | 0.003 85*** |
| (0.00055) | (0.00067) | |
| N | 2790 | 2196 |
Note. Standard errors are heteroskedasticity robust. *** p < 0.001; ** p < 0.01; * p < 0.05.
The results of the robustness check show that the placebo estimation is not statistically significant, while the true lockdown impact has a positive and highly significant impact on the measured EVI index over agricultural land in Badung. The finding thus allows as to further strengthen the causal interpretation of the analysis.
5. Discussion and conclusions
According to our analysis, the observed increase in the EVI index over Badung, Bali, following the COVID-19 lockdown would not have occurred in the absence of the lockdown. The combination of a counterfactual synthetic EVI based on gradient boosted decision trees with high level of training and testing accuracy and of a placebo test allows confidently linking the two events.
We estimate that the lockdown has on average increased the value of EVI on the whole Badung regency by 1.17%, from the average values that would have been observed had the epidemic not occurred. But what does a 1% increase in the EVI index over a short period of time represent? It certainly highlights a significant growth in the canopy structure, such as leaf area and plant physiognomy. Yet, given the large areal extent and heterogeneity in cultivated crops of the region inquired, a direct interpretation in terms of agricultural yield change is not possible. As an additional remark, in our study we estimate the short run impact of the lockdown (from May to July). Longer run analysis could shade light on more structural changes in agricultural production system.
While our approach enables estimating the effect of the lockdown on EVI, it does not provide conclusive evidence for attribution of the increase in the vegetation index to a labour force shift. Some evidence of a comparatively stronger greening in tourism-dominated areas is nonetheless offered by the finding that in the norther part of the region the EVI over cropland has increased by 1.06% while in the south no statistically significant effect is found. This find in line with the official report and journalistic evidence of a labour market reallocation towards the agricultural sector driven by an exogenous shock (the COVID-19 pandemic) on the demand for labour in other sectors. A potential explanatory mechanism for these dynamics is the following: a decline in the labour demand (and thus the relative wage) of the tourism sector crowded workers into the agricultural sector. For fixed land supply in the short term, land productivity increases as a consequence of more labor.
Moreover, it should be noted that our estimate for the change in EVI does not uncover the underlying mechanism. In terms of plant phenology, several concurrent reasons could explain this variation such as a decrease in bare soil: an increase in plants health due to greater plant care and a decline in pollution levels, but also a reduction in the amount of harvested crops due to reduced local food demand. We acknowledge the possibility that other factors affected by the lockdown could have contributed to these results. That is, we highlight the potential existence of a complex causal chain that goes from the lockdown to our outcome of interest. This issue calls for further analysis to unpack the black box of causality, for instance using mediation analysis, but this goes beyond the scope of our paper.
Additional limitations of our analysis and its findings consist of the potential uncertainty and error in remotely sensed observations and the scale of analysis in relation to data granularity. Overall our analysis contributes to the rapidly growing stream of literature linking remotely sensed data, machine learning modelling, and econometric causal inference. This is particularly relevant to evaluate policy impacts in near-real-time—when field or conventional data collection has not yet occurred. Developing regions with a low degree of mechanisation in agriculture and data scarcity issues are particularly suitable settings for replications and expansion of the methodology introduced in this paper.
Code and data availability
The R and Google Earth Engine JavaScript code to replicate the analysis and the figures are publicly hosted at https://github.com/athammad/baliLockDown. The repository includes references to retrieve the input data.
CRediT authorship contribution statement
Ahmed T. Hammad: Conceptualization, Methodology, Formal analysis, Software, Visualization, Writing—original draft, Writing—review & editing. Giacomo Falchetta: Conceptualization, Methodology, Data curation, Writing—original draft, Writing—review & editing. I. B. M. Wirawan: Visualization, Writing—original draft, Writing—review & editing.
Conflict of interest
Declaration of interest: none.
Funding
This research did not receive any specific grant from funding agencies in the public, commercial, or not-for-profit sectors.