
Abstract
Based on a mean-field description of thermodynamic cyclic voltammograms (CVs), we analyze here in full generality, how CV peak positions and shapes are related to the underlying interface energetics, in particular when also including electrostatic double layer (DL) effects. We show in particular, how non-Nernstian behaviour is related to capacitive DL charging, and how this relates to common adsorbate-centered interpretations such as a changed adsorption energetics due to dipole-field interactions and the electrosorption valency – the number of exchanged electrons upon electrosorption per adsorbate. Using Ag(111) in halide-containing solutions as test case, we demonstrate that DL effects can introduce peak shifts that are already explained by rationalizing the interaction of isolated adsorbates with the interfacial fields, while alterations of the peak shape are mainly driven by the coverage-dependence of the adsorbate dipoles. In addition, we analyze in detail how changing the experimental conditions such as the ion concentrations in the solvent but also of the background electrolyte can affect the CV peaks via their impact on the potential drop in the DL and the DL capacitance, respectively. These results suggest new routes to analyze experimental CVs and use of those for a detailed assessment of the accuracy of atomistic models of electrified interfaces e.g. with and without explicitly treated interfacial solvent and/or approximate implicit solvent models.
Export citation and abstract BibTeX RIS

Original content from this work may be used under the terms of the Creative Commons Attribution 4.0 licence. Any further distribution of this work must maintain attribution to the author(s) and the title of the work, journal citation and DOI.
1. Introduction
Cyclic voltammetry is a standard experimental technique for studying electrochemical interfaces that allows to infer surface compositions and interface reactions as a function of the applied electrode potential. In practice, cyclic voltammograms (CVs) are obtained by varying the electrode potential at fixed scan rate and measuring the current response of the electrode immersed in electrolyte solution. In general, CVs are characterized by potential regions within the stability window of the solvent which exhibit peaks of varying shape and height, and regions at low and high potentials, where faradaic, electrocatalytic reactions lead to exponentially increasing currents, e.g. due to the decomposition of the solvent. At high scan rates and/or in regions with faradaic reactions, CVs are governed by kinetic processes which typically induce a pronounced asymmetry for the forward and backward scan direction and/or a strong scan-rate dependence. Evidently, any theoretical description of such CVs necessitates the use of kinetic models [1], including potentially also macroscopic mass transport [2].
On the other hand, at low scan rates and in potential windows without faradaic side reactions this asymmetry typically vanishes as does the scan-rate dependence (when currents are appropriately normalized). In this case, CV peak positions and shapes are related directly to the underlying thermodynamics of the electrified interface [3], and such CV experiments provide invaluable contributions to the understanding of the latter. In turn, such CVs can be understood and simulated based on equilibrium thermodynamic considerations [4–12]. For such thermodynamic CVs the variation of the applied potential induces changes in the equilibrium surface charges, which can be traced back to changes in adsorbate coverages, as well as changes in the double layer (DL) charge, leading in sum to the observed electric current. As recently demonstrated for Ag(111) in halide containing solutions [13], DL charging does not only add capacitive currents, but also affects equilibrium adsorbate coverages and the number of exchanged electrons per adsorbate—as expressed by the electrosorption valency [13–16].
In this work we therefore analyze in most general terms thermodynamic CVs with included DL response. The derived equations can naturally explain non-Nernstian behaviour and introduce a sensitive dependence of CV peaks to the electrolyte, via its impact on the interfacial capacitance [17, 18]. We hope, these results might help in the future to better understand according experiments and thus also help to validate and improve theoretical models. This is in particular important as at present all (atomistic) theoretical models of electrified interfaces necessarily introduce approximations due to computational time constraints, e.g. in the complexity of the atomistic description (e.g. the surface with or without explicit water [19–23]), the quality of the energetics (e.g. empirical potentials [24]), the application of the electrode potential (e.g. absent or not [25–27], with explicit ions [28, 29] or an implicit solvent model [16, 22, 30–51]) or the derivation of macroscopic quantities (e.g. sampling [6, 10, 28, 52–56], mean field models [9, 13]).
Here, we start from a fully grand canonical, ab initio thermodynamics description of the interface and derive in a consistent way expressions for the grand canonical mean-field energetics that includes effects of the potential up to second order. This second order approximation will be referred to as the CHE + DL approximation as the terms up to linear order in the applied potential are identical to the terms frequently used to estimate the effects of the potential based on ab initio calculations at the potential of zero charge (PZC) and which is often referred to as the computational hydrogen electrode [19, 57] (CHE) method. The quadratic, higher order term, on the other hand, captures capacitive DL charging with an assumed potential-independent interfacial capacitance, which was already successfully applied in many other works [13, 16, 37, 46, 54, 58–63].
Naturally, the derived equations can be extended in a straightforward way to include any higher order response to the potential (e.g. of the DL capacitance), however, as we see later, any such energetics can not be treated analytically any more. At variance, the described CHE + DL level of theory is largely amenable to rigorous mathematical analysis, and yields straightforward expressions for thermodynamic CVs. These results in combination with additional approximations allow us to derive proxies for the position and the shape of peaks in according CVs that derive from electrosorption, which we then validate against the full theoretical description, and experiments. We demonstrate that both, peak positions and shapes, can be affected in a non-trivial way by the ion concentrations in solution as well as the electrolyte composition, and estimate according effects for halide solutions and selected metallic electrodes based on theoretical density functional theory (DFT) calculations.
2. Theory
2.1. Ab initio thermodynamics of electrochemical interfaces
In this work we concentrate for clarity on the description of metallic electrodes with just a single possible adsorbate species a (generalization to multiple species is conceptually straightforward). In this case, the Gibbs excess energy [13, 16, 50, 64, 65] at applied electrode potential ΦE is defined as

α denotes a certain interface configuration as characterized by its surface geometry (e.g. position of adsorbates) and chemical composition of  substrate atoms,
  adsorbates of type a, and
  electrons in excess to the charge-neutral pristine electrode surface. Expression (1) in essence determines the free energy cost of creating the interfacial system α with total energy
  when its constituents are taken from the thermodynamic reservoirs characterized by the (electro-)chemical potentials μs,
  and −eΦE for substrate atoms, adsorbates and electrons, respectively.
With the adsorbates a present in solution as dissolved ions  of charge qa, their electrochemical potential
  can be determined from tabulated experimental equilibrium potentials
  of the redox reaction
  in combination with theoretical calculations of the chemical potential μA in the reference phase. For hydrogen and halides, e.g., μA is conventionally determined as half the chemical potential of the biatomic molecules at 298 K and 1 bar (
 ) and
) and  refers to a 1 M solution [66, 67]. In this case:

where ca is the molar concentration of the ions in solution and β−1 = kB T.
As noted in the introduction, whenever the interfacial capacitance is independent of the applied potential—as e.g. in many implicit solvent models for high electrolyte concentrations [13, 16, 68] (see also section 1 in the supporting information (SI) (https://stacks.iop.
org/JPCM/33/264004/mmedia))— in equation (1) can be described with a second order polynomial in the number of electrons. In this case, the grand canonical, charge-equilibrated excess energy (constant potential conditions) decomposes into an excess energy term valid at the PZC—which is linear in the applied potential ΦE and identical to the CHE expressions [16, 19, 66]—and an additional, generic DL energy contribution due to capacitive charging [13, 16, 63]. Furthermore, mean-field sampling of configurations α at fixed adsorbate coverages
  can provide an approximate interface free energy landscape as a function of the coverage and the potential, from which any thermodynamic quantity can be inferred, in principle [13].
In the following, we will use expressions that are normalized to the number of surface sites (denoted by lower case letters), such that the mean-field CHE excess energy (per surface site) reads

where  is the excess energy of the clean surface and
  the average adsorption energy per adsorbate, at coverage θa. The subscript 0 denotes values determined at the PZC. Both terms can be approximated e.g. from (charge-neutral) DFT calculations via


 and
and  are the DFT 0 K energies of the adsorbate-covered system consisting of
  adsorbates and Ns substrate atoms and of the pristine substrate system (Ns substrate atoms).
  is the DFT 0 K bulk energy per atom of the substrate material. Here and in the following we assume all DFT surface energetics to be obtained using implicit solvation models. The corresponding terms could also be evaluated with explicit interfacial water to capture specific solvation effects. This can evidently affect the numerical values of both quantities, but would not affect the general thermodynamic description within the present work. The MF average
  at fixed coverage
  can be efficiently approximated by random sampling or via the use of special quasi random structures [69–71]; for the considered showcase of halides on Ag(111) using only maximally isotropic structures at different coverages yielded already a good agreement between predicted and experimental CV peak shapes [13]. As none of the present discussion depends on the way these MF averages are determined (they might as well be determined by a fit to experimental data) we will refer to these averages at given coverage θa simply by a corresponding superscript. In the case of a first-principles parametrization (e.g. based on equations (4) and (5)) inaccuracies due to the use of 0 K energy differences are largely corrected by addition of the term
  —the vibrational free energy contributions of the adsorbates only. As noted previously, within the CHE + DL approximation [13, 16, 63] the DL energy contributions per site due to capacitive charging are simply given by a plate-capacitor-like term

with the area per site Asite = A/Nsites.  is the PZC (aka work function of the interface in solution) and
  the area-normalized DL capacitance at the PZC for the coverages θa. Both intensive quantities can be determined again from ab initio calculations, e.g. with an implicit solvent model. In the context of the discussion here, they are to be seen as system-specific parameters which can vary for different adsorbates and experimental conditions. Finally, the MF free energy landscape per site as a function of θa and ΦE is given by

with  corresponding to the MF configurational entropy term

where  is the maximum achievable coverage (per site) for the adsorbates a [13].
Above, and in the following, all DL-charging-related terms are underlined to make the impact of the latter more clear.
2.2. Equilibrium interface compositions and thermodynamic CVs
The equilibrium surface coverage  at given applied electrode potential ΦE minimizes
  (equation (7)) with respect to θa. Knowledge of
  then directly yields the expected number of electrons
  per site as a function of the potential via

from which thermodynamic CV currents j can be derived [13]. At a fixed scan rate  , this current can be written as j = vCpseudo, where the pseudocapacitance Cpseudo is scan-rate-independent. Within the MF model,
  and thus given by

 is the electrosorption valency [13–16]—the number of exchanged electrons per adsorbate—which is given by

Note that expression (10) includes a double-layer charging, baseline contribution  plus a contribution due to electrosorption which we refer to as
  . The latter is naturally proportional to the change in surface coverage (
 ) times the electrosorption valency
  .
.
3. Results
Until now we have put much attention to clarifying how the respective mean-field equations derive from an ab initio thermodynamics-based ansatz. However, as this mean-field description is completely generic, these equations and the parameters therein form a general theory of thermodynamic CVs, where all mean-field parameters are to be seen as fundamental system-inherent descriptors. All CHE terms are thereby terms associated with the energetics at the PZC, and all underlined DL terms arise from the capacitive charging of the interface, aka the second order response to the application of a potential while leaving surface coverages fixed.
3.1. CV peaks
 minimizes
  and is thus given by

which can be rewritten into the typical form of an adsorption isotherm as

While equation (13) defines  in general only implicitly, it is possible to derive an analytic expression for the inverse function
  , which is given as the solution to the quadratic equation (in ΦE) defined by equation (12) and with


The general solution to this second order equation in ΦE (equations (12) and (14)) however hampers meaningful further analysis and we restrict ourselves in the following to the case where a = 0 in equation (14). This approximation implicitly assumes  and thus refers to systems, where the interfacial capacitance is independent on the surface coverage (
 ) or where this is a good approximation. In this case


where  is a unitless measure for DL effects as defined in equation (16). Note, that the CHE result is given by the first term in equation (18) with
  , where
  is the differential, adsorption-energy-like per adsorbate quantity defined in equation (19). Inclusion of the (underlined) DL terms shifts
  thus by an amount of
  at given coverages
  with
with  the difference between the applied potential and the PZC
  . Note that
  is the product of an adsorbate-dipole-related quantity
  and the DL capacitance C0 (assumed independent on coverage already before). Thus the DL-induced shifts in the electrosorption potential can be rationalized by a dipole field interaction with the field in the DL ∝C0ΔΦE. This term corresponds to the interface charge at applied potential that is used as relevant variable in other works [18]. Furthermore,
  relates directly to the electrosorption valency via
  (cf equation (11) for
  and equation (16)). The close connection between electrosorption valency and dipole has been clarified previously [15, 16]. Although adsorbate dipoles and interfacial fields are more common descriptors when discussing adsorbates at electrochemical interfaces, we use here mostly the unitless quantity
  , as it represents a direct measure of the size of dipole-field interactions (at given DL capacitance) relative to the work by the electron transfer process upon adsorption, and it relates in a straightforward way to
  .
.
Evidently,  (equation (18)) can be approximated as a perturbation to the CHE result
  via
via

where  is the potential drop in the DL, as estimated from the CHE electrosorption potentials
  . With Cl@Ag(111) having electrosorption valencies of ∼−0.5 [16] we can directly derive
  and thus estimate the DL-charging-related shift of the CHE peak position as
  , which is easily in the range of hundreds of meV, and thus far from negligible
3
.
, which is easily in the range of hundreds of meV, and thus far from negligible
3
.
3.1.1. Peak position
As discussed above, CVs are typically dominated by the electrosorption peak  (equation (10)). Whenever
  depends only weakly on the coverage, the position and width of the CV peak are hardly affected by its neglect, as it enters only as a multiplicative constant in equation (10)
4
. Thus, we focus in the following on the quantity
depends only weakly on the coverage, the position and width of the CV peak are hardly affected by its neglect, as it enters only as a multiplicative constant in equation (10)
4
. Thus, we focus in the following on the quantity  , with
  . This expression yields positive electrosorption peaks, independent on the sign of the adsorbate charge qa for physically sound, i.e. convex free energy landscapes
5
.
. This expression yields positive electrosorption peaks, independent on the sign of the adsorbate charge qa for physically sound, i.e. convex free energy landscapes
5
.
Thus, CV peak position and shape can be evaluated from the moments of  via the integrals

and the normalization  . These can be rewritten as integrals over the coverage
  (see section 2 in the SI for more details), as

The peak position P on an absolute potential scale is given by the first moment

which can be readily computed from the coverage-dependent adsorption energetics (cf equations (18) and (23)). This result clarifies the above mentioned influence of the dipole-field interaction  on the expected peak position relative to the CHE estimate. Furthermore, it is straightforward to derive peak shifts induced by a variation of the concentration ca via the identities


The latter approximation is valid for small  (cf equation (21) and section 2 in the SI). Evidently, the first term in equation (26) describes the perfect Nernstian behaviour of the CHE energetics, whereas the DL terms induce non-Nernstian shifts according to

which can be directly evaluated from the coverage dependence of the PZC and knowledge of the DL capacitance C0 (cf equation (16)). Therefore, non-Nernstian peak shifts are directly related to non-ideal electrosorption valencies  , which depend on the adsorbate dipole and the interfacial capacitance, not however on the magnitude or direction of the field in the DL (within the present approximations).
3.1.2. Proxies for peak position and peak shape
In analogy to the previous analysis, peak widths can be analyzed via the second central moment, as done in the SI (sections 2 and 3), however, the intricate averages over the coverage hamper further insightful, analytical analysis. Therefore, we follow a simpler route to derive proxies for the position and peak shape of CVs by estimating above averages over the coverage ⟨⋅⟩ by simple evaluation of the coverage-dependent terms at an intermediate coverage, e.g. the half maximum coverage. This procedure allows to derive in full rigour general and more intelligible proxies for CV peak properties, as elaborated in the SI. We refer the interested reader to the respective section 4 in the SI, also to understand better the conditions under which the various approximations made are expected to remain valid. All derived expressions are reported in a self-contained way for CV peak position and shape (table 1) as well as for their variation when changing the ion concentration ca and the DL capacitance C0 (table 2).
Table 1. Approximate expressions for the CV peak position P, the potential drop in the DL ΔΦE and the CV peak shape as defined by its width W and height H. While all other variables are as introduced in the main text, the variables  and
and  can be understood from the detailed derivations in section 4 of the SI. For halides on Ag(111) K ≈ 0.27. All coverage-dependent terms are to be evaluated at half maximum coverage (
 )
)
| Property | Proxy |
|---|---|
| CHE peak position |
 |
| CHE + DL peak position |
 |
| DL potential drop |
 |
| CHE + DL width |
   |
| CHE + DL height |
 |
Table 2. Proxies for the concentration dependence  and the capacitance dependence
  for the CV peak position P, the width W and the height H.
| Property | Proxy |
|---|---|
| Change with ion concentration log(ca) | |
| CHE + DL peak position |
 |
| CHE + DL width |
 |
| CHE + DL height |
 |
Change with DL capacitance C0 ( , coverage-independent; , coverage-independent;  , independent on C0) , independent on C0) | |
| CHE + DL peak position |
 |
| CHE + DL width |
 |
| CHE + DL height |
 |
 | |
Indeed, the respective equations show that changing the ion concentration ca can affect CV peak positions and shapes, and these changes can be understood from the changes in dipole-field-like interactions which rationalize the respective descriptors (see more detailed discussion later on).
In the same way, a change of the DL capacitance C0 can introduce changes in peak position and shape. As C0 changes with electrolyte concentrations but also with electrolyte ion type [17] due to variations in ionic solvation shell sizes [18], the derived dependencies on C0 are highly important to rationalize non-trivial changes under different experimental conditions.
We will provide a more detailed discussion and evaluation of these proxies in tables 1 and 2 later on.
3.2. Accuracy validation for the proxies: halide electrosorption on Ag(111)
DL effects were found relevant for understanding thermodynamic CVs of Ag(111) in halide containing solutions [13], as evidenced by comparing experimental results of Foresti et al [72] with theoretical predictions of the present mean-field description at the CHE and CHE + DL level of theory, parametrized from DFT calculations in an implicit solvent model (see figure 1 and reference [13]). The inability of the pure CHE description to replicate the experimental variations in the peak shapes, hints at the importance of capacitive DL charging for these systems.

Figure 1. Experimental [72] and theoretical [13] CV peaks for Ag(111) in halide containing solutions at ion concentrations of ca = 0.5 mM. The theoretical results are based on the present mean-field description at the CHE + DL and CHE level of theory as parametrized in reference [13] based on DFT calculations in an implicit solvent model. All curves are without capacitive baseline currents and plot the scan-rate-independent property  (area-normalized values, see section 6 in the SI for more details). Only the theoretical CHE + DL results can replicate the experimental variations in peak shapes for Cl, Br, and I, both qualitatively and quantitatively, which supports the importance of capacitive DL charging for these systems.
Download figure:
Standard image High-resolution imageThis becomes even more clear, when studying the changes in the peak shapes with changing the ion concentrations ca for the according CHE + DL mean field models, as reported in figure 2. 6 Results at the experimental conditions (ca = 5 × 10⁻⁴ M [72], as in figure 1) are colored and bold, while results for selected alternative concentrations are in grey (molar concentrations as indicated, partly unphysical). The plot demonstrates the strong concentration-dependence of the according CVs and clarifies that all halide peak shapes are expected in essence identical, given that their position P on the potential axis is the same. This can be easily understood from the previous discussions and the fact that all adsorbate-related descriptors but the adsorption energy are essentially the same for Cl, Br and I (see reference [13] and figure SF1 in the SI).

Figure 2. Theoretical CV peaks (area-normalized values of  ) for Ag(111) in halide containing solutions as a function of the concentrations ca (MFT & CHE + DL parametrization from reference [13]). The CVs corresponding to the central panel of figure 1 at concentrations ca = 5 × 10⁻⁴ M are colored and bold. All additional grey peaks are simulated at the indicated molar concentrations (values partly unphysical). The plot demonstrates firstly a strong concentration-dependence of all halide CVs and and secondly that all halide peaks are expected in essence identical, whenever their position P on the potential axis is the same, in agreement with the importance of the potential drop in the double layer as the shape-determining factor [13].
Download figure:
Standard image High-resolution imageIn order to assess the accuracy of the derived proxies, we use these results for the CV peaks for Ag(111) in Cl, Br and I solutions, to test in how far the differences between the CHE and the CHE + DL results (figure 1) and the relevant changes with the concentration (figure 2) can be described and understood from the derived proxies. Unfortunately, the non-negligible degree of asymmetry in the peak shapes (see figures 1 and 2) hampers an unambiguous definition of position P, width W and height H. Therefore, we restrict ourselves to an analysis of P and W, for which the above moments-based definition can provide unambiguous and well-defined results. Verification of the proxies for P and W will also validate the proxies for H as it is the former two that enter the derivation of the peak-height-related proxies (see section 4 in the SI).
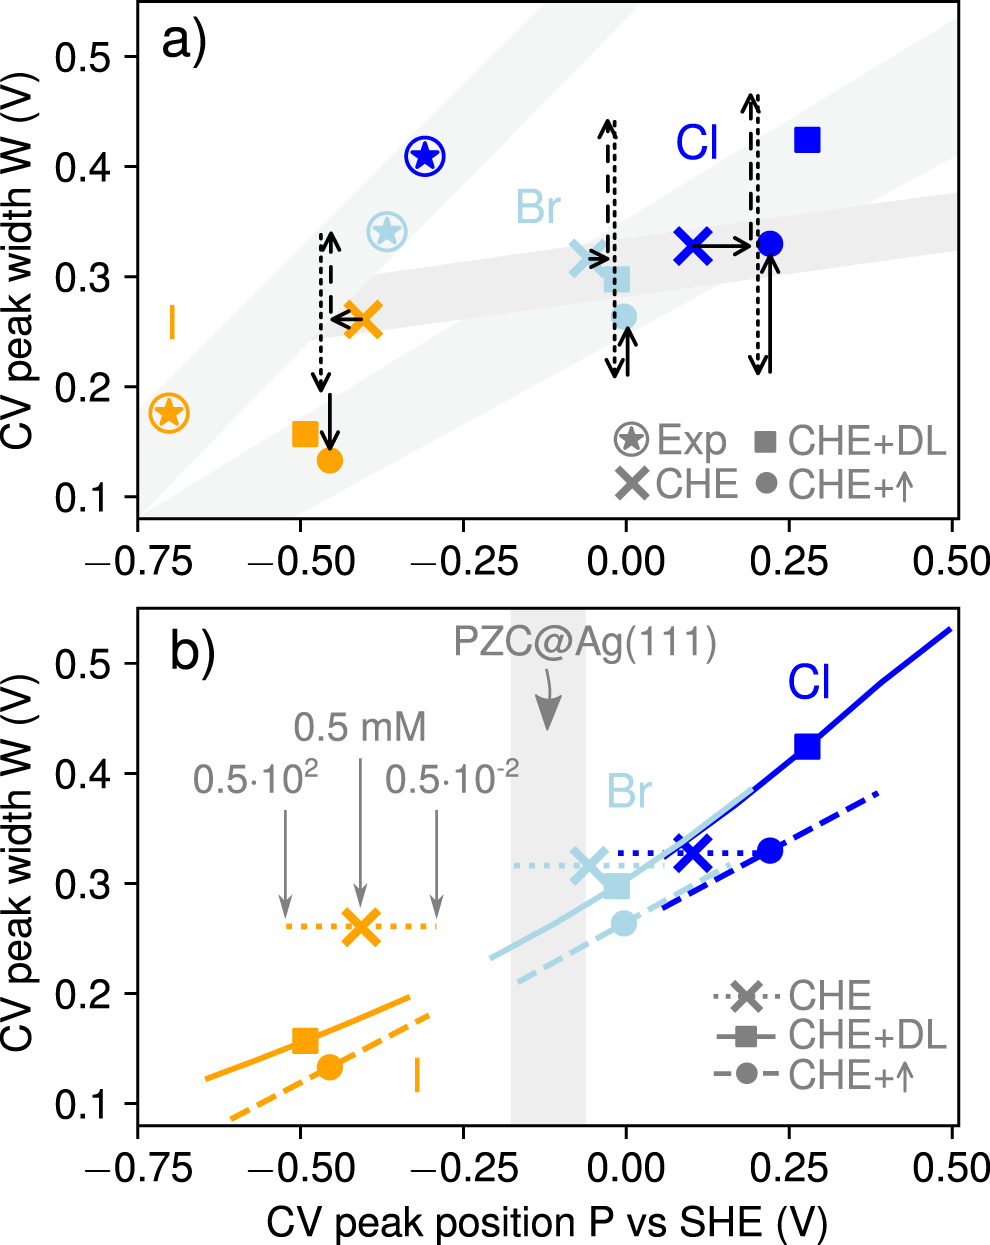
Figure 3(a) reports peak positions P and peak widths W for the experiments (encircled stars), as well as for the ab initio parametrized mean-field models (CHE: crosses, CHE + DL: squares) with quadratic coverage dependencies (see reference [13] and section 6 in the SI), at an ion concentration of ca = 0.5 mM. P and W are computed from the mean and 2nd central moment of the experimental and theoretical curves of  according to


Figure 3. (a) Experimental and theoretical peak positions P and widths W for ca = 0.5 mM, computed via first and second central moment of  (see text). CHE and CHE + DL results are plotted as crosses and squares. The DL-induced CHE perturbations are indicated as arrows (horizontal arrow: equation (24); vertical dashed, dotted and solid arrows: first, second and third term in equation (33)). Adding those to the CHE data points (CHE + ↑, filled circles) explain approximately the CHE + DL results. The grey regions are a guide to the eye to highlight the underestimated correlation between positions P and widths W in the CHE model. (b) P and W for the three theoretical methods in a concentration range of ca = 0.5 × 10±2 mM. The grey region corresponds to the PZC of half-covered Ag(111) surfaces.
Download figure:
Standard image High-resolution imageWe then evaluate the accuracy of the proxies by adding to each CHE data point (PCHE, WCHE) the approximate expressions for the DL-induced peak shift (equation (24), horizontal vectors in figure 3(a) and the width change (equation (33), vertical vectors). The individual contributions to the DL-induced width change (first, second and third term in equation (33)) are illustrated as dashed, dotted and solid vertical arrows, respectively. All estimates are evaluated at half coverage ( ) and with K = 0.27 in equation (33) (see section 4 in the SI for the detailed derivation of this value). All approximate results that derive from adding to each CHE data point the respective, perturbative shifts are plotted as filled circles and denoted as 'CHE + ↑'. Evidently, these estimates fall close to the CHE + DL solutions (squares) which provides confidence in the accuracy of the derived proxies.
Shaded regions enclosing experimental and theoretical data points across the halide series support a strong overall dependence of peak widths W on the peak position P for the experiments, which is only fully captured by theory when including the DL energetics. Note, that the inclusion of only the first two terms of equation (33) (dashed and dotted vertical arrows) leads to identical widths across the halide series. Thus only the latter term, which varies with the potential drop in the DL (ΔΦE), seems responsible for the variation of the halide peak shapes, in line with the results in figure 2 and the conclusions of reference [13].
Figure 3(b) plots the theoretical values for P and W when changing the ion concentration by two orders of magnitude around the experimental value of ca = 0.5 mM (ca = 0.5 × 10±2 mM). While the CHE method only yields trivial Nernstian shifts in the peak position, the CHE + DL theory and their approximation (CHE + ↑) lead to non-trivial position and width changes (cf figure 2). As analysed subsequently, the former is related to the fact that halides on Ag(111) exhibit a normal work function change (see figure SF1 in the SI). Furthermore, as the work function change per adsorbate increases with the coverage for these systems (see figure SF1 in the SI) equation (36) results in a decreasing peak width with increasing ca as  , which explains the behaviour observed in figure 3(b).
Figure 3(b) includes as well the PZC of Ag(111) at half maximum coverage. At these potentials most DL-induced alterations to the CHE results are expected to vanish as there are nearly no interfacial fields present. Indeed, the concentration-dependencies of the CHE + DL and CHE + ↑ methods extrapolate nicely to the CHE results in this potential regime, which underlines again that the CHE results are intrinsically only valid at the PZC (cf figures 1 and 2).
Halides on Ag(111) exhibit significant coverage dependencies (e.g. for  and
and  , see figure SF1 in the SI), however, their approximate treatment by evaluation at half maximum coverage and their complete neglect (
 in equation (14)) does not prevent the proxies from reproducing the CHE + DL results even in a semi-quantitative way. This is even more so surprising, as
  for halides on Ag(111) and thus not small compared to 1, which is assumed at certain steps of the derivations (see SI).
Therefore, we expect these proxies to remain valid also for other systems, where the approximations are typically less problematic than for the here discussed showcase system.
3.3. Analysis of the proxies
An insightful and accessible interpretation of the physical meaning and origin of the derived proxies in tables 1 and 2 can be achieved by analyzing a Frumkin model, where the adsorption energy  is assumed to vary only linearly with the coverage, and where adsorbate dipoles are assumed as coverage-independent. Such systems show no shape dependence on log(ca), but exhibit non-Nernstian peak shifts. The according analysis is not only interesting due to its straightforward interpretability, but also as it can be treated fully analytically. We refer the reader to section 5 in the SI for details.
3.3.1. The quantity 

As already stated the quantity  is a unitless measure of DL effects, and at the same time it relates trivially to the electrosorption valency via
  . Its meaning is thus very accessible and becomes even more clear when we reformulate e.g. the traditional chemical reaction equation for the electrosorption of Cl−

into a more general electrosorption equation, namely

with  being identical to the according quantity used throughout this work and with
  [16]. Reaction equation (45) thus clarifies that some negative charge remains on the adsorbed Cl and thus only
  electrons are actually exchanged upon the electrosorption process. Note, however, that this is only a simplified picture, as above charge-conserving reaction equations are problematic in view of a fully grand canonical picture where charge is not a conserved quantity.
In general,  discriminates between systems with normal and anomalous work function change:
  is negative for adsorbates with a normal work function change (
 for qa > 0 and
  for qa < 0). On the other hand
  for adsorbates with anomalous work function change (cf equation (16)). Thus it makes a significant difference, whether adsorbates behave normally or abnormally in this respect.
3.3.2. Peak positions P
Indeed the work function changes due to the adsorption of halides on metallic surfaces can be surprisingly complex [73–75], and it is thus certainly interesting to analyse what these results mean in terms of their electrosorption behaviour.
Based on the approach outlined in section 7 of the SI, we use published theoretical data [74] for  and
and  in combination with our own results for halides on Ag(111), in order to estimate the values of
  and ΔΦE at interfacial capacitances C0 ≈ 40 μF cm−2 for Cl, Br and I and for a wide range of substrate materials (see section 7 in the SI for more details). This allows us directly to estimate their non-Nernstian peak shifts as well as the accuracies of the CHE peak positions (equation (29)), which depend only on the sign and order of magnitude of
  and the peak position relative to the PZC.
Figure 4 plots the derived numerical values for  and
and  as a function of the vacuum work function of the substrate material. Evidently, for many adsorbate-substrate combinations,
  takes values that are significantly different from zero. In addition, negative and positive values are observed, in line with the fact that halides can induce normal and anomalous work function changes [73–75].

Figure 4. Numerical values for  and
and  for Cl, Br, and I on (111) surfaces of fcc metals, as derived from published theoretical data [74] (see section 7 in the SI). Positive and negative values of
  classify systems according to their work function change (anomalous/normal) and are directly related to peak shifts
  (equation (35)) which we report on the right y-axis (Nernstian shift:
  ).
).
Download figure:
Standard image High-resolution imageAs a result of equations (27) and (35), adsorbates with normal work function change exhibit larger peak shifts with log(ca) than expected from the ideal Nernst behaviour. The reverse is true for adsorbates with an anomalous work function shift. This is perfectly in line with the interpretations gained from the Frumkin model analysed in the SI, and the above intuitive chemical reaction equation (45): with  being directly related to the electrosorption valency
  , non-zero
  values are directly linked to a rescaled driving force for the adsorption process. Thus, systems with normal(anomalous) work function change exchange less(more) electrons upon adsorption, and thus necessitate larger(smaller) applied potentials to drive the adsorption process. While these results hold in general, e.g. independent on the charge of the adsorbate, we exemplify it in figure 4 for the negatively charged halides by having included also the shift with log(ca) on the right y-axis (equation (35)), which evidently exhibits the described dependence and demonstrates the expected magnitude of non-Nernstian behaviour for the considered systems (Nernstian:
  ).
).
The combination of the  values with the reported [74] adsorption energies
  allows to assess directly the expected CHE errors in the peak positions P − PCHE (equation (29)) as well as the peak shift with DL capacitance
  (equation (38)). Note that both proxies are trivially related via the DL capacitance C0. The DL potential drop is approximated via
  and with PCHE from the theoretically reported values of
  (equation (28)) and the PZC
  from experimentally measured values, which are available for the major part of the studied substrates [76] (see SI, section 7). The results are plotted in figure 5 for an ion concentration in solution of ca = 1 M. Evidently, the CHE error P − PCHE can easily vary in a range ±0.2 V
7
, which is far from negligible and on the same scale as inherent DFT inaccuracies. Furthermore, while the latter is often transferable (e.g. between substrates), figure 5 does not suggest this for the DL-induced shifts. However, a certain degree of correlation in the data points exists, which might enable a more accessible understanding in the future.
from experimentally measured values, which are available for the major part of the studied substrates [76] (see SI, section 7). The results are plotted in figure 5 for an ion concentration in solution of ca = 1 M. Evidently, the CHE error P − PCHE can easily vary in a range ±0.2 V
7
, which is far from negligible and on the same scale as inherent DFT inaccuracies. Furthermore, while the latter is often transferable (e.g. between substrates), figure 5 does not suggest this for the DL-induced shifts. However, a certain degree of correlation in the data points exists, which might enable a more accessible understanding in the future.

Figure 5. CHE peak accuracy P − PCHE and peak shift as a change of the DL capacitance  . The contour lines are in logarithmic spacing with the indicated values in V for P − PCHE and in V/
 for
for  (note that both proxies are identical up to a multiplicative factor, cf equations (29) and (38)). Positive regions in the plot are colored in light red. Data points are obtained by combining experimental [76] and theoretical results [74] (see section 7 in the SI).
Download figure:
Standard image High-resolution imageNote as well, that the magnitude and sign of peak shifts  (equation (38)) follow the same behaviour of the CHE error and thus depend on the product of
  and ΔΦE. As a result, the magnitude and direction depends on how far the electrosorption peak is positioned left or right of the PZC, and whether the adsorbates induce a normal(anomalous) work function change (
 , cf figure 5).
3.3.3. Peak shapes, H and W
Above considerations with respect to the rescaled driving force due to non-zero  indicates that
  should as well have an impact on the peak width. Indeed, the analysis of the Frumkin model suggests (see section 5 in the SI), that this behaviour is captured by the first term in equation (33) that is proportional to the product of CHE width WCHE and
  . This term induces a larger(smaller) peak width than expected from the CHE results for systems with normal(anomalous) work function change in line with the reduced(increased) driving force considerations.
The second term in equation (33) is always negative, representing thus a peak contraction. This is tentatively related to the fact that in a grand canonical setup, the DL potential drop adapts to compensate for adsorbate dipoles. The dipole-field interaction with the so-induced counter-oriented field is always 'attractive' and always reduces the total energy irrespective of the sign of charge, dipole or DL field, thus explaining in sign and magnitude the second term in equation (33) (see also SI). Note that these first two terms in equation (33) are independent on ΔΦE and thus represent a renormalization of the CHE results, as e.g. plotted in figure 3(a).
Finally the third term in equation (33) takes the change of the adsorbate dipole with the coverage into account via the term  , which is directly related to the curvature of
  . It is only this third term in equation (33) that varies with ΔΦE and thus the only one that induces non-Nernstian shape changes. This clarifies that alterations of the peak shape with changing experimental conditions, e.g. via ca, are mainly driven by the coverage-dependence of the adsorbate dipoles.
Similarly as for  , the sign of
  —which also occurs in the other shape-related proxies in tables 1 and 2—depends on whether systems show a normal or an anomalous work function change and whether the magnitude of the adsorbate dipole increases or decreases with coverage. For systems with a normal work function change,
  when the magnitude of the adsorbate dipole increases with coverage as e.g. for halides on Ag(111). Respective alternative statements can be made for the 3 other possible scenarios thus allowing to explain a variety of non-trivial peak shape changes with changing experimental conditions.
For reasons of length, we will only take a closer look at equation (40) in table 2, as it describes how peak heights can change with changing C0. This is not only important for a better understanding of experiments, but also as it allows to estimate potential errors made in theoretical calculations with inaccurate DL capacitance C0, e.g. in implicit solvation models.
Note that M in equation (40) is a unitless scaling factor where the numerical value of all contributing terms (equation (41)) can be estimated in a straightforward way (e.g. the ratio between peak height H and the baseline DL capacitance C0). Furthermore, it is gratifying that all dependencies on K have vanished, which makes us confident that the derived equation can be used to discuss any localized peak, without knowledge e.g. of the amount of coverage change that it encloses. All quantities have then to be interpreted as quantities at the respective interface composition. Note also, that equation (40) suggests that the height of a CV peak changes exponentially with the capacitance, which indicates possible dramatic shape changes induced by moderate changes in C0. Furthermore, the highest sensitivity to changes in C0 is observed for high and narrow peaks. Equations (40) and (41) can be analysed for certain limiting cases:
- (a)Case: (small adsorbate dipoles, non-zero C0). Then , consistent with the absence of capacitive charging effects.
- (b)Case: C0 → 0; Da ↛ 0 (small C0, non-zero adsorbate dipoles). Then as M ↛ 0. Note that in this limit M is largely independent on C0, with the central term in equation (41) vanishing.
- (c)Case: (small overall dipole magnitude, however dipole magnitude still varies with coverage) ThenNote that very narrow and high peaks (large H) studied away from the PZC (large |ΔΦE|) can thus be extremely sensitive to small changes in the DL capacitance C0. In addition, the height/shape change with C0 is expected to switch signs, whenever the system is studied below or above the PZC (sign of ΔΦE). These results clarify, that even in the case of small adsorbate dipoles (Da → 0), and thus naively expected small DL effects, a non-vanishing coverage dependence of the adsorbate dipoles () can lead to significant peak shape changes.
- (d)Case: Halides on Ag(111) here, all terms in equation (40) are of similar magnitude (theoretically), and thus the (theoretical) behaviour as a function of C0 is extremely complicated and non-trivial, which we will not further elaborate here, but potentially come back to in subsequent work.


4. Conclusions
In this work we showed how all properties of thermodynamic CV peaks can in principle be mapped back to the coverage and potential dependence of the underlying fully grand canonical energetics. Note that equation (14) represents in essence the first two terms in a possibly more complex Taylor expansion around the PZC of the interface energetics, with the difference between applied potential and the PZC  as the relevant expansion variable. As a result, any possible further potential dependence (e.g. of the adsorbate dipoles, or the interfacial capacitance) would naturally induce additional and potentially higher order contributions, which cannot be analyzed analytically considering equation (14). However, already at the present level of theory (quadratic equation in
  ) the results are not any more amenable to insightful analysis. On the other hand, when restricting ourselves to the case where the quadratic term is neglected (a = 0 in equation (14)) a straightforward analytical analysis is possible, where only knowledge of the coverage-dependence of quantities evaluated at the PZC is necessary. The relevant quantities exhibit a straightforward interpretation e.g. via adsorbate dipoles and can be accessed directly e.g. from ab initio calculations. This approximation corresponds to systems where
  is largely coverage and potential independent. Note, that all mathematical terms that we referred to with 'adsorbate dipole' are related fundamentally to coverage-induced work function changes and might also arise from other physical realities, e.g. a work function change due to the alteration of the interfacial water structure, which only changes the physical cause of these terms in the equations but not the derived results. Such a situation might e.g. arise when the mean-field model is parametrized based on generalized CHE calculations [10, 21, 77], where the solvent and electrolyte are treated by all-explicit AIMD simulations.
Using this and sensible additional approximations, as detailed in the SI, we were able to derive a list of proxies, that allow an insightful analysis and understanding of how ion concentrations and other electrolyte properties can lead to non-trivial changes in the observed CV peak positions and shapes. The successful test of these proxies on Ag(111) in halide containing solutions, where some of the assumptions made along the derivations are expected problematic, convinces us that they do indeed hold as well for other systems and provide valuable new information for an appropriate analysis of experimental results.
Among other things a markedly different behaviour for adsorbates with normal and anomalous work function is predicted. Furthermore, we have shown, that a variation in the capacitance C0 can easily induce complex peak shifts and shape changes (cf table 2). As a result, experimental CV measurement without controlled and known capacitance value C0, which is often not reported, can be hardly analysed and understood in full completeness. In addition, the provided proxies allow us to pinpoint the main challenges of accurately predicting thermodynamic CVs via ab initio methods:
These are first and foremost the intrinsic inaccuracies of the adsorption energetics, as these values not only directly affect the predicted peak position but also directly impact the accuracy of the DL potential drop ΔΦE, and thereby any related quantity. Interestingly, however, such inaccuracies do not affect the dependencies on log(ca) (cf table 2). The other relevant quantities are the PZC as well as its change with coverage and the interfacial capacitance. Evidently, also here, ab initio methods struggle, either due to overly simplified atomistic models (e.g. neglect of explicit interfacial water), and/or due to inherent inaccuracies of implicit solvent models.
While fully acknowledging these existing problems of theoretical modelling and not providing solutions to these, the present work provides important insight in how the described errors transfer to CHE + DL (fully grand canonical) results. In addition, the proxies allow error estimates for the more simple, but widely used, CHE energetics and thus clarifies cases where this method is problematic (cf figure 5). In addition, we hope this work will help in the future to understand better the intricate details of thermodynamic CVs, e.g. their change with experimental conditions, and allow the reconstruction of atomistic properties of the interface that can be resolved and studied in a straightforward way via theoretical simulations.
Acknowledgments
The authors acknowledge financial support through the EuroTech Postdoc Programme which is co-funded by the European Commission under its framework programme Horizon 2020 and Grant Agreement number 754462 as well as support from the Deutsche Forschungsgemeinschaft (DFG, German Research Foundation) under Germany's Excellence Strategy - EXC 2089/1-390776260. This work was supported by a grant from the Gauss Centre for Supercomputing e.V. (www.gauss-centre.eu) by providing computing time through the John von Neumann Institute for Computing (NIC) on the GCS Supercomputer JUWELS [78] at Juelich Supercomputing Centre (JSC).
Data availability statement
All relevant data of this work is either compiled in the SI or available from the cited references.
Footnotes
- 3
As the peak position is directly related to adsorption energies as e.g. used in kinetic theories, this error has a dramatic impact on the predictive quality of those.
- 4
The appropriate inclusion of the electrosorption valency is performed in the SI in section 3. The resulting equations do however not allow further insights as gained by the presented analysis.
- 5
Systems where adsorption energies decrease with increasing coverage can lead to non-convex free energy landscapes in mean-field theory, which we do not consider here.
- 6
Details on the parameters in reference [13] and the SI, section 6.
- 7
Extreme values as 0.8 V for I on Pt are at very low potentials, and outside the stability window of water also in alkaline conditions.