
Abstract
A significant part of the laser wakefield acceleration (LWFA) research effort focuses on studying high-energy, quasi-monoenergetic electron beams. For other applications, such as the production and application of intense betatron x-ray radiation, Bremsstrahlung γ-rays and positron beams, the beam's spectral quality is secondary to the number of electrons produced. This work discusses 3D particle-in-cell simulations of a highly efficient LWFA acceleration process, generating a broad spectrum of electrons, driven by a 12 TW few-cycle laser on high-density gas targets. In some cases, laser absorption in plasma exceeds 80%, and up to 27% of the driving laser energy is transferred to electrons over 20 MeV leaving the plasma. We also observe a deceleration of the accelerated beam at the plasma downramp and plasma exit, which arises from transitioning from laser-driven to beam-dominated wake, and also from the induced axial electric field. This effect is similar to magnetic vortex acceleration, where the induced axial electric field, instead of accelerating plasma ions, would slow down the opposite-charged electron beam and also a strong return current and backward electron beam.
Export citation and abstract BibTeX RIS

Original content from this work may be used under the terms of the Creative Commons Attribution 4.0 license. Any further distribution of this work must maintain attribution to the author(s) and the title of the work, journal citation and DOI.
1. Introduction
Since the inception of the laser wakefield electron acceleration (LWFA) process [1], the leading research direction in the field has aimed at developing a plasma-based alternative to traditional vacuum radiofrequency cavities in linear accelerators, with the GV cm−1 electric fields present in the plasma offering possible new applications, like the realisation of compact, 'tabletop' free electron lasers [2–5], or the next generation of cost-effective electron accelerators for high-energy research [6–10]. One of the main requirements for these applications is high-quality electron beams, i.e. beams with high energy, low emittance, and low energy spread, usually driven by multi-joule petawatt-class lasers, and significant research effort is focused on achieving these goals. However, other applications of these LWFA electron beams have less strict requirements on energy spread and emittance, for example, direct application of the electron beam as a positron source aiming at materials science studies [11], an irradiation source for radiobiological research [12–14] with a therapeutic perspective, or using the betatron x-rays generated during the acceleration process for phase-contrast imaging and tomography [15, 16], as well as a synchrotron-like x-ray source for pump-probe measurements [17, 18]. A common characteristic of these more practical applications is the need for a large number of electrons (or photons generated by these electrons). For such applications, high-charge electron beams of sufficient energy are generated with high efficiency by an LWFA-based source, combined with a high repetition-rate laser to increase particle flux further.
Some early works also discussed high charge/high-efficiency LWFA. The seminal paper introducing the blowout regime reported high, 15% simulated conversion efficiency for high plasma densities [19]. Another work derived a scaling for monoenergetic beams for the bunch charge—that it would decrease with increasing density [20]. This research direction has recently gained significant attention. Simulations performed by the author with few-cycle lasers demonstrated up to 40% laser-to-electron beam energy conversion efficiency [21]. During experimental studies with 100 TW laser power, 27% of the laser energy was absorbed in the plasma, i.e. half of the 54% predicted in quasi-3D simulations. The discrepancy was attributed to the non-ideal laser spot size [22]. Laser-to-electron conversion efficiencies of 3%–5% have been reported by several groups [22–24]. A study of fluctuations in beam energy and bunch charge at constant laser parameters showed that beam energy decreases for higher charges due to beam loading [24]. Furthermore, computational upscaling based on the 100 TW experimental data predicted efficiencies up to 10% when the same laser is upscaled to 1 PW [24].
High-efficiency blowout LWFA acceleration at higher densities requires few-cycle laser pulses, primarily so that the laser pulse would fit within the plasma ion cavity, the size of which is slightly larger than the plasma wavelength—more accurately described by the LWFA scaling laws [25, 26]. Such few-cycle lasers are usually available at few-terawatt laser power, but at high—up to 1 kHz—repetition rates. This few-cycle regime was first investigated in the paper introducing the blowout regime, where one of the discussed cases had similar plasma and laser parameters (20 mJ, 6.6 fs, 1 μm laser, ne = 3.5 × 1019 cm−3) [19]. Experiments with ionisation injection produced few-megaelectron volt quasi-monoenergetic beams [27]. Acceleration with density shock injection, and 30–65 mJ, 8 fs pulses in high densities produced 13–30 MeV quasi-monoenergetic beams [22, 28, 29]. LFWA using terawatt-class lasers with kilohertz repetition rates [27, 30, 31] and bunch charges reaching 20 pC [32] was also demonstrated by multiple groups.
The electron acceleration process can also be affected by tailoring the longitudinal density profile. A shallow, downward slope gradually increase the plasma wavelength, expanding the decelerating field region of the bubble [33, 34]. The electrons would reach this deceleration region sooner, resulting in an earlier dephasing and lower electron energies. Conversely, a shallow upward slope would increase the final energy of the electron bunch.
In this paper, we present the high-density LWFA regime, in which the 3D particle-in-cell simulations are shown to be surprisingly efficient, with very high total particle energies and nanocoulombs bunch charges from a 12 TW laser. Full-system simulations are also presented with the systemic energy balance distribution. We also noticed and investigated significant deceleration of the electron beam as the accelerated bunch leaves the plasma, which is attributed to the buildup of a decelerating electric field.
2. Energy scaling for few-cycle pulses
We investigate the interaction of few-cycle laser pulses with high-density gas jets in the regime where pulse duration is close to the plasma wavelength,  , where τL is the FWHM pulse duration, the plasma wavelength
  and the critical plasma density is
  . The derivations follow the same line of thought and use the quantities defined in [25, 26]. The great advantage of ultrashort pulses is their availability at high repetition rates (>kHz), which also implies limited energy per pulse. Due to the small pulse energy, tight focusing is necessary to achieve a peak intensity sufficient to drive a plasma wake and accelerate electrons. The corresponding Rayleigh length of the focused laser pulse is in the order of 10 s of micrometres, which gives an upper limit for the usable acceleration length in a uniform plasma. Fortunately, relativistic self-focusing can increase the propagation length of the laser pulse if the laser power (or density) is above the self-focusing threshold.
With bubble radius scaling as  , where a0 is the dimensionless peak intensity of the laser pulse, the condition
  (i.e. the laser pulse fits in half of the ion cavity) can be written as
  , where
  is the laser pulse length in cycles, showing that the maximum density of the laser plasma for blowout acceleration is below the critical density, in the case discussed later in the paper (8 fs, 900 nm laser, a0 < 6)
  . At this relatively high density, the laser pulse experiences a significant energy loss during propagation; thus, the limiting factor of acceleration will be given by the pump depletion length (
 ), which is slightly shorter than the dephasing length
  . For our laser parameters, we can assume an almost complete evacuation of electrons from the ion cavity (blowout regime, a0
> 1), and the maximum accelerating field can be approximated as [26]:
. For our laser parameters, we can assume an almost complete evacuation of electrons from the ion cavity (blowout regime, a0
> 1), and the maximum accelerating field can be approximated as [26]:
In the case of dephasing-length limited acceleration, there is an additional factor of ½ appearing in the average accelerating field [25]. In the case of depletion-length-limited acceleration this factor of ½ would represent a lower limit. The average accelerating field, combined with the acceleration length, gives the total energy gain.
In [25], the intensity-scaling of the accelerating field scaling is taken as ∼a0
1/2, leading to the dephasing-length determined energy gain  , which scales as ∼a0
/ne. In the case discussed here, a similar derivation leads to a weaker,
, which scales as ∼a0
/ne. In the case discussed here, a similar derivation leads to a weaker,  scaling for depletion-determined energy gain. The maximum energy gain would be expected at the lowest density that supports self-focusing.
3. Electron acceleration simulations
Parametrical studies were carried out with 3D numerical simulations using the EPOCH3D particle-in-cell code [35], using the Yee field solver with 4th field order approximation. The simulation's further parameters were triangle particle shape, timestep of 0.3 × CFL limit (0.0404 fs, reduced for the higher field order), and default current smoothing. For the parameter scan, the simulation domain was a 30 μm × 24 μm × 24 μm side moving window with free boundaries, with a mesh resolution of 50 nm × 200 nm × 200 nm, and four particles per cell. Using 4th field order, as suggested in [36, 37], the numerical dispersion was reduced by over a factor of 10 compared to the 2nd field order with higher resolution.
The investigated densities were above the threshold for relativistic self-focusing ![${P_{{\text{sf}}}}\,\left[ {TW} \right] = 0.017\omega _l^2/\omega _{\text{p}}^2$](https://content.cld.iop.org/journals/0741-3335/63/6/065019/revision3/ppcfabf80dieqn13.gif) [38], i.e. 1.9 × 1018 cm−3 for the laser parameters.
[38], i.e. 1.9 × 1018 cm−3 for the laser parameters.
We chose helium as the gas medium with a dopant gas for ionisation injection (nitrogen for 7 × 1018 cm−3 density, oxygen for other densities) content (atomic concentration) varying between 0% and 100%. The background electrons from the dopant L-shell and helium were assumed to be pre-ionised, while the two K-shell electrons of the dopant—marked as Ox7 and Ox8 for oxygen, N6 and N7 for nitrogen—were non-ionised.
As for trapezoidal density profiles, we observed spurious injection at the start of the plateau from the abrupt jump in plasma gradient; the plasma entrance and exit ramp profiles were semi Gaussians following the expression exp(−((x − x0)2/(84 μm)2)), with constant density between the halves. This ramp profile has a 100 μm distance between the 10% and 90% density values, with the 90% values found at 27.3 μm from the maximum.
The investigated maximum density range was 7 × 1018 cm−3–1.2 × 1020 cm−3 (0.005–0.09nc). The maximum was at the limit where the blowout regime conditions are valid. The plateau length was determined by preliminary optimisation for acceleration efficiency, with simulations run at lower particle counts. The plasma profile was Gaussian with the above expression at the highest density, corresponding to a nominal plateau length (as defined above) of 54.6 μm.
The laser parameters were set to correspond to the expected specifications of the SYLOS3 laser system at ELI-ALPS Research Institute. This is an upgraded version of the SYLOS2 laser currently under operation [39], with 100 mJ pulse energy and 8 fs FWHM pulse length at 900 nm wavelength. For the parameter scan, the laser's 'vacuum' focal spot was at the start of the target plateau. The focal spot 1/e2 radius w0 varied from 6.1 μm down to 2.4 μm and was set equal to the 'matching' conditions w0 = rb = a0 1/2 λp π−1 [25], i.e. depending on the nominal plasma density, the relativistic self-focusing of the plasma would focus the beam further. The maximum vacuum intensity of the laser was 1–6 × 10¹⁹ Wcm−2, with a0 = 2.3–6.0. The laser, propagating in the x-direction, was linearly polarised along the y-direction.
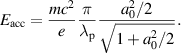
The main parameters of the scan were the background electron density (varying between 7 and 120 × 1018 cm−3, as well as between 0.005 and 0.09 nc) and the dopant (N or O) concentration in the target gas. In figure 1(a), the electron beam parameters are shown for the density scan at 10% dopant concentration. Bunch charge and efficiency were taken for the high-energy electrons above 20 MeV—where 20 MeV was chosen as the spectrum plateau starts close to this energy value. The electron beam parameters were taken at 250 μm after the end of the density plateau, at which point the beam has left the plasma.
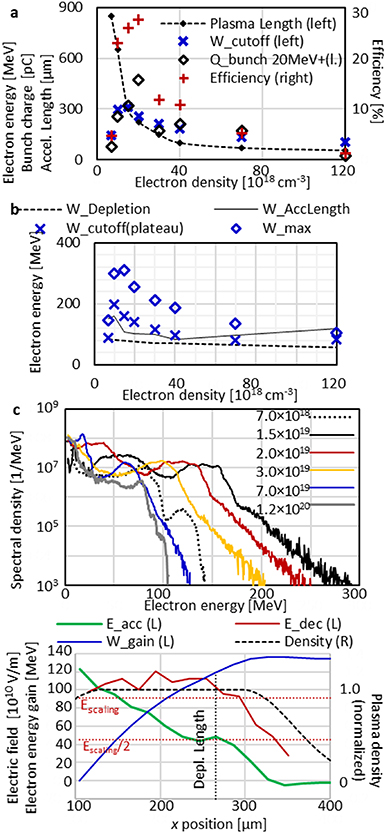
Figure 1. Plasma length, electron beam charge (electrons above 20 MeV), cutoff energy and conversion efficiency (20 MeV+) as the function of background electron density, at 10% dopant (oxygen) concentration, 250 μm after the end of the plateau (a); comparison of cutoff and the end of the spectral plateau energies with scalings based on depletion and plasma length (b); electron spectrum (in e−/MeV) for selected density values (in cm−3) (c). Evolution of the decelerating and accelerating (with flipped sign) axial electric fields (d) for 2 × 1019 cm−3 density and 10% oxygen content, and integrated possible energy gain in the plasma plateau. Normalised plasma density, scaling-derived [26] maximum axial electric field, and nominal depletion length are shown for reference.
Download figure:
Standard image High-resolution imageThe density-dependent acceleration length optimised for acceleration efficiency, and the nominal depletion length are plotted in figure 1. The optimal acceleration length—the plateau length of the plasma—was found to be ∼30% longer than the nominal depletion length for the higher density simulations. It should be noted that respective scaling-derived dephasing lengths are even longer (with the exception of the highest density simulation), 104 μm at 7 × 1019 cm−3 and 3300 μm at 7 × 1018 cm−3.
For the two lowest-density (7–10 × 1018 cm−3) simulations, the optimal acceleration length was found to be approximately twice the depletion length. Due to the self-focusing oscillation of the laser pulse diameter, the intensity of the laser drops from an a0∼ 3 maximum to a0∼ 1, resulting in an interrupted acceleration process. While the nonlinear wake reforms after the laser refocuses, the intermittent acceleration reduces both the conversion efficiency and the maximum electron energy.
At densities lower than 7 × 1018 cm−3, the acceleration and injection process becomes marginal, despite the nominally self-focusing plasma and relativistic intensities.
The electron spectra have a wide plateau with an exponential high-energy tail, with the plateau end shifting to lower energies as density increases (figure 1(c)). The highest maximum plateau-end cutoff energy is at 1 × 1019 cm−3 density (figure 1(b)), although the exponential tail extends further at higher, 1.5 × 1019 cm−3 density up to 311 MeV. The bunch charge (for 20 MeV+ electrons) has a maximum value of 474 pC at 20 × 1018 cm−3, with a maximum laser-to-electron beam efficiency of 27.5% after the plasma. The exponential tail of the spectra can be explained by the strong space-charge of the electron bunch causing spectral broadening.
Most notably, however, the bunch charge and efficiency of the electron beam exiting the plasma drops at higher densities. At 7 × 1019 cm−3 density, at the end of the plateau, the beam charge is 784 pC, but equals only 124 pC after the plasma, with a corresponding efficiency drop from 40% to 5%. At 1.2 × 1020 cm−3 density, the exiting beam charge drops even further, to 23 pC, corresponding the 1.2% efficiency.
The plateau end energy and maximum energy is compared to two scalings, based on depletion length and the actual plasma density plateau length in the simulations (figure 1(b)). The energy scalings include the ½ factor for the average accelerating field, mentioned in section 2. The depletion-length based scaling appears as a lower bound of the simulated energy values. The acceleration-length based energy scaling demonstrates a good agreement with the cutoff energy values, although it still underestimates the acceleration at low-medium densities.
The evolution of the axial electric field in the plasma plateau is shown in figure 1(d), for 2 × 1019 cm−3 density and 10% oxygen content. The shown accelerating field Eacc is the maximum in front of the accelerated electron bunch, with the corresponding integrated energy gain in the plasma for an electron at this position. The decelerating field shown is the peak field behind the driving laser, and it indicates how strong is the driven wake and the position where the laser pulse energy is exhausted.
The maximum decelerating field is higher than the scaling prediction [26], and it shows depletion only after ∼200 μm propagation, beyond the 165 μm nominal depletion length. These can be attributed to the higher-than-expected laser intensity due to the strong self-focusing. As a result, the actual acceleration length exceeds the depletion length. For most of the plasma, the accelerating field is also higher than the average for dephasing-limited scaling (Escaling/2) and turns into decelerating field not too far into the plasma downramp region, which might partially be attributed to the phase slippage in downramps described in [34].
Integrating the accelerating field gives a possible 137 MeV energy gain in the plasma, which drops by 3 MeV in the plasma exit ramp. It should be noted that when the back of the plasma bubble reaches the 105 μm position, there is already ∼1 pC of electrons accelerated above 20 MeV in the plasma entrance ramp (density upramp) region.
The concentration of the dopant, as shown in figure 2(a), also affects the beam parameters to a varying extent. The main difference is the contribution of the oxygen K-shell electrons in the accelerated bunch, reaching 64% (of the 20 MeV+ electrons) at 50% dopant concentration and remaining unchanged for pure oxygen. The difference between the energy spectrum of background and oxygen K-shell electrons is more pronounced in the electron energy spectra. For 1%–10% doping, the spectra of background electrons are similar, with the spectra from the dopant K-shell varying only in magnitude for low doping levels (figures 2(b) and (c)). Here the few ionisation-injected electrons do not influence the accelerating field significantly but act as 'tracers' for the electric field. The exponential tail of the spectrum extends beyond 300 MeV, but the number of electrons above 200 MeV is low, the highest being 6 pC at 1% concentration. As the dopant content increases above 10%, this high-energy tail shrinks and eventually vanishes. The average energy of the 20 MeV+ electrons is the highest for the 30%–100% concentrations due to the flat electron spectrum.
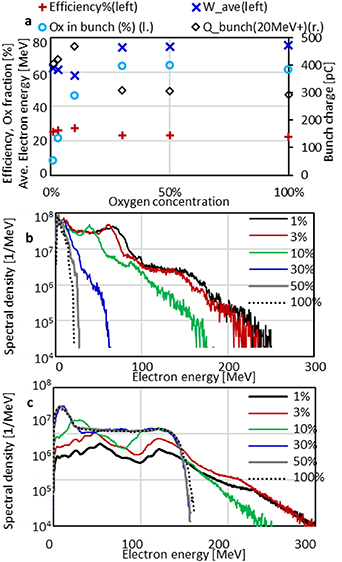
Figure 2. Electron beam parameters (average energy, efficiency, bunch charge, and oxygen K-shell contribution) as a function of dopant concentration, at 20 × 1018 cm−3 (a). Electron spectra (in e−/MeV) of background (b) and K-shell (Ox7 and Ox8) electrons as a function of dopant concentration at a density of 20 × 1018 cm−3 (c).
Download figure:
Standard image High-resolution imageThe phase–space plots for some selected simulations are shown in figure 3. Runs at 7–10 × 1018 cm−3 showed similar behaviour in figure 3(a), with a distinct main electron bunch followed by a secondary injection. Figures 3(b) and (c) show the phase–space plot at intermediate (20 × 1019 cm−3) at the end of the plasma plateau and also after the plasma. The trailing electron bunch suffers a ∼33 MeV slowdown exiting the plasma. Comparison with figure 1(c) reveals that the exponential high-end tail of the spectrum is confined into a short, ∼200 nm 'spike', which shows further acceleration in the downramp. Consider figures 3(c) and (d), indicating that the front 2–3 μm only consists of oxygen K-shell electrons. The oxygen K-shell electrons inject first through ionisation injection and make up the front of the accelerated bunch. As the oxygen concentration increases, the higher beam loading from Ox7 and Ox8 would suppress the follow-up trailing electrons to a larger extent.

Figure 3. Phase–space x–px plots of the accelerated electrons, at 10% oxygen content, for 1 × 1019 cm−3 electron density, after the plasma (a); 2 × 1019 cm−3 at the end of the plateau (b); 2 × 1019 cm−3 after the plasma, showing a slowdown of the trailing bunch (c); 2 × 1019 cm−3 after the plasma, background electrons only (d). The colour scale is logarithmic, on the same scale.
Download figure:
Standard image High-resolution image4. System energy balance
A full-scale laboratory-frame (non-moving window) simulation for ne = 4 × 1019 cm−3 (0.03nc) and 50% oxygen content was conducted to investigate the evolution of energy distribution within the system and investigate the slowdown effect shown in figure 4(b), to capture features that might be missing in regular, moving-window simulations. The domain size was 400 μm × 24 μm × 24 μm, with one particle per cell. The side boundaries were reflective for particles for better accounting of the energy balance. The laser was focused at the start of the density plateau, at a 4.0 μm FWHM focal spot (matching condition), for a maximum (nominal vacuum) intensity of 3 × 10¹⁹ Wcm−2, (a0 = 4.1), which intensity was doubled in the plasma due to relativistic self-focusing to a maximum of a0 = 5.9.
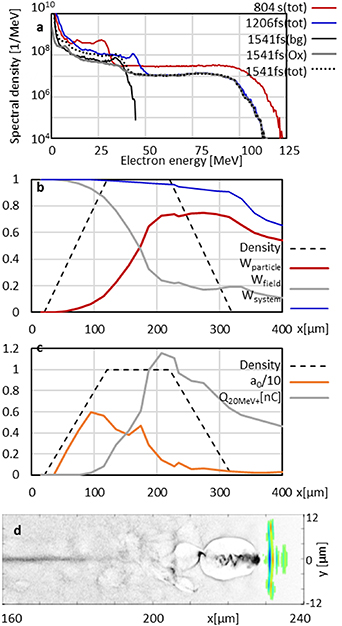
Figure 4. 50% oxygen content, ne = 4 × 1019 cm−3. The spectrum of background and ionisation injected electrons at 1541 fs, and total electron spectra at this and two other timesteps (a). System energy balance (b), with normalised plasma density, driving laser energy, particle energy, induced laser energy, and remaining system energy (normalised to the driving laser pulse energy), are shown. The X coordinate shows the position of the driving laser pulse. Intensity (as a0 normalised vector potential) and bunch charge above 20 MeV during the acceleration process (c). Density distribution (grayscale) at 804 fs (d), showing the wake transitioned to be driven by the accelerated electron bunch, with the resulting ion channel (blue rectangle) and the remnant of the laser electric field (in colour).
Download figure:
Standard image High-resolution imageThe density profile was chosen to be trapezoidal to limit the length of the exit ramp. A trapezoidal plasma profile was used to restrict the simulation duration and clearly distinguish whether post-acceleration effects occur in the plasma downramp or the vacuum after the plasma. The density had 100 μm entrance and exit ramps and a 100 μm plateau length (the nominal depletion length was 83 μm).
The evolution of the energy distribution, background electron density (normalised to maximum), and vector potential a0 during the acceleration process are shown in figures 4(b) and (c), with their values are normalised to the laser energy. The total energy of the system decreases only by the driving laser field diffracting out the side boundaries or the electron beam exiting the downstream end of the simulation domain.
The system energy balance, as the laser pulse traverses the plasma, is shown in figure 4(b). As the particles are confined in the domain, and the beam has not reached the open boundary at the end, part of the particle energy is transferred to the induced field, which coincides with the laser pulse leaving/diffracting out through the sides of the simulation domain. The system energy decreases as the boundaries are open to the electric/magnetic fields.
The system absorbs the laser light with remarkable efficiency: when the electron beam leaves the plasma plateau, the total particle kinetic energy is 76% of the input laser energy, with another 4% in the electromagnetic field components s perpendicular to the driving laser field (i.e. Ex, Bx, Ez, and By ).
Unexpectedly, however, the downward density gradient of the exit ramp considerably slows down the accelerated electrons. This slowdown does not happen from the wake getting depleted and disrupted. The particle energy fraction rises close to linear through most of the density plateau until the driving laser energy is mostly depleted at the start of the exit ramp (figure 4(c)), still maintaining the wake. The wake becomes beam-dominated in the density downramp, where it is driven by the leading edge of the electron bunch (figure 4(d)) and slowing down the high-energy front of the electron beam. Part of the deceleration could come from the expansion of the decelerating/dephasing field region in the downramp [34], but at this point the system is past the acceleration phase, with the laser energy already depleted.
The ion cavity is 10 μm in diameter and 15 μm in length, showing a considerable expansion due to beam loading—which must be compared to the 5.3 μm plasma wavelength and the 6.8 μm diameter predicted by the LWFA scaling [25].
The total bunch charge is high due to the high energy conversion efficiency and low particle energies. The above-50 MeV high energy fraction was 109 pC at 1541 fs for a total beam energy of 7.6 mJ. The top-109 pC cutoff at the end of the density plateau (804 fs) was 70 MeV, showing 20 MeV deceleration for the highest-energy electrons, of which 16.5 MeV happened in the exit ramp, attributable to the transition to beam-driven wake. The lower energy electrons suffer similar deceleration: the cutoff for the highest-energy 800 pC of electrons decreases from 17 MeV at the end of the plateau to 5.5 MeV after the downramp, the dropoff dropping to 3 MeV after a further 250 μm propagation. This slowdown can also be observed by the decrease in the number of 20 MeV+ electrons (figure 4(c)). From over 1 nC of 20 MeV+ electrons, only 416 pC leaves the plasma.
The spectrum had a large number of low-energy electrons, with a gradually decreasing plateau after 10 MeV (figure 4(a)). The background electrons have a continuum spectrum, with the head of the bunch comprised of higher-energy ionisation-injected electrons—the background electrons do not exceed 44 MeV, while the leading edge of the bunch is of higher energy (figure 6). A pinched plasma column formed behind the main bubble can already be seen, following the collapse of the trailing plasma bubbles (figure 4(c)).
Figure 5 shows the (normalised) angular divergence of the electron beam in different spectral ranges. The high-energy fraction (50 MeV+), containing 56 pC, is narrowly collimated, with a 34 mrad (y-direction) × 58 mrad (z-direction) FWHM spread, and is fully contained in an 80 mrad half-angle cone (figure 6(a)). This fraction only contains oxygen K-shell electrons, as the energy of background electrons cuts off at 44 MeV (figure 4(a)). The RMS divergence in both y- and z-direction also scales close to ∼1/E (figure 6(b)). Also, note that divergences in the laser polarisation direction (y) are larger than perpendicular to it.
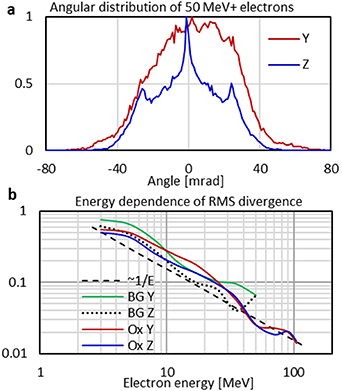
Figure 5. Angular distribution of accelerated electrons above 50 MeV at 4 × 1019cm−3 electron density (a). Energy dependence of the RMS divergence (b) for background and oxygen K-shell electrons in both directions.
Download figure:
Standard image High-resolution image5. Characteristics of the decelerating field
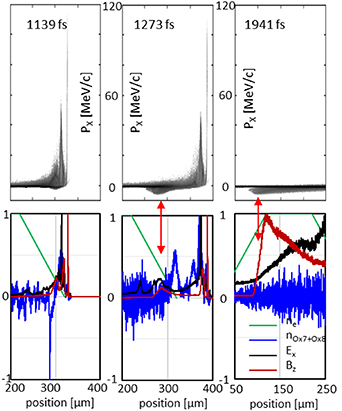
The propagating high-charge, non-uniform electron bunch brings about a strong azimuthal magnetic field, the change of which produces a positive axial electric field induced by the expanding field of the electron bunch. This decelerates the trailing electrons, an effect showing some similarity to magnetic vortex acceleration (MVA) [36]. Figure 6 shows these fields (same as above, ne = 4 × 1019 cm−3 density, 10% oxygen content) and the back-propagating return current. To distinguish the accelerated bunch from the background electron density (green), the linear density of the ionisation injected oxygen K-shell electrons (red) is shown. The strength of the azimuthal magnetic field (maximum absolute B-field at a given x position, perpendicular to the B-field of the laser pulse) and the axial electric field follows the electron density. In contrast, the tail of the decelerating field is neutralised by the field induced by the backwards-propagating beam.
This decelerating electric field at the plasma exit effectively traps a significant portion of the accelerated electrons in the plasma and also accelerates a backward electron beam. The bunch charge of the above-2 MeV electrons is 2.5 nC at the end of the density plateau and similar at the end of the exit ramp, containing 32% of the initial laser pulse energy.
Figure 6. The formation of a return-current beam at the plasma exit (red arrow), snapshots at 1139 fs, 1273 fs, and 1941 fs (left to right), at ne = 4 × 1019 cm−3 density, 50% oxygen content. Graphs show the x–px distribution function for all electrons (top row of figures). The bottom row shows the longitudinal plasma density (green), the ionisation injected electrons (nOx7+Ox8, dark red), the maximum azimuthal (By ) field strength (black), and the axial electric field (Ex ) (blue)—all normalised to their respective maximum. The red arrows indicate the backwards-accelerated electron bunch. Note that the horizontal scale is different for the last timestep shown.
Download figure:
Standard image High-resolution image
At 1541 fs, only 900 pC charge is above 2 MeV, containing only 23% of the total laser energy, and 3.7 nC above 0.5 MeV, but the backward beam contains 8.4 nC charge. This backward beam eventually crosses the plasma. At 2211 fs the backward beam charge is 11 nC, electrons with backward momentum and kinetic energy over 0.5 MeV, and maximum energy of 6 MeV (figure 6) but only 900 pC is above 2 MeV. The energy of the backward beam is 12% of the driving laser pulse.
The leading front of the electron bunch is much less affected after it leaves the plasma, as the spectrum of the most energetic electrons shows (figure 4(a)). The effect of all disturbances travel with the speed of light, not much faster than the electron bunch, and disturbances behind cannot catch up with the leading electrons. While continuous ionisation injection accelerates a large number of electrons, the tail of the injected bunch suffers from deceleration, reducing the utilisable bunch charge leaving the plasma.
6. Discussion
The discussed high-efficiency, high-intensity LFWA is made possible by the short laser pulse depletion length at higher densities, which facilitates a close to complete absorption of the laser pulse, with over 70% absorbed by the plasma. Acceleration can also be extended over the nominal depletion length, as the extremely high beam loading of the ∼nanocoulombs bunch charge distorts the bubble and leads to a beam-dominant LWFA process. The electron injection into the bubble is continuous—except the lowest investigated densities—and the high bunch charge is achieved at the expense of beam quality. Blowout acceleration at these high densities is made possible by the short, 8 fs pulse length and the high intensity (a0 up to 6.0) of a matched laser pulse. The simulated electron energies and charges discussed in this paper are higher than the experimental results for shock-front injection [28, 29].
The simple analytical energy scaling discussed in section 2 is of limited utility, and can be used only for a lower-bound estimate, as the wakefield is stronger and the acceleration length is longer than expected. This is further complicated by the continuous injection and strong beam loading/space charge effects.
A further consequence of the high density and high charge is the buildup of a decelerating electric field at the plasma exit, which is comparable to the process in MVA [40]. In the MVA process, a petawatt-class laser pulse is absorbed in near-critical density plasma, creating a plasma channel. As the accelerated electrons exit the plasma, the magnetic field expands, creating an axial electric field. This accelerates the positive ions and, conversely, decelerates the electrons. The deceleration of the higher-energy electrons mainly occurs in the density downramp, partially due to the transition from laser to electron-beam driven plasma wake. The deceleration of the lower energy (2–50 MeV) electrons in the bunch occur after the plasma downramp region.
The slowdown effect is more prominent in the case of high densities; a twofold increase in density approximately halves the slowdown in absolute values. The deceleration field also creates a backward electron beam with particle energies up to a few megaelectron volt and ∼10 nC charge, persisting and crossing back across the plasma region.
7. Conclusions
Simulations of laser acceleration by few-cycle lasers in high-density plasmas predict a laser-to-electron conversion rate as high as 26% and nanocoulombs charges from a 100 mJ laser system.
Several phenomena discussed in the paper merit further investigation, like the post-plasma deceleration and its dependence on the plasma downramp profile, the specifics of the beam loading and space charge effects, or the re-forming of the wake observed at lower densities. These topics would be the subject of follow-up in-detail studies. The high efficiency of the process is also appealing for utilising the concurrent production of photons through the betatron and inverse Thomson scattering processes as a high-brightness x-ray source.
Acknowledgments
This work was supported in part by the European Union and co-financed by the European Regional Development Fund through the ELI-ALPS project (GINOP-2.3.6-15-2015-00001). N A M H acknowledges the President International Fellowship Initiative (PIFI) of the Chinese Academy of Sciences; the International Partnership Program (181231KYSB20170022) of CAS; the Inter-Governmental Science and Technology Cooperation of MOST.
Data availability statement
The data that support the findings of this study are available upon reasonable request from the authors.