

Abstract
In recent years, measurements on the ASDEX Upgrade tokamak and modelling performed for plasmas with hydrogen (H) and deuterium (D) as the main gas have improved our understanding of the ion mass dependencies in fusion plasmas. The observed isotope effects can be explained with established physics processes which highlight the importance of treating heat transport with coupled electron and ion heat channels. In the core of electron heated L-mode plasmas, the mass dependence of the electron–ion equipartition results in a reduction of  with increasing ion mass. Combined with higher profile stiffness in the ions compared to the electrons, this results in improved core confinement for higher ion masses. At the edge of L-mode plasmas where a higher collisionality is observed, parallel electron dynamics is fundamental for turbulence. The parallel electron dynamics term in the gyrokinetic equations directly depends on
  , resulting in a different kinetic response with different ion mass. Higher turbulent fluxes are expected with lower ion mass. This is consistent with the difference in
  observed in the experiment. The mass dependence of turbulent transport in the L-mode edge has direct consequences for the L–H transition. More heating power is required to enter the H-mode at lower mass (
 ). This is expected if the critical E × B shearing rate
  is important for the transition from L to H mode. In the H-mode pedestal,
  remains important to regulate the turbulent transport. The electrons do not contribute to
  and the enhanced equipartition for lower ion masses causes a shift from the ion channel to the electron channel in the absolute heat fluxes. Consequently, the inter edge localised mode (ELM) transport is found to be higher with lower isotope mass. This enhanced transport in H can prevent the pedestal from reaching the peeling–ballooning stability boundary with engineering parameters where D plasmas are peeling–ballooning unstable. Increasing the triangularity reduces the inter ELM transport in H stronger than in comparable D plasmas. For matched pedestal top and matched heat sources, the core heat transport is found to be similar for H and D when the fast-ion content is low. When ion temperature gradient turbulence stabilisation by fast ions becomes relevant, the mass dependent fast-ion slowing down results in higher fast-ion content in D and therefore in a reduction of ion heat transport in the core. Then, even for matched pedestals
  .
.
Export citation and abstract BibTeX RIS

Original content from this work may be used under the terms of the Creative Commons Attribution 4.0 license. Any further distribution of this work must maintain attribution to the author(s) and the title of the work, journal citation and DOI.
1. Introduction
In high temperature plasmas, isotopes of hydrogen are mostly used as the main ions. The reason for this is that the fusion cross section of deuterium (D) and tritium (T) is the highest for temperatures and densities achievable in magnetically confined plasmas. However, due to the scarcity of T and the operational constraints involved with using radioactive T, present day devices mostly operate with the stable hydrogen isotopes H and D. Because D has better confinement properties than H [1], tokamaks mainly operate with D. Consequently, the majority of available data originates from plasmas with D as the main ions. To increase the accuracy for the prediction of DT operation, detailed knowledge of the physics mechanisms involving different isotope masses and their modelling is necessary.
Assuming a state where turbulence is determined by the ion temperature gradient (ITG) with adiabatic electrons in the collisionless limit, gyrokinetic theory predicts a scaling of heat transport such that  , the gyroBohm scaling [2]. Here,
  is the ion Larmor radius and A the ion mass number. However, this ideal state does not exist in reality. A comprehensive overview of the physics ingredients necessary for a more realistic description are given in [3]. For example, considering the effects of collisions and kinetic electrons helps to model experimental observations [4–6]. Such deviations from the gyroBohm scaling, associated with the main ion mass, are generally termed the 'isotope effect'. In most observations, the isotope effects manifest in a reversal of the ideal gyroBohm scaling, i.e. the confinement improves with mass [3]. Consequently, when studying different isotope masses, the gyroBohm scaling can be a poor frame of reference and might complicate the interpretation of observations. Therefore, whenever possible, we will discuss the influence of the isotope mass in experimental observations without a gyroBohm normalisation. In this case, we will refer to an 'isotope mass dependence'. Note, a physics mechanism showing no mass dependence can still fall in the category of isotope effect when it does not follow the gyroBohm scaling.
It should also be pointed out that for studies with different main ion masses, clean comparison experiments are very difficult to achieve. In general, the main ion mass will not be the only parameter that changes in such a study. The engineering parameters which can be matched are often not a relevant physics quantity—for example, the total heating power is not directly relevant for heat transport physics, but the radial distribution of heat in the electron and ion channel is relevant. The heat distribution, of course, depends on the total heating power, but also on the heating method and the plasma properties—with the main ion mass being such a property.
This paper gives an overview of recent experiments in the ASDEX Upgrade (AUG) tokamak [7], along with a discussion considering the most recent advancements in theoretical understanding. The observations are ordered by the confinement regime of the L-mode in sections 2 and 3 and H-mode in sections 5 and 6 as well as the transition region between them in section 4. Additionally, each confinement regime is separated in the core (sections 2 and 6) and edge (sections 3 and 5).
2. L-mode core
In the core of AUG L-mode plasmas, we have found that the isotope mass dependent electron–ion equipartition  plays an important role [8], where
  is the ion charge number,
  the main ion mass, n the density and
  ,
,  the electron and ion temperature. In general, the equipartition becomes relevant when the heat transport is different for electrons and ions and the energy confinement time
  is larger than the electron–ion exchange time
  . If
. If  is not met—for AUG this is typically the case for
  —no difference in the core confinement is observed between H and D [8]. In electron cyclotron resonance heated (ECRH) L-modes in AUG at moderate density
  ,
,  and with the transport driven by ITG and trapped electron mode (TEM) turbulence, the ion heat transport is found to be stiffer than the electron heat transport [8].
Due to the enhanced equipartition in H, a larger fraction, compared to D, of the auxiliary electron heating is being transferred to the ion channel. A match of the heat flux in the electrons  was achieved for
  ; for this, the total heating power was increased in H—
 MW and
  MW. Consequently, the ion heat flux is higher in H
  . The resulting experimental temperature profiles are shown in figure 1 along with the modelling which reproduces the measurements without a mass dependence in the transport model. These results are described in more detail below. The densities were matched for
  .
.

Figure 1. Electron (a) and ion (b) temperature profiles from measurements (points) and Astra simulations (lines) with a mass independent transport model for H and D plasmas with  . Reproduced courtesy of IAEA. Figure adapted from [8]. © EURATOM 2017.
Download figure:
Standard image High-resolution imageThe global confinement is reduced in H compared to D. The magnitude of this reduction is consistent with empirical scaling laws [9] which find the thermal energy confinement time  . However, when taking the power degradation into account, the difference between H and D is reduced and L-mode confinement factors of
  ,
,  are found, where
  is the energy confinement time scaling as defined in [9]. This observation is consistent with measurements in ohmic plasmas in JET [10] and FT-2 [11].
These global observations are supported by local measurements [8]. With a power modulation of an ECRH gyrotron depositing at mid-radius with f = 100 Hz, small heat perturbations—about 2% of  —are induced in the plasma. Their radial propagation is measured with electron cyclotron emission with a sampling rate of 32 kHz. The Fourier analysis of the radial spread and dissipation of this heat wave serves as a direct measurement of the electron heat diffusion in the plasma. The amplitude A and phase φ of the perturbations are illustrated for H and D in figure 2 and are used to calculate the heat pulse diffusion
  [12, 13]
where r is the minor radius of the measurement location. The measured diffusivities around  are
are  m2 s−1 and
  m2 s−1. Since
  reflects the
  and the power balance diffusivity
  is found with
  , we can conclude that the electron heat transport is not affected by the ion mass.

Figure 2. Radial profiles for amplitude (a) and phase (b) of temperature perturbations due to 100 Hz ECRH modulation. The ECRH deposition profile obtained from TORBEAM calculations is indicated with solid lines. Reproduced courtesy of IAEA. Figure from [8]. © EURATOM 2017.
Download figure:
Standard image High-resolution imageAnother element of local transport characteristics, showing the importance of stiffness rather than mass ratio, is revealed by measuring the radial correlation length of density fluctuations. This is obtained using a dual channel Doppler reflectometer [15]. This provides simultaneous measurements of density fluctuations for two radial positions at a selected wave number and fluctuation velocities with a good spatial localisation [16]. Here, two W-band Doppler reflectometers (frequency range 75–110 GHz) operated in X-mode polarisation, were used, covering the plasma from the core to the edge [17–19]. The probed wave numbers were in the range 6–8 cm−1 corresponding to  –1.0. Note that the probing conditions (density profile, antenna angle) were similar in H and D, ensuring the validity of the comparison. A potential dependence of the correlation length on k or the antenna angle would result in a range for
  rather than the quoted unequivocal values. Figure 3 shows the maximum of the correlation function versus the radial separation in logarithmic scale. The decay of the correlation function is not monotonic but displays two distinct slopes: a fast decay at small distances, and a slower one over larger distances. At small radial separation, the decay slope gives an estimate of a correlation length,
  cm in D and 0.8 cm in H, at r/a ∼ 0.75. The ratio
  is close to
  and corresponds to
  , similar to observations in DIII-D and Tore supra [20–22] and gyro-kinetic simulations over small distances [23, 24]. For larger distances, the correlation lengths are
  cm in D and
  cm in H and their ratio is independent of M within the uncertainties. The absence of a mass dependence in the heat transport is an indication that the larger turbulent scales might be more relevant for the heat transport than the smaller scales. The measurements of the perpendicular velocity
  of the density fluctuations also show signatures of structures which correspond to larger scales (
 ). This range corresponds to typical radial scales of the avalanches depicted in gyro-kinetic simulations (20–40
 ) [23, 25, 26]. To explore the radial structure of the turbulence theoretically, global simulations are necessary, which are currently not available for AUG discharges. Such global flux-driven simulations were performed on a theoretical case [24, 27] and for Tore Supra [25] plasmas under similar conditions to AUG. They reproduce the stiff nature of heat transport and show signatures of avalanching transport on radial scales similar to the normalised structure sizes observed in AUG.

Figure 3. Maximum of the correlation coefficient as a function of the radial separation in  units for H and D at
  (a). Perpendicular velocity of the density fluctuations for the H discharge [14].
Download figure:
Standard image High-resolution imageTo help explain the isotopic dependence of the heat fluxes in AUG, we obtain insight from non-linear local simulations performed for these AUG ECRH L-modes. The simulations suggest that ITG turbulence is the dominant drive for the heat transport. The modelled heat fluxes are shown in figure 4 for two different radii. At  , the total heat flux predicted by the gyrokinetic simulations is in good agreement with the measurements. The simulations show no isotopic dependence but a profile stiffness consistent with the experiment. Closer to the plasma edge at
  , the agreement with the experiment is still reasonable but the simulations suggest lower heat fluxes in H compared to D.

Figure 4. Total heat fluxes from non-linear Gene simulations for an  scan at
  (a) and
  (b). Reproduced courtesy of IAEA. Figure from [8]. © EURATOM 2017.
Download figure:
Standard image High-resolution imageThe impact of the local simulation results on the global properties is illustrated by comparing the heat fluxes predicted by Gene for a given  to the stored energy derived from this gradient length. This is done by scaling the experimental
  profiles over the whole radius with the
  values used for the simulated scan at
  and 0.8. The result is shown in figure 5(a) and illustrates that for H and D, the derived thermal ion stored energy
  scales with
  . Despite being a crude estimate, this power degradation, or profile stiffness, is similar to the one found for L-mode plasmas,
  or
or  , in a large multi-machine confinement time database [9]. This indicates that these gyrokinetic simulations may be representative of a wider range of L-mode plasmas.

Figure 5. Power degradation following from the Gene gradient length scan (a). Predicted decoupling of electron and ion heat flux driven by ITG turbulence.
Download figure:
Standard image High-resolution imageAn additional prediction from the non-linear simulations is that ions and electrons will be affected differently by the turbulence strength. Figure 5(b) illustrates the increase in  with decreasing ion temperature gradient length, and thereby a growing decoupling of electron and ion heat transport. Again, no systematic difference between H and D plasmas is observed. This result supports the fact that the confinement time is lower in H compared to D due the higher
  rather than the lower mass number. This is confirmed by experiments in D with direct ion heating which exhibit confinement properties similar to those of the electron heated H plasma [8]. With direct ion heating in D, the radial ion heat flux distribution is closer to that of the electron heated H plasma than the electron heated D plasma.
The experimental isotope mass dependence of confinement in the core of L-modes is reproduced in predictive Astra simulations [8]. The simulations use the ion temperature profile stiffness obtained with Gene and the electron parameters from the heat pulse modulation measurements, which both showed no mass dependence. Despite the absence of an isotope mass dependence in the heat transport model, the observations are explained when the mass dependence in the electron–ion equipartition is taken into account. In this picture, the mass dependence in the equipartition causes a redistribution of heat between the electron and ion heat channels which, in turn, is responsible for the differences in the energy confinement time. For matched electron heat fluxes, direct measurements using heat pulse diffusion also find the absence of an isotope mass dependence in the electron heat transport. While not necessary in order to explain the observations, a small mass dependence cannot be excluded due to the measurement uncertainties; however, a mass dependence suggested by the gyroBohm scaling  is well outside the uncertainties.
3. L-mode edge
For standard operational parameters, transport in the core of the AUG L-mode is mostly driven by ITG and TEM turbulence. In the edge, due to the higher collisionality, parallel electron dynamics are found to be important and the turbulence is dominated by collisional drift waves [4, 6]. The ion to electron mass ratio enters the parallel electron dynamics term in the gyrokinetic equations, resulting in an explicit mass dependence. This results in a different kinetic electron response with changing ion mass. A lower ion mass causes a higher linear growth rate and higher turbulent fluxes. Note, this mass dependence does not enter via the gyro-radius.
In figure 6, the mass dependence of the normalized linear growth rate  and the normalized nonlinear heat flux
  —where
  is the gyroBohm heat flux—are shown as a function of the electron collisionality
  at the edge
  of an L-mode plasma. The simulations were performed for different masses in the electrostatic (e.s.) limit and also take β effects into account in the electromagnetic (e.m.) simulations. While the absolute values of
  and
and  change from e.s. to e.m. the trends remain the same. At high collisionalities, there is a pronounced mass dependence visible in the growth rates and fluxes, indicating reduced turbulent transport with increasing ion mass. Towards lower collisionalities, this mass dependence is reduced in the growth rates and vanishes in the fluxes. The experimental collisionality is at 3.7, therefore a mass dependence is expected in the transport at the edge.

Figure 6. Normalised linear growth rate and nonlinear heat fluxes for electrostatic and electromagnetic simulations at  as a function of the electron collisionality for different isotope masses. Reproduced courtesy of IAEA. Figure from [4]. © EURATOM 2019.
Download figure:
Standard image High-resolution imageThe experimental edge profiles from the L-mode discharges with different auxiliary heating, introduced in section 2, are illustrated in figures 7(a) and (b). They show fairly similar electron temperatures but different density gradient lengths. The uncertainties of the ion temperature measurements are too large for an accurate power balance close to the separatrix, so we cannot directly validate the modelling results shown in figure 6. However, we can test if the trends observed in the experimental data are consistent with the modelling.
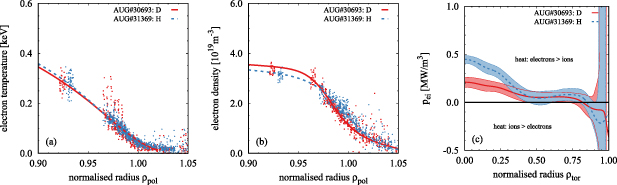
Figure 7. Edge electron temperature (a) and density (b) profile for H (blue) and D (red) L-modes. Electron ion equipartition  for the whole radius. (c) Reproduced courtesy of IAEA. Figure from [8]. © EURATOM 2017.
Download figure:
Standard image High-resolution imageFrom the modelling, we expect higher turbulent transport in H [4]. This would be consistent with  being smaller in H for similar sources. Although the gas puffing is the same in both discharges, the particle source profiles are likely different due to the different mean free paths of the H and D neutrals. Modelling of the differences in recycling due to the ion mass, performed with the EDGE2D-EIRENE code for JET plasmas, shows that for the same gas puffing rate, the particle source in H is expected to be higher [28]. To transport more particles while having smaller gradients, the turbulent particle diffusion should be higher in H than in D—as is suggested by the modelling.
For  to remain similar despite higher transport, the heat fluxes need to be larger in H,
  . Since we found
  , this is only possible when the equipartition changes sign close to the edge (
 ). In figure 7(c) this is the case; however, the uncertainties are considerable. Still, such a reversal is not uncommon and is also observed in H-mode plasmas, as will be discussed in section 5. So, while the energy is transferred from electrons to ions in the core, keeping
  the same between H and D, as discussed in section 2, at the edge energy can flow back to the electrons. The absolute equipartition is larger in H compared to D due to the lower ion/electron mass ratio. Consequently, one can have
  and
and  simultaneously, where the ion channel accounts for the differences.
Measurements from Doppler reflectometry provide additional information about the edge turbulence. In the edge, no mass dependence is observed in the correlation length of the density fluctuations, as shown in figure 8(a), while the correlation lengths in the core show a mass dependence for small scales (see figure 3). This is consistent with the discussion above since the mass dependence in the turbulence enters via the electron parallel kinetic response and not via the gyro-radius, and can be expected for different turbulence mechanisms dominating in the core and the edge of the plasma.

Figure 8. Maximum of the correlation coefficient as a function of the radial separation in  units for H and D close to the separatrix (a). Spectrum of the power spectral density of the time-resolved Doppler velocity (b) [14].
Download figure:
Standard image High-resolution imageDoppler reflectometry also measures oscillations in the plasma mean flow, which are identified as geodesic acoustic modes (GAMs). Figure 8(b) shows E × B flow spectra for H and D plasmas close to the plasma edge ( ). Here, the GAM appears as a coherent peak around 20 kHz. The frequency shift between the H and D peaks is expected when taking into account the mass dependence in the GAM frequency
  , where
  is the ion sound speed and
  , a plasma shape dependent factor. They are responsible for energy spreading spatially and in wave-number, as well as directly moderating the density turbulence and turbulent density-potential cross-phases via velocity shearing [29]. The amplitude of the GAM in H is roughly half that of the GAM in D. This is a common observation in isotope studies [29]. GAMs are driven by turbulence via non-linear interactions and damped linearly via collisions and Landau damping. The resulting GAM amplitude is thus a balance of these mechanisms. GAMs impact both the energy and particle transport.
At first order, the GAM amplitude may provide an indication of the edge turbulence strength. Since gyrokinetic modelling suggests a higher turbulent transport in H, as shown in figure 6, the GAM turbulent drive may be expected to be larger in H. However, in D, we find higher density gradients than in H and higher  increases the drive for the GAMs. The collisionality
  is lower in D than in H close to the separatrix and the collisional damping increases with
  . The safety factor q is too large in the edge for Landau damping to become relevant. Although we cannot give absolute numbers, we expect a higher drive and lower damping of GAMs in D compared to H, which is consistent with the trends observed for the mass dependence of the GAM amplitude.
4. L-H transition
The heating power necessary to enter H-mode  is significantly different in H and D with
  typically observed [30]. In this section, we describe possible explanations for this difference.
In the previous section, we saw that the electron collisionality is important for the isotope dependence introduced by the drift wave turbulence dominating the heat and particle transport in the edge. For the transition from L-mode to H-mode, the ions become important. The widely accepted mechanism causing the transition to high confinement mode in tokamak plasmas involves turbulence suppression via the E × B flow shearing rate  , which is caused by the local radial electrical field gradient. Typically, the minimum of the radial electric field min
 is used as a proxy for
  [31–33]. However, this approximation holds only when the width of the
  well is constant.
It is important to highlight first that no isotope dependence is observed in the  characteristics in developed H-modes [34], and, independent of the ion mass,
  is found to be dominated by the ion diamagnetic term in the radial force balance equation, i.e.
  . This is shown in figure 9. Figure 10 shows that the transition from L- to H-mode occurs at the same value of
  . It is not yet clear why we find no variation in
  at the transition between H and D. Since the transport is higher in H, one might expect that a higher
  is required to suppress the turbulence. Direct measurements of the
  gradients could help in answering this question in the near future. In particular,
  might not hold if the width of the
  well changes with isotope mass, something which could be caused by different density gradients.

Figure 9. Minimum of the electrical field as measured with charge exchange as a function of the main ion pressure gradient term for different isotopes in H-mode. Reproduced from [34]. © 2014 EURATOM.
Download figure:
Standard image High-resolution image
Figure 10. Net heating power (a) and minimum electrical field (b) at the LH-transition for different magnetic fields and different isotopes. Reproduced courtesy of IAEA. Figure from [33]. © EURATOM 2020.
Download figure:
Standard image High-resolution imageIf we consider a given value of  as a prerequisite for the L–H transition, then the mass dependence of
  follows directly from the edge transport discussed in section 3. For that purpose, it is helpful to rewrite the main term of
  with gradient lengths
  . In this notation, it becomes evident that a reduction of
  , as observed for H (see figure 7) as well as higher transport which influences
  and
and  , has an impact on
  .
.
The main actuator to influence the ion temperature profile, and thereby  , is the ion heat flux
  . In studies with a single isotope,
  proved to be the parameter ordering the non-linear
  dependence at low densities [35–37].
With lower  and higher heat transport, a
  is required to match the
  , which is indeed observed in the experiments, as shown in figure 11 [30]. In terms of engineering parameters, this manifests itself as an isotope dependence in the power threshold
  . To experimentally distinguish between the contributions from
  and
and  , simultaneous high spatially resolved
  and
and  measurements are needed. This is currently difficult to achieve with the required accuracy, and thus remains an open question.

Figure 11.
 and
and  (at
(at  ) at the LH transition versus line-averaged density in H and D. Reproduced from [30]. © 2016 EURATOM.
Download figure:
Standard image High-resolution imageThe experiments performed in AUG close to the density minimum with mixed H and D plasmas as well as with He added to pure H plasmas are consistent with the physics picture described above [38]. The H plasmas with increasing He concentration up to 20% are found to have the same ion heat flux at the L–H transition, as shown in figure 12(a). The mixed isotope experiments also show a continuous but non-linear transition between the pure H and pure D cases.  at the L–H transition becomes less dependent on the effective mass
  for
for  . Despite the consistent picture in the ion heat flux, the actual power threshold in terms of input heating power
  can still vary throughout the data set depending on the auxiliary heating method. Most notably, it was observed that in H plasmas with direct ion heating by neutral beam injection (NBI), a higher
  was required to reach the same
  . The reason for this was the reduced
  which lowered the energy transfer from electrons to ions and thus required a higher
  at the edge to reach similar
  [38]. This effect is found to be more pronounced in H compared to D, since the electron ion equipartition is stronger in H.

Figure 12. Edge ion heat flux at the L–H transition for H plasmas with increasing He concentration (a) and different relative H concentrations  (b). Reproduced courtesy of IAEA. Figure from [38]. © EURATOM 2020.
Download figure:
Standard image High-resolution image5. H-mode edge pedestal
The isotope dependencies found in the H-mode cannot be understood as easily as in the L-mode. In particular, the regime boundaries change with isotope mass, i.e. although we observe the same physics processes in H and D, a comparison with matching engineering parameters can result in pronounced differences between the isotopes. A very obvious case for the shifting of regime boundaries is the L–H transition, as discussed in section 4. But they also occur in H-mode, for example, a shift of the power required to move from type-III to type-I ELMy H-modes was reported at JET [39]. So, for matched heating power, the different confinement between isotopes can be dominated by the different confinement regime (L-mode, H-mode) or ELM regime and not by an isotopic dependence of heat or particle transport. Understanding these differences is particularly important when trying to transfer the results to larger machines.
In AUG, H H-modes, a regime of enhanced heat and particle transport in the pedestal exists which is not present in D plasmas for similar engineering parameters. The regime of poor confinement is observed in low triangularity H plasmas with high gas fuelling and medium heating power  [40]; here,
  is the threshold power in H. There are indications that this regime boundary also depends on the heating mix and that the threshold in gas is power dependent; however, not enough data is currently available to draw robust conclusions.
In figure 13, an overview of the density response to gas puffing at 7 MW heating power is shown for different isotopes and shapes. For low triangularity in H, the external gas puffing does not increase the pedestal top density in contrast to D plasmas or high δ H plasmas where the density increases linearly with gas until it saturates at a fuelling rate of Γ∼ 8 × 10²¹ particles s−1.

Figure 13. Density response to gas puffing for  MA discharges with different triangularity and main ions. The edge density is taken locally at
  and the gas is puffed from divertor valves. Reproduced courtesy of IAEA. Figure from [40]. © EURATOM 2021.
Download figure:
Standard image High-resolution imageThe detailed profile response to changes in gas puffing and plasma shape is shown in figure 14 for H and D. The parameter changes in D are consistent with previous observations [41]. With higher triangularity δ the density increases and exhibits a steeper pedestal gradient, as shown in figures 14(e) and (f). With higher Γ, the density in the SOL and at the separatrix is increased and the whole density profile is shifted to higher values (figure 14(a)). At high δ, the impact on the separatrix density due to the higher gas puff is less pronounced than at low δ, but the pedestal top density still increases (figure 14(b)).

Figure 14. Pre-ELM edge density profiles for different triangularity δ, gas puff Γ and main ion masses D (a), (b), (e), (f) and H (c), (d), (g), (h) for discharges described in [40].
Download figure:
Standard image High-resolution imageThe density profile response to the parameter changes in H plasmas is significantly different to that observed in D. Figures 14(c) and (g) show that at low δ, the density gradient is less steep than it was in D which is similar to the differences observed in L-mode in section 3. When increasing the gas puff, there is little impact on the pedestal top density while the SOL density and the separatrix density increase (figure 14(d)), resulting in an effective outward shift of the density profile. The density response to an increased δ is stronger in H (g) and (h) than in D (e) and (f).
In addition to the differences in the density profiles between H and D, the temperature profiles are also affected. This is illustrated by the pressure profiles shown in figure 15. In D (a) the pressure remains similar which is expected for constant heating power when the ELM stability does not change. With higher gas puffing at low δ, the pressure is reduced slightly but remains within 15% of the other profiles. For the H plasmas, the impact of varying δ and Γ is different, as shown in figure 15(b). At low δ, the shallow density pedestal leads to flatter pressure profiles. For low δ and low Γ, the pedestal top pressure is slightly reduced compared to the high δ or D cases. For low δ and high Γ, the pedestal completely collapses and the pedestal pressure is less than half the value of the comparison discharges. This is due to a strong reduction of the pedestal temperature, despite having a similar pedestal top density. This regime of poor confinement can be avoided in H with high δ, where at low and high gas puffing, the pedestal pressure is close to that observed in the D plasmas.

Figure 15. Overview of the thermal pressure pedestal for a triangularity δ and gas puff Γ scan with main ion mass D (a) and H (b).
Download figure:
Standard image High-resolution imageThe impurity confinement is closely correlated with the particle confinement in these cases, i.e. the H plasmas at low δ tend to have lower impurity content in the edge compared to their D counterparts. This is seen in the radiation  close to the separatrix which is lower in H compared to D. The edge radiation increases with triangularity, suggesting an improved impurity confinement with higher δ.
Peeling–ballooning stability is always a suspect when the pedestal pressure changes with δ as this is often observed [42]. However, if the plasmas are close to the ballooning stability boundary, the plasma shape has a smaller impact, which is the case for our plasmas, as shown in figure 16 in the form of stability diagrams with the toroidal current density  as a function of the maximum normalized pressure gradient
  . The pedestal stability is calculated with the MISHKA code for toroidal mode numbers n
 3, ..., 50 using HELENA equilibria. Within the experimental uncertainties of ∼20%, the stability boundary is similar for all D plasmas, regardless of shape or gas puff. It also has only a minor dependence on
  which is indicative of a ballooning unstable pedestal. The experimental operational points are found at the stability boundary within the uncertainties in all cases, indicating type-I ELMs under these conditions. For H shown in figure 16(b), the situation is different, as expected from the pressure profiles shown in figure 15. For high δ, the pedestal is still consistent with peeling–ballooning theory. At low δ, the stability boundary moves to lower critical
  which is likely a response of the shifting density pedestal, as observed also in D at even higher gas puffing [43]. But not only does the boundary shift, the operational point also moves further away from the stability boundary and adding high Γ brings the plasma deep into the stable region. Even at a low pedestal pressure, ELM-like pedestal relaxation events are observed; however, the stability analysis suggests these are not type-I ELMs.

Figure 16. Diagrams of the toroidal edge current density  and normalized pressure gradient
  with the peeling–ballooning stability boundary and the operational point from experiment for a triangularity δ and gas puff Γ scan with main ion mass D (a) and H (b).
Download figure:
Standard image High-resolution imageThe global energy confinement times are within 10% of each other for all the D plasmas as well as the high δ H plasmas. Only the low δ H plasmas show a reduction of the global energy confinement by over 30% [40]. A potential explanation for this loss of confinement is enhanced particle and heat transport in the pedestal region which prevents the pedestal from reaching the peeling–ballooning boundary. Signatures for enhanced transport are observed in the density fluctuation level measured by Doppler reflectometry [15], as shown in figure 17. The density fluctuation amplitude is high throughout a low δ, high Γ phase, while the amplitude reduces substantially in between ELMs for high δ and low Γ. The correlation of the increasing density fluctuations and the strong cooling of the edge plasma are indicators for an increased inter ELM transport in H under these conditions.

Figure 17. Doppler amplitude at  for a H plasma with high δ, low Γ (a) (green) and low δ, high Γ (b) (blue). The divertor shunt currents are shown in black as ELM indicator.
Download figure:
Standard image High-resolution imageIn view of the H-mode pedestal being a result of E × B flow shearing, higher turbulence levels can also be a consequence of reduced  shear. The outward shift of the density profile—as visible in figure 14(c)—effectively reduces the density contribution to the width of the high
  shear region inside the separatrix by 50%. This would consequently lead to a weakening of the edge transport barrier and should result in higher turbulence, as indicated in the measured density fluctuation amplitudes.
While there is certainly a more complex and nonlinear interplay between the turbulent transport, kinetic profiles and the  flow shearing, a general overview can be deduced from the observations. We are deep in the stable region with respect to peeling–ballooning modes, so it is likely that transport processes dominate the pedestal profiles. A larger density gradient length in the pedestal region can result in enhanced transport. Reducing the gradient length by increasing triangularity will again lead to reduced transport. As already discussed in section 3, collisional electron drift waves offer an explanation for the reduced density gradient with higher isotope mass. In these H-mode cases, simulations are more challenging due to the smaller gradient length. Although progress has been made, no robust explanation can be provided yet as to why the density gradient length reduces with increasing isotope mass.
A similarity to the L-mode observations is found via a different approach. Up to now, discharges with matched heat sources have been discussed; however, one can also achieve a match of the pedestal top temperature and density when one allows for different heat and particle sources. To achieve this match between H and D, typically increasing the gas puffing by an order of magnitude is necessary, which requires a doubling of the heating power in H [44, 45].
In figure 18, the resulting heat diffusion profiles are shown for a density and temperature pedestal match at different heat and particle sources in H and D. Similar to the L-mode discussed in section 3, a reversal of the electron to ion heat equipartition is again observed at the plasma edge. This reversal is enhanced in H due to the more favourable electron–ion mass ratio resulting in a strong increase of  in H. While the ion heat diffusivities are found close to the neoclassical level and even follow the neoclassical mass dependence
  within the uncertainties, the electron heat diffusivity is found to be
  [45]. It should be noted that the additional heat in the electrons will not contribute to the radial electric field. Consequently, the electron heat transport should be stiffer than the ion heat transport, which contributes to turbulence suppression with steeper gradients. The destiffening of the ion temperature profile in the edge is found in simulations for a different discharge, as shown in figure 19. When increasing
  from L- to H-mode levels, the low ky
turbulence is strongly enhanced in non-linear e.m. simulations; however, when taking into account the simultaneous increase of the external flow shear
from L- to H-mode levels, the low ky
turbulence is strongly enhanced in non-linear e.m. simulations; however, when taking into account the simultaneous increase of the external flow shear  —which depends on
  —the enhancement of transport is canceled [46].

Figure 18. Edge heat diffusion of electrons and ions for matched temperature pedestal with different heat sources for a D (a) and H (b) plasma. Reproduced courtesy of IAEA. Figure from [45]. © 2018 EURATOM.
Download figure:
Standard image High-resolution image
Figure 19. Evolution of the ion heat transport coefficient  with
with  from e.m. (
 ) non-linear local gyro-kinetic simulations with and without E × B shearing. Reproduced from [46].
Download figure:
Standard image High-resolution imageThis is consistent with the observations in H-mode as well as the ones for the L–H transition discussed in section 4. Note that increasing direct ion heating does not necessarily result in higher  at the edge, as shown in [38]. As shown in figure 18, the width of the region of reduced transport is narrower in H than in D. This can be a result of the detrimental impact of higher gas puffing on the density contribution to the
  shear, as pointed out for the comparison with matched sources.
6. H-mode core
To draw conclusions for the core of the plasma, it is important to minimize the impact of the domain boundary which is the pedestal top in H-mode plasmas. In section 5, we discussed examples where the pedestal top could be matched by adjusting the heat and particle sources between H and D. To use these profiles to draw conclusions on the mass dependence of the core heat transport would require an accuracy in the profile measurements, which is difficult to achieve. The reason for this is the inherent stiffness of heat transport, i.e. increasing the heat sources will result in higher heat transport because the heat diffusivity is not independent of T and ∇T for the most common transport mechanisms. This is particularly true for the ITG-driven transport which is typically observed in the core of AUG H-modes. A remedy is to match the plasma parameters at the domain boundary without modifying the heat sources but by changing the plasma shape. As discussed in section 5, increasing the triangularity in H allows us to match the pedestal top of a D plasma with lower triangularity while keeping the heat and particle sources the same. In order to test how the triangularity affects the core transport, the δ range used in H-mode was reproduced in a single L-mode plasma. No changes to the core transport could be measured during this δ scan. It should be noted that the range of triangularity used here (δ ∈ [0.25, 0.37]) is considerably smaller than in the experiments where a significant impact of δ was reported. In TCV for (δ ∈ [−0.40, 0.40]), L-mode plasmas showed differences in the core transport with lower δ having reduced  [47]; a strong impact on the pedestal stability is found in DIII-D for
  [48].
[48].
This method of studying the isotopic dependence of the core transport with matched boundary conditions was applied to AUG H-modes at different heating powers [40]. In these H-mode plasmas, the neutral beam heating introduces fast ions. When the fast ions start to influence turbulent transport, the isotope dependence of the fast-ion slowing time will become important. Additionally, the operational constraints of the AUG NBI system [7] for H operation enhance the differences in fast-ion pressure between H and D. In figure 20, Rabbit [49] calculations of the neoclassical fast-ion energy  are shown for a large data base of AUG discharges. These calculations take the NBI settings (
 ,
,  ) and the background plasma (
 ,
,  ,
,  ) into account. The difference between the isotopes is clearly visible and increases with heating power per particle.

Figure 20.
Rabbit calculations of the fast-ion energy  plotted against the NBI heating power per density for a data base of 0.8 MA discharges. Reproduced courtesy of IAEA. Figure from [40]. © EURATOM 2021.
Download figure:
Standard image High-resolution imageThe comparison of H and D profiles at two different levels of fast-ion content—while  was matched for each pair—here with medium power 7 MW and high power 10 MW as indicated by the shaded area in figure 20, reveals clear differences, as shown in figure 21. For relatively low
  both
both  and
and  are reasonably well matched for the different masses with the ion heat diffusivity slightly higher in the core of the D plasma. For both H and D, we find
  which is a consequence of localized electron heating by ECRH in the plasma centre. For higher heating powers and
  , the D plasma has the larger fast ion content and
  . In this case, higher ion temperatures and lower heat diffusivities
  are observed in the ion channel than the H plasma. Notably,
  is also lower than in the medium power D case. We also find
  for D while in H still
  .
.

Figure 21. Temperature profiles (top row) and heat diffusivities (bottom row) for medium power and low fast-ion content (a), (b), (e), (f) and high power and high fast-ion content (c), (d), (g), (h). Reproduced courtesy of IAEA. Figure from [40]. © EURATOM 2021.
Download figure:
Standard image High-resolution imageIn gyrokinetic modelling, the stabilisation of ITG turbulence with fast-ions is a well established concept and was found to be important in JET-ILW ICRF heated L-modes [50, 51] as well as in AUG for NBI [52] and for ICRF [53] heated H-modes. Also, the non-linear modelling for this set of discharges using Gene [54, 55] confirms the importance of the fast-ion content in understanding the observed differences in the temperature profiles with varying isotope mass. The expected ion heat fluxes for different ion temperature gradient lengths, isotope mass and fast-ion content are shown in figure 22. In the H plasma, where the fast-ion content is low, little impact of fast ions is observed on the resulting heat fluxes. The experimentally observed heat fluxes are matched very well. At the higher inverse gradient length observed in the D plasma, the impact of the fast-ion content reduces the predicted ion heat flux by a factor of 3. It is only with this additional impact of ITG turbulence stabilization by fast ions that the predicted heat flux comes closer to the experimental value. Since  is not constant in the core of the D plasma and, in order to understand the potential discrepancies due to the large uncertainties in
  , repeating these simulations for different radii would be necessary.

Figure 22. Normalized heat fluxes predicted by non-linear Gene simulations for the high power case with different isotopes, fast-ion content and gradient lengths at  or
or  . Reproduced courtesy of IAEA. Figure from [40]. © EURATOM 2021.
Download figure:
Standard image High-resolution image
7. Summary
The observations made in the different isotope studies performed in AUG highlight important aspects for the broader picture. Considering this broader picture leads to a more consistent understanding of the isotope mass dependent physics present in AUG.
A key aspect for all plasma regions is the difference between electron and ion heat transport, in particular, the non-linear enhancement of turbulent transport due to the profile gradient lengths—i.e. the profile stiffness. In the core of L-modes in both H and D, we find the ion temperature profiles stiffer than those of the electrons because the dominant ITG turbulence drives more ions than electron heat flux. This is observed in absolute fluxes,  , and becomes more pronounced with higher
  where
where  increases. At the plasma edge and when turbulence suppression via external E × B shear becomes important, the ion temperature and density gradients contribute to turbulence drive and suppression simultaneously. The electron temperature profile does not contribute to
  . Consequently, the electron temperature profile suffers the full stiffness imposed by the transport mechanism, while the ion temperature profile provides its own turbulence suppression mechanism. Compared to the plasma core, this results in a higher relative contribution of the electron channel to the total heat transport. The observations indicate that the heat is preferentially transported by the channel with the higher profile stiffness, i.e. taking the route of least resistance.
While this is not inherently an isotope effect, the collisional coupling of the electron and ion channel is isotope mass dependent. The equipartition is stronger in H due to the more favourable mass ratio between electrons and protons compared to electrons and deuterons. Therefore, with a higher isotope mass, the heat has less flexibility in choosing the channel of higher heat transport, which can result in enhanced confinement. This effect becomes particularly pronounced when the auxiliary heating is modified to achieve a profile match between isotopes. In AUG, when doubling the direct electron and ion heating, the difference due to equipartition manifests in the pedestal: In H, most of the additional ion heating is transported via the electron channel and therefore does not contribute to  . In D, more heat remains in the ion channel, contributing to
  , reducing the profile stiffness and lowering the total heat diffusivity in comparison to H. While this analysis is motivated by observations in the edge pedestal, there is no apparent reason why this should not apply to core transport barriers in the same way. However, in the core of AUG L-modes where
  does not play a crucial role, the global confinement is reduced when more heat is transferred to the ion channel, which is the case when comparing H to D. Here, a transport model without any mass dependence—except in the equipartition—will reproduce the mass dependence of the global confinement.
In addition to the indirect impact via the mass dependent equipartition, an explicit isotope effect was identified in gyrokinetic modelling and was found to be consistent with experimental observations. At the plasma edge, we find collisional drift waves which are governed by parallel electron dynamics. Because the kinetic electron response changes with  , this results in stronger turbulence with lower ion mass. This enhanced heat and particle transport is consistent with observations of higher ion heat flux in H compared to D at the L- to H-mode transition. If the transport is enhanced, more heat flux is required to reach similar E × B shear which allows the formation of the edge transport barrier.
In H-mode for matched engineering parameters, the  well is generally weaker in H than in D, rendering these plasmas more susceptible to detrimental effects. Namely, we observe a destabilisation of turbulence in the edge transport barrier by gas puffing in H. Increasing the gas puff modifies the density profile in a way that its contribution to
  is considerably weakened, in particular, due to radially narrowing the region of high
  shear. This effect is not observed when the edge
  well is deeper to begin with, which is the case in H with high δ and in D for any shape.
In the core of NBI heated H-modes, we observe an increasingly important impact of the fast ions on transport, which is due to the nonlinear stabilisation of ITG turbulence. Above an empirical threshold of  [40], we observe a measurable impact of fast ions on the profiles. The main ion mass has an impact on the fast-ion content and therefore indirectly influences the heat transport. In H, the fast-ion content is significantly lower than in D—the reason for this being two-fold: the first is technical because the fast-ion temperature by H NBI is lower and second because the fast-ion slowing is mass dependent, i.e. lower ion masses lose their energy faster. The consequence is that D discharges, where the fast-ion content contributes to turbulence stabilisation, will have lower ion heat transport in the core compared to H discharges at the same heating power in electrons
  and ions
  , but lower fast-ion content.
There are still missing aspects which are currently under investigation in AUG. We require a more detailed understanding of the different contributions to  at the L–H transition and the evolution in weak H-modes close to
  , where direct measurements of the radial electric field gradients are desired. The study of mixed isotopes at the L–H transition misses points at intermediate H concentration and the impact of mixed isotopes in H-mode needs to be documented. However, the physics mechanisms discussed here are expected to apply to mixed isotopes as well. The transport properties of mixed isotope plasmas are then expected to be dominated by the way the experiments are conducted, i.e. heating with D-NBI or H-NBI which changes the fast-ion content. This is directly connected to H plasmas with higher fast-ion content, which should allow one to study the impact of the isotope mass at higher plasma β, including the interplay with fast-ions. A reconstruction of the density sources from neutral flux measurements has recently become available at AUG [56] which should help to reduce the uncertainty of particle transport due to the relatively unknown recycling sources, and help to establish a theory-based understanding of how the plasma shape impacts the particle confinement at the edge. With these new measurements, we will continue the benchmark of modelling tools with predictive capabilities regarding different main ion masses and also mixed isotope plasmas.
Acknowledgment
The authors would like to thank C Angioni, M Cavedon and F Ryter for fruitful discussions. This work has been carried out within the framework of the EUROfusion Consortium and has received funding from the Euratom research and training programme 2014–2018 and 2019–2020 under Grant Agreement No. 633053. The views and opinions expressed herein do not necessarily reflect those of the European Commission.
Data availability statement
The data that support the findings of this study are available upon reasonable request from the authors.