


Abstract
High dose intake of fluoride results in fluorosis and our previous experiments at single-molecule level using magnetic tweezers have proved that fluoride anions destabilize DNA hairpin and its equilibrium critical force decreases with increasing concentration of fluoride anions. One possible mechanism is that a fluoride anion competes with a DNA base and forms a hydrogen bond with its complementary base. The Isothermal Titration Calorimetry experiments suggest that the fluoride anion does not form a hydrogen bond with a DNA base. With increasing concentration of fluoride anions, decreasing Zeta potentials for different oligonucleotides enhance the electrostatic repulsion between complementary oligonucleotides, which accounts for the decreasing association constant and destabilization of DNA hairpin. Molecule dynamics simulation was further performed to determine the ion distribution around the oligonucleotide, radial distribution functions (RDFs) indicate that the fluoride anion distributes far from the oligonucleotide in comparison with the chloride anion, which is the possible mechanism that decreases Zeta potentials with the increasing concentration of fluoride anions.
Export citation and abstract BibTeX RIS
Fluoride, a member of the halogen family elements, is related to human health in different ways. On one hand, fluoride is used as an additive in different oral hygiene products to prevent tooth decay; on the other hand, high dose of fluoride intake results in severe fluoride toxicity, including osteoporosis, neurological and metabolic dysfunctions and cancer [1–3]. As a common endemic disease, its mechanism remains elusive.
Effects of fluoride on health are supposed to be related to the way that fluoride anion interacts with biomolecules. Recent studies identified a selectively fluoride-responsive riboswitch with a conserved domain crcB motif which binds fluoride anion specifically [4–7]. It is demonstrated that the highly conserved nucleotides of crcB RNAs undergo a structural transition on addition of fluoride anions, and adopt a higher-order RNA architecture stabilized by a pseudoknot and long-range reversed Watson-Crick and Hoogsteen  pair formation. However, effects of fluoride anion on the transition of crcB motif were dependent on
  , one fluoride anion was directly coordinated by three
  , through this pocket, the fluoride anion realized the specific binding to crcB motif. No specific binding was observed in the absence of
  . Further cell or tissue level studies have reported that DNA synthesis and the activity of some enzymes, as well as the metabolism of nutrients, can be severely influenced by the presence of fluoride anions [8–10].
Recent single-molecule experiment using magnetic tweezers directly detected effects of the fluoride anion on stability of DNA hairpin structure in the absence of  [11]. The hairpin structure was linked between two GC-rich double stranded DNA (dsDNA) handles, which are linked to coverslip surface and paramagnetic bead M280, respectively. The single-molecule experiment was carried out at room temperature and under experiment conditions with
  NaCl,
NaCl,  Tris buffer, pH 7.2. The reversible unfolding/folding transition of DNA hairpin was identified, and the chloride anions
  were gradually replaced by the same amount of fluoride anions
  , resulting in the critical forces of DNA hairpin decreasing gradually.
The stability of B-DNA at physiological condition is critical for biological processes, such as DNA duplication and gene expression [12]. The influence of fluoride anions on the stability of B-DNA is essential knowledge to study the mechanism of fluorosis. The fluoride anion is a potent hydrogen bond acceptor, direct  –H hydrogen bond could compete with the hydrogen bond between bases in complimentary oligonucleotides. Therefore, the fluoride anion affects the stability of DNA hairpin structure.
In this work, in order to identify the mechanism by which fluoride anions destabilize the DNA hairpin structure, Isothermal Titration Calorimetry experiment and measurements of Zeta potentials were combined to detect the formation of a hydrogen bond between a fluoride anion and a DNA base in an oligonucleotide, effects of fluoride anions on the Zeta potentials of the oligonucleotide and the thermodynamic parameters related to the hybridization of the oligonucleotide. At last, molecule dynamics simulation was performed at different ion atmosphere, and radial distribution functions of the ion were calculated to identify the ion distribution around the oligonucleotide.
Experimental section
DNA sample preparation
In a previous single-molecule study [11], the sequence of DNA hairpin was designed as  -GAG TCC TGG ATC CTG TTTTTTTT CAG GAT CCA GGA CTC-
 to detect effects of the fluoride anion on the stability of the DNA hairpin. According to the stem sequence of the DNA hairpin, complementary oligonucleotide 1 and oligonucleotide 2 were designed as


which will be used to carry out Isothermal Titration Calorimetry experiments and measure Zeta potentials at the same experimental conditions as the aforementioned single-molecule experiment. The sequences are purchased from Sangon Biotech, Shanghai, China.
Oligonucleotide 1 and oligonucleotide 2 were first dissolved in the reaction buffer with 150 mM NaCl and 10 mM Tris buffer, separately, with their corresponding concentration in the reaction buffer at 0.01 mM and 0.1 mM, and after that, the chlorine anions in the reaction buffer were replaced with the same amount of fluoride anions, but the corresponding concentration of oligonucleotide 1 and oligonucleotide 2 remained constant.
Isothermal titration calorimetry experiment
Isothermal Titration Calorimetry experiments were carried out on a Nano ITC G2 (TA instruments) [13]. Before the experiments, all the solutions used in the experiments including deionized water were degassed at 25 °C for at least 10 minutes, while reaction cell and titration syringe were moisturized 3–5 times using the reaction solution (150 mM NaCl, 10 mM Tris buffer). After degassing, the oligonucleotide 1 solution (1 ml, 0.01 mM) and deionized water were loaded into the reaction cell and the reference cell, respectively. The oligonucleotide 2 solution (250 μl, 0.1 mM) was loaded into a titration syringe, and then the titration syringe was inserted into the reaction cell. The stirring was started and its rate was set at 250 rpm. The instrument was equilibrated at 25 °C until the baseline was flat and stable.
The titration data were analyzed using the NanoAnalyze software (TA Instrumnets) and an independent model to obtain the fitting graph and thermodynamic data of the experiments.
Measurement of Zeta potentials
Zeta potentials, as the index of the surface charge of a molecule, determines the dispersion stability of molecules. The Zeta potential was measured based on  Nano Submicron Particle Size and Zeta Potential (Beckman Coulter). By combining electrophoresis and laser Doppler velocimetry techniques, the electrophoretic mobility Ue
was measured, and then the Zeta potential ζ can be calculated as
Nano Submicron Particle Size and Zeta Potential (Beckman Coulter). By combining electrophoresis and laser Doppler velocimetry techniques, the electrophoretic mobility Ue
was measured, and then the Zeta potential ζ can be calculated as

where η is the viscosity of the solution, ε is the solution permittivity, and the Henry function  strongly depends on ka, where a is the radius of the charge particle, approximated by the gyration radius of the oligonucleotide in the current work. k is the Debye-Huckel parameter and
  is the Debye length [14–16].
Molecule dynamics simulation procedures
An all-atom molecule dynamics simulation was performed with GROMACS software [17–19] using the Parmbsc1 version of the Amber parm99 force field [20] to identify the ion distribution around the oligonucleotide. Oligonucleotide 1 was initially centered in a dodecahedron periodic box, with the walls placed at least 12 Å from any of the solute atoms, and filled with TIP3P water molecules [21]. The following simulations are performed in the reaction buffer with 150 mM  and 150 mM
  , separately, by replacing water molecules with the same amount of
  ,
,  and
and  . All bonds with hydrogen atoms were constrained by the LINCS algorithm [22], and the integration time step was set to 2 fs. The electrostatic interactions were treated using the particle mesh Ewald summation method, with a cutoff of 10 Å. The same cutoff was applied even for short-range Lennard-Jones interactions. Coordinates were collected in trajectory files every 1 ps [23]. More details of the protocol are described in ref. [24].
Results and discussions
According to a typical ITC experiment protocol [13], oligonucleotide 1 was placed into a calorimeter cell (NanoITC, TA Instruments), oligonucleotide 2 was added in a small portion (8 μl), and the heat output due to the interaction between oligonucleotide 1 and oligonucleotide 2 was recorded. Data fitting using NanoAnalyze software gives the association constant Ka
, binding enthalpy  , entropy
  directly, and the free energy
  can be further elucidated.
Effects of fluoride anion on the hybridization process of oligonucleotide 1 and oligonucleotide 2 were detected first by replacing the chlorine anion in the reaction buffer with the same amount of fluoride anion. The oligonucleotide 2 solution was titrated into the oligonucleotide 1 solution and then the ITC experiment results corresponding to the concentration of fluoride anion from 0 mM to 150 mM are illustrated in fig. 1(a)–(e), where the strong heat output peaks in its upper layer indicate that ITC detects obvious binding of oligonucleotide 2 to oligonucleotide 1. Fitting of the raw data in the lower layers gave the thermodynamic data (shown in table 1), which shows the association constant Ka decreasing gradually with increasing concentration of fluoride anions. In the upper layers, the heat output at different concentrations of fluoride anions undergoes the initial strong peaks and returns to the baseline, but the strength of weak peaks near the baseline decreases with the increasing concentration of fluoride anions from 0 mM to 150 mM.
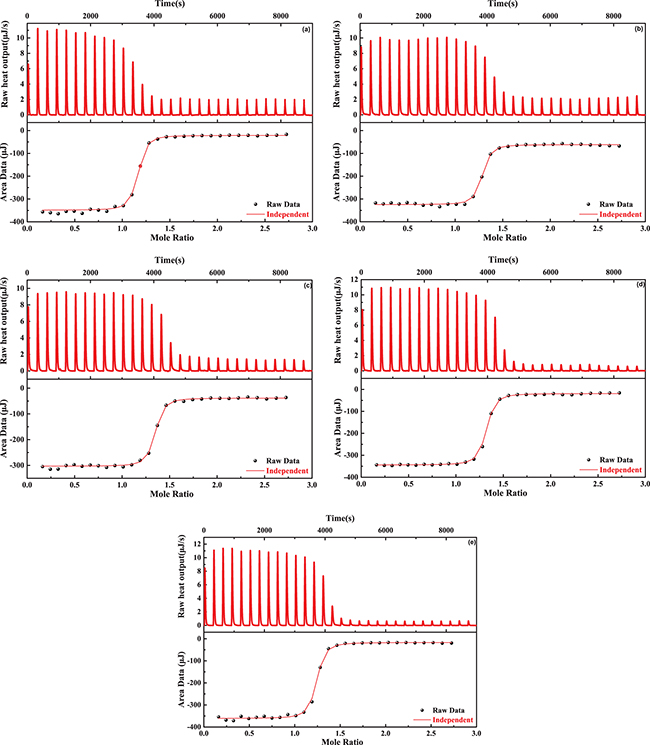
Fig. 1: ITC titration curves of oligonucleotide 2 binding to oligonucleotide 1 at different concentrations of the fluoride anion, (a) 0 mM, (b) 1 mM, (c) 10 mM, (d) 100 mM, (e) 150 mM.
Download figure:
Standard imageTable 1:. Thermodynamic data for titration of oligonucleotide 2 to oligonucleotide 1 at different concentration of fluoride anion, where the units of  and
and  are kJ/mol and
  , respectively.
Concentration of 
|
 M -1 M -1
|

|

|
|---|---|---|---|
| 0 mM | 8.31 | 327.0 | 945.2 |
| 1 mM | 8.10 | 329.2 | 952.7 |
| 10 mM | 7.87 | 331.1 | 959.0 |
| 100 mM | 7.44 | 406.7 | 1213.0 |
| 150 mM | 6.76 | 430.8 | 1295.0 |
A recently developed relation  connected the association constant Ka
with the binding strength Δε, where υlon was approximated by the volume occupied by water molecule in solution [25]. Under the experimental conditions with 150 mM NaCl, 10 mM Tris buffer, the association constant Ka
obtained from the raw data fitting is
connected the association constant Ka
with the binding strength Δε, where υlon was approximated by the volume occupied by water molecule in solution [25]. Under the experimental conditions with 150 mM NaCl, 10 mM Tris buffer, the association constant Ka
obtained from the raw data fitting is  M -1. At room temperature, its corresponding average binding strength Δε per hybridized complex between oligonucleotide 2 and oligonucleotide 1 is about
  and the average free energy per base pair calculated according to the nearest-neighbour model [26,27] is about
  , which includes hydrogen bonding and base stacking. As pointed out by some studies [26,27], base stacking accounts for about half of this amount, namely, an average hydrogen bond strength is about
  , consistent with the typical strength of hydrogen bond.
This method highlights the potential application of the Isothermal Titration Calorimetry experiment to test whether a fluoride anion forms a hydrogen bond with a DNA base in an oligonucleotide. By titrating fluoride anions dissolved in deionized water with 0.1 mM into the reaction buffer with oligonucleotide 1 0.01 mM and NaCl 150 mM, the heat output shown in the upper layer of fig. 2 indicates that ITC did not detect any binding of a fluoride anion to the base in oligonucleotide 1, namely, no hydrogen bond was formed between fluoride anion and DNA base in oligonucleotide 1.
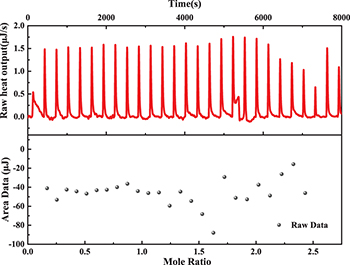
Fig. 2: ITC curves for titration of 0.1 mM fluoride anion into the reaction buffer with 0.01 mM oligonucleotide 1 and 150 mM NaCl.
Download figure:
Standard imageEffects of increasing fluoride anions on the association constant Ka
and the strength of weak peaks near the baseline could be due to the Zeta potentials. Zeta potentials of oligonucleotide 1, oligonucleotide 2 and their hybridized complex were measured at different concentrations of fluoride anion and pH values. As shown in fig. 3(a), with increasing concentration of fluoride anion from 0.0 mM to 150 mM, Zeta potentials of oligonucleotide 1 and oligonucleotide 2 at  have similar decreasing trends from about −6 mV to −13 mV, and that of their hybridized complex decreased from about −12 mV to −21 mV, which originated from the increasing negative charge due to the hybridization of oligonucleotide 1 and oligonucleotide 2. Similar results at
  can be seen in fig. 3(b).

Fig. 3: Zeta potential of oligonucleotide 1, oligonucleotide 2 and their complex as a function of the concentration of fluoride anions at  and 7.6, respectively.
Download figure:
Standard imageHigh Zeta potentials generally lead to strong electrostatic repulsion between particles in a solution, so that particles have reduced probability to collide with each other and form particle aggregates. Obviously, Zeta potentials caused by replacing the chloride anions with the same amount of fluoride anions inhibit hybridization between oligonucleotide 1 and oligonucleotide 2 and result in the decreasing association constant Ka , and the destabilization of DNA hairpin. The gradual reduction in the strength of heat output near the baseline with increasing concentration of fluoride anions was also related to the decreasing Zeta potentials, which enhanced the conservative interaction between each titration and the solution in the calorimeter cell, which then reduced the heat output.
As indicated by equation  , Zeta potentials depend on the Henry function f(ka) and three parameters, namely electrophoretic mobility Ue
, viscosity of the solution η and solution permittivity ε. The Henry function is dependent on ka. The gyration radius of an oligonucleotide defined by the Worm-Like-Chain model can be expressed as
, Zeta potentials depend on the Henry function f(ka) and three parameters, namely electrophoretic mobility Ue
, viscosity of the solution η and solution permittivity ε. The Henry function is dependent on ka. The gyration radius of an oligonucleotide defined by the Worm-Like-Chain model can be expressed as  , where n is the number of nucleotides and b is the contour length per nucleotide, 0.58–0.67 nm [28]. The gyration radius of an oligonucleotide with 15 nucleotides is about 0.948 nm and the Debye length
  for the reaction buffer used in the experiment is 0.642 nm, by which the value of f(ka) can be determined in the range
 ![$[1.015,1.038]$](https://content.cld.iop.org/journals/0295-5075/134/2/28001/revision2/epl20508ieqn42.gif) , which is consistent with the value of
, which is consistent with the value of  used by
  Nano Submicron Particle Size and Zeta Potential (Beckman Coulter), where the Smoluchwski equation is used to calculate Zeta potentials [15,29,30].
Measurements by  Nano Submicron Particle Size and Zeta Potential (Beckman Coulter) also give electrophoretic mobility Ue
, viscosity of the solution η and solution permittivity ε. With the increasing concentration of fluoride anions in the reaction buffer, the viscosity of the solution η and solution permittivity ε does not change, but the electrophoretic mobility Ue
increases. Obviously, Zeta potentials decrease as a result of the increasing electrophoretic mobility Ue
, due to the changing of charge distribution caused by fluoride anions displacing the same amount of chloride anions.
Nano Submicron Particle Size and Zeta Potential (Beckman Coulter) also give electrophoretic mobility Ue
, viscosity of the solution η and solution permittivity ε. With the increasing concentration of fluoride anions in the reaction buffer, the viscosity of the solution η and solution permittivity ε does not change, but the electrophoretic mobility Ue
increases. Obviously, Zeta potentials decrease as a result of the increasing electrophoretic mobility Ue
, due to the changing of charge distribution caused by fluoride anions displacing the same amount of chloride anions.
In order to test this assumption, an all-atom molecule dynamics simulation was performed according to the procedures mentioned above. Snapshots at 50 ns in the reaction buffer with 150 mM  and 150 mM
  are shown in fig. 4(a) and fig. 4(b), in which blue, green and red particles indicate
  ,
,  and
and  , respectively. The average end-to-end distance of oligonucleotide 1 in the reaction buffer with 150 mM
  and 150 mM
  was
was  nm,
nm,  nm, respectively, indicating that the replacement of chloride anions with fluoride anions has no obvious effects on the conformation of oligonucleotide 1.

Fig. 4: (a) The snapshots of oligonucleotide 1 in the reaction buffer with 150 mM NaCl at 50 ns, (b) the snapshots of oligonucleotide 1 in the reaction buffer with 150 mM NaF at 50 ns. Blue, green and red particles indicate  ,
,  and
and  , respectively.
Download figure:
Standard imageRadial distribution functions (RDFs) of different ions were calculated to determine ion distribution around the conformation of oligonucleotide 1. The phosphate moieties on the backbone of oligonucleotide 1 were sorted in the  direction and the corresponding mass center of each phosphate group was set as the reference point of RDFs. Figures 5(a), (b) indicate the RDFs of
  and
and  centered around the 8th and 10th phosphate groups in the reaction buffer with 150 mM NaCl and 150 mM NaF, their corresponding RDFs of
  are shown in figs. 5(c), (d). Most of the
  distribute within the space with the distance from the mass center of the 8th and 10th phosphate groups less than 1.5 nm. The RDFs of
  centered around the 8th and 10th phosphate groups shift right in comparison with those of
  , and the RDFs of
  become dominant over those of
  at relatively large distance from the mass center of 8th and 10th phosphate groups. Similar results can be obtained for the RDFs of
  centered around other phosphate groups, so that the decreasing Zeta potentials with chloride anion in the reaction buffer replaced by the same amount of fluoride anion can be further accounted for by the MD simulation results.
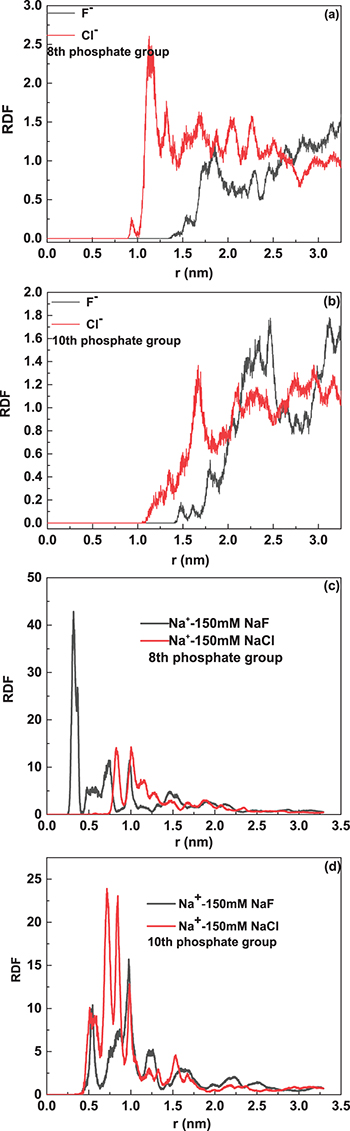
Fig. 5: Panels (a) and (b) correspond to radial distribution function of  centred around the 8th and 10th phosphate groups on the backbone of oligonucletide 1, respectively; panels (c) and (d) are the radial distribution function of
  centred around the 8th and 10th phosphate groups on the backbone of oligonucletide 1, respectively.
Download figure:
Standard imageConclusions
The combination of Isothermal Titration Calorimetry experiments and the measurement of Zeta potentials is applied to detect whether a fluoride anion forms a hydrogen bond with a DNA base in the oligonucleotide and the effects of fluoride anion on the hybridization of the oligonucleotide. Isothermal Titration Calorimetry experiments suggest that fluoride anion does not form a hydrogen bond with a DNA base. The fluoride anion in the reaction buffer has strong effects on the hybridization process, where the association constant of the complementary oligonucleotide is gradually reduced with the increasing concentration of the fluoride anion. Measurements of Zeta potentials indicate that Zeta potentials for different oligonucleotides decrease with the increasing concentration of fluoride anions. The enhanced electrostatic repulsion between complementary oligonucleotide accounts for the decreasing association constant and the destabilization of the DNA hairpin. Molecule dynamics simulation results indicate that the radial distribution functions (RDFs) of fluoride anions distribute far from the oligonucleotide in comparison with that of the chloride anion, which possibly results in the decreasing Zeta potentials with the increasing concentration of fluoride anions.
Acknowledgments
This research was supported by the National Natural Science Foundation of China under Grants Nos. 11464004, 11864006 and 11564015, Guizhou Scientific and Technological Program (20185781 and 20185781-15).