


Abstract
Ion cyclotron emission (ICE) driven by perpendicular neutral beam-injected (NBI) deuterons, together with the distinctive ICE driven by tangential NBI, have been observed from heliotron–stellarator plasmas in the large helical device (LHD). Radio frequency radiation in the lower hybrid range has also been observed Saito K. et al (2018 Plasma Fusion Res. 13 3402043), with frequency dependent on plasma density. Here we focus on recent measurements of ICE from deuterium plasmas in LHD, which show substantial variation in spectral character, between otherwise similar plasmas that have different local density in the emitting region. We analyse this variation by means of first principles simulations, carried out using a particle-in-cell (PIC) kinetic approach. We show, first, that this ICE is driven by perpendicular NBI deuterons, freshly ionised near their injection point in the outer midplane edge of LHD. We find that these NBI deuterons undergo collective sub-Alfvénic relaxation, which we follow deep into the nonlinear phase of the magnetoacoustic cyclotron instability (MCI). The frequency and wavenumber dependence of the saturated amplitudes of the excited fields determine our simulated ICE spectra, and these spectra are obtained for different local densities corresponding to the different LHD ICE-emitting plasmas. The variation with density of the spectral character of the simulated ICE corresponds well with that of the observed ICE from LHD. These results from heliotron–stellarator plasmas complement recent studies of density-dependent ICE from tokamak plasmas in KSTAR Thatipamula S.G. et al (2016 Plasma Phys. Control. Fusion 58 065003); Chapman B. et al (2017 Nucl. Fusion 57 124004), where the spectra vary on sub-microsecond timescales after an ELM crash. Taken together, these results confirm the strongly spatially localised character of ICE physics, and reinforce the potential of ICE as a diagnostic of energetic ion populations and of the ambient plasma.
Export citation and abstract BibTeX RIS
1. Introduction
Ion cyclotron emission (ICE) is widely observed from magnetically confined fusion (MCF) plasmas [4]. In addition to historical observations from deuterium–tritium plasmas in JET [5, 6] and TFTR [7], since 2017 ICE has been reported and analysed from the KSTAR [8, 9], DIII-D [10], ASDEX-Upgrade [11–13], TUMAN-3M [14] and EAST [15] tokamaks, and the large helical device (LHD) heliotron–stellarator [16–18]. ICE spectra typically comprise a succession of narrow, strongly suprathermal, peaks at sequential cyclotron harmonics of an energetic ion species. These species include fusion-born ions [5], neutral beam injected (NBI) ions [19], and ions energised by ion cyclotron resonant heating [20]. The emitting region is identified by matching spectral peak frequencies to local magnetic field strength. While in most cases it corresponds to the outer midplane edge plasma, ICE from the plasma core has recently been reported from the TUMAN-3M [14], ASDEX-Upgrade [12] and DIII-D [21] tokamaks. ICE has also been observed in NSTX and NSTX-U where it was found to be spatially collocated with internal transport barriers [22]. It is clear that the plasma physics process responsible for ICE is the magnetoacoustic cyclotron instability (MCI) [23]. This excites waves on the fast Alfvén-cyclotron harmonic branch, by drawing on the free energy of fast ions whose distribution in velocity-space incorporates a population inversion. The linkage between ICE and the MCI was established by early analytical studies [24–27], and reinforced in the past decade by first principles computational studies using the particle-in-cell (PIC) approach [3, 8, 9, 20, 28–31]. In outline, the MCI involves the excitation, through wave-particle cyclotron resonance, of quasi-perpendicular propagating waves on the fast Alfvén-cyclotron harmonic branches. For these waves, the perpendicular phase velocity ω/k⊥ ≃ VA, with VA the Alfvén speed, implying that energetic ions with v⊥ ≃ VA will dominate any wave-particle resonant instability drive. Such drive is, of course, only possible at spatial locations where the energetic ion velocity-space distribution near v⊥ ≃ VA exhibits a population inversion, that is, ∂f/∂v⊥ > 0 locally. This intuitively attractive physics was identified in the pioneering formulation of the MCI by Belikov and Kolesnichenko [23] and in subsequent analytical studies [24–27]. It also emerges naturally from PIC-based studies of the relaxation of energetic ion distributions in majority thermal plasmas [3, 8, 9, 20, 28–31]. In these, the collective instability, and indeed the normal modes themselves, are not prior assumptions; instead they emerge from the summation, over tens of millions of macroparticles, of self-consistent gyro-resolved kinetics and field evolution.
The notion that the strongest drive comes from v⊥ ≈ VA originates in the mathematical analysis of the linear MCI. Specifically the kinetic dielectric tensor elements are rich in Bessel functions whose arguments k⊥ v⊥/Ω, see for example equations (11) to (13) of reference [26], become k⊥ v⊥,0/Ω for the driving energetic ion population, with Ω and v⊥,0 its cyclotron frequency and speed respectively.
Since Ω also approximates to k⊥ VA for the fast Alfvén wave at its fundamental cyclotron resonance, the Bessel function argument approximates to v⊥,0/VA. In addition, since the most significant contributions (involving sign reversals, etc) from the Bessel functions and their derivatives concentrate around where their argument equals unity, linear theory implies in broad terms that the dominant contribution to driving the MCI comes from energetic ions that have v⊥ close to VA, irrespective of their v∥. This line of reasoning, first developed by Belikov and Kolesnichenko [23] in the 1970s, also works for nth cyclotron harmonics and corresponding nth order Bessel functions and derivatives, hence the broadly comparable linear growth rates calculated across a range of low cyclotron harmonics shown in e.g. figure 3 of reference [26]. The central role of Bessel functions in linear MCI theory carries over into the sub-Alfvénic regime, see for example equations (9), (10) and (16) of reference [32]. The analytical theory of the MCI, which contributes to explaining many aspects of ICE observations, has recently undergone a renaissance, see for example references [33, 34]. The supposition, derived from linear MCI theory, that ICE observations at proton cyclotron harmonics in KSTAR deuterium plasma is mainly driven by energetic ions with v⊥ ∼ VA turned out to have predictive power, see reference [3].
The NBI ions driving ICE are not necessarily super-Alfvénic, even marginally. An early example of sub-Alfvénic ICE arose in TFTR DT supershots [35]. In the LHD cases considered here, v⊥,0 = vNBI is less than VA by factors of around two, with vNBI the speed of the NBI ions. This deeply sub-Alfvénic ICE regime is underexplored in terms of published experimental data. Here we report three instances from LHD, which we examine using first principles studies of the nonlinear regime of the MCI, using PIC-type approaches. In addition, the path taken here differs from that of reference [18] for which both the density and magnetic field were changed in order to vary vNBI/VA, whereas only the density was changed here. For example, if one adjusts the value of vNBI/VA by changing the injection energy of the fast ions (hence the value of vNBI), in principle the bulk plasma parameters could remain invariant. Whereas if one adjusts the value of vNBI/VA by changing the plasma density (hence the value of VA), this results also in a change of the value of key bulk plasma ratios such as plasma frequency to cyclotron frequency, and in the value of the lower hybrid cutoff. These are, of course, important for fast wave physics in plasmas. PIC code algorithms [36] solve the Maxwell–Lorentz system of equations, typically for tens or hundreds of millions of interacting charged macroparticles—energetic ions, thermal ions, and electrons—together with the self-consistent electric and magnetic fields. Collective instabilities thus emerge at the level of particle kinetics and field dynamics. The PIC approach can retain full gyro-orbit resolution, and is thus particularly suitable for phenomena that incorporate gyroresonance, such as the MCI. In PIC studies for ICE interpretation, a minority energetic ion population is initialised with a distinct, physically motivated, velocity-space inversion. This population then relaxes under the Maxwell–Lorentz system, while coupled to the thermal ions and electrons, and interacting with, and generating, self-consistent fields. Typically, the frequency and wavenumber dependence of the saturated amplitudes of the MCI-excited fields determine the simulated ICE spectra, which are then compared to the observed ICE spectra. Our PIC computational approach, using the hybrid-PIC code [29], is the same as used in reference [18], to which we refer for further detail. The foregoing approach was recently applied to observations of ICE from hydrogen plasmas in LHD, driven by NBI protons injected perpendicular to the confining magnetic field [18]. A focus of reference [18] is the dependence of observed ICE properties on whether the NBI protons are super-Alfvénic or sub-Alfvénic in the emitting region of the plasma; that is, whether vNBI/VA is larger or smaller than unity, where vNBI is the speed of the NBI ions and VA the local Alfvén speed. The present computational study addresses measurements of ICE from significantly sub-Alfvénic populations of energetic NBI ions, under conditions where the local density differs significantly between LHD plasmas. At fixed NBI energy and local field strength, the value of VA is governed by the value of the density. In recent PIC studies of ICE from the KSTAR tokamak, ICE chirping on sub-microsecond timescales during the ELM crash was interpreted [3] in terms of fast density dependence arising from filament motion. Understanding the density dependence of ICE phenomenology is thus topical, both experimentally and in relation to theory and interpretation. In particular, it will assist the exploitation of ICE measurements to infer the key features of the velocity-space distribution of energetic ion populations in MCF plasmas.
2. Sub-Alfvénic ICE
Ring-beam distributions in velocity-space, as adopted in the present paper, are appropriate for representing freshly ionised populations of NBI ions, and were used in initial studies of the excitation of electrostatic modes to interpret probe measurements of ICE in TFTR plasmas with deuterium and tritium NBI in reference [27]. This electrostatic instability (as distinct from the fully electromagnetic treatment now prevalent, including in the present paper) did not rely on the fast Alfvén wave, and could be driven by significantly sub-Alfvénic fast ions, given a very narrow distribution of speeds parallel to the magnetic field. Computed growth rates for tritium (T) harmonics degenerate with background D were relatively lower, providing a link with the observed reduced intensity of ICE spectral peaks at the third and sixth T harmonics in some TFTR experiments, see figure 2 of reference [27]. Subsequently in TFTR, ICE was observed at cyclotron harmonics of the fusion products (3He in DD supershots, and both 4He and 3He in T and in DT supershots) and of the sub-Alfvénic NBI-injected D and T. As with ICE in JET, the emission originated from the outer midplane edge plasma, but there were significant differences with respect to JET, particularly in the time evolution of the TFTR ICE signals. Typically, during the first 50 to 200 ms following the NBI trigger, cyclotron frequencies of the fusion products dominated the measured ICE spectrum, but then died out. They were replaced by ICE spectral peaks at multiple cyclotron harmonics of the injected D and T, until the NBI injectors were turned off. In subsequent TFTR experiments, Helium was puffed [35], forcing the plasmas to transit from typical supershots to pure L-modes. This changed the electron critical density and hence the local value of the ratio vα /VA ≶ 1, where vα is the alpha-particle birth velocity and VA is the local Alfvén speed in the ICE-emitting region at the plasma edge. The transient nature of ICE in TFTR supershots could be explained by the fact that the alpha-particle fusion products were sub-Alfvénic in the edge plasma. A plasma shifting from supershot to L-mode leads to early alpha-particle-driven ICE generation lasting for ≈200 ms which then soon extinguishes, typical of the supershot phase, see figure 7 of reference [35]. The linear MCI treatment [7, 27, 32] distinguishing the sub-Alfvénic behaviour of TFTR from super-Alfvénic regimes typical of JET lead to higher growth rates for the former compared to the latter. This phenomenology follows from orbits and velocity-space considerations. In the observations from DIII-D (reference [10]) and ASDEX-Upgrade (references [11–13]) the NBI ions are also sub-Alfvénic, but the observational focus is on core ICE. For core ICE, the MCI physics is more complex and less certain: partly because fusion-born ions may additionally contribute to the drive; and partly because there are no core ICE counterparts to the very high-resolution measurements of plasma conditions for edge ICE, as shown for LHD in e.g. figure 4 of the present paper. The distinctive ICE measurements from NSTX and NSTX-U [22] appear to be driven, near transport barriers, by ions that are locally mildly super-Alfvénic. ICE from the core plasma in the small (major radius 0.557 m, minor radius 0.256 m) TUMAN-3M tokamak was observed in association with sub-Alfvénic NBI using a mixture of hydrogen and deuterium using magnetic probes [14]. The density-dependence of ICE spectra driven by substantially sub-Alfvénic NBI ions has not previously been explored, and especially not in otherwise similar plasmas, as here. Reference [18] addresses two cases of ICE, on either side of the boundary between sub-Alfvénic and super-Alfvénic in LHD. References [3, 8] for KSTAR include density-dependence, but this is continuously and rapidly varying on microsecond timescales in the ELM crash, which is a very different context from the quasi-stationary conditions in the present paper. Furthermore the driving ions (3 MeV fusion-born protons) in references [3, 8] are strongly super-Alfvénic with v⊥ close to VA. The NBI deuterons driving the ICE in KSTAR, reference [9], are mildly sub-Alfvénic. As noted in the caption to figure 5 there, the action of the MCI is concentrated in (ω, k) space in the fairly narrow wedge between vNBI and VA. Among other things, this motivates the drive to 'open the wedge' in the present paper; as noted in the main text and captions, we go down to vNBI/VA = 0.36 in LHD plasma 138 439.

Figure 1. Schematic diagram of LHD plasma showing locations and directions of NBI beams.
Download figure:
Standard image High-resolution image
Figure 2. Measured time traces for: (left panel) LHD plasmas 138 439 (black traces) and 138 458 (red), to which NBI #4 and NBI #5 were applied in separate brief bursts; (right panel) LHD plasma 138 433 during which NBI #5 was operated continuously. From top to bottom, the five vertically arranged panels are: (a) neutron flux; emission intensity detected by RF spectrometer for frequency channels at (b) 30 MHz and (c) 60 MHz; (d) NBI port through power; (e) line averaged density.
Download figure:
Standard image High-resolution image3. ICE from LHD deuterium plasmas: diagnostic context
In the LHD heliotron–stellarator, the ICE driven by perpendicular NBI deuterium, and the distinctive ICE driven by tangential NBI, have previously been observed using loop antennas [1]. Moreover, radiofrequency emission has been observed in the lower hybrid range, with frequency dependent on plasma density. Here we address recent measurements of radio-frequency emission at multiple deuteron cyclotron harmonics from deuterium plasmas in LHD, which show substantial variation in spectral character, between otherwise similar plasmas that have different local density in the emitting region. These measurements are obtained with the dipole antenna described below. We show that this ICE is driven by perpendicular NBI deuterons, freshly ionised near their injection point in the outer midplane edge of LHD. These NBI deuterons undergo collective sub-Alfvénic relaxation, which we follow deep into the nonlinear phase of the MCI. The variation with density of the spectral character of the simulated ICE corresponds well with that of the observed ICE from LHD. These results from heliotron–stellarator plasmas complement recent studies of density-dependent ICE from tokamak plasmas in KSTAR [2, 3], where the spectra vary on sub-microsecond timescales after an ELM crash. Taken together, these results confirm the strongly spatially localised character of ICE physics, and reinforce the potential of ICE as a diagnostic of energetic ion populations and of the ambient plasma.
On LHD, the acquisition system of the ICE measured at a dipole antenna located in the 10-O port inside the vacuum vessel was developed in partnership with KSTAR [37–40]. A fast digitizer performs direct sampling of the radiofrequency measurements at a frequency of 1.25 GSa/s. The time evolution of the RF spectral intensity is determined from this signal using a 14-channel filter bank spectrometer in the range of 70 MHz to 2800 MHz, with intermediate spectral resolution and with μs time resolution; for a duration spanning the whole plasma discharge [39]. This dipole antenna measuring the ICE is located close to NBI #5 and toroidally opposite to NBI #4, see figure 1.

Figure 3. Observed ICE power spectra for three LHD deuterium plasmas at times indicated by the blue vertical dashed lines in figure 2 during operations of NBI #1-3, 5 for LHD plasmas 138 439, 138 458 and 138 433 which differ primarily in their edge plasma densities. The peak-to-peak frequency separation Δf is 12.05 MHz in all three cases. Identifying Δf with the local deuteron cyclotron frequency ΩD implies a magnetic field strength B = 1.581 T, which corresponds to an outer midplane plasma edge location in LHD.
Download figure:
Standard image High-resolution image4. Observed density dependence of NBI-driven ICE from LHD deuterium plasmas
During perpendicular deuterium NBI experiments in LHD, it was observed that the spectral character of the ICE changes significantly between plasmas whose parameters in the emitting edge region differ only in their electron density. The left panel of figure 2 shows that ICE at frequencies 30 MHz and 60 MHz was observed only when NBI #5 was operated without NBI #4 in LHD plasmas 138 439 and 138 458. Conversely, in these plasmas, ICE was not observed when only NBI #4 was operated without NBI #5. Moreover, as shown in the right panel of figure 2 , ICE was continuously observed during continuous operation of NBI #5 in LHD plasma 138 433. These results support the interpretation below that ICE measured at the dipole antenna is driven locally by perpendicular-NB injected deuterons from NBI #5. Figure 3 shows the ICE power spectra observed at the time indicated by the vertical blue dashed line in figure 2 for LHD plasmas 138 439, 138 458 and 138 433 which differ primarily in their edge plasma densities. The profiles of the electron density, electron temperature, and ion temperature are shown in figure 4. These were taken at instants which are very close to the times at which the ICE spectra, shown in figure 3, were observed. Figure 3 shows that, as the electron density increases, the amplitudes of the ICE spectral peaks typically increase, in the frequency range of interest to us below 120 MHz; the number of harmonics increases; and the width of spectral peaks increases. If we identify the 12.05 MHz spacing between the ICE spectral peaks in figure 3 with the local deuterium cyclotron frequency, this suggests that the local background magnetic field value is 1.581 T and hence the emission location is at R = 4.651 m, as illustrated in figure 5. Table 1 summarises the plasma parameters at the inferred emission location where the deuteron cyclotron frequency matches 12.05 MHz, with reference to figure 4, together with values for the velocity of freshly injected ions vNBI, and the local Alfvén speed VA. We note for future analysis that, since the Alfvén speed is given by

with ne and mD the electron density and the deuteron mass respectively, the key dimensionless ratio of the NBI deuteron speed to the Alfvén speed, vNBI/VA, also increases as ne increases. We observe that in all three plasmas, the NBI deuterons are in the sub-Alfvénic regime. This regime was previously investigated in earlier ICE experiments carried out in TFTR, involving gas puffing [35, 41]. This changed the edge plasma density, transitioning the fusion-born alpha-particles from a sub-Alfvénic to a super-Alfvénic regime in that region. The consequences for the TFTR ICE spectrum are discussed in figures 7–9 of reference [35]. We note that the Alfvén speed definition equation (1) includes D only: the ratio D/(D + H) remains constant and very close to unity during the plasmas studied. Our simulations incorporate the effect of both the thermal deuterons and the energetic deuterons NBI population as explained in the next section.
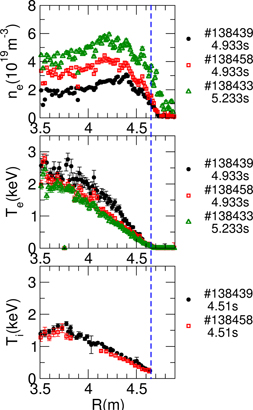
Figure 4. Measured radial profiles of the LHD plasmas. (Top) electron density, and (middle) electron temperature, obtained by Thomson scattering at the time of the ICE spectra displayed in figure 2; (bottom) ion temperature obtained by charge exchange spectroscopy during heating by NBI #4.
Download figure:
Standard image High-resolution image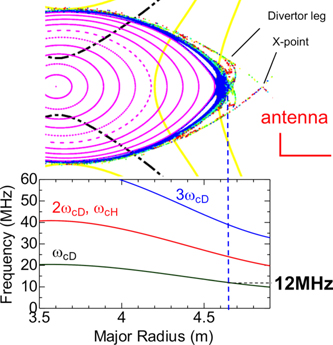
Figure 5. Identifying the approximate location of the region where ICE is generated during perpendicular deuterium NBI in LHD. We match the approximate frequency spacing between observed neighbouring ICE peaks, ≃12 MHz, to the spacing between successive local deuteron cyclotron harmonics. This is possible only at R ≃ 4.65 m.
Download figure:
Standard image High-resolution imageTable 1. Edge plasma parameters and NBI deuteron energies, with corresponding values for vNBI/VA which are significantly sub-Alfvénic.
| LHD plasma | Te (eV) | ne(1019 m−3) | NBI #5b (keV) | vNBI (106 ms−1) | VA(106 ms−1) | vNBI/VA |
|---|---|---|---|---|---|---|
| 138 439 | 70 | 1.2 | 66.7 | 2.53 | 7.04 | 0.36 |
| 138 458 | 80 | 1.8 | 66.7 | 2.53 | 5.75 | 0.44 |
| 138 433 | 50 | 3.4 | 68.7 | 2.57 | 4.18 | 0.61 |
5. First principles simulations of ICE spectra and their density dependence
5.1. Basis of the computational approach
Our hybrid-PIC simulations, reported below, use the deuterium injection energies of NBI #5b given in table 2 to define the initial perpendicular velocity of the energetic minority deuteron population. These deuterons are represented in velocity space as a gyro-resolved ring-beam distribution  , as discussed further in section 5.2, which coexists with a much more numerous gyro-resolved thermal deuteron population together with a charge-neutralising electron fluid. With this 1D3V code, the wavenumbers of spatial variations can only be oriented along the single axis (1D) of the spatial domain, the x-direction. It is nevertheless possible to fully represent ion gyrations, because the code is 3V. This is done by integrating
  over time. Once initialised, this system subsequently relaxes under first principles self-consistent Maxwell–Lorentz dynamics. The majority thermal deuterons have Ti
= 280 eV, which is inferred from the LHD ion temperature profile shown in figure 4 in combination with the result of figure 5; we use the associated thermal velocity vTi = 1.64 × 10⁵ ms−1 to characterise their initially Maxwellian distribution. It follows that vNBI/vTi = 15.43, which is also the ratio of ion Larmor radii rL,NBI/rTi. We use 32 798 particles per cell for the thermal background deuterons and 8192 particles per cell for the NBI deuterons. The 1.581 T background magnetic field is perpendicular to the 1D spatial domain of our simulation, which consists of 4096 cells. The 1D spatial domain of the simulations is taken to correspond to the radial direction, such that the perpendicular background magnetic field is oriented in the toroidal direction. The wavevector k of spatial fluctuations propagates radially outwards if positive. The cell sizes are 0.0028 m, 0.0022 m and 0.0014 m for LHD plasma 138 439, 138 458 and 138 433 respectively, which correspond respectively to multiples of 1.31, 1.00 and 0.65 of the characteristic gyroradius rTi of the thermal deuterons. The different plasma densities give rise to different electron skin depths λe: 0.0015 m, 0.0013 m and 0.0009 m, respectively. These need to be smaller than the cell sizes to be consistent with PIC-hybrid model assumptions [42, 43]. Chosen as above, the cell sizes keep the ratio of Δx/λe constant at about 1.70 in all three cases. This approach thus captures cyclotron resonant phenomenology directly, at the level of particle–field interactions for individual ions moving on their resolved gyro-orbits. The hybrid-PIC model used here relies on collisionless ions and Coulomb collisions are not taken into account over the time scales studied (the deuteron gyroperiod τD = 0.1 μs). In the appropriate limit, the code recovers the cold magnetised plasma dispersion relation. To enable systematic comparison of computational outputs, we use the same relative beam density ξ ≡ nNBI/ne for all our simulations; as distinct from, say, a constant absolute beam density. Specifically, we set ξ = 0.0005 in all simulations. The extent to which the value of ξ may have varied between the three LHD plasmas was explored using the FIT3D code [44, 45]. This makes it possible to estimate—subject to several unavoidable uncertainties—the time-evolving number density of the NBI deuterons which originate from injector #5 in LHD, summing over all NBI ion energies from zero to 67 keV. The FIT3D calculations necessarily relate to a radial location just inside the last closed flux surface (LCFS), whereas the ICE measurements in this paper appear to originate just outside the LCFS. The estimated values of ξ do not vary greatly. We find that the highest value of ξ among the three plasmas is estimated to occur for LHD plasma #138 439, which has the weakest observed ICE spectrum, see the top panel of figure 3. It is known that linear MCI drive is often a slowly monotonically increasing function of ξ [18, 31], other variables being equal. The reversal of this trend in the present case, where however density varies greatly between the three plasmas, suggests that the background density dependence effect we consider, which determines ICE spectral character in addition to ICE intensity, is dominant over any consequences of any variation in nNBI/ne.
over time. Once initialised, this system subsequently relaxes under first principles self-consistent Maxwell–Lorentz dynamics. The majority thermal deuterons have Ti
= 280 eV, which is inferred from the LHD ion temperature profile shown in figure 4 in combination with the result of figure 5; we use the associated thermal velocity vTi = 1.64 × 10⁵ ms−1 to characterise their initially Maxwellian distribution. It follows that vNBI/vTi = 15.43, which is also the ratio of ion Larmor radii rL,NBI/rTi. We use 32 798 particles per cell for the thermal background deuterons and 8192 particles per cell for the NBI deuterons. The 1.581 T background magnetic field is perpendicular to the 1D spatial domain of our simulation, which consists of 4096 cells. The 1D spatial domain of the simulations is taken to correspond to the radial direction, such that the perpendicular background magnetic field is oriented in the toroidal direction. The wavevector k of spatial fluctuations propagates radially outwards if positive. The cell sizes are 0.0028 m, 0.0022 m and 0.0014 m for LHD plasma 138 439, 138 458 and 138 433 respectively, which correspond respectively to multiples of 1.31, 1.00 and 0.65 of the characteristic gyroradius rTi of the thermal deuterons. The different plasma densities give rise to different electron skin depths λe: 0.0015 m, 0.0013 m and 0.0009 m, respectively. These need to be smaller than the cell sizes to be consistent with PIC-hybrid model assumptions [42, 43]. Chosen as above, the cell sizes keep the ratio of Δx/λe constant at about 1.70 in all three cases. This approach thus captures cyclotron resonant phenomenology directly, at the level of particle–field interactions for individual ions moving on their resolved gyro-orbits. The hybrid-PIC model used here relies on collisionless ions and Coulomb collisions are not taken into account over the time scales studied (the deuteron gyroperiod τD = 0.1 μs). In the appropriate limit, the code recovers the cold magnetised plasma dispersion relation. To enable systematic comparison of computational outputs, we use the same relative beam density ξ ≡ nNBI/ne for all our simulations; as distinct from, say, a constant absolute beam density. Specifically, we set ξ = 0.0005 in all simulations. The extent to which the value of ξ may have varied between the three LHD plasmas was explored using the FIT3D code [44, 45]. This makes it possible to estimate—subject to several unavoidable uncertainties—the time-evolving number density of the NBI deuterons which originate from injector #5 in LHD, summing over all NBI ion energies from zero to 67 keV. The FIT3D calculations necessarily relate to a radial location just inside the last closed flux surface (LCFS), whereas the ICE measurements in this paper appear to originate just outside the LCFS. The estimated values of ξ do not vary greatly. We find that the highest value of ξ among the three plasmas is estimated to occur for LHD plasma #138 439, which has the weakest observed ICE spectrum, see the top panel of figure 3. It is known that linear MCI drive is often a slowly monotonically increasing function of ξ [18, 31], other variables being equal. The reversal of this trend in the present case, where however density varies greatly between the three plasmas, suggests that the background density dependence effect we consider, which determines ICE spectral character in addition to ICE intensity, is dominant over any consequences of any variation in nNBI/ne.
The ratios of the NBI deuteron speed vNBI to the local Alfvén speed VA are 0.36, 0.44 and 0.60 for LHD plasmas 138 439, 138 458 and 138 433 respectively, see table 1. The NBI deuterons are thus in a significantly sub-Alfvénic (and accordingly computationally resource-intensive) regime for all three plasmas; they have an even lower value of vNBI/VA than the sub-Alfvénic NBI protons in LHD hydrogen plasmas whose ICE was addressed in reference [18].
Table 2. Table giving the different NBI energies, either H or D. The simulations use the deuterium energies of NBI #5b. Note from figure 1 that NBI #1, #2 and #3 are all directed parallel, whereas NBI #4 and #5 are perpendicular to the magnetic field.
| LHD plasma | NBI#1 | NBI#2 | NBI#3 | NBI#4a | NBI#4b | NBI#5a | NBI#5b |
|---|---|---|---|---|---|---|---|
| (keV),D | (keV),H | (keV),D | (keV),D | (keV),D | (keV),D | (keV),D | |
| 138 439 | 172 | — | 174 | 30.5 | 45.2 | — | 66.7 |
| 138 458 | 172 | 138 | — | 30.5 | 46.2 | — | 66.7 |
| 138 433 | 172 | 163 | 174 | 35.4 | 51.1 | — | 68.7 |
5.2. Simulated ICE spectra compared to observations
In our PIC-hybrid simulations, the energetic minority deuteron population is initialised with a ring-beam distribution in velocity space, of the form  , where vNBI is the injection speed resulting from the NBI #5b beam energies given in table 1. These NBI deuterons are initially distributed randomly and uniformly in gyroangle while the thermal deuterons are loaded by mean of a quiet start [46, 47], in both positions and velocities. The relaxation of this energetic ion population under the Maxwell–Lorentz system of equations gives rise to self-consistently excited electric and magnetic fields; see references [3, 28, 29] for details of this approach. Fourier transformation of the excited fields yields spectral information that is compared to the LHD observations. We focus on the lower cyclotron harmonics, for which the distribution of energy between the ICE spectral peaks shown in figure 3 displays significant changes between the three LHD plasmas. Figure 6 shows the simulated power spectra, alongside the measured spectra extracted from figure 3. The red, green and blue traces correspond to LHD plasmas 138 439, 138 458 and 138 433 respectively. In the middle and bottom panels of figure 6, these traces are obtained by taking the spatiotemporal fast Fourier transform of the values of δBz
output from the PIC-hybrid computations in the time interval between t = τD and t = 9τD (where τD = 2π/ΩD is the deuteron gyroperiod), which is summed over wavenumbers up to k = 40ΩD/VA. The agreement between observed and simulated ICE spectra appears good quantitatively. In both the top (experimental ICE) and middle (simulated spectra) panels in figure 6, the number of cyclotron harmonic spectral peaks increases as vNBI/VA increases, as does their amplitude. These trends can be examined in greater detail for the three plasmas separately in figure 7. Here our simulated power spectra are shown as dark traces, together with the measured ICE spectra which are plotted as coloured traces for comparison: red, LHD plasma 138 439; green, LHD plasma 138 458; blue, LHD plasma 138 433. The spectra are vertically offset in comparison with figure 6 such that the ordinate of the peak with largest amplitude is zero in each panel. In the left panel of figure 7, for which vNBI/VA = 0.36, the strongest spectral peaks in the simulation are at relatively low deuteron cyclotron harmonics, second to fourth. In the middle panel, for which vNBI/VA = 0.44, the middle order harmonics (fourth and fifth) become more pronounced. In the right panel of figure 7, for which vNBI/VA = 0.60, the amplitudes of the spectral peaks are substantially larger, and the simulation captures the experimental spectrum in extending strongly across the middle order harmonics (fifth to seven). In all three plasmas of figure 7, the strongest harmonic peaks in the experiment and in the simulations are the same: from left, second, second and fourth. The fundamental computational noise level in our simulations is addressed in appendix
, where vNBI is the injection speed resulting from the NBI #5b beam energies given in table 1. These NBI deuterons are initially distributed randomly and uniformly in gyroangle while the thermal deuterons are loaded by mean of a quiet start [46, 47], in both positions and velocities. The relaxation of this energetic ion population under the Maxwell–Lorentz system of equations gives rise to self-consistently excited electric and magnetic fields; see references [3, 28, 29] for details of this approach. Fourier transformation of the excited fields yields spectral information that is compared to the LHD observations. We focus on the lower cyclotron harmonics, for which the distribution of energy between the ICE spectral peaks shown in figure 3 displays significant changes between the three LHD plasmas. Figure 6 shows the simulated power spectra, alongside the measured spectra extracted from figure 3. The red, green and blue traces correspond to LHD plasmas 138 439, 138 458 and 138 433 respectively. In the middle and bottom panels of figure 6, these traces are obtained by taking the spatiotemporal fast Fourier transform of the values of δBz
output from the PIC-hybrid computations in the time interval between t = τD and t = 9τD (where τD = 2π/ΩD is the deuteron gyroperiod), which is summed over wavenumbers up to k = 40ΩD/VA. The agreement between observed and simulated ICE spectra appears good quantitatively. In both the top (experimental ICE) and middle (simulated spectra) panels in figure 6, the number of cyclotron harmonic spectral peaks increases as vNBI/VA increases, as does their amplitude. These trends can be examined in greater detail for the three plasmas separately in figure 7. Here our simulated power spectra are shown as dark traces, together with the measured ICE spectra which are plotted as coloured traces for comparison: red, LHD plasma 138 439; green, LHD plasma 138 458; blue, LHD plasma 138 433. The spectra are vertically offset in comparison with figure 6 such that the ordinate of the peak with largest amplitude is zero in each panel. In the left panel of figure 7, for which vNBI/VA = 0.36, the strongest spectral peaks in the simulation are at relatively low deuteron cyclotron harmonics, second to fourth. In the middle panel, for which vNBI/VA = 0.44, the middle order harmonics (fourth and fifth) become more pronounced. In the right panel of figure 7, for which vNBI/VA = 0.60, the amplitudes of the spectral peaks are substantially larger, and the simulation captures the experimental spectrum in extending strongly across the middle order harmonics (fifth to seven). In all three plasmas of figure 7, the strongest harmonic peaks in the experiment and in the simulations are the same: from left, second, second and fourth. The fundamental computational noise level in our simulations is addressed in appendix
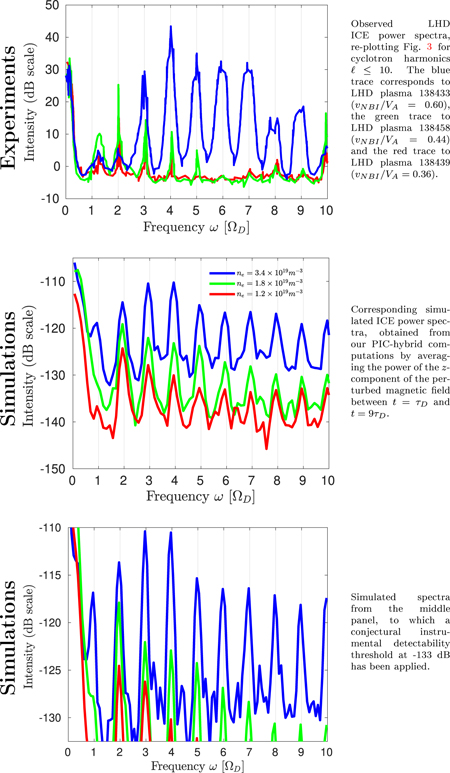
Figure 6. Experimental and simulated power spectra.
Download figure:
Standard image High-resolution image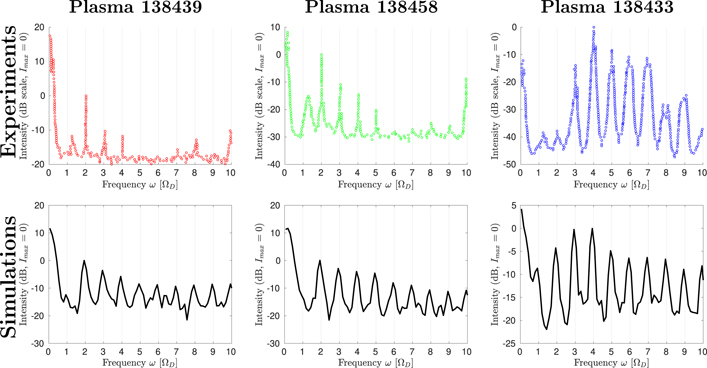
Figure 7. Red, green and blue circles: measured ICE power spectra from LHD plasmas 138 439, 138 458 at t = 4.92 s and 138 433 at t = 5.25 s. Dark traces: corresponding simulated power spectra of the z-component of the perturbed magnetic field, averaged between t = τD and t = 9τD. The power spectra are vertically offset in comparison to figure 6 such that the cyclotron harmonic with largest amplitude, respectively 2, 2 and 4 for LHD plasmas 138 439, 138 458 and 138 433, has zero ordinate.
Download figure:
Standard image High-resolution imageThe spatiotemporal fast Fourier transforms of δBz
are plotted in figure 8. These show that the concentration of excited wave amplitude in  space lies on horizontal bands at successive cyclotron harmonics, and that each of these bands is approximately centered on a line which satisfies ω/k = vNBI. This is represented by the dark line in each panel of figure 8, for which
  , 0.44 and 0.60 from top to bottom. The nearly horizontal structures are electromagnetic cyclotron harmonic waves supported by both the thermal deuterons (as a positive-energy wave) and the NBI deuterons (as a negative-energy wave). This is apparent from the linear analytical theory of the MCI: restricting attention to the strictly perpendicular case for mathematical clarity, let us consider for example the final three terms on the right-hand side of equation (67) of reference [24]. Importantly, the signs of the coefficients β4 and β5 in this equation, which are defined at equations (51) and (52), depend on the specific distribution of the energetic ions in velocity-space. This leads on to the negative-energy character of the energetic ion support to the corresponding cyclotron harmonic waves, as anticipated by Belikov and Kolesnichenko [23]. The electromagnetic generalisation of the foregoing, for finite k∥, is at equation (20) of reference [26]. The dark line overplotted on the spatiotemporal Fourier transforms in figure 8, which delineates ΩD/k = vNBI, can be recast as k⊥
vNBI/ΩD ≃ 1. At ω = ΩD, this represents the Bessel function argument which we mentioned earlier in the introduction; excitation is concentrated at values of the argument close to 1. The steepest yellow–red feature in figure 8 corresponds to the linear fast Alfvén dispersion relation ω = kVA and incorporates significant noise energy. Figure 9 plots the time evolution of the change in the different components of particle and field energy density. It shows that, in these simulations, the NBI beam deuterons relax and saturate faster, releasing more energy to the excited fields and the bulk plasma, as the value of vNBI/VA increases towards unity.
, 0.44 and 0.60 from top to bottom. The nearly horizontal structures are electromagnetic cyclotron harmonic waves supported by both the thermal deuterons (as a positive-energy wave) and the NBI deuterons (as a negative-energy wave). This is apparent from the linear analytical theory of the MCI: restricting attention to the strictly perpendicular case for mathematical clarity, let us consider for example the final three terms on the right-hand side of equation (67) of reference [24]. Importantly, the signs of the coefficients β4 and β5 in this equation, which are defined at equations (51) and (52), depend on the specific distribution of the energetic ions in velocity-space. This leads on to the negative-energy character of the energetic ion support to the corresponding cyclotron harmonic waves, as anticipated by Belikov and Kolesnichenko [23]. The electromagnetic generalisation of the foregoing, for finite k∥, is at equation (20) of reference [26]. The dark line overplotted on the spatiotemporal Fourier transforms in figure 8, which delineates ΩD/k = vNBI, can be recast as k⊥
vNBI/ΩD ≃ 1. At ω = ΩD, this represents the Bessel function argument which we mentioned earlier in the introduction; excitation is concentrated at values of the argument close to 1. The steepest yellow–red feature in figure 8 corresponds to the linear fast Alfvén dispersion relation ω = kVA and incorporates significant noise energy. Figure 9 plots the time evolution of the change in the different components of particle and field energy density. It shows that, in these simulations, the NBI beam deuterons relax and saturate faster, releasing more energy to the excited fields and the bulk plasma, as the value of vNBI/VA increases towards unity.

Figure 8. Spatiotemporal Fourier transform of the fluctuating part of the z-component of the magnetic field, calculated over the entire simulation and plotted on a log10 scale for the three cases. The concentration of excited wave amplitude in  space lies on horizontal bands at successive cyclotron harmonics, and each of these bands is approximately centered on a line which satisfies ω/k = vNBI. This is represented by the dark line in each panel, characterised by
  , 0.44 and 0.60 from top to bottom. The steepest yellow–red feature corresponds to the linear fast Alfvén dispersion relation ω = kVA and incorporates significant noise energy.
Download figure:
Standard image High-resolution image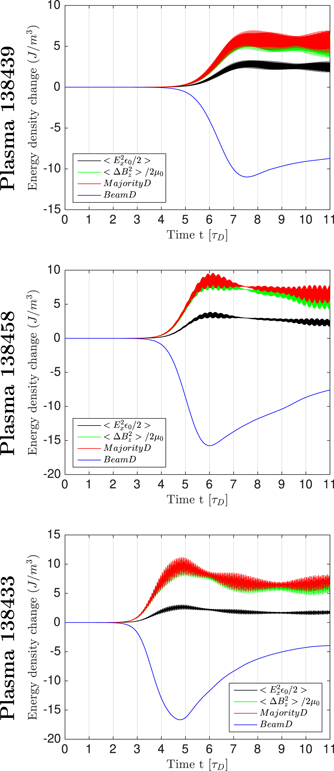
Figure 9. Time evolution of the change in the energy density of the different field and particle species: red, background deuterons; blue, NBI deuterons; green, z-component of the fluctuating part of the magnetic field; black, x-component of the electric field.
Download figure:
Standard image High-resolution image6. Conclusions
The computational approach adopted in this paper has involved solving the Maxwell–Lorentz equations for tens of millions of macroparticle ions with fully gyro-resolved orbits, together with fluid electrons, self-consistently with the electric and magnetic fields. This is carried out with the PIC code [36] used in references [29, 31], using a local (slab geometry) description, with one spatial and three velocity-space coordinates (1D3V), and retaining all three vector components of E and B. It transpires here that the self-consistent particle dynamics and field evolution, when summed over, correspond to the theory of the MCI [3, 8, 9, 20, 23–31], where appropriate. The Fourier transforms of the excited fields, in the saturated regime of the instability, constitute our simulated ICE spectra, presented in section 5. This approach has previously been successfully applied to interpret ICE observations from MCF plasmas, notably JET [20, 28–31], KSTAR [3, 8, 9] and NBI-heated hydrogen plasmas in LHD [18].
We note that our first-principles Maxwell–Lorentz 1D3V PIC approach necessarily omits a very large number (tens, perhaps hundreds) of physical effects that may contribute to the observed ICE spectra. These potentially include: toroidal magnetic field effects; background gradients, for example of magnetic field strength and density; dissipation effects, other than the cyclotron (and Landau) resonant effects that are captured by the PIC approach; wave propagation effects, other than  dispersion which is an emergent property at the Maxwell–Lorentz PIC level of description, together with slab geometry growth or damping which is also emergent; antenna characteristics; and signal processing effects.
Discrepancies between Maxwell–Lorentz PIC outputs and the observed ICE spectra are therefore to be expected, and will be due to physical effects, and combinations thereof, under the headings outlined in the preceding paragraph. The degree of agreement between our PIC outputs and the observed ICE spectra, reported here in section 5, suggests that it is possible that none of the additional physical effects play a major role in determining the overall ICE spectrum. The cost-benefit of trying to isolate which (perhaps several together) of these additional effects is primarily responsible for the relatively minor differences between PIC outputs and the observed ICE spectra may, or may not, be attractive for future studies. At present we are able to conclude that the plasma physics emission mechanism for this ICE is well understood, aided by the fact that ICE is evidently a highly spatially localised phenomenon. The results presented here further reinforce the scope for exploiting ICE for diagnostic purposes.
Specifically, we are able to explain the physical origin of, and difference between, the ICE spectra obtained from three deuterium plasmas in LHD that differ primarily in their edge density. The collective instability of deuterons at about 67 keV originating from NBI #5, and relaxing under the non linear MCI in the outer midplane edge region is shown to be responsible for the ICE. An important consequence of the different edge densities across the three plasmas is that the ratio of vNBI/VA for freshly ionised NBI deuterons near their injection point changes while vNBI is kept constant. The NBI deuterons are significantly sub-Alfvénic: vNBI/VA = 0.36, 0.44 and 0.60. Our PIC-hybrid computations of the collective relaxation of these NBI deuterons, evolving self-consistently with the thermal plasma and the excited electric and magnetic fields under the Maxwell–Lorentz equations, show similar trends with the LHD ICE observations. In particular, as the value of vNBI/VA increases, the number of cyclotron harmonic peaks in the simulated ICE spectra increases, along with their amplitude. These results are consistent with our recent comparison of ICE from super-Alfvénic and sub-Alfvénic NBI proton populations in LHD [18]. They also appear broadly consistent with the results of earlier ICE experiments carried out in TFTR, involving gas puffing [35, 41].
Acknowledgments
This work has been carried out within the framework of the EUROfusion Consortium and has received funding from the Euratom research and training programme 2014–2018 and 2019–2020 under Grant agreement No. 633053. The work received support from the RCUK Energy Programme [Grant No. EP/T012250/1], NIFS budget NIFS15KLPF045 and from NRF Korea Grant No. 2014M1A7A1A03029881. The views and opinions expressed herein do not necessarily reflect those of the European Commission. ROD acknowledges the hospitality of Kyushu University. BCGR acknowledges helpful discussion with Dr. Carbajal-Gomez.
: Appendix A
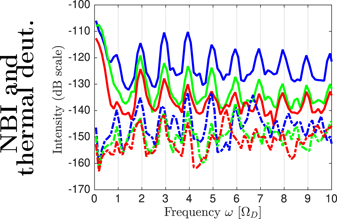
We have checked the noise level of our simulation results by running PIC-hybrid calculations without any energetic minority population, retaining only the deuterium thermal background plasma, and with all other parameters kept equal, for each of three plasmas. The noise in the simulation is not compared to the noise of the experimental detection system. We simply aim to establish the significance of the spectral peaks in the PIC-based simulations that include NBI ions, with respect to the spectral peaks that are generated by thermal noise in the code. Figure 10 displays: the power spectra for computations that include both the NBI and thermal deuterons, shown by continuous lines; and the spectra obtained from the simulations that retain only the thermal deuterium plasma, shown by the dashed curves. The spectral peaks in the latter case result from the concentration of noise energy at normal modes—in this case, cyclotron harmonic waves supported by the thermal plasma—in line with the fluctuation dissipation theorem [48]. The dashed lines in figure 10 indicate that the fundamental computational noise level is similar in all our simulations, at −145 dB, although slightly higher for the simulation of LHD plasma 138 433.
Figure 10. Quantifying the effect of noise on spectral characteristics in our PIC-hybrid simulations. Power spectra from simulations that contain both NBI and thermal deuterons are shown as solid traces. Dashed lines are the spectral peaks in the absence of NBI deuterons. The blue, green and red traces respectively correspond to LHD plasma parameters at the ICE location for plasmas 138 433 (vNBI/VA = 0.60), 138 458 (vNBI/VA = 0.44) and 138 439 (vNBI/VA = 0.36).
Download figure:
Standard image High-resolution image