


Abstract
The reproducibility of diamagnetic flux measurements in vacuum field shots for the internal and external diamagnetic flux measurements in the ASDEX Upgrade tokamak is investigated. A comparison of diamagnetic flux measurements and predictions from equilibrium reconstruction, including pressure constraints from thermal and fast-ion contributions, is reported. The ideal magnetohydrodynamic model involved in interpreting diamagnetic flux measurements in a tokamak with anisotropic pressure is summarised. The plasma energy calculated from equilibrium reconstruction and inferred from diamagnetic flux measurements is compared with the respective values calculated by modelling with TRANSP and IDE/RABBIT. It is found that at low densities, in discharges with parallel neutral beam sources, the plasma energy inferred from the diamagnetic flux measurements is smaller than the plasma energy calculated from the equilibrium reconstruction. In addition, details of the modelling are discussed to stress the interdependence of the various modelling inputs and the interpretation of the results. A comparison of diamagnetic flux measurements with calculations from equilibrium reconstruction by IDE and fast-ion profiles from RABBIT and TRANSP simulations can identify anisotropic plasma discharges and provide a consistency check of the input data for modelling.
Export citation and abstract BibTeX RIS

Original content from this work may be used under the terms of the Creative Commons Attribution 3.0 licence. Any further distribution of this work must maintain attribution to the author(s) and the title of the work, journal citation and DOI.
1. Introduction
The diamagnetic flux is the small difference in total toroidal flux with plasma and without plasma [1]. Currents parallel to and perpendicular to the magnetic field generate this difference [2, 3]. The poloidal component of force free plasma current generates a paramagnetic flux and the poloidal current needed to satisfy the force balance equation generates a diamagnetic flux. A number of tokamaks and stellarators have demonstrated the measurement of diamagnetic flux [4–16]. The time evolution of internal and external diamagnetic flux is routinely measured on ASDEX Upgrade [17, 18]. A comparison of diamagnetic flux measurements and calculation from equilibrium reconstruction and transport simulations can identify discharge conditions where plasma anisotropy, fast-ion losses or transport are strong enough to lead to a discrepancy between measurements and modelling.
Equilibrium reconstruction codes generally use the Grad–Shafranov equation with the assumption of isotropic pressure. For discharges with neutral beam injection (NBI), ion-cyclotron resonance frequency (ICRF) heating or lower hybrid current drive (LHCD) this assumption is sometimes not valid. A detailed analysis of anisotropic plasmas in JET and Tore Supra was performed with terms included in the Grad–Shafranov equation to consider perpendicular and parallel pressure components separately [19]. Anisotropic magnetic equilibria for neutral beam heated MAST plasmas have also been discussed [20–22]. The comparison of diamagnetic flux measurements and predictions from equilibrium reconstruction have been reported in Tore Supra for ICRF heated plasmas [11]. In the case of such an anisotropic plasma, the plasma energy deduced from the diamagnetic flux loop is greater than that calculated from the magnetic equilibrium due to the increase in perpendicular energy of the ions. Measurement of anisotropic pressure using magnetic measurements in LHD for low density plasmas with parallel NBI sources have also been reported in a stellarator [23]. For LHCD experiments in ASDEX, plasma anisotropy was observed and the ratio of plasma energy deduced from the diamagnetic flux and that calculated from the magnetic equilibrium depended on the electron density [24, 25].
Toroidal plasma rotation speeds of up to 300 km s−1 have been measured on the ASDEX Upgrade tokamak, corresponding to Mach numbers of up to 0.5 in the plasma centre. Neglecting or including toroidal rotation in equilibrium reconstruction does not result in significant differences for values of plasma volume, plasma cross sectional area, plasma energy, horizontal or vertical extension, or the ellipticity [26]. The influence of toroidal flow on tokamak equilibria in ASDEX Upgrade can therefore be neglected for these quantities. However, it will be shown that the inclusion of toroidal rotation in the equilibrium reconstruction is important for the prediction of diamagnetic flux.
In section 2, the geometry of NBI is documented and the equilibrium reconstruction and fast-ion calculations in ASDEX Upgrade are summarised. In section 3, the ideal magnetohydrodynamic model used to calculate the plasma energy from the magnetic equilibrium and from the diamagnetic flux in an isotropic plasma and its extension to an anisotropic plasma is reviewed. In section 4, the reproducibility of the zero level of the diamagnetic flux measurement achieved in vacuum shots with toroidal field coil, poloidal field coil and ohmic solenoid currents on a day to day basis is reported. In section 5, two complementary discharges with a reversal in the toroidal field direction are used to determine the error correction of plasma current contributions to the measured diamagnetic flux. In sections 6 and 7, diamagnetic flux measurements of a number of discharges with NBI and electron cyclotron resonance heating (ECRH) in ASDEX Upgrade are presented. In section 6, only the predominantly perpendicular NBI sources are used and in section 7, both the parallel and perpendicular NBI sources are used. In section 8, discussion of the physical parameters of the experiment are presented to highlight the details of the modelling relevant to the interpretation of the results. An asymmetry in toroidally separated diamagnetic flux measurements in the presence of a locked mode is presented in section 9. The toroidal symmetry of diamagnetic flux measurements is broken by toroidally asymmetric poloidal currents in the presence of a locked mode.
2. Measurements and modelling
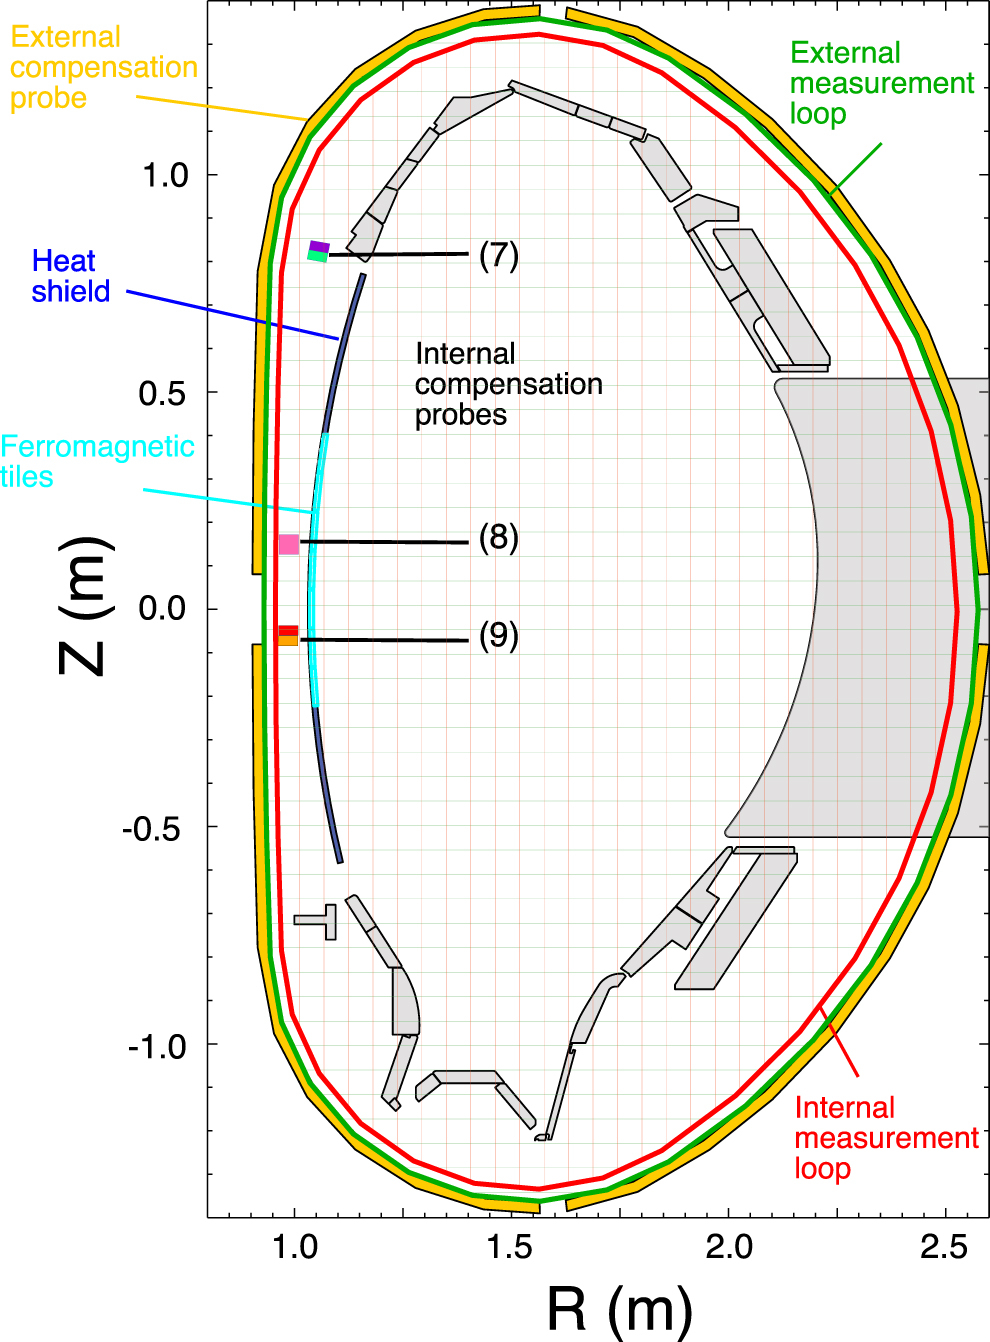
A schematic diagram of the internal and external diamagnetic flux measurements on ASDEX Upgrade is shown in figure 1. The internal measurement loop is a single winding in the poloidal direction around the inside of the vacuum vessel. It measures the toroidal magnetic flux generated by the toroidal field coils and the plasma. Magnetic probes oriented in the toroidal direction are used as internal compensation probes and measure the local toroidal flux generated by the toroidal field coils. These probes have a cross section of 45 mm × 68 mm and are located on the inner wall of the vacuum vessel. There are two sets of internal measurement loops and compensation probes separated by 180 degrees in the toroidal direction in sections 3 and 11 of the 16 sections of the toroidal vacuum chamber.

Figure 1. Schematic diagram of the internal and external diamagnetic flux measurements on ASDEX Upgrade. The external measurement loop (green) is two turns mounted on a frame surrounding the vacuum vessel in the poloidal direction. The external compensation probe (yellow) is also mounted on this frame. The internal measurement loop (red) is a single turn mounted on the inside vacuum vessel in the poloidal direction. Magnetic probes oriented in the toroidal direction are used as internal compensation probes (labelled 7, 8 and 9). The colouring of the internal compensation probes is used to plot the internal diamagnetic flux in later diagrams. Ferromagnetic tiles (light blue) are mounted on the heat shield (blue) at the inner wall of the vacuum vessel.
Download figure:
Standard image High-resolution imageThe external measurement loop is two turns mounted on a frame surrounding the vacuum vessel in the poloidal direction. The external compensation probe is also mounted on this frame. There are three sets of external diamagnetic flux measurement and compensation probes in sections 4, 12 and 14 of the toroidal vacuum chamber. Presently, only the external diamagnetic flux measurement from section 12 is available. Ferromagnetic tiles are mounted on the inner wall of the vacuum vessel in the vicinity of inner compensation probes [27]. The locations and orientations of magnetic probes and flux loops on ASDEX Upgrade used for equilibrium reconstruction are documented in an earlier publication [28].
Extensive reviews of diamagnetic flux measurements and the various correction terms needed have been published [9, 12, 14, 29] and can be expressed as

where the diamagnetic flux of the plasma, ϕp, is found by digitally calculating the difference between the measured diamagnetic loop flux, ϕDL, and the flux due to the toroidal field coils measured by the compensation probe, ϕTF. Small misalignments of the loops and probes with respect to the ohmic heating solenoid, the poloidal field coils and the plasma current lead to unwanted flux contributions, ϕOH, ϕPF and ϕIp respectively, which also must be corrected. To calculate these correction terms, coefficients proportional to each poloidal field coil, ohmic solenoid and plasma current are determined as described in section 4. Correction terms related to tilting and expansions of coils are not found to make significant contributions on ASDEX Upgrade. Eddy current contributions are expected to be important only for events with transient times smaller than the resistive wall time in the poloidal direction (about 10 ms on ASDEX Upgrade) [30]. Contributions to the diamagnetic flux measurement by wall currents in the vacuum vessel are expected to be negligible compared to the plasma current correction term in the steady state phase of the discharge. These correction terms have been omitted in equation (1). The internal diamagnetic flux using the section 3 measurement loop are designated as DIAf37, DIAf38 and DIAf39 according to the corresponding compensation probe. The internal diamagnetic flux using the section 11 measurement loop are designated as DIAf87 and DIAf89 according to the corresponding compensation probe. The external diamagnetic flux measurement is labelled DIAt in the following plots.
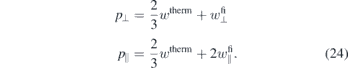
Knowledge of the fast-ion contribution to the pressure profile is an important input for magnetic equilibrium reconstruction with pressure constraints. Earlier modelling of diamagnetic flux measurements on ASDEX Upgrade [17, 18, 31] used IDE equilibrium reconstruction [32] and TRANSP [33, 34] for fast-ion pressure profiles. Real-time simulations of the NBI fast-ion distribution can also be calculated by the time-dependent solution of the Fokker–Planck equation (2D in velocity) based on analytic expressions by the RABBIT code [35]. The pressure profiles including the fast-ion component along with magnetic probe and flux loop measurements are the inputs for the magnetic equilibrium reconstruction code, IDE. This code also models the current distribution evolution by employing the current diffusion equation between successive equilibria and a time-dependent current relaxation model [36]. Presently, the IDE equilibrium reconstruction code assumes isotropy of pressure profiles. The fast-ion pressure, pfi, is calculated as 2/3 * ( +
+  ) where
  and
and  are the fast-ion perpendicular and parallel energy densities.
The effective ion charge, Zeff, is estimated from charge exchange recombination spectroscopy, CXRS, bremsstrahlung intensity measurements [37]. The uncertainties in the plasma density and temperature profiles and the calibration factors of the CXRS detectors lead to an estimate of 20% uncertainty in Zeff. For example, systematic errors in the bremsstrahlung and line radiation intensities measurements due to neutron damage of the optical components is a possible source of error in the estimates of Zeff. The thermal pressure profile used in equilibrium reconstruction requires an ion density profile. The ion density profile is not measured but calculated from this Zeff measurement.
In figure 2, the poloidal and top down view of ASDEX Upgrade are shown. The trajectories of the NBI sources are straight lines in the poloidal view and curved lines in the top down view as the beam traverses the flux surfaces when following the beam in the toroidal direction. In the top down view it can be seen that two NBI sources have a predominantly parallel component (S6 + S7) while the remaining sources have a predominantly perpendicular component.

Figure 2. Schematic diagram of NBI trajectories in the a) poloidal and b) top down view. The NBI sources 2 to 8 (S2–S8) are shown.
Download figure:
Standard image High-resolution imageThe fast-ion D-alpha diagnostic, FIDA, analyses the Doppler-shifted Balmer alpha radiation emitted by fast-ions after charge exchange reactions along a neutral beam path [38]. It was noted that during off-axis NBI heating with S6 and S7, it was important to take the passive contribution into account. As modelling of the passive FIDA component is difficult (the edge neutral density is not well known), the passive FIDA light must be measured in phases when the diagnostic beam NBI S3 is off. It can then, if necessary, be subtracted from the active signals. Radial profiles of the fast-ions are obtained from an array of lines of sight that cross the path of NBI at different positions. The FIDASIM code translates predicted fast-ion distribution functions from TRANSP into synthetic spectra and profiles that can be compared to FIDA measurements [39].
3. Ideal magnetohydrodynamic model relevant to diamagnetic flux measurements in an anisotropic plasma
In the following, an outline of the derivation of the relationship between the diamagnetic flux and the plasma energy in an isotropic plasma is summarised. These results are then extended to anisotropic plasmas to demonstrate the impact of pressure anisotropy and plasma rotation on the determination of the poloidal beta and diamagnetic flux [40, 41]. Starting with the vector identity

then the force balance equation along the major radius and along the minor radius in an isotropic plasma can be written as

where p is the plasma pressure of an isotropic plasma, j is the plasma current density and B the magnetic field. In tensor form, this reduces to [42]

To derive the virial theorem the following identity is used [40, 43, 44]

where r is the radius vector, I is the identity tensor and : is the double dot operator of continuum mechanics defined by A : B = Σi Σj Aij Bij . The virial theorem in integral form can be written by performing the volume integral and applying Gauss's theorem from vector calculus to express it as an integral over the surface, S
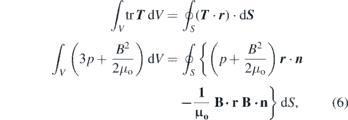
where n is the normal to the surface.
3.1. Isotropic plasma
Starting from Shafranov's virial theorem, two equations for volume integrals relating the plasma energy and internal inductance to surface integrals of the magnitude and direction of the magnetic field at the measuring surface and the diamagnetic flux can be derived [42, 45]. The ratio of the plasma pressure to the pressure of the magnetic field associated with the plasma current or poloidal beta, βp, is defined in an isotropic plasma by

and the internal inductance per unit length of the plasma column, li, is defined by
where bpol is the poloidal magnetic field, LC
is the plasma circumference,  = (μo
Ip)/LC
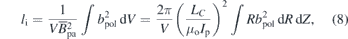
is the mean poloidal field around the contour and V is the plasma volume. These values can be expressed in terms of the Shafranov integrals, S1 and S2, which are contour integrals on the last closed flux surface of a tokamak magnetic equilibrium [40, 41, 45, 46]
= (μo
Ip)/LC
is the mean poloidal field around the contour and V is the plasma volume. These values can be expressed in terms of the Shafranov integrals, S1 and S2, which are contour integrals on the last closed flux surface of a tokamak magnetic equilibrium [40, 41, 45, 46]
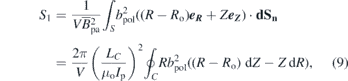

where S is the plasma surface, dS n = 2πR (dZ e R −dR e Z ) is the outward pointing vector normal to the surface and Ro = 1.65 m is the major radius of the ASDEX Upgrade vacuum vessel.
3.2. Anisotropic plasma
The above theory has been extended to an anisotropic plasma [40, 41]. The parameters of an anisotropic plasma are related to the Shafranov integrals by (equations (2) and (3) from [41])


where βp⊥ , βp∥ and βpϕ are the components of poloidal beta associated with the perpendicular pressure, parallel pressure and toroidal flow respectively and Rc is the radius of the plasma current centroid defined by [41]

The diamagnetic parameter, μi, is proportional to the experimentally determined diamagnetic flux, ϕp

where V/(2πRo) is the area of the plasma cross section and Bϕo is the toroidal magnetic field in the absence of plasma. This expression is derived for a toroidal plasma with a 1/R dependence of the toroidal magnetic field. The diamagnetic flux, ϕp, is defined by

where Bϕ is the toroidal magnetic field with plasma as the vacuum field, Bϕo, is modified by the poloidal currents needed for pressure balance and the paramagnetic flux due to force free currents. This definition of ϕp is of opposite sign to the definition found in [41, 45] to be consistent with equation (1) where a paramagnetic diamagnetic flux is positive. An expression for the perpendicular poloidal beta, βp⊥ , in anisotropic plasmas in terms of the Shafranov integrals can be found by subtraction of equation (12) from equation (11) and neglecting the rotation terms [41]

To arrive at a simplified expression for βp⊥ in terms of ϕp, the small second term on the right-hand side of equation (16) is neglected as Rc/Ro ≈ 1 and S1/2 ≈ 1 is used. For an ellipse with minor radius, a, and major radius, b, the area of the ellipse is πab and the circumference is approximately π(a + b) so that
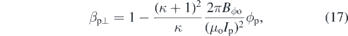
where κ = b/a is the plasma elongation. This can be further simplified using the approximation (1 + κ)2 ≈ 2(1 + κ2) [9, 14, 41]. This approximation yields a value with a difference of 4% for a value of κ = 1.5 and

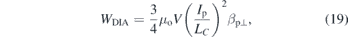
The plasma energy inferred from the diamagnetic flux measurement, WDIA, can be expressed in terms of βp⊥
and the values for LC , V and κ needed in equations (17) and (19) are obtained from the equilibrium reconstruction. In anisotropic plasmas, addition of equations (11) and (12) leads to [41]
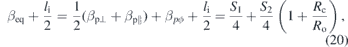
where βeq is the poloidal beta determined from the magnetic equilibrium. This leads to the following expression for the equilibrium pressure, peq, used in TRANSP

with p⊥, p∥ and pϕ defined as the perpendicular, parallel and rotation pressures respectively. The diamagnetic flux therefore provides a continuous measure of the perpendicular poloidal beta without requiring density and temperature profiles of the ions or electrons. It can be seen that βp⊥ , as determined from diamagnetic flux measurements using equation (17), is related to the perpendicular pressure, whereas the poloidal beta determined from magnetic equilibrium from equation (21) in TRANSP is related to the perpendicular, parallel and flow components of pressure [40, 41]. Thus magnetic equilibrium measurements together with diamagnetic measurements may be used to determine the plasma anisotropy. The plasma beta determined for plasmas in ISX-B showed differences up to 10% when neglecting toroidal rotation energy [40]. The values of βeq and βp⊥ were compared in doublet III using the EFIT magnetic equilibrium reconstruction code [47]. In this study, the two values agreed over a large number of discharges. A comparison of the plasma energy content estimated from diamagnetic and equilibrium measurements of plasma energy was carried out on ASDEX [48]. Because of the tangential NBI sources, WTOT depended more strongly on the fast particle content and the values were about 10% to 15% larger than WDIA. On LHD, a scan in electron density has shown that there is a strong correlation between the pressure anisotropy due to the beam pressure based on Monte Carlo calculations and the ratio of the diamagnetic loop signal and the saddle loop signal [23].
Now the set of definitions needed to derive the relationship of WDIA and the plasma energy, WE, found in earlier publications [49] is summarised
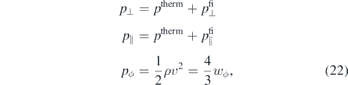
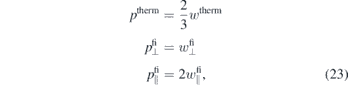
where ptherm is the isotropic thermal pressure,  is the fast-ion perpendicular pressure,
  is the fast-ion parallel pressure, ρ is the mass density, v is the toroidal rotation velocity and wϕ
is the energy density of toroidal rotation. In a thermodynamic system, the average thermal energy density carried by each microscopic degree of freedom in the system is
is the fast-ion parallel pressure, ρ is the mass density, v is the toroidal rotation velocity and wϕ
is the energy density of toroidal rotation. In a thermodynamic system, the average thermal energy density carried by each microscopic degree of freedom in the system is  , where n is the particle density, T is the temperature and kB is the Boltzmann constant. Therefore
where wtherm is the thermal energy density,  is the fast-ion perpendicular energy density and
  is the fast-ion parallel energy density and the pressure components after substitution are then
A formula for the energy content of the plasma, WE, in terms of  and Wϕ
, the energies associated with the thermal pressure, fast-ion perpendicular pressure, fast-ion parallel pressure and toroidal rotation respectively is found after substitution of equation (24) into equation (21) and performing the volume integral [49]
and Wϕ
, the energies associated with the thermal pressure, fast-ion perpendicular pressure, fast-ion parallel pressure and toroidal rotation respectively is found after substitution of equation (24) into equation (21) and performing the volume integral [49]
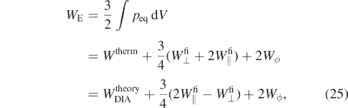
as  when using the definition of p⊥ in equation (24). For an anisotropic plasma with negligible Wϕ
, it can be seen that for
when using the definition of p⊥ in equation (24). For an anisotropic plasma with negligible Wϕ
, it can be seen that for  then WE < WDIA and for
  then WE > WDIA. Also for an isotropic plasma with
  then WE = WDIA. The plasma energy calculated from equilibrium reconstruction, WMHD, is given by:

where pexp is the fitted pressure profile from the equilibrium reconstruction using the thermal profile measurements and fast-ion profile calculations as constraints. In TRANSP, the total plasma energy, WTOT, is also defined

where  and Wϕ
, are the energy content associated with the thermal pressure, fast-ion perpendicular pressure, fast-ion parallel pressure and rotation respectively. Equilibrium reconstruction with magnetic measurements alone is known to be difficult in circular plasmas because separation of βp and li
is not possible [50]. Theoretical studies of equilibrium reconstruction show that it is difficult to obtain accurate safety factor profile and current density measurements with magnetic probe measurements alone [51, 52]. Studies on DIII-D and JET have shown that from magnetic measurements alone, only two or three physical parameters can be determined [53, 54]. These are Ip and βp + li/2 for low-β near-circular plasmas and Ip, βp and li for non-circular plasmas or at high β. The minimum elongation for which the parameters βp and li can be separated at low βp is reported to lie around κ = 1.25 (see figure 2 of [41]). For discharges on ASDEX Upgrade with typical values of κ = 1.5, separation of βp and li for equilibrium reconstruction with magnetics alone is therefore expected. Discrepancies of the energy content determined by an equilibrium code fitting only the magnetic probes measurements and one constrained by the pressure profile and magnetic probe measurements have been documented in low beta discharges in ASDEX Upgrade (see figure 10 of [55]). In this discharge with 2.5 MW NBI heating, the diamagnetic flux measurement was well reproduced but the energy content inferred from the diamagnetic flux is greater than that calculated by the equilibrium reconstruction with pressure and magnetic probe constraints (WDIA = 360 kJ > WMHD = 320 kJ in #34664 with βp = 0.5 and κ = 1.68 at 4.0 s). In the equilibrium reconstruction using only magnetic probe measurements li was larger than in the equilibrium reconstruction with pressure and magnetic probe constraints. It has been shown that in an isotropic plasma using the diamagnetic flux as an additional constraint increases the number of independent parameters from three to four that can be identified in the current density profile, providing a more precise evaluation of the relative weight of the pressure and paramagnetic terms of the current distribution [56]. The ability to match diamagnetic flux measurements and modelling predictions in low beta plasmas at the beginning of plasma discharges is therefore a subject which requires special attention and is not the main focus of this paper.
and Wϕ
, are the energy content associated with the thermal pressure, fast-ion perpendicular pressure, fast-ion parallel pressure and rotation respectively. Equilibrium reconstruction with magnetic measurements alone is known to be difficult in circular plasmas because separation of βp and li
is not possible [50]. Theoretical studies of equilibrium reconstruction show that it is difficult to obtain accurate safety factor profile and current density measurements with magnetic probe measurements alone [51, 52]. Studies on DIII-D and JET have shown that from magnetic measurements alone, only two or three physical parameters can be determined [53, 54]. These are Ip and βp + li/2 for low-β near-circular plasmas and Ip, βp and li for non-circular plasmas or at high β. The minimum elongation for which the parameters βp and li can be separated at low βp is reported to lie around κ = 1.25 (see figure 2 of [41]). For discharges on ASDEX Upgrade with typical values of κ = 1.5, separation of βp and li for equilibrium reconstruction with magnetics alone is therefore expected. Discrepancies of the energy content determined by an equilibrium code fitting only the magnetic probes measurements and one constrained by the pressure profile and magnetic probe measurements have been documented in low beta discharges in ASDEX Upgrade (see figure 10 of [55]). In this discharge with 2.5 MW NBI heating, the diamagnetic flux measurement was well reproduced but the energy content inferred from the diamagnetic flux is greater than that calculated by the equilibrium reconstruction with pressure and magnetic probe constraints (WDIA = 360 kJ > WMHD = 320 kJ in #34664 with βp = 0.5 and κ = 1.68 at 4.0 s). In the equilibrium reconstruction using only magnetic probe measurements li was larger than in the equilibrium reconstruction with pressure and magnetic probe constraints. It has been shown that in an isotropic plasma using the diamagnetic flux as an additional constraint increases the number of independent parameters from three to four that can be identified in the current density profile, providing a more precise evaluation of the relative weight of the pressure and paramagnetic terms of the current distribution [56]. The ability to match diamagnetic flux measurements and modelling predictions in low beta plasmas at the beginning of plasma discharges is therefore a subject which requires special attention and is not the main focus of this paper.
4. Vacuum field shots
Figure 3 shows the flux difference of the measurement loop and compensation probe raw signals in a vacuum toroidal field shot at 1 T. It is observed that the internal compensation measurement by the magnetic probe located between the vacuum vessel and the ferromagnetic tiles on the inner wall has to be delayed by 7 ms to achieve the improvement to the flux difference on the right hand side of the diagram. Exceptions are the DIAf37 and DIAf87 signals, which do not require a delay. The compensation probe of these signals is a magnetic probe oriented in the toroidal direction located away from the ferromagnetic tiles mounted on the inner wall of the vacuum vessel. The compensation probes of the other signals are magnetic probes located between the vacuum vessel and the ferromagnetic tiles. Repetition of vacuum toroidal field shots at 2.2 T on the same day showed good reproducibility with zero levels to within 0.1 mWb.

Figure 3. Shown on the left is the difference between the measurement loop and compensation probe raw signals in a vacuum toroidal field shot. The improvement to the difference on the right is achieved by setting a delay of 7 ms to the compensation probe signal. The exceptions are the DIAf37 and DIAf87 signals that require no delay. The compensation probe for these signals is located away from the ferromagnetic tiles of the inner wall of the vacuum vessel while the others are located between the vacuum vessel and the ferromagnetic tiles.
Download figure:
Standard image High-resolution imageShown in figure 4 is the flux difference of the measurement loop and compensation probe signals in two vacuum shots with successively pulsed poloidal field coil and ohmic heating solenoid currents with a constant toroidal field of 1 T. Based on nulling this flux difference during a vacuum field shot, compensation coefficients proportional to each poloidal field coil or ohmic heating solenoid current have been determined and applied to provide a correction term to cancel the unwanted contribution to the flux difference due to misalignment. There exists a degree of shot to shot variation in these flux differences. The variation in the external diamagnetic flux could be explained by small day to day changes in the integration time of the electronic integrators of the measurement loop and compensation probe signal. The variation in the internal diamagnetic flux is more difficult to explain as the integration time of the electronic integrators of the measurement loop and compensation probe signal is measured every day prior to the beginning of experiments. One possible explanation is that small temperature variations after the integration time measurement lead to small variations in the electronic component values setting the integration time during the day. Nevertheless the variation in the internal and external diamagnetic fluxes are small compared to a typical value of 18 mWb of diamagnetic flux measured in a 1 MA ohmic discharge.

Figure 4. Shown are (a) the sequential excitation of the poloidal field coil and ohmic heating solenoid currents in a vacuum shot with a constant toroidal field of 1 T and in (b) and (c) the attained zero level of diamagnetic flux measurements on different days after application of correction terms proportional to the currents.
Download figure:
Standard image High-resolution image5. Comparison of discharges with reversal of toroidal field
Figure 5 shows two complementary discharges with a reversal in the toroidal field and a reversal in diamagnetic flux. An error correction term of the diamagnetic flux proportional to plasma current is necessary because of the imperfect alignment of the diamagnetic measurement loop and plasma current. Since the plasma current in both discharges flows in the same direction, this error correction term is also the same for both directions of toroidal field. The coefficient for the error correction term proportional to plasma current for each measurement was chosen so that the best agreement of diamagnetic flux measurement and IDE calculation in both directions of toroidal field was achieved. Ideally, the discharges have identical plasma parameters and the coefficient of the error correction term proportional to plasma current can be identified solely by matching the diamagnetic flux measurements. These discharges must be in the upper single-null configuration, as reversal of the toroidal field direction in a lower single-null configuration is undesirable due to leading edge problems with the divertor tiles

Figure 5. Diamagnetic flux measurements and calculation from an IDE equilibrium reconstruction, diaflux, of two upper single-null discharges with 0.8 MA plasma current and 0.4 MW ECRH heating for a toroidal field of (a) −2.5 T and (b) 2.5 T are compared. The coefficient for the error correction term proportional to plasma current for each measurement was chosen so that the best agreement of diamagnetic flux measurement and IDE calculation in both directions of toroidal field was achieved.
Download figure:
Standard image High-resolution imageThe diamagnetic flux measurements and the calculation from the IDE equilibrium reconstruction in a lower single-null discharge are compared in the lowest frame of figure 6. The toroidal field and plasma current are reversed in this discharge pair. The coefficient for the error correction term proportional to plasma current needed modification in comparison to the upper single-null discharges in figure 5. It was changed to bring the diamagnetic flux measurements and the IDE calculations in the flat top phase of discharge 37005 into agreement. The maximum change in value of the compensation coefficient was equivalent to a diamagnetic flux of 1.4 mWb for a plasma current of 1 MA. The upper single-null discharge has a magnetic axis that is shifted upward by 5 cm in the vertical direction and shifted inward by 2 cm in the horizontal direction compared to the lower single-null discharge. It is has been suggested that outward movement of the plasma to a region of smaller toroidal magnetic field or a change of plasma volume could produce changes in the diamagnetic flux and this could lead to the need to adjust the compensation coefficients for the error correction term proportional to plasma current [57].

Figure 6. In the upper frame, the time evolution of the plasma current, Ipa, and of the electron density line integral in the core and edge of the plasma is shown. The second frame shows the NBI power, PNBI, and ECRH power, PECRH, and radiated power, Prad. The third frame shows the plasma energy calculated by the IDE equilibrium reconstruction, WMHD, and the energy inferred from the external diamagnetic flux, WDIA. The measured external diamagnetic flux, DIAt, internal diamagnetic flux, DIAf37, DIAf38 and DIAf39, and the calculation from IDE equilibrium reconstruction, diaflux, in lower single-null discharges are compared in the lowest frame. In (b) both the magnetic field and plasma current were reversed but in the plot the polarity of the plasma current and diamagnetic flux have been inverted to have the same sign as (a).
Download figure:
Standard image High-resolution image6. Plasma discharges with perpendicular neutral beam sources
Figure 7 shows an overview of two discharges with NBI and ECRH power. The plasma energy inferred from the diamagnetic flux, WDIA, and from the equilibrium reconstruction, WMHD, were in good agreement. A drift in the DIAf87 and DIAf89 signal (not shown) occurs when ELM's saturate the compensation probe integrator inputs. There is a toroidal asymmetry in the compensation probe signal leading to larger voltage spikes in the integrator input at this toroidal location [18]. The total plasma energy from TRANSP, WTOT, and the sum of thermal energy and fast-ion perpendicular energy from TRANSP,  , are also plotted and closely match WMHD and WDIA respectively. The measured diamagnetic flux is in good agreement with the prediction from IDE/RABBIT, diaflux, and from TRANSP, DFLUX.

Figure 7. In each discharge, the upper frame of the plot shows the time evolution of the plasma current, Ipa, and of the electron density line integral in the core and edge of the plasma. The second frame shows the NBI power, PNBI, ECRH power, PECRH, and radiated power, Prad. The third frame shows the plasma energy calculated by the IDE equilibrium reconstruction, WMHD, and the energy inferred from the external diamagnetic flux, WDIA. The total plasma energy from TRANSP, WTOT and the sum of thermal energy and fast-ion parallel energy from TRANSP,  , are also plotted. The lower frame shows the comparison of the measured external diamagnetic flux, DIAt, internal diamagnetic flux, DIAf37, DIAf38 and DIAf39, and that calculated from the IDE equilibrium reconstruction, diaflux, and from TRANSP, DFLUX.
Download figure:
Standard image High-resolution imageFigure 8 shows an overview of an 0.6 MA plasma NBI and ECRH-heated discharge. The toroidal field, plasma current and diamagnetic flux are reversed in direction compared to the previous discharges. The magnetic configuration is unfavourable for the L–H transition, with the ion grad B drift pointing away from the active X-point. The plasma undergoes various L–I–H transitions, as seen in the density time trace in (a). After a short ELMy type-I H-mode phase from 2.75–3.25 s, only one small ELM appears in the remainder of the H-mode phase at 5.65 s. Several transitions to the H-mode are initiated by the NBI blips. The repeated cycles of increasing and decreasing WMHD and WDIA derived from the external diamagnetic flux were in good agreement at the minimum and maximum values. The apparent time delay of WDIA with respect to WMHD in the oscillating phase can be reconciled by noting that this difference also exists between WDIA and WDIAf derived from the internal diamagnetic flux. This time delay is introduced in the external diamagnetic flux measurement by magnetic field diffusion of the toroidal field through the vacuum vessel. The repeated cycles of increasing and decreasing predicted and measured internal diamagnetic flux are also in phase but can differ by up to 1mWb. Since all poloidal field coil currents also oscillate in this phase, a more precise determination of the compensation coefficients for the correction terms proportional to the poloidal field coil currents and vacuum vessel currents may be needed to improve agreement. In this discharge, no drifts are visible in the diamagnetic flux measurements, since only very small ELMs appear in the H-mode phases.

Figure 8. In the upper frame, the time evolution of the plasma current, Ipa, and of the electron density line integral in the core and edge of the plasma is shown. The second frame shows the NBI power, PNBI, and ECRH power, PECRH, and radiated power, Prad. The third frame shows the plasma energy calculated by the IDE equilibrium reconstruction, WMHD, and the energy inferred from the external diamagnetic flux, WDIA, and from the internal diamagnetic flux DIAf39, WDIAf. The lower frame shows the comparison of the measured external diamagnetic flux, DIAt, internal diamagnetic flux, DIAf37, DIAf38, DIAf39, DIA87 and DIAf89, and that calculated from the IDE equilibrium reconstruction, diaflux. It should be noted that the polarity of the plasma current and diamagnetic flux have been inverted in this figure.
Download figure:
Standard image High-resolution image7. Plasma with parallel and perpendicular neutral beam sources
Figure 9 shows an overview of a discharge when switching between parallel and perpendicular NBI sources (a) without and (b) with magnetic perturbation coil current. In these discharges, the central electron temperature is feedback controlled to stay constant when switching between the neutral beam sources. This ensures that the slowing down time of the fast-ions are comparable. ASDEX Upgrade is equipped with two rows of magnetic perturbation coils, each with eight toroidally distributed in-vessel saddle coils [58]. These coils generate 3D magnetic perturbations in the axisymmetric tokamak and are mainly used for ELM suppression experiments. In ASDEX Upgrade and DIII-D, increased fast-ion losses were observed when the magnetic perturbation coil was activated [59–61].

Figure 9. Overview of discharges when switching between parallel and perpendicular NBI sources (a) without and (b) with additional magnetic perturbation coil current. The first frame shows the time evolution of the plasma current, Ipa, and the time evolution of the electron density line integral in the core and edge of the plasma. The second frame shows the time evolution of the NBI power, PNBI, with parallel and perpendicular NBI sources, electron cyclotron power, PECRH and radiated power, Prad. The third frame shows the plasma energy calculated by the IDE equilibrium reconstruction, WMHD, and inferred from the external diamagnetic flux, WDIA. The fourth frame shows the comparison of the measured external, DIAt, and internal, DIAf37, DIAf38 and DIAf39, diamagnetic flux and that calculated from the IDE equilibrium reconstruction, diaflux. In the fifth frame the differences of the measured diamagnetic fluxes and the IDE calculated diamagnetic flux are plotted.
Download figure:
Standard image High-resolution imageFigure 9(a) shows a discharge without magnetic perturbation coil current. For the period with parallel NBI sources (S6 + S7), the measured external and internal diamagnetic flux is systematically 1 mWb more positive than the diamagnetic flux calculated by the equilibrium reconstruction. This difference implies that the beta poloidal leading to a more negative diamagnetic flux used in the equilibrium reconstruction was too large and suggests that fast-ion losses or NBI power input losses could be the cause of the overestimation of the equilibrium pressure. For the period with perpendicular NBI sources (S3 S8), the measured and calculated diamagnetic flux were in good agreement. The plasma energy calculated by the IDE equilibrium reconstruction, WMHD, is systematically greater than the energy inferred from the external diamagnetic flux, WDIA, in the phase with parallel NBI sources (S6 + S7) and were in good agreement in the phase with perpendicular NBI sources. An anisotropic plasma with WMHD > WDIA in the phase with parallel NBI sources is expected as discussed in relation to equation (25) and the relative size of the components of W∥ and W⊥. The ratio of the parallel component of the fast-ion energy density and the total fast ion energy density is the fast-ion fraction,  and is found to be 0.43 in the first phase and 0.25 in the second phase of this discharge.
With the addition of an n = 2 magnetic perturbation coil current in figure 9(b), the drop in electron density leads to a decrease in plasma energy and a more positive measured diamagnetic flux. A small increase in the difference of the measured external diamagnetic flux and the flux calculated by IDE is observed. The difference in the measured internal diamagnetic flux and the flux calculated by IDE is not so pronounced. A fast-ion loss provoked by activation of the magnetic perturbation coil current would be expected to increase the difference in measured and predicted diamagnetic flux. It is not possible in this discharge to clearly demonstrate fast-ion loss caused by activation of the magnetic perturbation coil current. The difference between WDIA and WMHD is also increased in both phases. The perturbation of the external diamagnetic flux measurement due to the magnetic perturbation coil current of 1 kA is measured to be less than 0.1 mWb. The perturbation of the internal diamagnetic flux measurement due to the magnetic perturbation coil current of 1 kA is measured to be 0.15 mWb.
Figure 10 shows an overview of two discharges that start with perpendicular NBI sources and are later supplemented by parallel NBI sources (S6 + S7). The measured diamagnetic flux differs from the prediction from IDE/RABBIT, diaflux, and from TRANSP, DFLUX by up to 2 mWb when the parallel NBI sources are introduced. In the phase with parallel NBI sources, the plasma energy inferred from the diamagnetic flux, WDIA, is less than the energy calculated from the equilibrium reconstruction, WMHD. An anisotropic plasma with WMHD > WDIA in the phase with parallel beams is expected as discussed in relation to equation (25) and the relative size of W∥ and W⊥. In both discharges of figure 10, the fast-ion perpendicular energy was 160 kJ and the fast-ion parallel energy was 90 kJ in the flat top phase at 5 s. Before and after the introduction of the parallel NBI sources, WDIA and WMHD were in good agreement. The values of WTOT and WMHD are also in good agreement throughout the discharge. These discharges should also be compared to those in figure 7 where the parallel NBI sources (S6 + S7) are absent and where WDIA and WMHD were in closer agreement. The plasma energy inferred from the diamagnetic flux is in good agreement with the sum of thermal and fast-ion perpendicular energies from TRANSP.

Figure 10. In each discharge, the upper frame of the plot shows the time evolution of the plasma current, Ipa, and the time evolution of the electron density line integral in the core and edge of the plasma. The second frame shows the NBI power, PNBI, ICRF power, PICRH, ECRH power, PECRH, and radiated power, Prad. The third frame shows the plasma energy inferred from the IDE equilibrium reconstruction, WMHD, and from the external diamagnetic flux, WDIA. The total plasma energy from TRANSP, WTOT and the energy from TRANSP,  , calculated by summing the thermal energy and fast-ion perpendicular energy are also plotted. The lower frame shows the comparison of the measured external diamagnetic flux, DIAt, internal diamagnetic flux, DIAf37, DIAf38 and DIAf39, and that calculated from the IDE equilibrium reconstruction, diaflux and from TRANSP, DFLUX.
Download figure:
Standard image High-resolution imageGood agreement of the plasma energy inferred from diamagnetic flux measurements, WDIA, and the values of  from TRANSP, for 14 discharges with different combinations of NBI and ECRH power levels is shown in figure 11(a). The good agreement of plasma energy calculated from the equilibrium reconstruction, WMHD, and the plasma energy calculated by TRANSP, WTOT, is shown in figure 11(b).

Figure 11. (a) The plasma energy inferred from the diamagnetic flux, WDIA, and the value,  , calculated from TRANSP for different combinations of NBI and ECRH power levels in 14 plasma discharges are in good agreement. (b) The total plasma energy calculated by TRANSP, WTOT, and the plasma energy calculated by equilibrium reconstruction, WMHD, are in good agreement.
Download figure:
Standard image High-resolution imageThe experimental result  , shown in figure 11, contradicts the theoretically expected value of
  . According to theory, the measurement should have an additional 0.5
  which would be about 80 kJ for the discharges in figure 10, which represents a detectable departure from the fitted point with WDIA = 650 kJ. It was found that an increase in Zeff by 20% to dilute the ion density and reduce Wtherm must be assumed, for the theoretical prediction of diamagnetic energy to be confirmed by experiment. Such an increase in Zeff could be consistent with the measured Zeff, as the assumed value lies on the boundary of the uncertainty. However, a clear resolution of this discrepancy requires a more thorough analysis and is beyond the scope of this paper.
8. Discussion
In this section, a discussion of the physical parameters of the experiment are presented to highlight the importance of the input variables and their uncertainties to the interpretation of results of the modelling.
8.1. Modelling comparison
The differences in modelling results of the diamagnetic flux between TRANSP and IDE/RABBIT are considered in thissubsection. In figure 12, the radial profile of the toroidal rotation velocity time slices in two discharges is shown. In (a) the earlier time slice is when the parallel NBI sources (S6 + S7) were active and the later time slice when the perpendicular NBI sources (S3 + S8) were active. In (b) the radial profile of the toroidal rotation velocity for three time slices is shown. The earlier time slice is when the perpendicular NBI sources (S3 + S8) were active and the later time slices when the parallel NBI sources (S6 + S7) were added. In discharges with parallel sources, the rotation velocity profiles were distinctly greater in the bulk of the plasma than those with perpendicular sources only.

Figure 12. Radial profile of the toroidal rotation velocity for (a) two time slices in #37911 and (b) for three time slices in #37712. In (a) the earlier time slice is when the parallel NBI sources (S6 + S7) were active and the later time slice when the perpendicular NBI sources (S3 + S8) were active. In (b) the earlier time slice is when the perpendicular NBI sources (S3 + S8) were active and the later time slices when the parallel beam sources (S6+S7) were added.
Download figure:
Standard image High-resolution imageThe sensitivity of the modelling to the inclusion of rotation velocities in the IDE equilibrium code was investigated. In figure 13, the diamagnetic flux measurement and prediction from IDE/RABBIT and TRANSP in a discharge with perpendicular NBI sources only (#37642) and with perpendicular and parallel NBI sources (#37712) is shown. In the discharge with perpendicular NBI sources only, it can be seen that the measured internal diamagnetic fluxes and that calculated by IDE, diaflux, or by TRANSP, DFLUX, were in very good agreement as the differences are very close to zero. In the discharge with perpendicular and parallel NBI sources, it can be seen that the differences between the measured internal diamagnetic fluxes and that calculated by IDE were decreased when IDE/RABBIT equilibrium reconstruction included plasma rotation [26]. However, a small difference between the measured and IDE/RABBIT predicted diamagnetic flux remains. A possible explanation for the difference in the measured and TRANSP predicted diamagnetic flux is that TRANSP has used an overestimate of the pressure because of fast-ion losses or parallel NBI power input losses. The IDE/RABBIT equilibrium reconstruction with magnetic probe and pressure constraints may be less sensitive to the marginally increased pressure profile because magnetic probe measurements need to be simultaneously fitted. An arbitrary increase in Zeff by 40% to decrease the ion density in the TRANSP simulation was necessary to bring the measured and TRANSP calculated diamagnetic flux into agreement. This arbitrary increase in Zeff definitely lies outside the range of its uncertainty of 20%. The extent to which an equilibrium reconstruction with anisotropic pressure can explain the observed small difference between the measured and IDE/RABBIT predicted diamagnetic flux remains to be explored.

Figure 13. The measured internal, DIAf37, DIAf38 and DIAf39, and external diamagnetic flux, DIAt, and the diamagnetic flux predicted by IDE/RABBIT, diaflux, and TRANSP, DFLUX, in (a) a discharge with perpendicular NBI sources only (#37642) and with perpendicular and parallel NBI sources (#37712). The IDE equilibrium reconstruction in (b) is calculated without plasma rotation and in (c) calculated with plasma rotation. On the right-hand side, the differences between the measured internal diamagnetic flux and that calculated by IDE or TRANSP are plotted. For the discharge with perpendicular NBI sources the measurements and predictions of diamagnetic flux were in good agreement. A slightly better agreement of the IDE predicted and measured and diamagnetic flux is suggested by the smaller difference when plasma rotation is included for the discharge with parallel and perpendicular NBI sources.
Download figure:
Standard image High-resolution image8.2. Fast-ion modelling
MHD modes are present in both discharges shown in figure 10. It is also known from equilibrium reconstruction that q(0) ≈ 1 and sawteeth are seen by the soft X-ray diagnostic. The presence of sawteeth and MHD modes suggests the need to cross-check with the FIDA diagnostic and FIDASIM simulations that the neoclassical RABBIT or TRANSP calculations are not invalidated by fast-ion losses or transport. Neither RABBIT nor TRANSP is able to model fast-ion transport or losses due to sawteeth or MHD modes.
Similar discharges, investigating fast-ion transport and neutral beam current drive in ASDEX Upgrade, have been reported [62]. A clear modification of the fast-ion radial profiles were observed by the FIDA diagnostic. Centrally peaked profiles for perpendicular beam injection and outwards shifted profiles during parallel beam injection were measured. Furthermore, a local anomalous fast-ion diffusivity had to be assumed for the parallel beams in order to match the measured and simulated radial distribution of the fast-ions. This work was extended to compare the measured diamagnetic flux with predictions calculated by the IDE equilibrium reconstruction using TRANSP fast-ion pressure profiles [31]. It was found that the assumption of anomalous fast-ion diffusion was necessary to bring the diamagnetic flux calculations into agreement in the presence of an m/n = 3/2 mode (see figure 7.19 in [31]). On TFTR, extensive modelling of the diamagnetic flux with TRANSP showed that in the majority of discharges the diamagnetic flux measurements were consistent with fast-ion transport assuming anomalous diffusion coefficients ⩽0.2 m2 [10]. Poorer beam ion confinement was found in plasmas with large major radius, possibly owing to stochastic ripple diffusion as the cause for a large anomalous diffusion coefficient of 1.5 m2 needed to bring simulations and measurements into agreement. Its stored energy was 40% less than the baseline TRANSP predicted value and the measured neutron emission was only half of the simulation predicted emission. Fast-ion transport in neutral beam heated discharges on the Experimental Advanced Superconducting Tokamak (EAST) was also investigated [63]. Based on the NUBEAM and TRANSP codes, it was found that fast-ion transport was anomalous when the minimum safety factor (qmin) was about 2, while it was neoclassical when qmin was around 1.
The results of FIDA measurements and FIDASIM simulations based on the TRANSP fast-ion distribution for one of the discharges shown in figure 10 are presented in figure 14. The time slices with perpendicular NBI sources only at 1.5 s and with additional parallel NBI sources at 4.1 s are shown. For the time slice with perpendicular NBI sources only, the measured and simulated radial distribution of fast-ions are in very good agreement for both neutral density assumptions. However, for the time slice with additional parallel NBI sources, the matching depended on the assumed neutral particle density at the edge. Two different background neutral densities,  , are assumed. It is important for the simulation of the passive FIDA emissions, which cannot be subtracted or otherwise estimated in this pulse [38]. The assumption of a higher neutral density leads to predictions that overestimate the FIDA/BES measurements around a normalised toroidal radius of 0.3, reminiscent of previous experiments [62]. The assumption of a lower neutral density leads to predictions that better match the measurements. Equilibrium reconstruction with the calculated fast-ion pressure profiles should only be used when the neoclassical calculations of RABBIT or TRANSP are valid. This is assumed to be the case for this discharge, as FIDA measurements and FIDASIM simulations indicate that fast-ion transport is close to neoclassical for the chosen range of neutral particle densities.

Figure 14. Radial profiles of the fast-ions measured by the FIDA diagnostic (radial FIDA/BES profiles) for a time slice without parallel NBI sources at 1.5 s and with parallel NBI sources at 4.1 s (circles). The measurement is compared with the FIDASIM predictions (lines) using TRANSP fast-ion distribution functions, assuming neoclassical fast-ion transport. Two different background neutral densities,  , are assumed, which are important for the simulation of the passive FIDA emissions.
Download figure:
Standard image High-resolution image9. Asymmetry in toroidally separated diamagnetic flux measurements
In this section it is shown that under particular experimental conditions, the assumption of toroidal symmetry of diamagnetic flux measurements is not necessarily valid. In figure 15, measurements of the diamagnetic flux in an ohmic discharge with a toroidal field of 1.5 T and plasma current of 800 kA are shown. The diamagnetic flux is toroidally symmetrical until the locking of the MHD mode at 1.6 s. In the presence of a locked MHD mode, they are no longer toroidally symmetrical. Toroidal asymmetries in the diamagnetic flux also have been observed in JET discharges with locked modes [64]. This asymmetry was explained by toroidally asymmetric halo currents, which generate an additional paramagnetic toroidal flux in the halo zone, which is then measured with the diamagnetic compensation probe. It is interesting to note that at positions of the compensation probes for DIAf38 and DIAf39 a perturbation due to this halo current is visible while for DIAf37, DIA87 and DIA89 the perturbation seen is in the opposite direction. The poloidal extent of the toroidally asymmetric halo current seems to be strongest near the two compensation probes for DIAf38 and DIAf39. The availability of more than one toroidally separated diamagnetic loop and compensation probe at the toroidal location of the loop is therefore recommended to observe toroidal asymmetries of diamagnetic flux measurements in future experiments [29].

Figure 15. The diamagnetic flux is toroidally symmetric until the locking of the MHD mode at 1.6 s. In the presence of a locked MHD mode they are no longer toroidally symmetric. The compensation probes for DIAf38 and DIAf39 are perturbed by a toroidally asymmetric halo current that generates an additional toroidal flux.
Download figure:
Standard image High-resolution image
10. Conclusions
Aspects of the ideal magnetohydrodynamic model relevant to diamagnetic flux measurements in an isotropic plasma and its extension to an anisotropic plasma have been presented.
The reproducibility of diamagnetic flux measurements in vacuum field shots indicates that the stability of the electronic integrator time constant is a key factor for obtaining reliable measurements. Drifts in the diamagnetic flux measurements were observed in discharges with large ELMs producing voltage spikes that saturated the input stage of the compensation probe integrator. Compared to the signal from the diamagnetic measurement loop, a time delay of 7 ms is needed in the internal compensation flux measurement by the magnetic probe located between the vacuum vessel and the ferromagnetic tiles on the inner wall to obtain diamagnetic flux measurement with the lowest noise level in a vacuum toroidal field shot. Such a time delay was not needed when using the internal compensation probes that did not have ferromagnetic tiles in front of them.
In discharges with perpendicular NBI sources only, the measured diamagnetic flux and that calculated by IDE or TRANSP were in very good agreement. In discharges with perpendicular and parallel NBI sources, it was found that small differences between the measured internal diamagnetic flux and that calculated by IDE/RABBIT equilibrium reconstruction remained even when plasma rotation was included. The differences between measured internal diamagnetic flux and that calculated by TRANSP were attributed to an overestimate of the equilibrium pressure because of fast-ion losses or parallel NBI power input losses.
The plasma energy calculated by equilibrium reconstruction, WMHD, and that calculated by TRANSP, WTOT, by summing the thermal energy, the fast-ion perpendicular and parallel energy and rotation energy were shown in figure 11 to be in good agreement for all time slices evaluated from 14 discharges with NBI and ECRH heating.
From the diamagnetic flux measurement and the values of the plasma circumference, volume and elongation from the equilibrium reconstruction, βp⊥ and WDIA can be calculated. As βp⊥ is a normalised volume integral over p⊥, both the thermal and fast-ion perpendicular energy contribute to WDIA. The diamagnetic plasma energy, WDIA, and the value of  were shown to be in good agreement. However, this experimental value of WDIA contradicts the theoretically expected value
  . Systematic errors of the ion density and thermal pressure profile related to systematic errors in Zeff measurements are a possible reason for this discrepancy but a well-founded explanation requires a more thorough analysis.
For discharges with parallel and perpendicular NBI sources, the plasma energy calculated from equilibrium reconstruction, WMHD, and that calculated by TRANSP, WTOT, was systematically larger than the energy inferred from the measured diamagnetic flux, WDIA. This plasma anisotropy is consistent with equation (25) when the fast-ion parallel energy is sufficiently large and is also expected from the ideal magnetohydrodynamic model, since WDIA is proportional to βp⊥ and is insensitive to the fast-ion parallel and rotation energy.
A toroidally asymmetric diamagnetic flux was measured in the presence of a locked MHD mode, suggesting the usefulness of the installation of a diamagnetic loop and compensation probe at more than one toroidal location in future experiments.
Measurements of diamagnetic flux and the plasma energy inferred from these measurements were compared to calculations for these quantities from IDE equilibrium reconstruction including fast-ion profiles from RABBIT or separately modelled by TRANSP. This comparison provided a consistency check of the input data for modelling.
Acknowledgments
The author would like to thank the ASDEX Upgrade team members responsible for running and maintaining the tokamak and the plasma diagnostics. Thanks to P.J.McCarthy for bringing equation (25) to my attention and to P.Helander for bringing reference [3] to my attention. The support of M.Gorlenkova in carrying out the TRANSP simulations was much appreciated. The work leading to this article was funded by the European Atomic Energy Community and is subject to the provisions of the European Fusion Development Agreement. This work has been carried out within the framework of the EUROfusion Consortium and has received funding from the Euratom research and training programme 2014–2018 and 2019–2020 under Grant agreement No 633053. The views and opinions expressed herein do not necessarily reflect those of the European Commission.