
Abstract
This work explores the dependability tradeoffs provided by the most common types of central power plants in the United States. Historically, the electricity sector has lacked consensus on how reliability, resilience, and vulnerability differ and how those metrics change depending on the power plant fleet composition. We propose distinct definitions for these metrics and an analytical framework to evaluate power plant fleet dependability. Using data analysis and literature review, we identify fifteen dependability attributes across which we rank eleven power plant types relative to natural gas combined-cycle (NGCC) plants. We use NGCC as the benchmark because it is common to many locations and is of relatively recent vintage. The framework shows that each power plant type has unique dependability benefits and drawbacks. We provide examples of how researchers may use the framework to evaluate grid dependability qualitatively under different scenarios. We find that assuming all attributes that contribute to grid dependability are equally important and additive, electric grid dependability is best supported when power plant fleets include a mixture of power generation technologies. Then, we discuss scenario characteristics that could alter the prioritization and relationships of attributes. We also find that if current capacity installation trends continue to favor low- and zero-carbon power plants, US power grids may benefit from increased resilience and reduced vulnerability at the cost of decreased reliability. We conclude by recommending methods for adapting the framework and quantifying relationships between attributes in individual scenarios.
Export citation and abstract BibTeX RIS

Original content from this work may be used under the terms of the Creative Commons Attribution 4.0 license. Any further distribution of this work must maintain attribution to the author(s) and the title of the work, journal citation and DOI.
1. Introduction
As new power plants displace existing generation capacity, they provide more than just new energy sources; they also adjust the mixture of resources that grid operators can use to maintain the electric grid's stability. Because of these shifts in power plant fleet composition, a debate has grown about how we should evaluate individual power plants' contributions to electric grid dependability [1, 2].
Since wind and solar, for example, operate differently than traditional power plants, policymakers have suggested that traditional generators deserve subsidies to preserve their contribution to electric grid dependability. For example, on 29 September 2017, the Department of Energy submitted a Notice of Proposed Rulemaking (NOPR), entitled 'Grid Resiliency Pricing Rule,' to the Federal Energy Regulatory Commission, using grid dependability concerns to justify subsidies for coal and nuclear generators [3]. On-site fuel storage, the rule argued, should be rewarded because it mitigates the risk of electric grid failure during fuel delivery interruptions.
Critics of the NOPR rule argued that power plant fuel shortages cause a negligible percentage of electric grid outages. Fuel shortages, for example, caused only 0.00007% of outages between 2012 and 2016, though there are some prominent recent examples to the contrary [4]. For example, natural gas (NG) shortages during Texas winter storms in 2011 and 2021 helped trigger cascading grid failures. Reliability issues in the transmission and distribution (T&D) sector historically have far outweighed those in the generation sector. Thus, many subsequent papers explored solutions to T&D reliability issues [1, 5–9].
Still, there is value in including power plant capabilities within the broader discussion of electric grid dependability. In the past decade, several high-profile US electric grid failures contained some component of fuel shortage or power plant failure. Cold snaps such as the 2014 Polar Vortex and the 2011 Texas freeze were key motivations for the aforementioned NOPR rule. The events highlighted vulnerabilities in fuel supply and storage, control systems, and frozen mechanical components, especially in fossil fuel-based generators [1, 10]. Furthermore, hurricanes such as Sandy in 2012, Harvey in 2017, and Maria in 2017 illustrated a range of grid impacts over various timescales in various locations. During Harvey, 2 million electricity consumers experienced outages, and 10 000 MW of power plant capacity was unavailable at the peak of the flooding. In this case, the impact on the T&D infrastructure was mild, enabling a fast recovery within a few days after the flooding subsided [11]. During Sandy, high winds and floods destroyed a large portion of the T&D system and reduced power plant capacity by 20 000 MW, affecting 8 million people [12]. The damages prevented full recovery for up to a month in the hardest-hit areas. Hurricane Maria caused the largest power outage in US history. Virtually all 1.5 million Puerto Rico citizens were affected, and power plant capacity took nearly a year to return to pre-storm levels [13]. During Winter Storm Uri in February 2021, prolonged freezing temperatures and fuel shortages disabled nearly half of all generation capacity in the Electric Reliability Council of Texas (ERCOT) electric grid, which left millions of consumers without power for days [14].
There is merit, then, in evaluating how power plants contribute to grid stability. Many studies, however, focus on isolated reliability issues like fuel storage [3] or the risk of climate-induced water shortages on thermal generator cooling systems [15–17]. These studies use a too-narrow scope to describe the broader contribution of power plants to overall grid stability.
Other analyses have used a broader perspective to explore power plant dependability. A 2017 report by mid-Atlantic grid operator PJM, for example, compares power plants across a variety of attributes, including reliability, availability, and flexibility in addition to fuel assurance [5]. However, the analysis is too specific to the PJM electric grid to be generally applied: its reliability metrics derive from PJM ancillary services markets, and its different power plant rankings depend on qualitative feedback from industry partners and PJM employees.
To strengthen our understanding of how power plants generally contribute to electric grid stability, we develop a broad, analytical framework based on academic literature, government reports, industry studies, and historical grid-failures. The resulting analytical framework compares 11 different power plant types across 15 performance attributes. We also propose distinct definitions for reliability, resilience, and invulnerability. Together, these metrics comprise dependability, an expression of the electric grid's ability to manage risk.
The resulting framework shows how changes in power plant fleet composition lead to changes in dependability and reveals potential solutions to resulting dependability problems. The framework provides a consistent and transparent way to scrutinize policy and facilitate policy-making when it focuses on electric grid dependability.
2. Methods
2.1. Defining electric grid dependability
We define grid dependability to be comprised of three distinct metrics: reliability, resilience, and invulnerability. In the existing literature, definitions for these metrics vary and often overlap. Below, we distinguish their meanings:
- Reliability: a reliable grid experiences few disruptions. The North American Electric Reliability Corporation defines reliability as constantly supplying electricity to meet demand [18]. An unreliable grid experiences outages at a frequency that is considered unacceptable.
- Resilience: a resilient grid recovers quickly from disruption. We define resilience as the ability to recover from extreme, dynamic conditions [1, 18–20]. An un-resilient grid experiences prolonged outages because it recovers slowly from disruption.
- Invulnerability: an invulnerable grid minimizes the severity of disruptions. A vulnerable grid, in contrast, experiences extreme disruptions where outages may span significant portions of the network [21–23].
2.2. Attributes of power plant dependability
We divide a power plant's dependability attributes into three performance categories: fuel, grid response, and derating and outages. The attributes for each category are defined in table 1.
Table 1. Definitions of the 15 dependability attributes, grouped according to performance category.
| Category | Attribute | Definition | Historic example |
|---|---|---|---|
| Fuel | Seasonal fuel availability | On-demand availability of the upstream fuel source (e.g. gas production, coal and uranium mining, wind, water, solar insolation) | India drought (2012)c |
| Fuel delivery infrastructure robustness | Historical reliability and robustness of the infrastructure that connects the generator with the fuel source | Polar Vortex (2014)e | |
| On-site fuel storage | Ability to store fuel on-site and average amount stored (in terms of energy required per day of normal operation) | Polar Vortex (2014)e | |
| Dual-fuel capability | Ability to switch between liquid and gaseous fuels (dual-fuel) or burn both simultaneously (bi-fuel) | Polar Vortex (2014)e, Uri (2021)g | |
| Grid response | Inertial response | The average amount of kinetic energy that a power plant contributes that helps the grid resist frequency drops, equal to inertia constant (s) × average capacity (MW) | |
| Reactive power | A voltage control feature of synchronous generators, measured in MVAr reactive power per MW capacity and determined by generator size | ||
| Load-following capability | Speed at which a generator can start up or change supply (up or down) without disconnecting from the grid, normalized to % capacity (MW) per minute (up/down). | Italy, Ohio (2003)a,b | |
| Minimum stable output | A power plant's minimum output (in % of maximum capacity) under normal operating conditions, also known as turndown ratio | Sandy (2012)d | |
| Black start rated | Ability to start up and inject power into the grid even if the rest of the grid is down | ||
| Shutdown Cycle Time | Number of hours it takes a generator to come back online after it has shut down | India drought (2012)c | |
| Deratings and outages | Cooling water requirements | Amount of water consumed while cooling the power plant (normalized to gallons h−1 per MW capacity) | India drought (2012)c |
| Operability during severe storms | Ability to stay on during 'storms and severe weather,' 'cold weather and ice storms,' and 'hurricanes and tropical storms' | Polar Vortex (2014)e, Hurricane Maria (2017)f, Uri (2021)g | |
| Maintenance downtime | Percent of each year that a power plant is typically shut down for maintenance | Ohio (2003)b | |
| Longest repair time | Component with the longest possible repair time, usually due to customization | Hurricane Maria (2017)f | |
| Full outage magnitude | Average plant size in MW capacity |
a Italy (2003): major transmission lines arced to nearby vegetation, operators were unable to relieve overload fast enough to prevent cascading failures [1, 24]. b Ohio (2003): several generators were under maintenance during a sudden demand surge. When major transmission lines arced to nearby vegetation, operators were unable to relieve overload fast enough to prevent cascading failures [1]. c India drought (2012): severe drought during monsoon season increased electricity demand for agricultural irrigation, overloading transmission lines and causing cascading failures. The drought hindered restoration due to diminished hydro capacity and the inability to cool thermal generators with water before restarting [25]. d Superstorm Sandy (2012): nuclear plants had to shut down due to load loss from transmission damage [12]. e Polar Vortex (2014): an extreme cold snap led to increased demand for electricity and NG-powered heating. Many thermal generators were unable to run due to frozen equipment. NG electricity was curtailed to prioritize heating [26]. f Hurricane Maria (2017): all generators were unable to operate during the storm. Devastating structural damage delayed restoration of most power plants—excluding small-scale wind and solar photovoltaic (PV)—for several months [13]. g Winter Storm Uri (2021): prolonged freezing temperatures and fuel shortages disabled nearly half of all generation capacity—including coal, NG, and wind—in ERCOT, leaving millions of consumers without power for days [14, 27].
We started by identifying three power plant performance categories—fuel supply, grid response, and deratings and outages—and organize all power plant attributes into at least one of those performance categories. We then defined three dependability metrics—vulnerability, resilience, and reliability. We identified performance attributes based on reports of historic failures for each combination of performance category and dependability metric. These historic failures occurred in diverse geographies and with different root causes and therefore help map out the envelope of relevant performance factors. The rightmost column in table 1 indicates the attributes that were identified by examining grid failure modes in specific historic examples. The remaining attributes that do not have a corresponding historic example in table 1 were identified based on grid operators' standard reliability regulations.
Fuel attributes describe the likelihood that a generator will have the necessary inputs for producing power during a grid instability event. For simplicity, we use fuel to describe a power plant's source of primary energy input. This term includes materials that produce heat via chemical or nuclear reactions—i.e. NG, coal, biomass, and uranium—as well as sunlight, moving water, geothermal heat, and wind. The attributes that fall within this category are seasonal fuel availability, fuel delivery infrastructure robustness, on-site fuel storage, and dual-fuel capability.
Grid response attributes describe a power plant's ability to balance system demand by supporting electrical stability, responding to sub-hourly demand changes, and re-energizing the grid after a blackout. This category includes inertial response, reactive power, load-following capability, minimum output, black-start rating, and shutdown cycle time.
Derating and outage attributes describe a power plant's risk of shutting down due to weather or maintenance issues. These consist of cooling water requirements, operability during severe storms, annual maintenance downtime, longest repair time, and full outage magnitude.
2.3. Qualitative rankings
We qualitatively rank power plant types as better, much better, similar, worse, or much worse than natural gas combined-cycle (NGCC) for each attribute. We use NGCC as a benchmark because it represents the most-installed power plant capacity in the last 15 years. Furthermore, NGCC is common in all US regions, and it is relatively ubiquitous worldwide, which helps translate the work to other countries. We do not use NGCC as the benchmark to suggest that it is the most dependable technology.
Table 2 provides a summary of the baseline NGCC performance for each attribute, as well as the best and worst performance levels.
Table 2. Qualitative measures for each attribute.
| Attribute | Baseline performance | Best performance | Worst performance | Reference |
|---|---|---|---|---|
| Seasonal fuel availability | Domestic, abundant, conflicting demands | Abundant and affordable | Uncontrollable and can vary suddenly | [28–30] |
| Fuel delivery infrastructure robustness | Subject to leaks, weather, and sabotage | Generator is adjacent to fuel | Vulnerable to leaks, weather, and sabotage | [6, 26, 28] |
| On-site fuel storage | 0 days, possible to store limited amount | 90+ days | 0 days, impossible to store any amount | [26, 31] |
| Dual-fuel capability | Yes | Yes | No | [32, 33] |
| Inertial response | 2980 MW s | 5930 MW s | 0 MW s | [34–37] |
| Reactive power | Yes | Yes | Can be provided via an inverter | [38] |
| Load-following capability | 8% of capacity min−1 | 20% capacity min−1 | 2% of capacity min−1 | [39–42] |
| Minimum stable output | 20% of capacity | 5% of capacity | 50% of capacity | [41–44] |
| Black-start rated | Sometimes | Usually | No | [33, 45–47] |
| Shutdown cycle time | 2 h | 0.5 h | 24 h | [42, 43, 48–50] |
| Cooling water requirements | 47–300 gallons h−1 MW−1 capacity | 0 gallons h−1 MW−1 capacity | 480–1100 gallons h−1 MW−1 capacity | [32, 51, 52] |
| Operability during severe storms | Sometimes shuts down in extreme cold | Rarely affected by weather | Shuts down during most events | [26, 53–56] |
| Maintenance downtime | 6% of the year | 0.6% of the year | 25% of the year | [39, 57] |
| Longest repair time | Steam boiler | Equipment is off-the-shelf | Custom turbines, generators, dams, etc | [33, 58] |
| Full outage magnitude | ∼ 520 MW | 11–83 MW | 1700 MW | [59] |
3. Results
The framework we propose in figure 1 uses a reference benchmark for comparing eleven different power plant types across fifteen dependability attributes divided into three categories. The color-coded cells rate each power plant type relative to an NGCC generator. The power plants are scored based on the 'typical' version of that technology. However, it is important to note that individual power plants in the same technology category can have diverse characteristics. Furthermore, power plants with more recent vintage, namely wind and solar, are in an era of rapidly-improving capabilities. Therefore, a solar farm built 5 years into the future might perform much differently than one built 5 years in the past.

Figure 1. This framework summarizes dependability tradeoffs for common power plant types. Each power plant type is qualitatively ranked based on typical operation traits relative to NGCC power plants. Power plants are grouped according to CO2 emissions at the point of generation. Because wind and solar plants have similar attributes, they are combined into a single column. Overall, there is no single technology that is all good or all bad—they all have tradeoffs. NG = natural gas; NGCC = NG combined cycle.
Download figure:
Standard image High-resolution image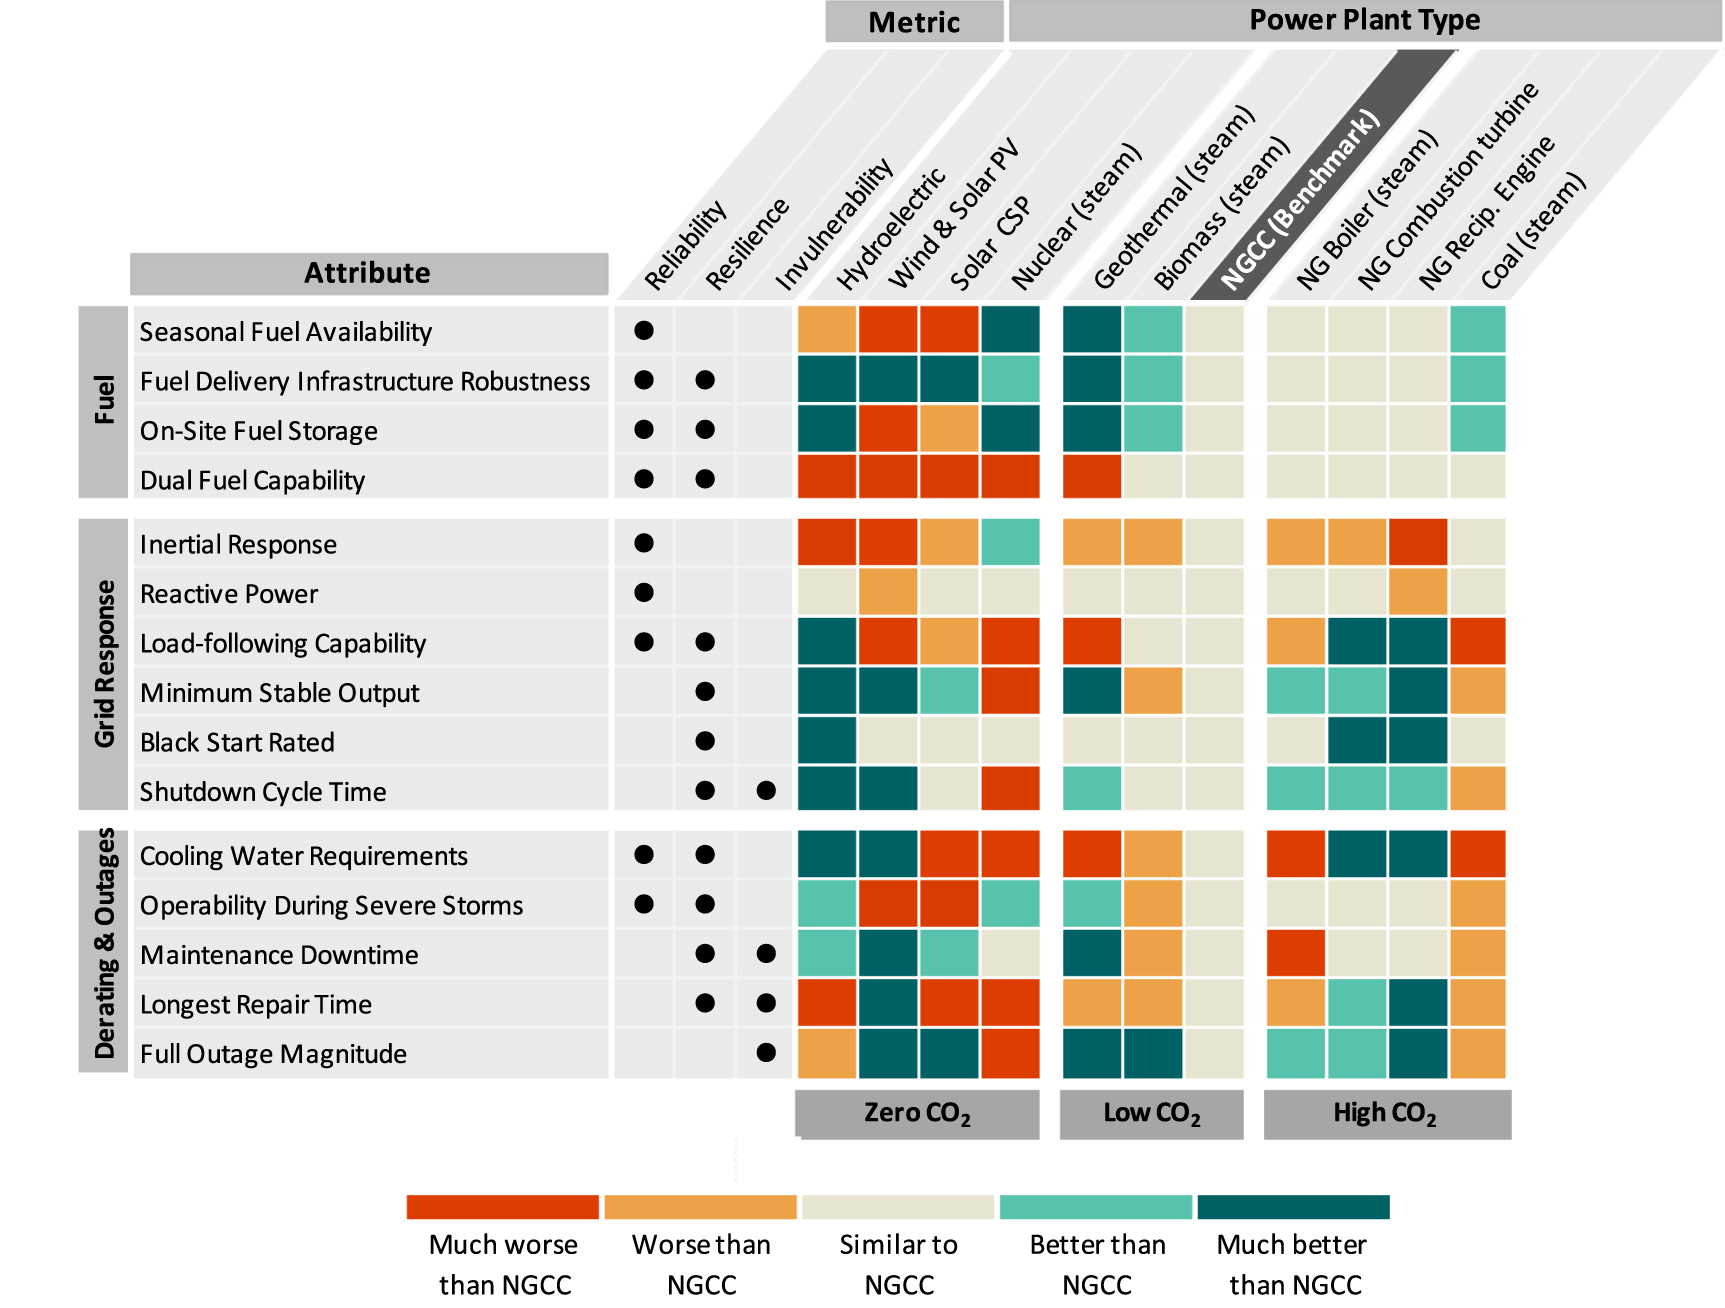
The bottom row of the matrix in figure 1 indicates which power plant technologies have zero, low, or high CO2 emissions. However, each attribute's color-coded ratings do not reflect costs and emissions because they do not directly contribute to electric grid dependability.
The framework excludes T&D network failures, which cause significantly more disturbances than power plant failures [4]. We also note that distributed energy resources, storage, flexible demand, microgrids, and other novel solutions are growing in market adoption and might enable greater electric grid dependability. However, since this study focuses on utility-scale, central power plants' dependability, we do not explore those distributed solutions in this analysis.
The remainder of section 3 contains the detailed analyses used to create the data that populate figure 1 framework. Section 3.1 analyses the individual dependability attributes. Section 3.2 analyzes the individual power plant types.
3.1. Analysis of dependability attributes
3.1.1. Fuel attributes
3.1.1.1. Seasonal fuel availability
This characteristic indicates the risk of a power plant's primary energy source experiencing periodic, long-term supply shortages. For example, because the fuel availability for wind and solar plants varies based on meteorological and astronomical conditions, there is a frequent risk the primary energy will not be available. We considered the abundance, price, market reliability, controllability, and domestic supply of each energy source. We treat all energy sources, including wind, solar radiation, geothermal heat, and water, as fuels.
Natural gas and coal have active domestic extraction industries. However, since NG is also used for industrial processes and domestic heating, high simultaneous demand for power and other uses sometimes occurs, typically during winter months. Simultaneous demand can lead to seasonal fuel availability issues for generators if gas cannot be delivered in sufficient volumes [28, 29].
Coal is reliably available due to a well-developed domestic industry and has the added advantage of primarily serving the electricity sector. Thus we rate coal's seasonal fuel availability as much better. We rate biomass as better because the fuel is widely available in various forms [60]. We rate nuclear fuel availability as much better. While domestic production of uranium is low, the US imports uranium regularly and affordably from Australia and Canada. We rate geothermal as much better. Geothermal steam or heat is usually available on reliable geological timescales [30]. We rate hydro as worse. Hydroelectric power, excluding run-of-the-river technologies, typically has storage reservoirs and more consistent and long-term fuel cycles. Thus, the seasonal fuel availability is somewhat more stable than wind and solar, although less available than coal or NG due to seasonal variability in rainfall and snowmelt. We rate wind and solar as much worse since the generators must consume their energy sources immediately and locally. While wind and solar forecasts are improving, these energy sources are not available on demand.
3.1.1.2. Fuel delivery infrastructure robustness
We characterize each power plant type's delivery infrastructure based on its historical reliability during normal operations and disturbances such as severe weather events. A particular fuel's state of matter (solid, liquid, or gas) is the primary determinant of its delivery method. Our benchmark, NG, is primarily delivered via pipelines and is sometimes compressed or liquefied for shipping across land or water. Although pipelines have many safety and efficiency advantages, the pipeline infrastructure is vulnerable to leaks, severe weather, natural disasters, and sabotage. Furthermore, alternative delivery methods are typically not available during a pipeline failure. For example, during the Polar Vortex in 2014, the NG infrastructure could not fully supply power plants and increased building heating demand, so many power plants were temporarily derated [26].
Solid fuels—coal, biomass, and nuclear fuel assemblies—can be transported via trucks, trains, or ships. These delivery modes are vulnerable to freezing, flooding, and occasional single-point failures such as reliance on an isolated rail bridge. Nevertheless, the supply chains for these fuels are generally reliable and adaptable. Moreover, when these delivery modes fail, they may impact relatively few power plants compared to a NG pipeline failure, for example, which could affect large groups of power plants connected to the same pipeline infrastructure. Therefore, the power plant types relying on coal, biomass, and nuclear are rated better.
We rate the remaining power plant types—geothermal, hydroelectric, wind, solar PV, and solar concentrating solar power (CSP)—as much better since they are sited directly adjacent to their respective energy sources and do not rely on delivery infrastructure. Rare events that could significantly interrupt primary energy carrier's delivery include solar eclipses or volcanic eruptions for solar PV plants and unexpected borehole pressure losses for geothermal plants. Wind and hydroelectric fuel disruptions are accounted for in section 3.1.1.1.
3.1.1.3. On-site fuel storage
This characteristic indicates that the power plant can stockpile fuel at their location and thus operate for an extended time during a fuel delivery interruption. NG storage is possible but requires significant volume since the fuel is gaseous. Moreover, if it leaks, the fuel floats away [61]. Liquefied NG storage is possible, though it requires additional energy and costs. As a result, NG power plants do not usually store fuel on-site and rely on real-time fuel delivery. Biomass is better since it can typically store energy in piles or tanks. Biomass storage time is relatively short—on the scale of days or weeks—due to decomposition. Hydroelectric, nuclear, geothermal, and coal are much better. Hydroelectric power plants can typically store large amounts of water behind a dam or in the watershed for run-of-the-river plants. Geothermal plants operate over heat or steam reservoirs that last for geological timescales, but the instantaneous draw from any given formation might be limited. Coal plants typically have room on-site for piles of coal, which can be large, easy to inspect visually, and do not float away. However, they require management for dust control and fire prevention and can freeze [62] or moisten [63]. Many years of fuel can be stored on-site at most nuclear plants due to the high energy density of nuclear fuel [26, 31]. Concentrated solar is worse because the plants can store some of the Sun's heat in various thermal energy storage media, but only for a few hours. Wind and solar PV are much worse because storing wind and solar radiation are not possible.
3.1.1.4. Dual-fuel capability
Fuel type flexibility improves grid resilience if secondary or backup fuel is available on site during a primary fuel disruption. This attribute and fuel storage (section 3.1.1.3) help generators produce power during fuel delivery interruptions. For example, during Hurricane Harvey, coal power plants relied on fuel stockpiles to operate during delivery interruptions, and some switched to NG when their coal stockpiles flooded [53]. NG power plants can use a secondary fuel such as liquefied NG or fuel oil, though outfitting the plants detracts marginally from the system efficiency and requires storage space for the backup fuel [64]. Coal and biomass power plants can also potentially run on either fuel type, although doing so might require new emissions permitting. Hydroelectric, wind, solar, nuclear, and geothermal power plants only run on single fuels and thus are more vulnerable to supply disruptions [33].
3.1.2. Grid response attributes
3.1.2.1. Inertial response
Synchronous inertial response (SIR) is based on the kinetic energy of power plants with rotating turbines or generators that spin at the same frequency as the alternating current electricity in the grid. When a generator trips offline, SIR-capable power plants immediately respond by injecting energy into the grid, allowing time for other response services to react. Injecting additional energy causes the power plant's rotations to slow down and lower the system frequency. Thus, a grid with more inertial response has a lower frequency degradation rate, allowing more time for response service and increasing the system reliability [35].
An individual power plant's inertial response contribution, measured in MW s, is a product of the inertia constant, influenced by the equipment's mechanical design, multiplied by the plant capacity. We rate the power plants based on inertial response contributions in ERCOT, reported in prior work [34, 36, 59, 65]. While wind and solar PV do not provide any SIR, emerging technologies could enable them to provide some frequency response by contributing 'synthetic inertia' [66, 67].
Table 3. Inertial response metrics—higher values are better. Power plants that are left blank were characterized based on similar technologies [35,36,59,65].
| Power plant type | Inertia constant, H (s) [35] | Average size (MW) [59] | Inertia (MW s) [65] | SIR range [36] |
|---|---|---|---|---|
| Hydroelectric | 0 | 55 | 50 | 19–1133 |
| Wind | 0 | 83 | 0 | 0 |
| Solar PV | 0 | 11 | 0 | 0 |
| Solar CSP | — | 110 | ||
| Nuclear (steam) | 4.07 | 1700 | 5930 | 5344–6530 |
| NGCC | 4.69 | 520 | 2980 | 97–8765 |
| Geothermal | 58 | |||
| Biomass | 21 | |||
| NG (steam) | 2.92 | 290 | 738 | 13–2216 |
| NGCT | 4.98 | 170 | 534 | 22–1288 |
| NGRE | 16 | 13–97 | ||
| Coal (steam) | 2.63 | 760 | 1930 | 863–3158 |
3.1.2.2. Reactive power
Reactive power is a feature of synchronous grids that supports control of the system voltage. Synchronous generators—those with a rotor that spins at the system frequency—can inherently produce or consume reactive power. Relative reactive power capabilities vary by region—in this work, we report data from the ERCOT. All power plant types except for inverter-tied systems such as wind, solar PV, and reciprocating engines are synchronous generators. In some grids, inverters can produce or consume reactive power, though this feature is uncommon [38].
3.1.2.3. Load-following capability
Load-following indicates a power plant's ability to quickly change its output in response to changes in net system demand. We rated power plants based on maximum ramp-up and ramp-down rates, expressed as maximum relative output change per minute normalized by maximum capacity. NG combustion turbines, hydropower, and reciprocating engines have the fastest ramp rates, though the latter must stay warm to achieve high startup rates [40]. Coal and nuclear plants have the lowest ramp rates, so they usually operate close to full output with limited flexibility. However, because these plants are often large facilities, even small changes are significant, and their absolute ramp rates (in megawatts per minute) are high. Wind and solar PV generators are technically capable of fast ramp rates, but ramping is usually based on weather conditions and is seldom controlled based on system requirements [39, 57].
Table 4. Grid response attributes [41–43, 48, 49] . Wind, solar PV, and NGRE are characterized qualitatively in the text due to a lack of quantitative data.
| Power plant type | Min. output (%) | Shutdown cycle time (h) | Ramp rate (% capacity per minute) |
|---|---|---|---|
| Hydroelectric | 5 [42] | 0–1[42] | 15–25[42,43] |
| Solar CSP | 25 [42] | 1–6 [48] | 6[42] |
| Nuclear (steam) | 50 [42] | 24 [42] | 0.26–2[42,43] |
| NGCC | 20–60[41–43] | 2–8[42,43] | 0.66–8[42,43] |
| Geothermal | 15 [42] | 1–5[49] | 5[42] |
| Biomass | 25–50 [43] | 3–6[42,43] | 0.54–8[42,43] |
| NG boiler | 30–40 [42,43] | 2–3[42,43] | 7[42] |
| NGCT | 20[43] | 1[43] | 25[43] |
| Coal (steam) | 30–48[42,43] | 3–12[42,43] | 4–6[42] |
3.1.2.4. Minimum stable output
This parameter, also known as the turndown ratio, describes the lowest power output a generator can supply under normal operating conditions, typically reported in terms of percent of the plant's rated capacity. Minimum output capabilities for each power plant type vary based on components and configuration. The minimum output levels of NGCC power plants range between 20% and 60% [41–43]. Coal and biomass employ similar thresholds to NGCC, usually operating above at least 30%–50% to maintain steam quality. However, they typically behave less flexibly—thus rated worse—than NGCC since their heat and emissions rates worsen at partial load and are subject to regulations. Nuclear facilities are much worse since they rarely operate below 50%. Emissions constraints (e.g. from permitted emissions levels) might prevent a plant from turning down to its lowest level: at lower loads, power plants often operate at lower efficiencies, and their emissions-scrubbing technologies may not work as effectively. Plants based on solar CSP and NG reciprocating engines, NG boiler, and NG combustion technologies can operate as low as 25%, 30%–40%, and 20%, respectively—rated better than NGCC [44]. The remaining much better plants are hydroelectric, wind, solar PV—which can reduce their output to the lowest levels—and geothermal plants, which can operate at 15%.
3.1.2.5. Black start rated
This attribute describes plants that can start up and inject power into the grid even if the rest of the grid is down. NGCC, coal, nuclear, and other technologies that use steam to create electricity typically require external support for the sequential startup of pumps, fans, and conveyor belts. Some of these technologies might have local power equipment, such as backup diesel generators, that can allow them to black start [45, 46]. Hydroelectric power plants are typically black start rated because their fuel (water) does not require any input to flow downhill. NG turbines and reciprocating engines, typically air-cooled, can also usually start on their own—or in the case of combustion turbines, have starter reciprocating engines—and provide black start services to the grid [33]. Since solar and wind are inverter-driven technologies, they must reference the grid voltage to start operating; thus, they are not black start rated. Ongoing research, however, is investigating control mechanisms to enable mini-grids based on renewable energy to support the primary grid during black starts [47].
3.1.2.6. Shutdown cycle time
This characteristic describes how much time it takes a generator to come back online after it has shut down. This cycling can take minutes up to multiple days, depending on each power plant type's protocols for protecting their equipment from thermal stress and other considerations. Within each power plant type, cycle times vary based on the plant. NGCC, biomass, and solar CSP can be cycled moderately quickly within two to eight hours [42, 43, 48]. Coal plants are worse, typically cycling in 3–6 h, while nuclear plants require a full day before coming back online. NG combustion turbines, reciprocating engines, and boilers, as well as geothermal plants, are better; capable of cycling within one to three hours [49, 50]. Hydroelectric, wind, and solar PV facilities are much better; capable of nearly instantaneous cycling.
3.1.3. Derating and outage attributes
3.1.3.1. Cooling water requirements
This attribute captures the vulnerability of thermal plants that utilize water cooling to increase efficiency and prevent mechanical failure. These deratings reduce reliability, particularly if correlated with increased loads such as air conditioning. In 2003 and 2018, for example, severe heatwaves derated France's nuclear fleet by 4 and 3 GW, respectively, which created shortages of reserve capacity [68, 69]. Cooling water shortages can also impact resilience by restricting the ability to quickly restart power plants, which occurred during the massive blackout in India in 2012 [70].
Once-through cooling involves passing external water through a condenser, while evaporative cooling involves evaporating external water into the air. Once-through cooling requires much more water to be withdrawn, but much less water is lost to vapor. Both methods require adequate supplies of cooling water to keep the plant running [51].
We assume the baseline NGCC plant uses a combination of air cooling and evaporative cooling. The plants that do not use heat engines—hydro, wind, solar PV, NG combustion turbines (NGCT), and NG reciprocating engines (NGRE)—are invulnerable to cooling water shortages, so we rate them as much better. The latter two technologies most commonly use air cooling, although turbine inlet chilling and internal blade steam cooling are used to increase the thermodynamic efficiency [32]. We rate steam cycle plants—solar CSP, nuclear, geothermal, NG steam, biomass, and coal—as much worse since they consume two to four times more water per kilowatt-hour than the baseline [51, 52].
3.1.3.2. Operability during severe storms
In this study, we define perability during severe storms as the ability to continue operating throughout major weather events such as hurricanes and winter storms. We only focus on performance during a weather event since the other resilience attributes account for grid preparations and recovery that happen before and after weather events (see figure 1). According to Energy Information Administration (EIA) data, nearly 80% of all major power outages from 2003 to 2018 were caused by three classes of weather events—storms and severe weather, cold weather and ice storms, and hurricanes and tropical storms [71]. For this reason, we focus our analysis on the ability of each power plant type to continue operating during each of these classes of weather events.
Nearly all power plants could shut down during hurricanes, depending on the strength of the storm. NG generators tend to perform well during thunderstorms, but fuel-gelling and frozen equipment can shut down critical plants during cold-weather events [10, 26]. Coal and biomass power plants are worse than NGCC since they might shut down during named storms or extreme cold if on-site coal piles get too wet or freeze, as was experienced during Hurricane Harvey in 2017 and the Polar Vortex in 2014, respectively [53]. Solar and wind farms are much worse since they frequently shut down for the duration of all three weather event types either to protect equipment (e.g. turbines and mirrors) or because energy sources are unavailable [72][73]. Hydroelectric, nuclear, and geothermal power plants are better since they are usually hardened against the three main classes of weather events and can continue operating. However, nuclear and hydroelectric power plants are typically forced to shut down or reduce their power output during hurricanes due to safety concerns [54, 55]. Geothermal power is sensitive to extreme cold and is the only power plant that performs slightly better than NGCC during hurricanes [56].
Table 5. X means the plants usually shuts off during the event. Three classes of weather events—storms and severe weather, cold weather and ice storms, and hurricanes and tropical storms—caused about 80% of major power outages from 2003 to 2018 [71]. Sources for each power plant type are as follows: natural gas [10, 26]; nuclear and hydroelectric [54, 55]; geothermal [56]; coal & biomass [53]; solar PV [72]. Since data is unavailable for biomass, we assume it performs similarly to coal. Similarly, we assume the performance of wind and solar CSP is similar to solar PV.
| Power plant type | Storms and severe weather | Cold weather and ice storms | Hurricanes and tropical storms |
|---|---|---|---|
| Hydroelectric [54, 55]; | X | ||
| Wind and solar PV [72][73] | X | X | X |
| Solar CSP | X | X | X |
| Nuclear (steam) [54, 55]; | X | ||
| NGCC [10, 26] | X | X | |
| Geothermal [56] | X | ||
| Biomass | X | X | X |
| NG (steam) [10, 26] | X | X | |
| NGCT [10, 26] | X | X | |
| NGRE [10, 26] | X | X | |
| Coal (steam) [53] | X | X | X |
3.1.3.3. Maintenance downtime
This characteristic describes how much time a power plant is expected to be shut down each year for routine maintenance, testing, and refueling. NGCC, NG combustion turbines, NG reciprocating engines, and nuclear plants undergo scheduled maintenance about 6% of the year. Coal, biomass, and NG steam plants spend the most time undergoing maintenance, roughly 9%–25% of the year. Wind, hydro, solar PV, and geothermal plants spend the least time down at around 0.6%–3% of the year [39, 57].
3.1.3.4. Longest repair time
Long component repair times affect generators with customized, specialized equipment that can be taken offline for extended periods after a mechanical failure. Hydroelectric (hydraulic turbines, generators) [58], concentrating solar thermal (central receivers), and nuclear power plants (steam generators, steam turbines, reactor pressure vessels) are susceptible but rarely experience these failures. For power plants based on steam boilers, the boiler repair or replacement time can still be significant, but non-trivial markets for these components exist. Smaller-scale generators are available nearly off the shelf. Combustion turbines can be repaired or replaced relatively easily. Reciprocating engine repairs are likely the quickest of all, with pistons, crankshafts, and engine blocks being the most important [33]. Similarly, wind and solar PV components can be quickly replaced.
3.1.3.5. Full outage magnitude
This characteristic describes the magnitude of an outage if an entire plant fails or is cut off. A larger plant tripping offline stresses the grid more than a small plant trip because its lost supply must be quickly balanced by shedding demand or increasing supply in the remaining power plant fleet. In fact, many electric grid operators size some contingency services based on the capacity of their largest power plant [36]. Table 6 summarizes the typical size and range of power plant types, based on data reported by the EIA. The ratings in figure 1 in the main text reflect the average capacity of each technology type. Many of these plants are comprised of smaller generators, for example, multiple 250 MW boiler systems at a thermal plant, dozens of 1–3 MW scale turbines at a wind farm, or thousands of 250 kW scale panels at a solar farm. Even if one boiler, turbine, or panel fails, the entire power plant does not necessarily shut down. In this situation, the modular design of wind and solar farms is a performance advantage.
Table 6. Typical US power plant sizes [59].
| Power plant type | Average size (MW) | Maximum size (MW) |
|---|---|---|
| Hydroelectric | 55 | 6500 |
| Wind | 83 | 1500 |
| Solar PV | 11 | 600 |
| Solar CSP | 110 | 280 |
| Nuclear (steam) | 1700 | 4200 |
| NGCC | 520 | 4300 |
| Geothermal | 58 | 1300 |
| Biomass | 21 | 150 |
| NG (steam) | 290 | 1922 |
| NGCT | 170 | 1800 |
| NGRE | 16 | 97 |
| Coal (steam) | 760 | 3600 |
3.2. Dependability tradeoffs for each power plant type
3.2.1. Natural gas combined cycle (benchmark)
Natural gas combined cycle (NGCC) power plants burn NG to rotate a combustion turbine for electricity generation and use the waste heat to produce steam that drives smaller turbines for generating additional electricity. NGCC generators operate flexibly with high inertial response [36, 65], fast ramping rates [43], relatively low cooling needs [32], and low minimum output [41, 43]. They use standard, modular designs that can be constructed and repaired more promptly than larger steam boiler generators [74]. Disadvantages include higher annual maintenance times [39] and large outage magnitudes if the plant trips offline [59]. Fuel supply is readily available from several large regions in the US, Canada, and Mexico. However, delivery is usually restricted to pipelines. Although pipelines have safety and efficiency benefits, they are prone to various failures that can impact large portions of the NG network [6, 26–28].
3.2.2. Hydroelectric
Hydroelectric facilities provide fast ramp rates [42, 43], low minimum output [42], and fast startup times [42, 43]. They use rainwater and snowmelt as fuel, which can be readily stored behind a dam and do not require delivery infrastructure. They are black start rated, need no cooling, and require less maintenance downtime than many other power plants [39, 57]. Though generally considered reliable, shortages of hydroelectric output helped contribute to significant blackouts in Uruguay, India, and other locations. The 2012 blackout in India was triggered partly by floods, which caused silting behind major dams, reducing their capacity. Droughts reduced water flow rates, further lowering generation and delaying the restoration of power [70].
While dams are important contributors to reliability, they introduce vulnerability to the grid and are not always resilient. A whole-plant failure or dam collapse, while unlikely due to component redundancies and structural design, could create a large magnitude power trip [59]. Furthermore, collapsed dams would take many years to rebuild and may not be economically feasible. Operational disadvantages include lower inertial response [36, 65], sensitivity to precipitation deficits, and possibly long equipment replacement times [58], especially for larger facilities.
3.2.3. Wind and solar PV
Wind and solar PV contribute to the resilience and invulnerability of the grid, though their reliability is relatively poor. They rely on energy sources that do not use a delivery infrastructure and are somewhat predictable, but they might be unavailable during an instability event. Advantages include no cooling needs, very low minimum output levels (via curtailment), and fast shutdown cycle times. They also use modular components that are readily available for repairs and replacements.
A primary disadvantage is that wind and solar radiation are intermittent. Events like hurricanes and dust storms usually limit output and can damage components [59]. As inverter-based generators, they typically are not black start rated [47] and may or may not provide synthetic inertial response [66, 67] or reactive power, depending on the design [38].
3.2.4. Concentrating solar power (CSP)
CSP plants focus sunlight to produce steam for powering a steam turbine generator. CSP plants have on-site thermal energy storage technologies that can store solar heat for a few hours or days. The storage systems also enable load following [42]. Like other steam-cycle generators, they provide inertial response and reactive power. Their small plant size means that a plant-wide outage has a minor impact on grid stability [59].
On the downside, CSP facilities use the same unreliable fuel supply as solar PV with the added weaknesses of steam boilers. They require cooling water for maximizing their efficiency, making them vulnerable since many CSP facilities are located in dry, sunny areas with limited water supplies [51, 52]. Certain CSP plants—such as power tower designs—have single, large components that would be costly and time-consuming to replace [75].
3.2.5. Nuclear
Nuclear power plants use nuclear reactions to produce heat for powering a steam turbine generator. US nuclear plants consistently withstand severe weather and natural disasters, though they occasionally shut down due to safety precautions [54, 55, 71]. They also store fuel on-site [26, 31] and rely on robust global markets for fuel fabrication, products, and enrichment.
Drawbacks are that nuclear plants operate inflexibly with poor load-following, minimum output, and shutdown cycle time (especially towards the end of a fuel cycle) [42, 43]. In addition, they use large, custom components that may lead to extended outages or even emergency shutdowns. Finally, their cooling requirements make them vulnerable to shortages and elevated temperatures in external water sources [52].
3.2.6. Geothermal
Geothermal facilities use naturally-occurring, subterranean heat sources to power steam cycles for electricity generation. These power plants can only be built near suitable heat reservoirs since heat cannot be efficiently transported over long distances. The heat source at each site typically lasts for decades and relies on boreholes for delivery to the generator [30]. Geothermal power plants can turn down to relatively low levels [42], have low maintenance down-times [39, 57], and, since plant sizes are small, outages have minor effects on grid stability [59]. Furthermore, their relatively compact and enclosed design makes them more resistant to severe weather like thunderstorms, though not necessarily to floods [56]. Operational drawbacks are their cooling water requirements [51, 52], slow ramp rates [42], and smaller-scale maintenance supply chain.
3.2.7. Biomass
Biomass facilities with steam boilers burn organic material to power a steam cycle. Biomass power plants equipped with gasifiers could use combustion turbines, combined cycles, or reciprocating engines rather than steam boilers which might change the dependability attributes. Biomass plants offer wide fuel availability [60], multiple fuel delivery modes, and on-site storage. Since most biomass power plant capacities are relatively small, their outages do not significantly impact wider grid stability [59].
However, biomass fuels have low energy density and are frequently harvested far away from demand centers, which potentially limits fuel availability. Furthermore, biomass steam power plants require cooling water for efficiency [51, 52] and have high minimum outputs [42, 43] and outage rates. They also occasionally require major repairs in the boilers or steam turbines.
3.2.8. Natural gas boiler
Natural gas boilers power a steam cycle by burning NG. The installed fleet is mostly comprised of older facilities with good reliability but limited flexibility and significant maintenance requirements. NG is widely available, though subject to delivery interruptions [26, 28], and some plants can run on fuel oil as well as NG [64]. The power plants exhibit good thunderstorm durability [53] and moderate startup times. Because the plants are medium-size, outages usually have minimal impacts on grid stability.
Like all NG plants, NG boilers experience fuel supply and operation issues during extreme cold weather events [10, 26]. Furthermore, they operate using a steam cycle, making them less efficient than NGCC and more reliant on cooling water per unit generated [51, 52]. They are also shut down for maintenance much more frequently than NGCC plants [39]. They also sustain the disadvantages common to all steam cycle plants—lower inertial response [36, 65] and slower ramp rates [42].
3.2.9. Natural gas combustion turbine
The NG combustion turbine operates more flexibly than NGCC facilities—with black start capabilities, lower minimum stable output, and excellent load-following capabilities [42]. The smaller generator size makes individual outages trivial for grid stability [59]. Combustion turbines often increase efficiency by using air or water for steam and turbine inlet chilling, but their water consumption remains low [32, 52]. They are also widely manufactured and the global market for parts and repairs, which reduces the impacts of component failures.
Natural gas combustion turbines do provide lower inertial response than NGCC facilities [36, 65]. They also produce electricity at lower efficiencies than NGCC facilities, which increases their emissions and makes them expensive to operate.
3.2.10. Natural gas reciprocating engine
While reciprocating engines represent a small portion of the US power fleet, they are one of the fastest-growing sources of electricity [76]. Reciprocating engines require negligible cooling water since they are almost exclusively air-cooled [32]. They are capable of very low outputs and quick startup and ramping times [40]. Single unit failures are commonly less than 20 MW, so even multi-unit plant outages do not drastically affect the grid [59]. They can run with multiple fuels [64], are black start capable [33], and repair impacts are typically minimal due to small component sizes and widely-available parts.
Reciprocating engines have some resilience shortcomings. They may not contribute to inertial response or reactive power, depending on whether they are connected to a grid synchronously [38]. When connected synchronously, they provide less inertial response per megawatt than turbine-based systems [36, 65]. Like combustion turbines, they have relatively lower efficiencies compared to NGCC facilities, which increases their emissions and makes them expensive to operate.
3.2.11. Coal
Coal-fueled power plants run on a steam cycle by burning coal. Their dual-fuel capabilities, fuel availability, robust fuel delivery infrastructure, and on-site fuel storage provide significant benefits for grid reliability and resilience.
Coal's disadvantages include high CO2 emissions, limited operational flexibility [42, 43], significant cooling water needs [52], lengthy annual maintenance downtime, and long component repair times. Fuel delivery can be easily disrupted in various ways, for example, by train wrecks several states away. Though on-site fuel storage is a useful attribute, coal storage presents fire and dust pollution hazards and makes the fuel vulnerable to freezing or getting wet (as seen during the Polar Vortex [26] and Hurricane Harvey [53], respectively).
4. Discussion
4.1. Key takeaways of figure 1
We created this framework to enable discussions about dependability that are analytical and consistent. There are numerous discussions for which this framework could be used. We provide a few examples here to illustrate its usefulness.
Visual inspection of figure 1 reveals that all power plant technologies have tradeoffs. Thus, if all the attributes have equal importance and linear, additive relationships, we may conclude that electric grid dependability is best supported when power plant fleets include a mixture of power generation technologies. Diversification prevents entire system failures that are caused by a single risk factor. However, in some risk scenarios, a subset of the attributes and technologies may sufficiently guarantee a particular grid's dependability. The framework in figure 1 will enable researchers to determine optimal technology mixes for various scenarios.
Furthermore, the framework can help determine the potential impacts of power plant trends. For example, the grid in the US is increasing the amount of low- and zero-carbon generators while phasing out high-carbon power plants. Figure 1 illustrates that low- and zero-carbon plants have tradeoffs and shows the potential dependability strengths and liabilities introduced by this trend. Based on the strong ratings in fuel delivery and storage, weather durability, and maintenance requirements, we conclude that zero- and low-carbon power plants can improve the resilience and reduce the vulnerability of a power grid. However, zero- and low-carbon power plants also introduce liabilities, including poor fuel availability, lack of dual-fuel options, inertial response, reactive power, and load-following capabilities. Emerging technologies might solve these liabilities. Energy storage, for example, could augment load-following capabilities and provide frequency response in place of rotational inertia [77]. Alternatively, affordable carbon capture and storage technologies could cut emissions while preserving the grid dependability contributions of high-carbon generators. As the trends favoring low- and zero-carbon power plant installations continue, the framework can be used to identify potential liabilities so that policymakers can incentivize mitigating strategies and technologies.
It is important to note that conclusions drawn from figure 1 are qualitative. Our aim in the current work is to present researchers in the fields with a generalized framework. We refrained from providing quantitative formulations because analytical grid models vary according to grid characteristics. Furthermore, the topic of this study is nearly impossible to study through controlled experimentation. As a result, future modeling work will rely on empirical data and should thus report inherent uncertainties in any conclusions obtained.
4.2. Important future work
We propose figure 1 as a tool that is meant to enable exploration of the nuances of grid dependability by grounding such discussions in a consistent, generalized framework. Below are examples of the follow-on discussions that we encourage researchers and grid operators to consider for their respective regions of interest. In addition, further characterizing the dependability of newer technologies such as wind turbine weatherization, energy storage, and solar CSP will require improved data availability.
- Finetuning the lists of attributes and relevant technologies: we defined our list of attributes based on historic grid failures. Other attributes could be important to include. For example, we considered including an additional attribute known as 'common-mode failure points,' defined as a generator's vulnerability to shutdowns due to the failure of a single component. We found this attribute to be mentioned frequently in the literature pertaining to nuclear power plants. However, the attribute's tradeoffs overlapped with 'maintenance downtime' and 'longest repair time.'
- Prioritization of attributes: each attribute's relative important will vary in different scenarios. For example, 'longest repair time' was much more critical than 'cooling water requirements' during the slow recovery of Puerto Rico's power system after Hurricane Maria. However, in a landlocked region that is safe from hurricanes but prone to heatwaves and droughts, 'cooling water requirements' should be more important than 'longest repair time.'Ranking attributes for specific scenarios could be accomplished using qualitative methods such as expert elicitation. That is, experts in the field can be surveyed to ask what the essential attributes are and how they would rank them [78]. Alternatively, rankings could be evaluated using quantitative methods, such as statistical analysis of empirical data to quantify the relative impacts of having or not having different attributes.
- Understanding relationships between attributes: some of the attributes might have non-linear relationships with each other in additive, multiplicative, canceling, or common-mode ways. We expect that such relationships are grid-, climate-, or season-specific. Such relationships may be explored in future studies by assessing causal relationships between certain combinations of attributes and the resulting reliability, invulnerability, and resilience of power grids under various conditions. Relationships between power plant dependability and the T&D infrastructure should also be evaluated.
5. Conclusions
The work in this manuscript shows that no one attribute drives overall power plant dependability, and therefore a range of performance capabilities should be considered by planners. After major grid disturbances, policymakers and news sources tend to focus on individual attributes. For example, after the Polar Vortex in 2014, the 2017 NOPR's claims that the ability to store fuel on-site justified subsidizing coal and nuclear to improve fuel dependability were risky because they focused on just one of many dependability attributes. To be consistent, a policy that boosts fuel dependability should include hydroelectric, geothermal, and biomass power plants. A policy that subsidizes only coal and nuclear without acknowledging those technologies' weaknesses—maintenance requirements, outage vulnerability, and operational inflexibility—introduces the risk of worsening grid dependability.
The power plant fleet supports the electric grid's stable operation. The fleet's changing composition promises new challenges that require technology and policy solutions. Using incomplete definitions of grid dependability, however, can lead to policy that worsens the situation. The intent of this framework is to show in a consistent, objective, and defensible way the benefits and liabilities of each power plant type so that future policy can more effectively support the dependability of the electric grid.
Acknowledgments
This material is based upon work supported by the National Science Foundation Graduate Research Fellowship Program under Grant No. DGE1745016. Any opinions, findings, and conclusions or recommendations expressed in this material are those of the authors and do not necessarily reflect the views of the National Science Foundation. Additional funding for this work was provided by the Idaho National Laboratory (INL, Contract No. EXT-18-45010), the Cynthia and George Mitchell Foundation, and the Electric Reliability Council of Texas (ERCOT). Though the US Department of Energy and ERCOT partially sponsored this work, they do not necessarily support its findings. The authors would like to thank the thoughtful contributions of Tammie Borders and Ronaldo Szilard from INL and Kevin Hanson and Julia Matevosyan from ERCOT.
Data availability statement
The data that support the findings of this study are available upon reasonable request from the authors.