


Abstract
Western North American fires have been increasing in magnitude and severity over the last few decades. The complex coupling of fires with the atmospheric energy budget and meteorology creates short-term feedbacks on regional weather altering the amount of pollution to which Americans are exposed. Using a combination of model simulations and observations, this study shows that the severe fires in the summer of 2017 increased atmospheric aerosol concentrations leading to a cooling of the air at the surface, reductions in sensible heat fluxes, and a lowering of the planetary boundary layer height over land. This combination of lower-boundary layer height and increased aerosol pollution from the fires reduces air quality. We estimate that from start of August to end of October 2017, ∼400 premature deaths occurred within the western US as a result of short-term exposure to elevated PM2.5 from fire smoke. As North America confronts a warming climate with more fires the short-term climate and pollution impacts of increased fire activity should be assessed within policy aimed to minimize impacts of climate change on society.
Export citation and abstract BibTeX RIS
1. Introduction
Natural wildfires are a fundamental Earth System process closely linked with temperature and precipitation rates (Bowman et al 2009, Flannigan et al 2009, Pechony and Shindell 2010, Williams and Abatzoglou 2016) and are thus sensitive to a changing climate. In addition to altering climate, recent human activity also plays an important role in modulating modern fire regimes by increasing and redistributing fire ignitions, and by passive and active fire suppression reducing the total spread of fires (Bistinas et al 2013, Knorr et al 2016); although 20th-century American fire suppression policy likely increases spread beyond a natural termination point due to accumulating additional fuel, which would have normally burnt naturally (Westerling 2006, Schoennagel et al 2017). Fires in turn directly alter the radiative budget of the atmosphere via increasing greenhouse gasses and atmospheric aerosol burdens and also by modifying surface albedos via altering vegetation coverage (Sena et al 2013, Carter et al 2020). Fire aerosol emissions also indirectly impact climate by modifying cloud properties (Ward et al 2012, Rap et al 2013, Hamilton et al 2018). In addition to these impacts, fires pose major air quality and health concerns from wildfire smoke (Dittrich and McCallum 2020) as fires are a major contributor to PM2.5 (particulate matter with diameter less than 2.5 µm). The U.S. Environmental Protection Agency National Emissions Inventory for 2017 (NEI 2017; www.epa.gov/air-emissions-inventories/2017-national-emissions-inventory-nei-data) estimated that all open burning fire activity contributed 43% of the total primary emitted PM2.5 within the US, with two-thirds (67.4%) attributable to wildfire activity. Overall, large fire years could be contributing more than 50% of total summer-time PM2.5 (O'Dell et al 2019).
Climate change has modified fire-weather, those meteorological indices which determine the prospect of a fire's initiation, duration, and overall severity. In western North America, human-caused warming is estimated to have approximately doubled the total area burnt by fires over the last three decades (Abatzoglou and Williams 2016). Increases in temperate and burning season length combined with decreases in precipitation have increased the number of large fires at a rate of seven per year (Dennison et al 2014). Human activity also increases the risks of fire to society as most fires which pose a threat to homes in the western USA can be linked to human ignitions (Mietkiewicz et al 2020). Fires during the summer of 2017 were unusual in terms of the number, intensity, and frequency of events. Over the year, an estimated 71 499 fires burnt just over 10 million acres of American land (www.nifc.gov), making 2017 a close second (<1% difference in area burnt) to the modern, record-breaking, 2015 fires (over the last 60 years), although 2020 is set to break these records. Estimated acute mortality from PM2.5 from Canadian fires in 2017 was approximately 2.5–5 times that found during the years 2013–2015 (Matz et al 2020). The costs of fire suppression efforts at this scale are significant: just short of $3 billion for 2017, a cost of 58% more than the decadal mean. Yet the economic cost of health impacts from the fires may surpass this number, even during an average year. Between 2008 and 2012 health costs of wildland fires within the continental US were between $11 and $20B (2010$) for acute exposures and $76 and $130B (2010$) for chronic exposures to wildfire smoke (Fann et al 2018). This evolving relationship between fire-weather and fire activity is critical for understanding future fire impacts under climate change. For example, the course of a normal Californian summer sufficiently desiccates most fuels to the stage where they readily burn; therefore, only small changes in local fire-weather are required to impose such conditions on annual herbaceous fuel stocks where devasting large fires can occur (e.g. Keeley et al 2004), such as the early October 2017 northern Californian fires that claimed 44 lives (Mass and Ovens 2019).
Several previous studies estimating the radiative feedbacks of (wild)fires emphasized the importance of understanding how the evolving aerosol forcing from changing fire patterns impacts climate (e.g. Bowman et al 2009, Ward et al 2012, Tosca et al 2013, Clark et al 2015, Hamilton et al 2018). It is unclear, however, how the recent increases in the number, intensity, and frequency of fire events impact the short-term local meteorology, atmospheric radiation balance, and air pollution over western North America. It is this part of the complex coupling of fires within the Earth System that we are investigating here. Using ensembles of model simulations for 2017, tuned to match observations, we evaluate how the atmospheric aerosol properties of summer 2017 fires impacted (a) the regional energy budget and meteorology, and (b) air quality and premature mortality rates. This knowledge is particularly important as society confronts a warming climate and strategies for assessing and addressing increased fire activity under climate change are developed.
2. Methods and data
2.1. Model description and simulation setup
In this study we used the Community Earth System Model (CESM) version 1.5 (Hurrell et al 2013) with the interactive chemistry version of the Community Atmospheric Model (CAM-chem) as the atmospheric component (Tilmes et al 2015). The CAM-chem configuration used here includes an extensive representation of tropospheric and stratospheric chemistry and aerosols, TS1 (Emmons et al 2020), including a volatility basis set parametrization for the formation of secondary organic aerosols (SOA) (Tilmes et al 2019). The aerosol component of CAM-chem is represented by the 4-mode Modal Aerosol Module (MAM4) (Liu et al 2016) with updates described in Mills et al (2016), which assumes internally mixed aerosols and includes the emission, transport, and deposition of aerosols in four modes: Aitken, accumulation, coarse, and primary carbon. There are two sources of fire information used in this study. First, satellite-based fire emissions from FINN are used to evaluate the impacts, as discussed below. Second, the Community Land Model (CLM) version 5.0 also has a prognostic fire algorithm for forest, agricultural, tropical deforestation, and peat land unit types (Lawrence et al 2019). Model-generated fire emissions are not actively coupled to the atmosphere in CESM by default and here only used in evaluating the feedback of this fire season onto fire probabilities. All runs use a horizontal resolution of 0.9 × 1.25° and 56 vertical levels.
To examine the impact of 2017 fires on meteorology within the western USA, CESM was configured in both 'offline' and 'online' modes. In the offline mode the meteorology is nudged to GEOS5 (Rienecker et al 2008) meteorological reanalysis. In the online mode, the evolution of simulated atmospheric dynamics is internally ('online') derived. The 'offline' mode was used to spin-up the model atmospheric chemical and aerosol state, and to tune modeled carbonaceous emissions in 2017 to match measured quantities (section 2.2). To look at the feedback of aerosols onto the temperature and precipitation, we ran ensemble simulations with online (prognostic) meteorology. We ran one set of 18 ensemble members without North American (>20° N) fire emissions and two sets of 18 ensemble member simulations with tuned fire emissions: a set with our baseline tuning of fire emissions and an additional set to examine the local meteorology sensitivity to the organic carbon (OC) to black carbon (BC) fire emission ratio. Each ensemble member used slightly different meteorology as an initial condition to sample atmospheric internal variability and was conducted for nine months starting 1 April 2017. The ensemble of online runs allows for the robust calculation of the fire radiative forcing of aerosols and their feedbacks on the radiation budget and meteorology of North America, across a range of plausible initial boundary conditions. Briefly, the fire aerosol shortwave radiative forcing was computed as the change in shortwave radiation at the surface between two simulations: with and without fire aerosol scattering and absorption. The offline simulation was used to evaluate the effect of the carbonaceous aerosols from fires on human health and air quality. We present results within two different simulation time frames over the western US region: (a) for the first week of September 2017 we examine the clear relationship between the large-scale fire activity and meteorology elicited from the 18 paired ensemble online simulations and (b) for a somewhat longer period, from 1 August to 31 October, we examine in the offline simulation the integrated impacts of fire aerosols on human health and premature mortality rates.
2.2. Aerosol emissions and observational constraints
The a priori fire emissions follow the Fire Inventory from NCAR (FINN) dataset (Wiedinmyer et al 2011) version 1.6. The FINN inventory includes daily fire emissions from wildfires, agricultural fires, and prescribed burning. All other carbonaceous emissions are taken from HTAP-2 (Janssens-Maenhout et al 2015). Dust and sea salt are prognostically calculated following the MAM4 default configuration (Liu et al 2016). The SOA scheme treats organic aerosol formation from biogenic, anthropogenic, and fire emission pre-cursor gases. Fire emissions were vertically distributed latitudinally by biome following AeroCom recommendations (Dentener et al 2006) up to a maximum plume height of 5 km. The FINN 1.6 dataset used here has larger emissions than FINN 1.5 (figure S1 and tables S1 and S2 (available online at stacks.iop.org/ERL/16/064065/mmedia)). However, a comprehensive evaluation of the model simulation in the western US (between 30°– 50° N, 100° – 130° W) was undertaken to tune the FINN 1.6 emissions so as to better match the measurements. In tuning the emissions any bias in the original emission dataset is assumed to be compensated for. We also note that the difference between FINN dataset versions is smaller than the uncertainty between current fire emission estimates between different datasets in the literature, which is between a factor of 4–7 for North America (Carter et al 2020), and around a factor of 4 globally (Pan et al 2020).
All emission tuning is done in the offline simulation using reanalysis winds. In our online simulations, where we examine the radiative forcing of the fire aerosols, we use fire emissions that have been tuned to match the atmospheric optical depth (AOD; the vertically integrated sum of total ambient particle extinction) in the offline simulation. The period from April to September 2017 was used to tune the simulated AOD, as the simulated North American fire aerosol burdens were largest during this period (figures S2 and S3). We assume that tuning to AOD provides a stronger constraint on aerosol radiative forcing than tuning to surface aerosol concentration measurements. Specifically, we multiply the a priori FINN1.6 particulate organic matter (POM; equals 1.4 OC by weight) and BC fire emissions by a common time and spatially independent multiplicative tuning factor (×3.5) so as to match AOD measurements from the AERONET sun photometers (Holben et al 2001). Due to the sparsity of measurements we did not attempt to disaggregate the tuning factors temporally or spatially. Similar to previous studies, we assume a linear relation between fire emissions and AOD exists (Ward et al 2012, Tosca et al 2013). Previous studies show that climate is sensitive to the ratio of emission components, such as BC and OC (e.g. Myhre et al 2013, Lu et al 2015, Pokhrel et al 2016, Matsui et al 2018). This is due in part to their opposing roles in atmospheric radiative balance; BC causes warming by absorbing incoming sunlight, while OC causes cooling by scattering incoming sunlight. The BC:OC ratio in fire plumes is highly dependent on the underlying burning conditions and vegetation type being consumed as fuel (Yokelson et al 1996, Reid et al 2005a, Andreae 2019). For example, flaming fires are more energetic than smoldering fires, producing more BC per unit of OC (Jen et al 2019), and are thus more efficient at absorbing solar radiation (Reid et al 2005b). However, tuning to AODs does not constrain this ratio, and we therefore ran an additional set of 18 ensemble simulations to test the sensitivity to this ratio. In these sensitivity simulations we tune the fire emissions to match the AODs but assume the tuning factors for the BC emissions are three times larger than those for OC.
To estimate premature mortality rates and the fires impact on air quality, emissions were independently tuned to match surface carbonaceous aerosol measurement from August to September 2017. We could not find a consistent set of tuning factors that match both observations of AOD and surface aerosol concentrations simultaneously. Briefly, the simulated OC and BC aerosol concentrations were separately multiplied by temporally and spatially independent multiplicative factors to best match, in a least squares sense (equations in SI Methods), the measured OC and BC surface concentrations obtained from the Interagency Monitoring of Protected Visual Environments (IMPROVE; http://vista.cira.colostate.edu/Improve/) version II samplers (figures S4 and S5). We assumed that modelled and observed OC is equal to the sum of POM plus SOA. The fire component of the surface aerosol concentration for both OC and BC is over an order of magnitude greater than the non-fire contribution (figures S4 and S5), suggesting that almost all the explained variability in the measurements is captured by the modelled fire aerosols.
2.3. Premature mortality rate estimation
The excess mortality (ΔMort) from the fires is calculated from the relative risk (RR), the risk of excess mortality in the population exposed to fire PM2.5 divided by the baseline mortality rate (Mb). The RR is assumed to increase exponentially with fire PM2.5 such that RR is equal to exp(βΔX). Here ΔX is the fire PM2.5 enhancement in primary and secondary carbonaceous aerosols as calculated in the tuned offline simulation and β is the concentration–response factor for mortality due to short-term exposure to PM2.5 estimated in the US from 1999 to 2005. Due to the episodic nature of severe forest fires we use the concentration-response function appropriate for short-term acute exposure to wildfire smoke. Assuming the baseline mortality estimate (Mb) does not already include the mortality due to the effects of severe forest fires, ΔMort is given as (Borchers Arriagada et al 2020):

where Pop is the exposed population. Baseline mortality rates were taken from CDC (Centers for Disease Control and Prevention) mortality data (www.cdc.gov/nchs/nvss/mortality/gmwk12.htm). Gridded population data (2015) is from the Center for International Earth Science Information Network (https://sedac.ciesin.columbia.edu/data/set/gpw-v4-population-count-rev11). A 10 μg m3 increase in two days averaged PM2.5 was found to be associated with a 0.98% increase (95% CI, 0.75–1.22) in total mortality, a 0.85% increase (95% CI, 0.46–1.24) in cardiovascular disease mortality, and a 1.68% increase (95% CI, 1.04–2.33) in respiratory mortality (Zanobetti and Schwartz 2009). While fire-generated PM2.5 may adversely impact health in comparison to ambient concentrations (Liu et al 2017), there is of yet insufficient evidence to quantify this effect (Matz et al 2020). Thus, the risk coefficients for premature mortality were estimated from the general epidemiological literature and were not specific to fire-generated aerosols.
3. Results and discussion
The results of the comparisons of simulated to measured AOD (from April to September 2017) and of simulated to measured surface carbonaceous aerosol concentrations (from August to September 2017) are discussed in section 3.1. The impact of fire aerosols on the energy budget and local meteorology was clearest during the first week of September and thus we present results for this week in section 3.2. We then present results of how increases in PM2.5 due to fire activity, from August through October, could have impacted premature acute mortality rates via air quality reductions in section 3.3. We include October to assess the impact of the major northern Californian fires that occurred then.
3.1. Comparison of modelled fire aerosol concentrations to observations
Fire emission datasets result in a well-documented low bias when comparing modelled AOD's to observed AOD's (Ward et al 2012, Tosca et al 2013, Reddington et al 2016). Wiedinmyer et al (2011) estimated that the uncertainty in FINN emissions was likely a factor of 2, although more recent studies suggest at least a factor of 4 uncertainty exists between fire emission datasets (Hamilton et al 2018, Carter et al 2020, Pan et al 2020). Across most of the USA FINN version 1.6 emissions are up to a factor of 2.5 higher than version 1.5 (figure S1), which, although inside the uncertainty bounds between datasets (tables S1 and S2), is rather large.
Using unscaled fire emissions from FINN1.6 produces much-lower-than-observed AOD (figure S3) between May and September 2017. For the western US, we find the correction factor required for carbonaceous fire emissions in FINN1.6 to match measured AOD's is 3.5, which we use to correct both the POM and BC emissions (figure S3). Combined with the large difference between FINN1.6 and FINN1.5 (figure S1), this large underestimate in fire emissions is in-line with recent results from Carter et al (2020), which showed how FINN1.5 emissions results in low modelled western US aerosol concentrations and AOD compared to measurements. On the other hand, our simulations overestimate the observed surface concentrations (August and September) of carbonaceous aerosols. Multiplicative factors of 0.79 for BC and a factor of 0.35 for OC emissions were required to decrease FINN1.6 fire emissions to match the surface measurements. Fire emissions consistent with this scaling are within the unconstrained range for North America across existing fire emission datasets as given by Carter et al (2020) (tables S1 and S2).
Our inability to find a consistent scaling to match both the AOD and ground-based measurements of OC and BC for North America is consistent with studies for fires in tropical regions (Reddington et al 2016) and highlights the increasing need to improve understanding of fire emission properties, transport and the atmospheric vertical aerosol structure, interactions with radiation and other aerosols, and SOA formation pathways. In addition to errors in the model, discrepancies between model estimates and measurements are likely also due in part to the temporal and spatial mismatches between the point-source measured concentrations and coarser simulated grid cell concentrations. Indeed, the highest measured BC surface concentrations are higher than those simulated (figure S4), due in part to this representation error (Schutgens et al 2017) which is sensitive to small-scale dense aerosol plumes.
For the AOD comparison, western North American (30°–50° N, 100°–130° W) BC emissions were increased from 0.19 to 0.67 Tg a−1 and POM from 2.70 to 9.45 Tg a−1. The spatial correlation between modelled and observed AODs shows a good match (correlation: 0.83), however, the highest modelled AOD occurs in north California and western Oregon where there are no AERONET observations (figure S6). For the surface level concentration comparison, western North American BC emissions were reduced from 0.19 to 0.15 Tg a−1 and POM emissions were reduce from 2.70 to 0.95 Tg a−1. The spatial correlation between simulated and measured aerosol concentrations was not as high as for AOD, 0.28 for BC and 0.66 for OC. The simulations appear to capture the aerosol concentrations best along the West Coast, where aerosol burdens are highest. Yet, further inland, and within Idaho and Montana in particular, modelled concentrations are lower than observations (figure S7).
3.2. Fire impacts on the local meteorology of western North America
To understand the impact of North American fires on the meteorology and radiative budget, we consider differences between the simulation with fire aerosol and precursor gas emissions optimized to match AODs, and the simulation with no fire emissions from North America. During the first week of September 2017, there is a clear signal in the response of regional meteorology to changes in aerosol burden (figure 1). We therefore focus our discussion on this week where, as of 6 September 2017, 65 ongoing fires were occurring across the United States, according to the National Interagency Fire Center. During our study period simulated AOD is lower than observed, sometimes by a factor of 5, at the few measurement sites located within the fire plume (figure S6).
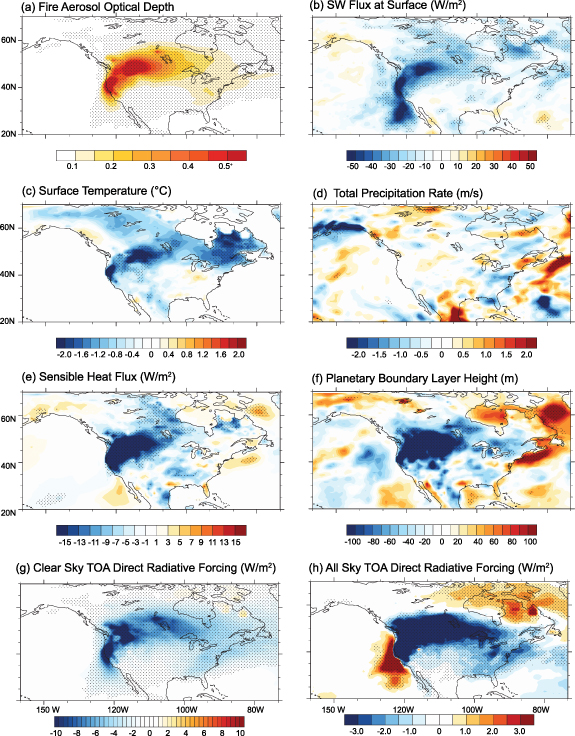
Figure 1. Fire signal in September (week 1) 2017. Average change (FIRE—NOFIRE simulation) shown for AOD (a), surface shortwave (SW) net flux (b), surface air temperature (c), total (convective + large scale) precipitation (d), sensible heat flux (e), planetary boundary layer height (f), and top of the atmosphere (TOA) direct radiative forcing (g) and (h) change. Stippled areas pass a t-test at the 95% confidence level. North American FINN1.6 carbonaceous emissions estimated to have an overall low bias of a factor of 3.5 when compared to AOD observations for summer 2017 (figure S3).
Download figure:
Standard image High-resolution imageThe aerosol carried within fire smoke plumes attenuate solar radiation fluxes to the surface and modeling suggests the increased optical depth of greater than 0.5 cools the surface temperatures by a couple of degrees Celsius relative to surface temperatures in the absence of fire aerosol (figures 1(a)–(c)). Changing precipitation patterns leading to drought are another major metrological cause of increasing fires across the western USA (Abatzoglou and Kolden 2013, Holden et al 2018). Despite the Western Seaboard experiencing a wet preceding winter, which broke California's longstanding drought, mild drought conditions returned to active fire regions during summer, including the examined 1st week of September 2017 (figure S9). However, our online modeling for this case did not result in a statistically significant change in local precipitation rates (figure 1(d)) or result in any fast feedbacks altering fire amounts as predicted in the CLM (figure S8).
To understand the importance of the relative impacts of each carbon species on energy balances and meteorology we compare the impacts in the sensitivity simulation, where the a priori BC and OC emissions are multiplied by factors of 7.9 and 2.6, respectively, and thus BC is scaled at a factor ∼3 times larger than OC to the bulk scaling shown in figure 1. For the examined first week of September, with a clear modelled fire signal, we find that differences between the sensitivity and baseline simulations for modelled surface shortwave and sensible heat fluxes, air temperature and precipitation rate, and planetary boundary layer (PBL) height are minimal (figure S10 compared to figure 1). In terms of contiguous US fires, western fires are dominated by forest burning and are more flaming in nature (producing more BC) compared to their eastern counterparts which are comprised heavily of prescribed agricultural burning and more smoldering in nature (producing more OC) (Reid et al 2005b). However, these results suggest that for short-term fire feedbacks it is perhaps more important to first constrain the overall magnitude of fire emissions than the ratio of emitted BC:OC due to differences in the fire regime itself.
Increased aerosol loadings attenuate solar radiation fluxes to the surface, lowering surface air temperatures. Reduced surface heating then increases atmospheric stability. Ultimately, such air temperature changes work to suppresses the growth of the PBL height (Yu 2002, Wang et al 2013, Li et al 2017). This chain of impacts can clearly be seen in figure 1 in response to the increased aerosol loading from fires, starting with the AOD increases and ending with PBL height reductions. Reductions in PBL height influence vertical aerosol profiles, acting to increase surface aerosol concentrations in regions with sufficient emissions, and are a critical consideration for surface PM2.5 (Emeis and Schäfer 2006, Su et al 2018, Wang et al 2019).
3.3. Fire impacts on mortality rates within western North America
Fires account for a significant fraction of summertime ambient PM2.5, with large fire years potentially contributing half-or-more (O'Dell et al 2019). As such, air quality improvements within the western US, particularly the Northwest, are hindered by increasing pollutants due to increasing fire activity. Results in section 3.2 suggest that fires are likely substantially reducing air quality (by increasing PM2.5 concentrations at the surface) due to the wildfire pollutant emissions increasing AOD and suppression of the PBL height. Here, we examine the health impact from the surface carbonaceous aerosol fire concentrations (August–October, inclusive) from 2017 using model results tuned to reproduce surface atmospheric concentration observations (see figure S7 for study period).
The total mortality in the western USA (30°–50° N, 100°–130° W) for 1 August to 31 October associated with short-term exposure to increased PM2.5 from wildfires, as calculated by the model/data synthesis, is 402 deaths (95% CI, 307–500) (figure 2). The cardiovascular disease and respiratory disease mortality are 92 deaths (95% CI, 50–134) and 65 deaths (95% CI, 40–90), respectively, for the same region and time period. Higher mortality grid cells are mostly centered on population centers and within the Northwest region, which has a high fire aerosol loading (as shown in figure S7). Our results are consistent with the range of premature mortalities from short-term exposures estimated by Fann et al (2018) using risk coefficients representing fire characteristics from 2008 to 2012 (1500–2500 excess mortalities for the contiguous United States population of 328 million), within the upper-bounds from 1997 to 2006 given by Johnston et al (2012) for episodic exposures within western America, and somewhat larger than the 240 acute mortalities in Canada during the 2017 fire season estimated by Matz et al (2020). The number of acute deaths calculated here is smaller than the total mortalities when including long-term exposure to fire related PM2.5 (e.g. 17 000 chronic mortalities across the USA; (Ford et al 2018)). For comparison the ∼400 excess deaths during the 2017 forest fire season in the Western U.S. from wildfires is similar to that found by Borchers Arriagada et al (2020) for acute exposure from the unprecedented modern fires in Australia from October 2019 to February 2020, where an estimated 417 deaths from short-term fire smoke exposure occurred.
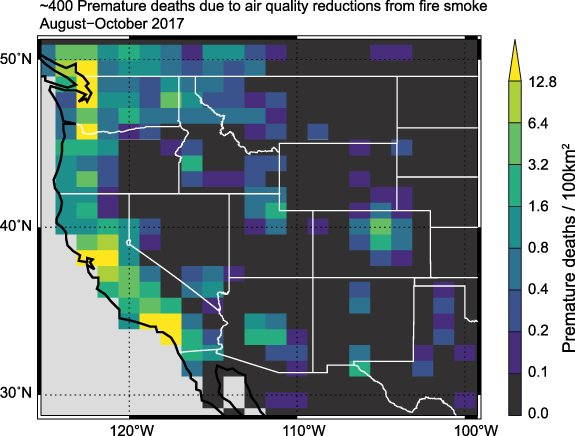
Figure 2. Premature acute deaths per 100 km2 due to short-term exposure to fire smoke inhalation across western US during the August to October fire season of 2017.
Download figure:
Standard image High-resolution imageOn the evening of 8 October 2017, 250 fires broke out across Northern California with 21 subsequently evolving into major fire outbreaks (http://calfire.ca.gov/communications/communications_StatewideFireSummary). It is estimated that over 245 000 acres burnt, displacing 100 000 people, and destroying 9000 buildings. The human cost from the fire itself was similarly high at a tragic loss of 43 lives. Fire plumes carried aerosol over 100 miles, and we estimate that the extra mortality due to short-term air quality reduction from all fires (including the northern Californian fires, which dominated during this period) from 8 to 29 October was 54. The indirect impacts of fire smoke on human lives are therefore likely to be at least equal to direct lives lost during this period, where California experienced the most devasting fires in recent history (Mass and Ovens 2019). Estimates from previous years suggest the associated health costs will run into the billions (Fann et al 2018).
4. Conclusions
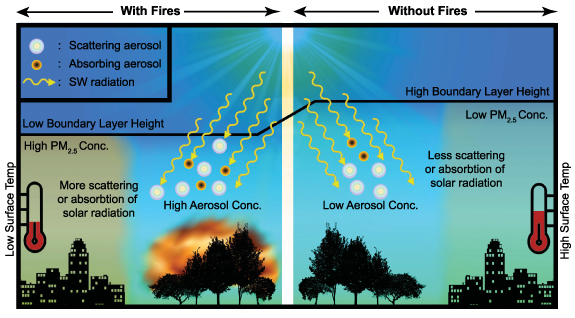
Increasing temperatures lengthen the duration of both the fire and growing seasons (Westerling 2006). In addition, warming reduces fuel moisture and thus increases fuel combustibility (Williams et al 2019). In combination, the likelihood of extreme fires taking hold and spreading across western North America is increasing (Stavros et al 2014, Goss et al 2020, Halofsky et al 2020). Given recent increases in fire frequency, magnitude, and severity in the western US, it is now critical that we further understand how fires impact local meteorology and air pollution levels, especially as end-of-century premature mortalities related to fire PM2.5 exposure could double as compared to present (Ford et al 2018). Primary and secondary aerosol particles from fires reduce the amount of incoming solar energy reaching the surface (figure 1(b)), initiating a cascade of impacts on the local meteorology and society (figure 3). Briefly, the air at the surface cools (figure 1(c)), a reduction in sensible heat flux occurs (figure 1(e)), and, finally the PBL height lowers over the land (figure 1(f)). However, we find no statistically significant changes in precipitation rates in direct response to fire plumes (figure 1(d)). We estimate that mortality rates from short-term exposure to PM2.5 aerosol in fire smoke are higher than the direct lives lost from severe fires, and across August–October 2017 just over 400 premature mortalities could have occurred. National policies influence how society and fire co-exist, and information such as presented here can help shape directives on how society in western Northern America should prepare for a future with more fire.
Figure 3. Schematic of the impact of fires on the aerosol burden, surface temperature, boundary layer height, and air quality (surface PM2.5 levels). PM2.5 defined as particulate matter with a diameter less than 2.5 µm.
Download figure:
Standard image High-resolution image
Acknowledgments
IMPROVE is a collaborative association of state, tribal, and federal agencies, and international partners. US Environmental Protection Agency is the primary funding source, with contracting and research support from the National Park Service. The Air Quality Group at the University of California, Davis is the central analytical laboratory, with ion analysis provided by Research Triangle Institute, and carbon analysis provided by Desert Research Institute. We would like to acknowledge the computational resources from Cheyenne provided by NCAR's Computational and Information Systems Laboratory, sponsored by the National Science Foundation (CISL, 2019). We would like to thank Jenny Hand for the insightful discussions on IMPROVE data and Louisa Emmons for assistance with producing emission datasets. This research has been supported by the National Science Foundation (Grant No. 1608775) and the Department of Energy (DE-SC0021302).
Data availability
The data that support the findings of this study are openly available at the following URL/DOI: https://doi.org/10.7298/4ttw-g030.