

Abstract
Soil water and root distribution following revegetation are key research topics in water-limited ecosystems. However, little is known about the interaction between soil water and root distribution in deep soils under different precipitation conditions. Knowledge of the root–soil water relationship of revegetated land and its response to precipitation is crucial for the management of water resources and ecological restoration worldwide, including on the Chinese Loess Plateau. In this study, we investigated soil water and root distribution under apple orchard and black locust down a 10 m soil profile and exposed to different amounts of annual precipitation on the Loess Plateau. The results showed that soil water content (SWC) under two typical planted forests both significantly decreased as the mean annual precipitation (MAP) decreased. SWC spatial variation is demarcated by a 500–550 mm precipitation threshold, being relatively high when MAP > 550 mm but extremely low when MAP < 500 mm. In apple orchards, the depth above which 50% of the roots were present increased with increasing precipitation, but in black locust it became shallower. The results of a linear mixed model revealed a significant relationship between fine root length density and SWC depletion degree for black locust irrespective of the amount of precipitation, but it was only found in the 200–1000 cm soil layers with MAP > 550 mm and the 0–200 cm soil layers with MAP < 550 mm for apple orchards. The MAP × depth interaction was significant with respect to SWC depletion degree for MAP > 550 mm, but not for MAP < 550 mm in both vegetation types. These findings add to our current understanding of the root–soil water relationship of species used for revegetation and highlight the need to assess the long-term effect of revegetation on soil water consumption in water-limited ecosystems.
Export citation and abstract BibTeX RIS

Original content from this work may be used under the terms of the Creative Commons Attribution 4.0 license. Any further distribution of this work must maintain attribution to the author(s) and the title of the work, journal citation and DOI.
1. Introduction
Revegetation is one important and effective means to improve the ecological environment in areas with degraded land (Gao et al 2018). It has numerous benefits in terms of hydrology and ecosystem services, e.g. reducing soil erosion and controlling water loss (Fu et al 2011), enhancing soil quality (Deng et al 2014, 2017) and biodiversity conservation (Elbakidze et al 2011). However, in arid and semi-arid areas, soil water is the primary source of water used by vegetation (Moeslund et al 2013) and continuously consumed as vegetation grows. Thus, a lack of water becomes the main constraint for vegetation restoration (Gao et al 2013, Zhao et al 2014). Appropriate use of limited soil water resources to achieve the sustainable and healthy development of restored ecosystems has, therefore, become a major issue in the ecological reconstruction of degraded areas.
Roots are the primary organs that plants use to obtain water and nutrients, thus controlling terrestrial productivity (Wang et al 2019). The ecological benefits that afforestation brings, e.g. carbon sequestration (Deng et al 2019) and soil and water conservation (Fu et al 2011), are largely mediated by plant roots through the process of water uptake (Li et al 2019a). Root dynamics are driven by exogenous factors such as soil water content (SWC) (Chairungsee et al 2013) and endogenous factors such as hormone production (McAdam et al 2016) and photosynthate and nutrient allocation within the plant (Sloan et al 2016). Precipitation is another key factor that not only constrains aboveground plant productivity but also dictates belowground plant photosynthate allocation in terrestrial ecosystems (Poorter et al 2012, Luo et al 2013). Changes in the amount of precipitation can have a great impact on root response (Wang et al 2019). Trees have the ability to access huge volumes of soil and roots can be found at great depths in xeric environments (Schenk and Jackson 2002). In water-limited ecosystems, despite their scarcity, deep roots can make significant contributions to plant water uptake and this is very important for vegetation to survive drought and maintain normal physiological activities. It has been argued that in pronounced seasonal arid climates, deep roots favor hydraulic lift (also termed hydraulic redistribution), altering soil water distribution and affecting water uptake (Jackson et al 2000). Furthermore, in a wider perspective, the impact of deep roots on hydrological cycles could indirectly influence regional climates (Maeght et al 2013). Thus, the present-day surface climate cannot be simulated adequately without considering deep root water uptake (Kleidon and Heimann 2000). In summary, there is diverse, yet consistent evidence that deep tree roots play a major role in plant water uptake, soil water availability and the water cycle at various scales from the rhizosphere to whole catchments (Bengough 2012). Thus, there is an urgent need to study deep root distribution down the soil profile and examine its relationship to soil water in more detail to further elucidate the water uptake process and its impact on eco-hydrological processes in water-limited ecosystems.
Numerous experiments have specifically manipulated precipitation or irrigation in the field (Ma et al 2018, Wang et al 2019), allowing direct determination of the effects of soil water change on root distribution. Comprehensive analyses based on these water manipulation experiments reveal a correlation between root growth and water content under different soil water conditions. Gaul et al (2008) reported that Norway spruce without through fall have a higher fine root production than the control plots during the drought period. In addition, limited irrigation may stimulate crop roots to grow into deeper soil layers compared with irrigation that fulfills all the plants' needs (Xu et al 2016). However, existing knowledge concerning the relationship between soil water and root distribution is mainly limited to shallow soil layers. In fact, fine roots in deep and shallow soil layers often exhibit a clear difference in growth (Germon et al 2020): the growth of shallow fine roots is synchronized with rainfall events, while deep fine roots continue growth over the dry season (Maeght et al 2013, Lambais et al 2017) and could improve tree tolerance to drought (Nardini et al 2016). It is worth noting that the few reports on the relationship between soil water and root distribution deep in the soil profile were mostly conducted under specific precipitation conditions (Yang et al 2012a, Wang et al 2015b, Zhang et al 2019), thus ignoring the great influence of precipitation variation. In water-limited ecosystems, replenishment of soil water from the limited precipitation is insufficient, often resulting in the formation of a well-developed deep root system in forests, leading to continuous consumption of deep soil water which can cause soil desiccation and eventually damage to the soil structure that is difficult to repair (Wang and Liu 2013, Jian et al 2015, Jia et al 2017). The Loess Plateau is both the largest area and deepest loess deposit in the world; drought and water shortages are serious and the unique physiographic conditions lead to the formation of deep root systems in plants. Since the implementation of the 'Grain-for-Green' Project, many introduced ecological plantations (black locust) and economic plantations (apple trees) have been cultivated across the Loess Plateau (Yang et al 2020). Of these, black locust has often been grown under natural conditions, and covers more than 70000 ha (Cao and Chen 2017). It has become the most important introduced tree species for afforestation on the Loess Plateau, on account of its high growth rate and effectiveness in improving soil nutrient conditions (Shangguan 2009, Qin et al 2016). Apple orchards have huge economic benefits and are often subjected to human management (e.g. fertilization). Across the Loess Plateau, they cover 1.31 million ha, accounting for 25.2% of the global area, making the Plateau the largest area of intensive apple cultivation in the world (Wang et al 2020). The coexistence of ecological plantations and apple orchards has become an important landscape feature of the Loess Plateau (Yang et al 2020). However, both black locust and apple trees exhibit strong transpiration, and water consumption depth can reach as much as 10 m (Gao et al 2018, Zhang et al 2019); thus, large-scale plantations can certainly change the water balance. At present, revegetation on China's Loess Plateau is approaching sustainable water resource limits (Feng et al 2016). Investigating the relationship between root distribution and soil water in typical revegetated areas with different amounts of precipitation may be of major significance for our understanding of the effects of planting schemes on regional groundwater recharge and the water cycle. Nevertheless, the relationships between root distribution and soil water under the two species, and whether differences persist across ecosystems remain unclear.
To address this, we observed soil water and root distribution of apple trees and black locust in areas receiving different amounts of precipitation on the Loess Plateau. We had two specific objectives. First, to compare the difference in SWC and root distribution between apple orchard and black locust under different precipitation conditions. Second, to elucidate the relationships between root distribution and soil water under the two species and determine any differences.
2. Materials and methods
2.1. The study area and experimental sites
The study was conducted on the Chinese Loess Plateau (33°43'–41°16' N, 100°54'–114°33' E), which lies at an elevation of 200–3000 m above mean sea level (figure 1). The plateau is located in the continental monsoon climate region, and mean annual precipitation (MAP) ranges from 800 mm in the southeastern region to 150 mm in the northwest region. Across the same area, the mean annual temperature ranges from 14.33 °C to 4.3 °C. The Plateau's surface is covered by a thick and highly erodible loess layer, >100 m thick on average, soil texture is relatively uniform (Li and Shao 2006). The vegetation types, from the southeastern to the northwestern region, range from broadleaved deciduous forest to forest steppe, typical steppe, desert steppe and ultimately desert (Feng et al 2012, Jia et al 2017).
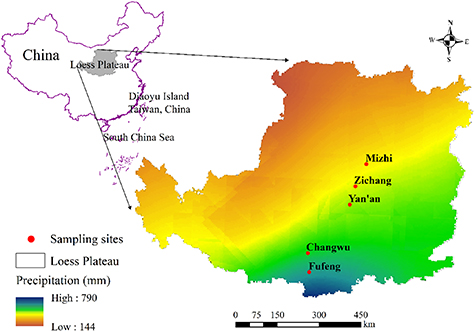
Figure 1. Locations of sampling sites on the Loess Plateau of China.
Download figure:
Standard image High-resolution imageFive representative sites were selected for sample collection along the precipitation gradient of the Plateau, where MAP and precipitation in 2019 were showed in figure S1 (available online at stacks.iop.org/ERL/16/064054/mmedia) (The data comes from China meteorological data service center), and all the apple (Malus pumila Mill.) orchards and black locust (Robinia pseudoacacia L.) were planted about 15 years ago (figure 1). Correspondingly, arable land (Maize) near the sampling sites was chosen for the control plots, which were all rain-fed and the planting time is more than 20 years. The data gathered from the stands are valid for our comparative purposes, because all sampling sites have similar slopes, aspects and soil texture, and have been subjected to the same management regimes (i.e. clean cultivation, no irrigation, with standard pruning and fertilization treatments for apple orchards; no human disturbance for black locust). At each site, we collected general information for the sample plot (table 1). Three quadrats (10 m × 10 m) were chosen in each selected sample plot at each site. In each quadrat, the species of understory vegetation were recorded (table S1); and the height and diameter at breast height of apple trees and black locust were measured with a hypsometer and caliper, respectively. In addition, locations of the stands were recorded with a portable GPS receiver (South GNSS, China). The stand age was determined using the tree-ring method and a Pressler increment borer (Haglof, Sweden), plus local residents were questioned. General information about the sampling sites is presented in table 1.
Table 1. General information about the sampling sites for each vegetation type at each of the five study sites. DBH is diameter at breast height.
| location | MAP(mm) | Vegetation type | Longitude | Latitude | Altitude (m) | Slope position | Stand age(a) | Height (m) | DBH (cm) | Plant density |
|---|---|---|---|---|---|---|---|---|---|---|
| Fufeng | 606 | Apple orchard | 107°53'11'' | 34°31'3'' | 761.2 | — | 13 | 3.2 | 13 | 15 |
| Black locust | 107°53'54'' | 34°32'20'' | 860 | Middle | 15 | 13.2 | 12.7 | 24 | ||
| Arable land | 107°53'12'' | 34°31'1'' | 760 | — | — | — | — | — | ||
| Changwu | 575 | Apple orchard | 107°41'46'' | 35°12'43'' | 1075 | — | 16 | 4.7 | 16.9 | 14 |
| Black locust | 107°41'30'' | 35°13'3'' | 1053.6 | Middle | 15 | 11.3 | 12.7 | 27 | ||
| Arable land | 107°47'36'' | 35°14'8'' | 1195 | — | — | — | — | — | ||
| Yan'an | 530 | Apple orchard | 109°20'38'' | 36°41'53'' | 1262.7 | — | 15 | 3.4 | 17.6 | 12 |
| Black locust | 109°22'55'' | 36°40'2'' | 1269 | Middle | 15 | 13.5 | 13.2 | 25 | ||
| Arable land | 109°22'36'' | 36°39'48'' | 1227.8 | — | — | — | — | — | ||
| Zichang | 480 | Apple orchard | 109°33'14'' | 37°16'1'' | 1314 | — | 13 | 3.8 | 16 | 12 |
| Black locust | 109°19'29'' | 37°11'55'' | 1354 | Middle | 14 | 10.9 | 15.2 | 21 | ||
| Arable land | 109°33'53'' | 37°17'4'' | 1306.5 | — | — | — | — | — | ||
| Mizhi | 422 | Apple orchard | 110°11'10'' | 37°52'19'' | 1008 | _ | 15 | 4 | 16.4 | 12 |
| Black locust | 110°13'26'' | 37°40'23'' | 968.8 | Middle | 15 | 8.3 | 14.2 | 20 | ||
| Arable land | 110°11'21'' | 37°51'31'' | 1065.5 | — | — | — | — | — |
2.2. Data collection
2.2.1. Fine root collection
Soil samples of the 0–1000 cm soil profiles under each selected vegetation type were measured from 16 September to 30 September 2019, during the growing season. The specific precipitation input during sampling period was showed in figure S2. Soil samples were collected using a hand auger with a 60 mm internal diameter, and three representative trees were randomly chosen for sampling in each vegetation type. The samples were collected to a depth of 1000 cm in 20 cm increments. The samples with roots were placed in a sieve (0.2 mm, 25 cm diameter, 7.5 cm height) and then washed carefully with tap water to remove all the soil. The roots retained in the sieve were picked out with tweezers and dead roots were removed. Dead roots were identified based on color (dead roots are dark) and mechanics (dead roots are not elastic) and discarded, although this is somewhat subjective (Ling et al 2019). The retained living roots were scanned using a scanner at 300 dpi, and then the fine root length (FRL), fine root surface area (FRSA) and fine root volume (FRV) were determined using WinRhizo software (version 5.0 Regent Instruments Inc., Quebec, Canada) based on the images showing fine roots.
After the roots were scanned, the fine (⩽2 mm diameter) and coarse (>2 mm diameter) roots were separated on the basis of measurements taken with a caliper (with a resolution of 0.01 mm). The fine roots were oven-dried at 60 °C for 72 h and then weighed to determine fine root dry weight (FRDW). The FRL density (FRLD, cm cm−3) and specific root length for the fine roots (FSRL, cm g−1) were calculated as follows:


where FRL is the fine root length (cm); and FRDW is fine root dry weight (g).
2.2.2. Soil sampling
The collection of soil sample in the 0–1000 cm soil profiles was conducted simultaneously in the same drill hole with root samples. Each soil sample was divided into two parts. One of which was used to obtain the soil texture which determined by laser diffraction using a Mastersizer 3000 (Malvern Instruments, Malvern, England). The soil texture under different vegetation was shown in figure S3 and the other soil samples were oven-dried at 105 °C to constant weight. The gravimetric SWC of samples was calculated as the proportion of mass lost during oven-drying to constant weight. The wilting point and field capacity of three vegetation was showed in table S2.
The soil water depletion degree (SWCD) was calculated as follows:
where SWCli is the gravimetric SWC of arable land for the 0–i cm soil profile (%) and SWCpi is the gravimetric SWC of apple orchard or black locust plantations for the 0–i cm soil profile (%).
2.3. Statistics
The effect of MAP, FRLD and depth on SWCD and their interaction were analyzed using a linear mixed model (LMM), random intercept model. In these models, MAP, FRLD, depth and their interaction were treated as fixed effects and plant individual as the random effect. Similarly, we used the LMM, random intercept model to analyze the effect of MAP, SWCD and depth on FRLD, where MAP, SWCD and depth and their interaction were treated as fixed effects. According to the characteristics of soil water change (the variation of SWC usually take place in the top 200 cm (Zhang et al 2014, Hou et al 2019)), we divided the soil profile (0–1000 cm) into shallow (0–200 cm) and deep (200–1000 cm) soil layers to examine the relationship between soil water and root change with soil depth in R. The least significant different test was employed to perform post-hoc analysis in SPSS 23 and p < 0.05 was considered to indicate statistical significance.
3. Results
3.1. Soil moisture profile characteristics and their variation along the precipitation gradient at the regional scale
With variations in MAP and soil depth, the SWC under different vegetation types showed similar trends (figures 2 and 3). The mean SWC values under the three vegetation types all decreased significantly as the precipitation decreased (p< 0.05) (figure 3). For example, in the case of black locust and apple orchard, mean SWC gradually declined from 13.51% and 15.58% (MAP > 550 mm) to 4.18% and 7.94% (MAP ranging from 400 to 450 mm), respectively (figure 3). Under the same precipitation conditions, the mean SWC of the three vegetation types in relation to depth differed significantly (p< 0.05), with the exception of black locust and apple orchard with MAP = 606 mm, and was ranked: arable land > apple orchard > black locust (figure 3). In addition, the soil profile could be partitioned into an active layer (0–200 cm) and a relatively stable layer (200–1000 cm) based on the SWC distribution pattern down the profile (figure 2). SWC showed marked fluctuations at depths of 0–200 cm, whilst the SWC in the 200–1000 cm soil profile was relatively stable (figure 2).

Figure 2. Vertical distribution of soil water content (SWC) along the precipitation gradient under different vegetation types (apple orchard, black locust and arable land). The error bars indicate standard errors of the means (N = 3).
Download figure:
Standard image High-resolution image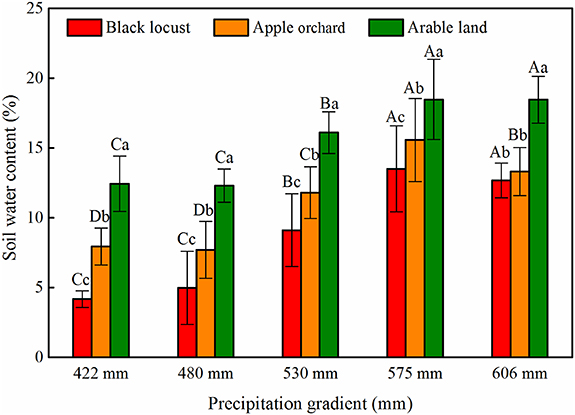
Figure 3. Mean soil water content (SWC) along the precipitation gradient under different vegetation types (black locust, apple orchard and arable land). The error bars indicate standard errors of the means (N = 3). The different lowercase letters indicate significant differences between different vegetation types under the same precipitation conditions at the 0.05 level; and the different capital letters indicate significant differences between different amounts of precipitation for the same vegetation type at the 0.05 level.
Download figure:
Standard image High-resolution imageOverall, the SWC profile under both black locust and apple exhibited an obvious change with decreasing precipitation (figure 4). Compared with the arable land, the SWC of the apple orchard was lower when MAP > 550 mm, although the difference between the different precipitation amounts was relatively small (figure 4(A)). When MAP < 500 mm, the SWC revealed marked water consumption in the soil profiles, especially in the soil layers below 150 cm, and obvious desiccation (SWC < 8%) occurred at a depth of 150–600 cm (figure 4(A)). Similar to the SWCD under apple orchards, limited water consumption under black locust was observed with MAP > 550 mm and severe soil desiccation occurred with MAP < 500 mm (figure 4(B)). The SWC at 100–150 cm showed the largest change, from 12.88% to 66.37%, and the SWC at 150–1000 cm decreased by more than 50% (figure 4(B)).
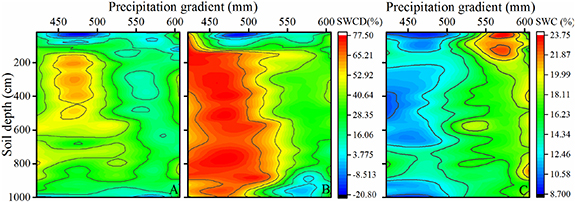
Figure 4. Vertical distribution and spatial dynamics of SWCD under apple (A) and black locust (B) and SWC under arable land (C).
Download figure:
Standard image High-resolution image3.2. Root length density and cumulative root length along the precipitation gradient at the regional scale
The vertical distribution of FRLD in apple orchards and under black locust showed distinct patterns (figure 5). The FRLD in the five apple orchards exhibited a similar vertical distribution: the maximum FRLD was at a depth of 0–100 cm, and then there was a gradual decrease down the profile, followed by an increase with greater depth. The soil depth at which the FRLD was at its maximum increased progressively from 20 cm to 80 cm depth as MAP decreased. In addition, the ratio of roots in 0–200 cm soil layers to it in the whole profile was gradually decreased as MAP increased (table S4). In contrast, the FRLD under black locust showed an exponential decline with depth in the upper 200 cm, but below 200 cm, it exhibited a relatively uniform vertical distribution in each of the five forests. The soil depth at which the FRLD reached its maximum under black locust was always 20 cm, with the exception of MAP = 480 mm when it occurred at 40 cm.
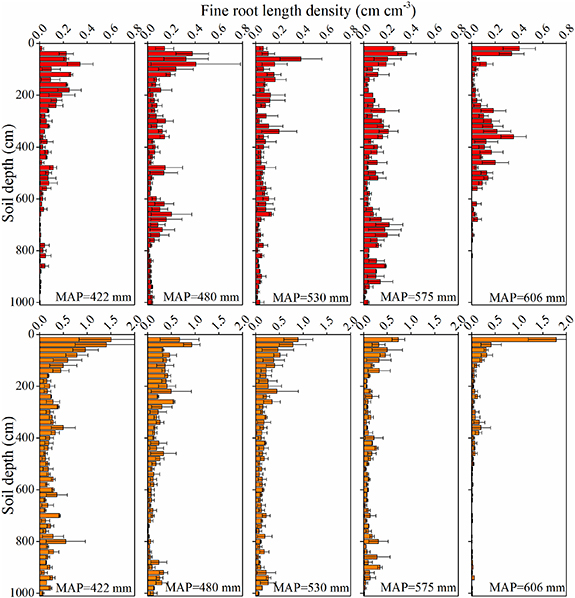
Figure 5. Vertical distribution of fine root length density (FRLD) in apple orchards (top) and black locust (bottom) under different precipitation levels. The error bars represent the standard deviation (n = 3).
Download figure:
Standard image High-resolution imageThe cumulative FRLD is shown in figure 6. The D50 (the depth above which 50% of the roots) increased with increasing precipitation in apple orchards (located at depths of 180 cm, 300 cm, 340 cm, 400 cm, 340 cm, respectively), but the opposite was the case under black locust (located at depths of 300 cm, 255 cm, 250 cm, 360 cm, 70 cm, respectively). The maximum total FRLD in apple orchards and under black locust occurred in areas where MAP = 575 mm and MAP = 422 mm, and the values were 5.49 cm cm−3 and 15.99 cm cm−3, respectively (figure S4). In addition, correlations between total FRLD and MAP were also assessed (figure S4). The results indicated that the total FRLD of black locust was strongly negatively related to MAP (R2 = 0.952, p < 0.01), but there was no clear correlation in apple orchards.

Figure 6. Cumulative fine root length density (FRLD) in apple orchards (A) and black locust (B) under different precipitation gradient. D50 and D95 represent the soil depth reached by 50% and 95% of the roots, respectively. Dotted arrows indicate the D50 and D95 thresholds for the specific proportions of roots in apple orchards (A) and under black locust (B) subjected to different amounts of precipitation.
Download figure:
Standard image High-resolution image3.3. The relationship between root–soil water under the two revegetation types
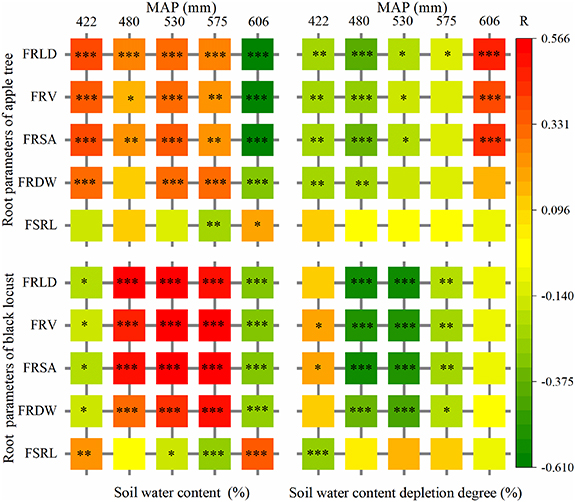
The correlation between root parameters and soil water throughout the profile was different for the two species with different amounts of precipitation (figure 7). There was a similar correlation between FRLD, FRV, FRSA and SWC/SWCD for the two species, reaching a 1% significance level under most precipitation conditions. FRLD exhibited the highest and FSRL the lowest correlation with SWC/SWCD. Therefore, we selected FRLD to analyze the root–soil water relationship using a LMM approach (tables 2 and 3). A significant relationship (p < 0.05) was observed between FRLD and SWCD for black locust with MAP > 550 mm or MAP < 550 mm, but it only existed in the 200–1000 cm soil layers with MAP >550 mm and the 0–200 cm soil layers with MAP < 550 mm for apple orchards. MAP had a significant impact on SWCD and FRLD in the 200–1000 cm soil layers under both vegetation types (p < 0.05).
Figure 7. The correlation between root system parameters and soil water under apple orchard (top) and black locust (bottom) with different amounts of precipitation. (*, p < 0.05; **, p < 0.01; ***, p < 0.001).
Download figure:
Standard image High-resolution image
Table 2. Summary of the linear mixed model for SWCD under the two vegetation types and different precipitation conditions. (NS, no significant; *, p < 0.05; **, p < 0.01; ***, p < 0.001).
| Apple orchard | Black locust | |||||||
|---|---|---|---|---|---|---|---|---|
| MAP > 550 mm | MAP < 550 mm | MAP > 550 mm | MAP < 550 mm | |||||
| p | 0–200 cm | 200–1000 cm | 0–200 cm | 200–1000 cm | 0–200 cm | 200–1000 cm | 0–200 cm | 200–1000 cm |
| Intercept | <0.0001*** | <0.0001*** | <0.0001*** | <0.0001*** | <0.0001*** | <0.0001*** | <0.0001*** | <0.0001*** |
| MAP | 0.0005*** | <0.0001*** | NS | 0.0024** | 0.0036** | 0.0001*** | <0.0001*** | <0.0001*** |
| Depth | 0.0065** | NS | 0.0227* | 0.0002*** | <0.0001*** | <0.0001*** | <0.0001*** | 0.0147* |
| FRLD | NS | <0.0001*** | 0.0113* | NS | 0.0023** | 0.0022** | 0.0325* | <0.0001*** |
| MAP × depth | <0.0001*** | <0.0001*** | NS | NS | <0.0001*** | <0.0001*** | 0.0066** | NS |
| MAP × FRLD | 0.0438* | NS | NS | NS | NS | 0.0001*** | NS | NS |
| Depth × FRLD | NS | NS | NS | 0.0021** | 0.0012** | <0.0001*** | NS | 0.0052** |
Full model: lme (SWCD ∼ MAP + depth + FRLD + MAP: depth + MAP: FRLD + depth: FRLD, random = ∼1|plant, method = 'ML').
Table 3. Summary of the linear mixed model for FRLD under two vegetation types and different precipitation conditions. (NS, no significant; *, p < 0.05; **, p < 0.01; ***, p < 0.001).
| Apple orchard | Black locust | |||||||
|---|---|---|---|---|---|---|---|---|
| MAP > 550 mm | MAP < 550 mm | MAP > 550 mm | MAP < 550 mm | |||||
| p | 0–200 cm | 200–1000 cm | 0–200 cm | 200–1000 cm | 0–200 cm | 200–1000 cm | 0–200 cm | 200–1000 cm |
| Intercept | <0.0001*** | <0.0001*** | <0.0001*** | <0.0001*** | <0.0001*** | <0.0001*** | <0.0001*** | <0.0001*** |
| MAP | 0.0498* | <0.0001*** | NS | <0.0001*** | 0.0075** | <0.0001*** | 0.0107* | <0.0001*** |
| Depth | <0.0001*** | <0.0001*** | NS | <0.0001*** | <0.0001*** | <0.0001*** | <0.0001*** | <0.0001*** |
| FRLD | NS | <0.0001*** | 0.0147* | NS | 0.0347* | 0.0067** | 0.0236* | <0.0001*** |
| MAP × depth | NS | <0.0001*** | NS | <.0001*** | NS | <.0001*** | NS | NS |
| MAP × SWCD | 0.0105* | NS | NS | NS | NS | NS | NS | NS |
| Depth × SWCD | NS | NS | NS | NS | NS | 0.0054** | NS | NS |
Full model: lme (FRLD ∼ MAP + depth + SWCD + MAP: depth + MAP: SWCD + depth× SWCD, random = ∼ 1|plant, method = 'ML').
4. Discussion
4.1. Soil moisture variations under different species along the precipitation gradient
In water-limited ecosystem, soil water is the main water source for plant growth, which plays a critical role in soil–plant–atmosphere interactions (Huang and Shao 2019). Plants, as an important driving factor in SPAC, could influence the ecosystem water balances in a variety ways, such as root water uptake (Jian et al 2015). In the Loess Plateau, the expansion of artificial forest have resulted in a large amount of soil water consumption, especially from the deep soil layers (Nan et al 2019), this certainly will influence regional eco-hydrological process.
In this study, a comparison of the SWC of planted forest and arable land under different precipitation conditions revealed that SWC decreases significantly with decreasing precipitation (p < 0.05) (figures 2 and 3), as found in previous researches (Liang et al 2018, Zhang et al 2020). It is worth noting that the SWC varied sharply at the 500–550 mm precipitation level, with a relatively high level when the MAP > 550 mm, but an extremely low level when the MAP < 500 mm (figure 4). This is consistent with several previous studies, showing that annual precipitation has an impact on SWC variation at the regional scale and SWC under planted forest changes at the 500–550 mm precipitation threshold (Wang et al 2016, Liang et al 2018). However, previous studies have demonstrated that land use has a greater impact on SWC at the catchment scale (Huang et al 2012, Wang et al 2013). The SWC under the three vegetation types examined decreased in the order arable land > apple orchard > black locust whether in semiarid or semihumid areas (figure 3). While the vertical distribution of SWC was significantly influenced by plant species and physiological characteristics (e.g. transpiration, root distribution and so on) (Yang et al 2012b), especially in the deep soil layers. Compared to arable land, both apple orchards and black locust consumed large amounts of soil water to maintain their growth. They obtain soil water from the deeper layers when the upper soil water is unable to meet their demands. Prolonged excessive consumption of deep soil water causes soil drying, eventually resulting in the formation of permanent dry layers (Jian et al 2015, Duan et al 2016). SWC in apple orchards and under black locust was extremely low with MAP < 500 mm, and severe deep soil desiccation occurred, especially under black locust, where mean SWC was only 4% in deep (200–1000 cm) soil layers and the SWC depletion degree exceeded 60% (figure 4).
4.2. Root distribution variation under different species along the precipitation gradient
Root distribution characteristics and rooting depth can differ greatly between vegetation types. In general, most crops are annual shallow-rooted plants with an average rooting depth of 103 cm on the Loess Plateau (table S3), whereas trees usually have more developed and deeper root systems (Schenk and Jackson 2002). Big data analytics have suggested that the global mean rooting depth of trees is 7.0 m (Canadell et al 1996). Numerous studies had demonstrated that deep roots can improve tree tolerance to drought (Nardini et al 2016, Zhang et al 2019) and lead to storage of C in deep soil layers (Balesdent et al 2018). More knowledge about the distribution of roots in the deep profile is pivotal to understand nutrient and water uptake patterns of trees and biogeochemical process (Warren et al 2015, Pierret et al 2016).
Much of the Loess Plateau is water-limited, and the average thickness of the loess is over 50 m. This unique physiographic condition results in the development of deep plant root systems. The roots of many planted species (e.g. apple trees, black locust) on the plateau can reach depths of 10 m (Wang et al 2015a, Zhang et al 2017, Gao et al 2018). Of these, the apple trees have the deepest recorded root system, reaching a depth of 23.2 m (Zhang et al 2019). Deep root systems connect deep soil/groundwater to the atmosphere, thus influencing the hydrological cycle and climate (Fan et al 2017). A deeper rooting depth means that more water is available in the soil for the plant, which is critical to plant survival when water is limited (Zhang et al 2020). In addition, the deep root systems of plants can help them resist drought stress during drought events (Zhang et al 2019, Song et al 2020), thus enhancing plant survival. In this study, apple trees growing in the area with 606 mm of precipitation had the shallowest rooting profile with 95% of roots in the top 610 cm of soil and a maximum rooting depth of 840 cm (figures 5 and 6). However, the rooting depth of the studied apple trees and black locust all reached a depth of 10 m under different precipitation levels (figure 5). This could be due to available water in soil decreasing as MAP reduces, with limited water storage not satisfying plant transpiration demands, thus stimulating the trees to extract more water from the deeper soil. In fact, deep soil water on the Loess Plateau is a limited resource: once depleted, it is hard to recharge (Shao et al 2015). Therefore, the deep soil water can be absorbed only once during the growth period of apple trees and black locust. The one-way nature of this water exploitation means that trees develop progressively deeper roots to extract more deep soil water, resulting in a larger deep soil water deficits in the semiarid area (Zhang et al 2019). The deep SWCD with MAP < 500 mm was significantly higher than with MAP > 550 mm (figure 4). Note that nearly half of fine roots of black locust, when grown in either semhumid or semiarid areas, were concentrated in the upper 200 cm soil layer (figure 6). This could be because, in water-limited ecosystems, plants need to be rapidly responsive to soil water availability and precipitation changes (Wang et al 2019). Furthermore, the soil depth at which FRLD was at its maximum under the two species was, in both cases, in the upper 100 cm soil layer, although the pattern of maximum FRLD depth variation with precipitation differed between the two (figure 5). This could be related to the unique physiological structure or water demand characteristics of the two species, which further indicates that root distribution depends on soil water and precipitation distribution.
4.3. Comparison of the root–soil water relationship between the two species along the precipitation gradient
Understanding the spatial variability and relationship between soil water and fine roots in the deep profile helps to improve our understanding of biogeochemical processes (Cheng et al 2009, Germon et al 2020) and accurately model eco-hydrological process in the ecosystem. The SWC and FRLD of the two species exhibited significant vertical distribution and spatial patterns (figures 2, 4 and 5, tables 2 and 3), and they were intimately associated with soil depth and precipitation recharge, which differed between regions. Thus, the relationship between SWCD and FRLD is clearly affected by soil depth and precipitation.
Our results revealed a significant (p < 0.01) relationship between FRLD and SWCD in the 200–1000 cm soil layers of apple orchards with MAP > 550 mm, but not in the 0–200 cm soil layers. This can be partly attributed to the relatively high SWC supplied by precipitation in the 0–200 cm soil layers in the semihumid area. In contrast, there was a significant (p < 0.05) relationship between FRLD and SWCD in the 0–200 cm soil layers of apple orchard with MAP < 550 mm, but not in the 200–1000 cm soil layers. This could be affected by human activities (e.g. fertilization) which resulted in a change in the root distribution down the soil profile (Xia et al 2013, Jha et al 2017) thus affecting the root–soil water relationship. It may also be the result of photosynthate and nutrient allocations within the plant (Sloan et al 2016). This also reflects the ability of apple to adapt to local drought conditions. A significant (p < 0.05) relationship between FRLD and SWCD was observed for black locust down the whole profile for both MAP > 550 mm and MAP < 550 mm, the level of significance was higher in the 200–1000 cm soil layers than the 0–200 cm soil layers. This is probably because there are hardly any human activities affecting black locust; all physiological activities (e.g. root water uptake and transpiration) were carried out under natural conditions and were the result of the plant adapting to different water environments. Moreover, there is a great deal of undergrowth beneath black locust, and this consumes a large amount of soil water and weakens the FRLD and SWCD relationship in the 0–200 cm layers.
Soil depth generally has a significant influence on both FRLD and SWCD under the two species, except for exceptional soil layers in apple orchards. This is because the root system gets gradually deeper as the stand gets older (Wang et al 2015b, Zhang et al 2019) and it preferentially obtains soil water from the upper soil layers (when available) to reduce energy costs (Schenk 2008). It is worth noting that the MAP × depth interaction in the two vegetation types was significant with respect to SWCD for MAP > 550 mm, but not for MAP < 550 mm. This may be closely related to the well-developed root system in the 0–200 cm soil layers of the two species in semi-arid areas. The well-developed root system in shallow soil layers could effectively intercept rainfall infiltration (Li et al 2018); meanwhile, they also developed deeper root systems to seek out available soil water at greater depths, which would inevitably cause soil drying leading to a modification of the regional eco-hydrological cycle process. In fact, permanent dried soil layers have formed in the deep soil layers under both species, particularly black locust, when MAP < 550 mm (figure 4), leading to serious negative impacts on groundwater recharge. The studies of Liang et al (2018) and Nan et al (2019) also demonstrate this. Thus, it is important to consider the root distribution down the soil profile of different plant species and their long-term effect on soil water consumption in order to establish a sustainable ecosystem in water-limited area. Any land management scheme should be carefully monitored for signs of deleterious effects (Cheng et al 2009). In addition, the root data that we analyzed in this study pertains to roots of diameter < 2 mm, which is the most commonly used definition of fine roots. In fact, the different orders of root may respond differently to soil water; the higher order roots may have limited capacity to acquire water and nutrients even if their diameters are less than 2 mm (McCormack et al 2015). Thus, it is essential to distinguish different orders of roots in future studies, to better understand the root-water relationship.
5. Conclusion
In this study, we investigated soil water, root distribution characteristics of two typical planted forests and their interaction along a precipitation gradient. The SWCD in two typical planted forests significantly increased as the precipitation decreased, especially in deep soil layers under MAP < 550 mm where severe soil desiccation occurred. The two vegetation types have both developed deep root systems, and FRLD exhibited the best correlation with SWC/SWCD among all root parameters down the whole profile. A significant relationship between FRLD and SWCD was observed down the whole profile for black locust irrespective of rainfall, while it was only found in partial soil layers in apple orchards. In addition, the significant effect of MAP × depth interaction on SWCD was depended on MAP, which only observed with MAP > 550 mm, but not MAP < 550 mm. In a water-limited ecosystem, the excessive interception of precipitation infiltration by roots will modify groundwater recharge and then affect regional water balance (Li et al 2018, 2019b). Thus, it is important to consider the root distribution down the soil profile for different plant species and their long-term effect on soil water consumption, especially in deep soil layers, in order to establish sustainable ecosystems in water-limited areas.
Acknowledgments
The authors thank Li Zhang, Pan Hu, Dagang Guo and Qi Hu for their help with sample handling. This work was jointly supported by the National Key Research and Development Program (Grant No. 2016YFC0400204), the National Natural Science Foundation of China (Grant Nos. 41571506, 41771316 and 51579212), the Integrative Science-Technology Innovation Engineering Project of Shaanxi (Grant No. 2016KTZDNY-01-03), and the Young-Talent A&F University.
Data availability statement
The data that support the findings of this study are available upon reasonable request from the authors.