

Abstract
Prior to delineation of fire perimeters from airborne and satellite imagery, fire management agencies in Canada employed conventional methods to map area burned based on sketch mapping, digitization from a global positioning system unit, and point buffering from geographic coordinates. These techniques usually provide a less precise representation of a wildland fire's size and shape than those derived from image data. The aim of this study is to assess the discrepancy in fire size from these techniques that contribute to uncertainty in area burned. We paired independently generated fire perimeters derived from Landsat satellite imagery with conventional perimeters (n = 2792; mean area difference per fire = 40.1%), and developed a set of prediction models to estimate a Landsat area burned from conventional perimeters by considering the mapping source, method, agency, and time period. A two-fold cross validation predicting the logarithm of area burned from the models, indicated an R2 = 0.95 (MAE = 0.10 ha; RMSE = 0.19 ha). From this, we created an adjusted area burned time series from 1950 to 2018 using the model-predicted estimates from conventional perimeters (75% of agency-reported area) in combination with unchanged estimates from agency perimeters derived from airborne and satellite imagery (13% of fires). The predicted estimates reduced the size of individual fires over 2000 ha on average in some years, contributing to an annual average reduction of approximately 11% of the area burned reported in the national agency fire database. By retrospectively applying a robust statistical adjustment to the fire size data, the historical overestimation in annual area burned—up to 1.4 Mha in a single year—could be substantially minimized.
Export citation and abstract BibTeX RIS

Original content from this work may be used under the terms of the Creative Commons Attribution 4.0 license. Any further distribution of this work must maintain attribution to the author(s) and the title of the work, journal citation and DOI.
1. Introduction
Accurate measurements of burn rates and the spatial patterns of wildfires are required for the proper management and monitoring of vegetation in fire-prone areas. In Canada, the detailed determination of where fires occurred and the area burned is relevant to both wildland fire science and land-management policy (Tymstra et al 2020). This information serves multiple needs, from estimating carbon emissions (Amiro et al 2001) to monitoring impacts on wildlife habitat (Environment Canada 2012) and commercial forest resources (Rijal et al 2018). Records of wildfires have been collected by the provincial, territorial, and national park fire management agencies since organized forest fire management began in the early decades of the 1900s (van Wagner 1988). Although gaps exist in the earlier years of reporting, the 1950s have often been cited as the period during which area burned data can be considered comprehensive for some national-scale studies (Stocks et al 2003).
Estimates of area burned are often derived from spatial delineations of the fire, which are mapped from various sources (the platform or data to detect the burn) and methods (the technique used to delineate the burn perimeter). Common methods of perimeter delineation before the usage of satellite data were sketch mapping, digitization from global positioning system (GPS), and point buffering from geographic coordinates (hereafter, conventional perimeters). In sketch mapping and GPS digitization, a pilot using a fixed-wing or rotary aircraft attempts to follow the edge of the burn while an observer records the burn extent (Delisle and Hall 1987). GPS digitization may also have been recorded through ground surveys. Point buffers are an approximate estimate of burned area determined by a bounding region created around the fire detection as recorded with a GPS or from satellite-detected hotspots (Henderson et al 2010). Historically, there is variation amongst the agencies in data collection standards and data-quality controls, such as the minimum fire mapping size and the features included in the estimates of area burned. For instance, although fires often leave unburned residual forest patches within the burned area (Eberhart and Woodward 1987, Bourgeau-Chavez et al 2020), which may account for 10% to 15% of the average burn estimation (Madoui et al 2010, Whitman et al 2018), the agencies do not consistently remove the unburned area within the fire perimeters (Parisien et al 2006). Additionally, inclusion of waterbodies and the human subjectivity in manual interpretations of fire perimeters can cause a bias (usually an overestimation) in the area burned (Stocks et al 2003).
Fire perimeter mapping by the agencies has improved over time with increased use of satellite imagery, especially from the Landsat satellite series (Drieman 1993, Epp and Lanoville 1996), and aerial photography (Cumming 2001). The sensor and spatial characteristics of Landsat (and airborne imagery) can generate more precise estimates of area burned compared to GPS digitization from aerial surveys (Kolden and Weisberg 2007). Landsat has also been used regionally to retroactively update conventional fire perimeters (Leboeuf and Fournier 2015, Kansas et al 2016), and further updates have been implemented nationally to improve area burned estimates through the National Burned Area Composite (NBAC) (Hall et al 2020). This approach uses a standardized image metric and adaptive threshold to map burned areas from Landsat that is consistent across the country. It therefore prevents inter-agency discrepancies in which perimeter accuracy varies based on the method employed and the degree (if any) to which unburned forest patches and waterbodies are removed from the perimeter interior.
The central goal of this study is to devise an approach for adjusting the area burned of historical fires derived from conventional methods by pairing fire perimeters mapped by the agencies with updated perimeters created from Landsat. Specific objectives are: (a) to investigate the degree of bias in area burned by the conventional method and data source used; (b) to develop a method to predict Landsat area burned from conventional perimeters; and (c) to produce an aspatial, adjusted area burned time series for Canada using predicted estimates from conventional perimeters (i.e. the modelled area burned) combined with unchanged area estimates from airborne and satellite-derived agency perimeters. We go on to discuss the implications of applying the area-based models to conventional perimeters retroactive to 1950 for land management and for promoting our understanding of landscape fire dynamics.
2. Data and methods
2.1. Data compilation
Fire perimeters were obtained from two spatial databases available through the Canadian Wildland Fire Information System (Natural Resources Canada 2020). The first, the Canadian National Fire Database (CNFDB), consists of a collection of agency fire perimeters and presumed points of ignitions. While both perimeter and point data are available nationally, the inventory of mapped perimeters among the fire management agencies varies in terms of the first year at which they can be considered comprehensive (table 1). Here, we considered fire perimeters for all regions of Canada where data is available, beginning with the year 1950. Another type of missingness in the CNFDB perimeter collection consists of unmapped fires during the 'comprehensive' reporting period; it is assumed that this is more prevalent in the early part of the period, prior to the detection by satellites. A sub-analysis was carried out for the province of British Columbia to assess the degree of missing fire perimeters in the time series data by computing the proportion of fire perimeters mapped to an associated point record (see supplementary information figure S3 (available online at stacks.iop.org/ERL/16/064014/mmedia)). The second spatial database, based exclusively on fire perimeters from 1986 onwards, is the NBAC (Hall et al 2020). NBAC contains fire perimeters derived from multiple sources, including Landsat (hereafter, 'Landsat-derived perimeters') which consist of the fire size data used for development of the area-adjustment model (figure 1).
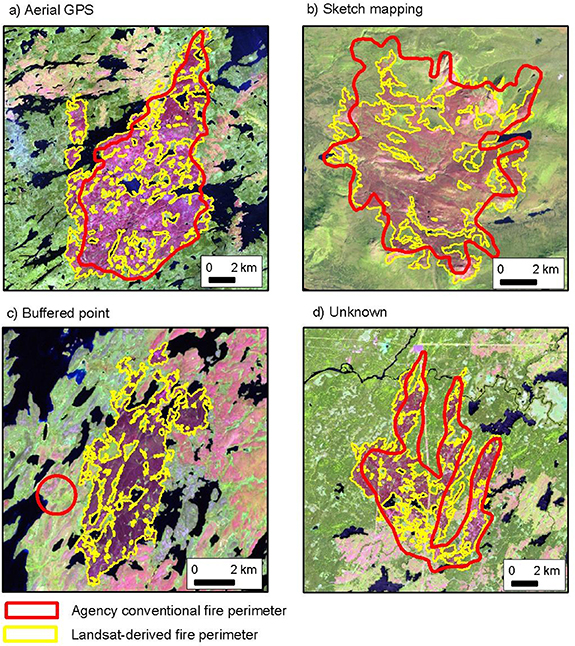
Figure 1. Examples of agency-mapped fire perimeters using conventional methods (a)–(c) with an overlay of Landsat-derived perimeters on a post-fire Landsat image backdrop. Agency fire perimeters labelled as unknown (d) have no creation method defined in the polygon attribution. On the image backdrop, dark reddish tones represent the burn scar, green is unburned vegetation, light pink is regeneration from forest harvesting and historical fires, and dark blue is water.
Download figure:
Standard image High-resolution imageTable 1. Range of years the fire management agencies have contributed perimeter data to the Canadian National Fire Database (CNFDB).
| Agency | Year range | Years missing fire perimeters in CNFDB (since 1950) |
|---|---|---|
| British Columbia | 1917–2018 | — |
| Alberta | 1931–2018 | — |
| Saskatchewan | 1945–2018 | 1951, 1954, 1965 |
| Manitoba | 1928–2018 | — |
| Ontario | 1963–2018 | 1950–1962, 1967, 1985 |
| Quebec | 1973–2018 | 1950–1972 |
| Nova Scotia | 1976–2018 | 1950–1975, 1977–1979, 1981–1983, 1985–1986, 1988–1989, 1993–1996, 2002, 2005, 2010 |
| New Brunswick | 1980–2013 | 1950–1979, 1981, 1984, 1989, 1994–1995, 1997–2006, 2008, 2011–2012, 2014–2018 |
| Newfoundland | 1980–2016 | 1950–1979, 2008, 2015, 2017, 2018 |
| Yukon Territory | 1946–2018 | 1964, 1970 |
| Northwest Territories | 1965–2018 | 1950–1964 |
| Parks Canada | 1923–2017 | 1950–1957, 2018 |
2.2. Conventional fire perimeter selection
The CNFDB attribution provides descriptive information about the data source and method used to map the perimeter. For some fire perimeters, the attribution is undefined, indicating no information regarding the creation method was provided by the agency. For this study, we categorized each perimeter by the source used to detect the burn (aerial survey, field survey, other, undefined) and the mapping method (sketch map, GPS digitization, point buffer, other, undefined). Perimeters categorized as 'other' are based on a source or method that was not clearly described in the attribution (e.g. 'IMS', 'digitized from source', 'mylars'). We assumed the 'undefined' perimeters to be derived from conventional methods. Visual examples of fire perimeters categorized as sketch map, GPS, point buffer, and undefined are illustrated in figure 1.
In total, we selected 2792 conventional perimeters from the CNFDB where the data spatial co-registered with Landsat-derived perimeters from NBAC (hereafter, 'the model calibration sample'). The sample included all possible paired fire perimeters from 1986 to 2018, representing 9% of the fires reported in the CNFDB polygon data for this period and 49% of the area burned. All agency jurisdictions were sampled, except the province of Nova Scotia, which did not have any fire perimeters during this period with a paired Landsat-derived perimeter. Following the data selection, we intersected the conventional perimeters with the CanVec water layer (Natural Resources Canada 2019) to remove permanent waterbodies and assess to what degree they overestimate area burned.
2.3. Area burned prediction models
The modelling framework used a set of predictor variables to determine possible over- or underestimation in conventional area burned relative to the response variable of log-transformed Landsat-derived area burned. We log-transformed the fire size data to account for the strong skew in its distribution, due to the many small fires and few large fires. The predictor variables include the mapping sources and methods, and the fire start and end dates. We also included the fire management agencies as a variable to determine if their respective fire data could be pooled. For each paired sample, we calculated the signed difference and then determined the mean difference and mean per cent difference in the area burned. Before pooling the data for model development, we assessed the entire dataset for significant differences in the homogeneity of variance in the response variable between classes of the predictor variables using a Levene test. Log-Landsat area burned had significantly different variance across classes of all predictor variables, as well as uneven sample sizes across classes. Because of these differences in variances and class sizes we conducted all ensuing ANOVA and ANCOVA analyses using 'type II' sums of squares and a White's adjustment for heteroscedasticity of variance.
We produced linear models predicting log-transformed Landsat-derived area burned from log-transformed conventional area burned for three groupings of the calibration sample: (a) the full dataset of all sampled (i.e. paired) fires (n = 2792); and the same dataset partitioned into (b) early years (1986–2000; n = 1100) and (c) late years (2001–2018; n = 1692) periods. These time period groups were developed to examine whether an earlier model might better represent fire perimeter mapping before the use of aerial imagery and satellites became prevalent (supplementary information figure S1).
We created the linear models with all predictor variables in order from least to most important (importance determined by likelihood ratio (LR) values for each variable) and iteratively eliminated nonsignificant (p > 0.05) variables from further consideration. To determine whether slopes of the relationship between conventional and Landsat-derived area burned were significantly different between the classes of different predictor variables (e.g. different fire management agencies, mapping methods, and map sources) we conducted ANCOVA tests by iteratively introducing an interaction term between the conventional area burned and each remaining predictor variable. If we identified significantly different slopes or intercepts amongst classes of a variable, we pooled classes by homogeneity of slopes and intercepts using post-hoc Tukey–Kramer tests and by comparing differences in between slopes of each class to a z-distribution. Variables and classes with homogenous slopes and intercepts are reported in the supplementary information tables S4–S12 for all analysis periods, with and without waterbodies removed. When a class was similar to multiple classes, it was pooled with the most similar class (smallest difference in means or intercepts). We fitted the final model including all variables that significantly contributed to a reduction in model error, when using combined homogenous predictor variable classes. For each model and period we back-transformed predicted log-area burned into hectares, and produced a ratio bias correction factor (CF) to account for the inherent bias in models with logged response variables (Snowdon 1991). An analysis of the effectiveness of the CF is reported in supplementary information table S2. Once the CF was applied, we then assessed the model fits using two-fold cross validation with 50 repeats. This entire modelling framework was then repeated with waterbodies removed from the conventional perimeters.
3. Results
3.1. Calibration sample assessment
Area burned statistics of the model calibration sample from the conventional and Landsat-derived perimeters are presented in table 2. The total Landsat-derived area burned for the 2792 fires was 33 018 007 ha. By comparison, the area mapped using conventional methods for the same set of fires was 40 466 758 ha, resulting in a difference of more than 7.4 Mha (23%). With waterbodies removed from the conventional perimeters, the area difference to Landsat decreased to 4 860 725 ha (15%). The size of sampled fires ranged from less than 1 ha to approximately 1.1 Mha. At the individual fire size level, Landsat-derived perimeters (mean 11 825.9 ha; median 1829.5 ha) had on average less area burned than conventional perimeters (mean 14 493.8 ha; median 2138.4 ha), even with waterbodies removed (mean 13 566.9 ha; median 2074.1 ha), resulting in mean differences of 2667.9 ha (mean per cent error 40.1%) and 1741.0 (mean per cent error 35.6%), respectively. Despite these substantial differences in area burned, the conventional and Landsat-derived fire sizes were highly correlated, regardless of whether the waterbodies were removed (Spearman's r = 0.98, p < 0.001).
Table 2. Area burned statistics of fire perimeters derived from Landsat and conventional methods used for area-based model development. Total area burned and mean fire size differences area calculated as: conventional methods minus Landsat-derived.
| Total area burned (ha) [diff. (ha)] | Fire size range (ha) | Median fire size (ha) | Mean fire size (ha) [σ] | Mean fire size diff. (ha) [σ] | Mean fire size per cent diff. (%) [σ] | Fire size corr. (Spear.) | |
|---|---|---|---|---|---|---|---|
| Landsat-derived | 33 018 007 | 0.73–828 532 | 1829.5 | 11 825.9 [36 781.4] | — | — | — |
| Conventional methods | 40 466 758 [7 448 751] | 0.19–1 123 927 | 2138.4 | 14 493.8 [47 109.9] | 2667.9 [12 422.9] | 40.1 [104.6] | 0.98 p <0.001 |
| Conventional methods (water rem.) | 37 878 732 [4 860 725] | 0.19–1 077 331 | 2074.1 | 13 566.9 [44 079.0] | 1741.0 [9761.5] | 35.6 [97.8] | 0.98 p <0.001 |
The observed discrepancy between the area and relative (i.e. per cent) difference between the Landsat-derived and conventional perimeters vary as a function of fire size. The area difference significantly increased with increasing fire size (Spearman's r = 0.65, p < 0.001; all sampled fires), but the per cent difference was higher for smaller fires than for larger ones (Spearman's r =− 0.05, p = 0.007; all sampled fires). When waterbodies were removed from the conventional perimeters the same relationships to fire size persisted; however, the correlation between area difference and fire size weakened (Spearman's r = 0.54, p < 0.001; all sampled fires) and the correlation between per cent error and fire size strengthened (Spearman's r =− 0.15, p < 0.001; all sampled fires). When the data sample was partitioned into the early year (1986–2000) and late year (2001–2018) periods, the area differences (both with water and waterbodies removed) were significantly higher in the earlier period (Wilcoxon signed rank test; p ⩽ 0.001). There was no difference in per cent error between the two time periods (p = 0.96).
The number of paired samples for area-based model development varied considerably year-by-year (figure 2(c)). This was largely the result of the number of Landsat-derived perimeters available in the NBAC and the amount of fire activity over the year. For most years there were between 50 and 200 sample pairs, except for year 1989 when nearly 400 fire events were sampled (figure 2(c)). However, for 1997 there was only a single paired sample and this data was removed from figure 2 to prevent displaying an invalid 'average' calculated from a single value. Based on the area comparison to Landsat-derived perimeters, the quality of conventional perimeters produced by the agencies has improved over time in terms of the decrease in mean area difference (figure 2(a)). However, the variability in mean per cent difference remained constant over time (figure 2(b)). Similar results were obtained with waterbodies removed from the conventional perimeters (figures 2(a) and (b)).

Figure 2. Comparison between the paired fire samples from conventional methods and Landsat-derived fire perimeters by year from 1986 to 2018 used for area-based model development. The mean annual difference (a) and mean annual per cent difference (b) represent the average difference in conventional area burned from Landsat-derived perimeters. The number of paired fires for model development are categorized by the agency fire size into small (<200 ha), moderate (⩾200–<1000 ha), and large (⩾1000 ha) size classes (c). The vertical line at year 2001 indicates the divide to partition the model calibration data into early (1986–2000) and late (2001–2018) year periods. Year 1997 data were excluded as there was a single fire sampled in this year and an average cannot be computed.
Download figure:
Standard image High-resolution image3.2. Influence of mapping source and method
The various mapping techniques used by the agencies led to differences in area burned relative to the Landsat-derived perimeters (figure 3). The mapping methods significantly affected the per cent area difference (ANOVA; p = 0.03), with buffered points in particular performing poorly (figure 3(b)); however, buffered points made up only 6% of fires and 0.1% of area burned between 1950 and 2018 (supplementary information table S1). The map sources also affected the per cent-area difference (ANOVA; p < 0.001). Aerial surveys introduced the least amount of error relative to 'undefined' and 'other' sources, and introduced less error than fire perimeters produced from field surveys; however, this difference was not significant (figure 3(a)). Most commonly, mapping sources were not reported and 56% of fires (65% of area burned) had an undefined map source (1950–2018; supplementary information table S1). Recognizing that the primary driver of area difference is, by far, fire size, we tested for interactions with the range of Landsat-derived area burned. Both mapping method and source had significantly different slopes in the relationship between area difference and fire size (ANCOVA; p < 0.001; figures 3(c) and (d)). Buffered points as a mapping method created a negative bias (underestimation relative to Landsat-derived area burned) that increased with fire size (figure 3(d)). Of the mapping sources considered, the rate at which area differences increased with fire size was the lowest for fire perimeters produced from aerial surveys (figure 3(c)).

Figure 3. Effects of mapping source and method on relative ((a) and (b)) and area burned ((c) and (d)) differences. Letters below boxplots indicate significant (p ⩽ 0.05) differences between groups, according to post-hoc pairwise Tukey tests. Lines in plots (c) and (d) are fitted linear models showing the interaction between fire size and mapping source and method, in explaining the absolute difference between conventional and Landsat area burned. The range of fire sizes in the absolute difference graphics were truncated for ease of viewing (14 fires >300 000 ha area difference removed).
Download figure:
Standard image High-resolution image3.3. Modelled predictions of area burned
Of the variables examined, area burned from conventional perimeters is the best predictor of Landsat-derived area burned (ANOVA; p < 0.001). In models using the full sample dataset (i.e. without time period partition), the mapping method and mapping source both significantly contribute to model performance, but did not interact with conventional area burned (table 3). The fire start date was not significant in the full dataset model. We excluded the fire end date as a predictor variable because its inclusion reduced the size of the model calibration data by half (because not all agencies consistently report fire end dates). With the data partitioned to the early year period, only the conventional area burned and agency significantly predict Landsat-derived area burned (ANOVA; p < 0.001) when waterbodies were included, and only conventional area burned with waterbodies excluded (ANOVA; p < 0.001). For the late year period the conventional area burned, method, and source significantly predict Landsat-derived area burned (ANOVA; p < 0.001).
Table 3. Assessment of full (n = 2792), early (n = 1100), and late (n = 1692) period datasets for predicting Landsat-derived area burned from agency mapped conventional perimeters, as defined by ANOVA likelihood ratios (LR) and statistical significance (p-values) of predictor variables. There were no significantly different slopes amongst the predictor groups (ANCOVA p ⩾ 0.05). Blank cells indicate a variable was not significant in the model, and was not included in the model.
| log(Agency area burned) | Agency | Mapping source | Mapping method | |||||
|---|---|---|---|---|---|---|---|---|
| Dataset | LR | p | LR | p | LR | p | LR | p |
| Full sample | 54 178.0 | <0.001 | — | — | 39.0 | <0.001 | 116.0 | <0.001 |
| Early period | 21 854.5 | <0.001 | 9.9 | 0.002 | — | — | — | — |
| Late period | 31 546.4 | <0.001 | — | — | 50.3 | <0.001 | 174.8 | <0.001 |
| Full sample (water removed) | 53 884.0 | <0.001 | — | — | 39.0 | <0.001 | 126.0 | <0.001 |
| Early period (water removed) | 21 796.0 | <0.001 | — | — | — | — | — | — |
| Late period (water removed) | 31 293.8 | <0.001 | — | — | 38.7 | <0.001 | 176.2 | <0.001 |
In the relationship between Landsat-derived and conventional area burned, regression slopes did not differ among classes of any predictor variable (ANCOVA; p > 0.05). The relative importance of the predictor variables for predicting Landsat-derived area burned was consistent whether waterbodies were removed or included in the conventional area burned estimates (table 3). Although removing waterbodies reduced the area differences (table 2), there was no meaningful improvement in model performance using this modified area predictor (table 4). Therefore, for simplicity of the model application we selected a final model that used the original conventional area burned (i.e. without waterbodies removed). Whereas conventional fire perimeters usually overestimated area burned, especially for large fires, the model predictions compensated for this effect for the three time periods of interest (see supplementary information figure S2). Based on the two-fold cross validation, the early model had the lowest mean absolute error (MAE) (0.10 ha) and root mean square error (RMSE) (0.19 ha), and a similar R2 (0.95) as the other time period groups (table 3, early period model). Despite inherent differences in error associated with the different mapping methods and sources (figure 3), the early period model performed very well when tested on subsets of the data categorized by method and source (supplementary information table S3; pseudo R2 = 0.60–0.97). Buffered points had the worst model fit (pseudo R2 = 0.60), but represent only 0.1% of area burned in the area burned time series (supplementary information table S1). Furthermore, our priority was the adjustment of area burned estimates from before the increased use of satellites, corresponding to earlier years. For these reasons, we selected the early period model to generate predicted area estimates on the conventional perimeters for years 1950–2018 (table 3, early period model). Specific models for each individual agency that had training data in the paired sample are shared in the supplementary information table S2.
Table 4. Generalized linear models predicting Landsat-derived area burned from conventional perimeter data using the full (n = 2792), early (n = 1100), and late (n = 1692) period datasets. Intercepts for specific levels of categorical variables are identified by the variable and category name (e.g. SourceOther). Model validation statistics are derived from two-fold cross-validation (CV) with 50 repeats. Model fits (error and bias) are described in terms of the coefficient of determination (R2), MAE, and RMSE. For each model and period we report CF to account for bias when back-transforming from a logged response variable (Snowdon et al 1991). All models are significant at p < 0.001. Categorical variables with homogenous slopes and variances that were grouped together are reported in tables S2–S10.
| Dataset | Model | CV R2 | CV MAE | CV RMSE | CFfull | CFearly | CFlate |
|---|---|---|---|---|---|---|---|
| Full sample | log(Landsat area burned) = 0.11 + (log(Conventional area burned) × 0.95) − (SourceOther × 0.07) + (MethodBufferedPoint × 0.91) | 0.95 | 0.11 | 0.21 | 1.106632 | 1.099583 | 1.118322 |
| Early period | log(Landsat area burned) = 0.07 + (log(Conventional area burned) × 0.96) − (AgencyO × 0.06) | 0.95 | 0.10 | 0.19 | 1.073713 | 1.067454 | 1.085395 |
| Late period | log(Landsat area burned) = 0.13 + (log(Conventional area burned) × 0.95) − (SourceOther × 0.09) + (MethodOther × 0.14) + (MethodBufferedPoint × 1.36) | 0.95 | 0.12 | 0.22 | 1.113698 | 1.108781 | 1.121811 |
| Full sample (water removed) | log(Landsat area burned) = 0.11 + (log(Conventional area burned) × 0.96) − (SourceOther × 0.08) + (MethodBufferedPoint × 0.92) + (MethodOther × 0.12) | 0.95 | 0.11 | 0.21 | 1.107054 | 1.102178 | 1.110066 |
| Early period (water removed) | log(Landsat area burned) = 0.07 + (log(Conventional area burned) × 0.97) | 0.95 | 0.10 | 0.19 | 1.067643 | 1.073052 | 1.058938 |
| Late period (water removed) | log(Landsat area burned) = 0.13 + (log(Conventional area burned) × 0.95) − (SourceOther × 0.08) + (MethodOther × 0.13) + (MethodBufferedPoint × 1.37) | 0.95 | 0.12 | 0.22 | 1.12559 | 1.130685 | 1.121811 |
3.4. Area-adjusted burned estimates: 1950–2018
The adjusted area burned time series based on the sum of predicted estimates from conventional perimeters combined with unchanged area from satellite and airborne data resulted in less burned area each year than is reported from the unmodified (i.e. original) CNFDB data (figure 4(a)). For most years there were higher proportions of predicted estimates (representing 75% of conventional-reported area) than those that were left unchanged (figure 4(b)). Similarly, the number of fires from predicted estimates was comparatively higher than those unchanged (figure 4(c)), and totalled 84% of all fires. The predicted area burned contributes less in later years (figures 4(b) and (c)) because fire agencies used increasingly more satellite imagery and aerial photography to create fire perimeters, and those fires requiring adjustment were less likely to be very large (figure 2(b)).
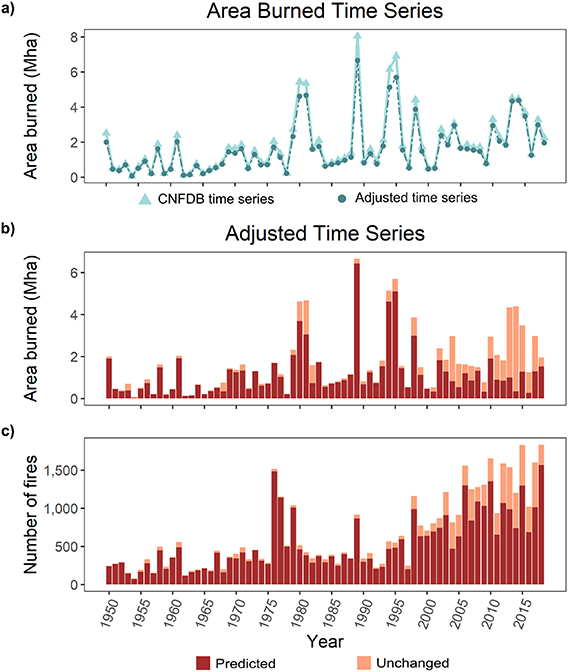
Figure 4. Reported area burned (light blue; triangles) in the CNFDB and adjusted area burned (dark blue; circles) predicted from the early period model, with the inclusion of unchanged area burned from satellite and airborne data (a). The total area by year in the adjusted time series that were predicted (red) and unchanged (peach; (b)) and the number of fires in the adjusted time series that were predicted (red) and unchanged (peach; (c)) are illustrated.
Download figure:
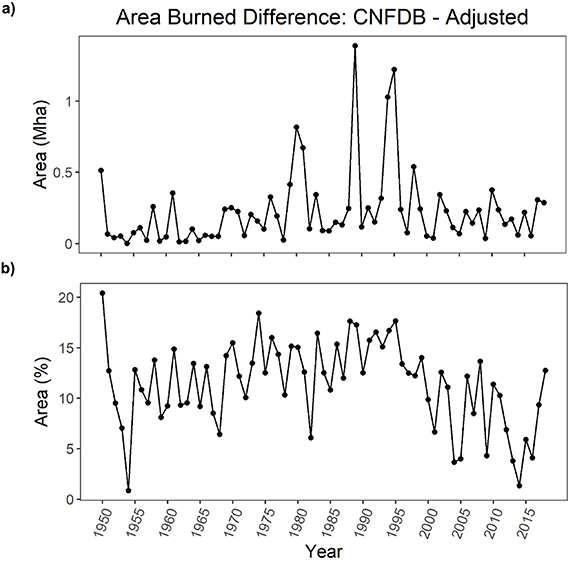
Standard image High-resolution imageThe amount of reduction in annual area burned resulting from an area-based adjustment was highly variable, with the largest decreases in 1980 (817 579 ha), 1981 (673 062 ha), 1989 (1 389 207 ha), 1994 (1 028 755 ha), and 1995 (1 221 507 ha) (figure 5(a)). The area-based model reduced the size of individual fires over 2000 ha on average in some years (supplementary information figure S5), contributing to an annual average reduction of 11% in the area burned reported in the national agency fire database (figure 5(b)). When limited to the earlier data only (1950–2000) the average annual reduction in area burned was 12%, as compared to 8% from 2001 to 2018. There was a notable fire in 1950, the Chinchaga fire. This fire was exceptional, burning a reported 1 391 390 ha in a single season within two provinces. However, due to the age of the fire and conventional mapping method used (sketch mapping), this fire perimeter included waterbodies and unburned forest islands within the reported burned area. When permanent waterbodies are removed, the burned area is reduced by approximately 10 000 ha. The predicted area burned for this fire was 1 095 349 ha, suggesting that the sketch mapped perimeter may have overestimated area burned by approximately 300 000 ha (21%).
Figure 5. Area burned differences of the unmodified CNFDB data subtracted from the adjusted area burned time series (a). The relative difference is calculated as the area burned difference in (a) divided by the CNFDB area burned by year (b).
Download figure:
Standard image High-resolution image
4. Discussion
Canada is fortunate to have a largely comprehensive national inventory of wildland fires (i.e. CNFDB) that extends beyond the 'Landsat era' (1984 to present). This dataset allows for a national assessment of spatio-temporal patterns of wildland fire (Stocks et al 2003, Burton et al 2008), but, as our results show, conventional mapping can partially misrepresent the size of wildland fires (Andison 2012, Meddens et al 2016). Given that ∼3% of the largest wildland fires are responsible for approximately 97% of the total area burned in Canada (Hanes et al 2019), mapping inaccuracies are particularly noticeable in large fires and, by extension, large fire years. The predicted estimates reduced the size of individual fires over 2000 ha on average in some years, contributing to an average reduction of approximately 11% in the annual area burned reported in the CNFDB data. Furthermore, our results suggest that the area burned in the largest fire year on record, 1989, may be overestimated by almost 1.4 Mha, a total nearly equalled in other large wildland fire years (1980, 1981, 1994, and 1995).
Inaccurate measures of fire sizes and area burned hinder our current understanding of landscape wildland fire dynamics, as well as our ability to backcast. For instance, carbon emissions from wildland fires calculated from unadjusted historical area burned would represent an important overestimation in carbon loss (de Groot et al 2007). Accurate rates of disturbance also improve our ability to manage our forests; for example, planning horizons for commercial forestry in boreal Canada relies on the current state of the forest (i.e. postfire stand ages) and the likelihood that forests will be lost to wildfire (Armstrong 2004). These results are also relevant to the conservation of nationally endangered woodland caribou (Rangifer tarandus caribou), given that the availability of suitable habitat for caribou is often calculated as the proportion of habitat undisturbed by natural and anthropogenic disturbance (Environment Canada 2012). Adjusted area burned would likely indicate that more 'suitable' habitat may be available for caribou, though this remains to be formally examined.
This study allowed us to assess the degree of accuracy of fire perimeters by agency, mapping method, and data source. Although these factors all contributed significantly to models to predict Landsat-derived area burned from conventional perimeters, their effect size is modest compared to that of fire size. Nationally, our results show that a model based on fire size and agency (table 3, early period model) is adequate for producing an adjusted time series. While the models provide a first-order correction to fire size, we advise users to carefully examine the factors that may affect regional fire mapping accuracy. People wishing to develop their own models could readily include these factors, given that methods and sources meaningfully contributed to under- (buffered points) and overestimation (other methods) of area burned. Unfortunately, in some areas, fire reporting prior to the more extensive use of satellite imagery and aerial photography for mapping (c. 2000) was more likely to exclude attributes such as source and method, precluding their inclusion in predictive models.
Time series of the number of wildland fires and associated area burned have been used to evaluate temporal trends in fire activity in Canada both nationally (Girardin and Mudelsee 2008, Coops et al 2018) and regionally (Le Goff et al 2007, Meyn et al 2010, Campos-Ruiz et al 2018), and elsewhere in the world (Oliveira et al 2012, Bradstock et al 2014, Dennison et al 2014). Canada is one of the rare countries for which fire data extends beyond the Landsat-era. Longer time series, more robust in appearance, may in fact be misleading, due to proportionally less accurate mapping in earlier decades. It is evident from our results, however, that adjusting the area burned data affects—substantially, if not dramatically—our previous estimates of the largest fire years. A more thorough understanding of if and how wildland fires have changed through time would ideally consider an assessment of additional metrics of fire activity (see Hanes et al 2019). Furthermore, fully understanding trends in fire activity would require an examination of its underlying causes of variation (Abatzoglou and Kolden 2011), including the complex effects of fire-management policies (Tymstra et al 2020), given that biophysical and anthropogenic controls have also changed through time.
Although models for retrospectively adjusting area burned produced in this study are robust, missing data (i.e. fires) in national databases will lead to underestimates of annual area burned that we will never be able to quantify fully across Canada. Regional fire history studies based on dendrochronological or air photo analysis could be used to fill in missing wildland fires in a given area of interest (e.g. Bergeron et al 2004, Héon et al 2014, Rogeau et al 2016), but these cover only a fraction of the country and would be impossible to reconcile nationally. While some of this missingness is documented for specific regions and periods, there is an unknown number of fires that were not inventoried, especially in the earlier decades of our study period (table 1). While some authors have claimed that large fires are rarely undetected and unreported (van Wagner 1988, Podur et al 2002, Girardin 2007), this remains to be formally investigated.
Fire perimeters derived by satellite imagery and aerial photography are more accurate than aerial GPS and sketch mapping when the unburned features are removed and a precise perimeter boundary is defined (Hall et al 2020). For these reasons, we did not adjust the CNFDB perimeters from these data sources and set our objective on conventional methods. However, for comprehensiveness, the CNFDB includes methods of perimeter capture rendered from buffered points using GPS coordinates or satellite hotspots that are more spatially coarse than aerial GPS or sketch mapping. These add noise to the models; for instance, buffered points had the largest effect on the per cent error of area difference of all the mapping methods; however, they are the least significant in terms of the amount of mapped burned area of any method. It is also possible to build a robust adjustment model for these coarser methods. All things considered, it will likely be more important to users to have a dataset that is as comprehensive as possible, even if this entails the inclusion of some coarser data types.
5. Conclusion
The data source and methods employed by the fire management agencies in Canada to map fire perimeters have considerable variation in terms of the uncertainty associated with each area burned estimate. This has contributed to what is a consistent overestimation of area burned in historical area burned reporting. In this study we developed an area burned prediction model to account for the overestimation bias as observed in conventional perimeters derived from sketch mapping and GPS digitization, buffered points, and those without any reported mapping source or method. Area burned overestimation was mostly explained by fire size, with increasing fire sizes contributing to increasing area burned difference between conventional and Landsat-derived area burned. Data source and mapping method were also meaningful, albeit lesser, drivers of relative area burned difference. We created an adjusted area burned time series from 1950 to 2018 based on predicted estimates of area burned, combined with area estimates from satellite and aerial photography fire perimeters. Reconstructed estimates have shed light on substantial overestimations in annual area burned that will help us refine our understanding of landscape fire dynamics and trends in fire activity in Canada. Researchers and managers wishing to revise historical area burned estimates with known limitations in mapping methodology or source can use the models developed in this work to create adjusted area burned time series for use in fire regime analyses, planning, and reporting. Similarly, this technique could be applied in other parts of the world where long but noisy fire datasets predating the Landsat era exist.
Acknowledgments
The foundations for this study were the large spatial databases of historical wildland fire information created through collaborative efforts by all Canadian fire management agencies and Natural Resources Canada, in particular the Canadian Forest Service and the Canada Centre for Mapping and Earth Observation. An internal review by Dr Guillermo Castilla improved the quality of this manuscript and was greatly appreciated. We also thank Dr Piyush Jain for helpful conversations that informed this work.
Data availability statement
The data that support the findings of this study are openly available at the following URL/DOI: https://cwfis.cfs.nrcan.gc.ca.