

Abstract
This paper presents a second harmonic assisted spectrally resolved interferometric technique that can overcome the limited spectral resolution of commercially available spectrometers in the mid-infrared. The discussed scheme was validated by measuring the group delay of several well-known and frequently used materials. Our main motivation was to characterize the spectral phase shift of newly designed and manufactured dispersive mirrors to be used for mid-infrared (MIR) post-compression. These mirrors were successfully implemented in the post-compression stage of our MIR laser system, where pulse duration was shortened below two optical cycles and the pulse peak power increased by 30.3% compared to the original output.
Export citation and abstract BibTeX RIS

Original content from this work may be used under the terms of the Creative Commons Attribution 4.0 license. Any further distribution of this work must maintain attribution to the author(s) and the title of the work, journal citation and DOI.
1. Introduction
Current trends in the development of ultrafast laser technology are moving towards the mid-infrared (MIR) spectral region via engineering few-cycle pulses with passive carrier-envelope phase (CEP) stability, together with repetition rates in the hundred kilohertz regime [1–6]. Compared to near-infrared (NIR) sources (usually centered between 0.8 and 1.8 µm), the longer carrier wavelength is favorable for secondary sources which are based on the acceleration of charged particles. The reason for this is that the ponderomotive force scales with the square of the driving laser pulse's wavelength, which results in higher cut-off photon energy for high harmonic generation (HHG) at longer wavelengths [7] and generates higher intensity THz pulses [8–15]. Unfortunately, HHG efficiency scales with λ−(5−6) [16], which indicates the need for MIR sources capable of reaching a peak power of at least several gigawatts. The aforementioned secondary sources also benefit from the few-cycle pulse duration, as well as CEP stability and control [1–6]. Furthermore, high repetition rate sources significantly reduce data accumulation times for low-yield processes, such as HHG in gases [17]. These requirements can be addressed by newly developed MIR optical parametric chirped pulse amplification (OPCPA) systems [1–6, 18].
Short pulse duration is one of the main benefits of the OPCPA laser systems, and it can be further reduced by subsequent spectral broadening in bulk solid-state media [18–22], followed by re-compression achieved via the precise compensation of the accumulated spectral phase. The authors would like to mention that other techniques are also suitable to reduce pulse duration [23–26], but their presentation is outside the scope of this article. In the MIR region the spectral phase can be flattened simply by propagating the pulses through properly chosen optical materials that can have either positive (silicon, zinc sulfide, zinc selenide) or negative (calcium fluoride, barium fluoride, yttrium aluminum garnet (YAG)) group delay dispersion (GDD). However, to achieve the shortest possible pulse duration, higher order derivatives, such as the third order dispersion (TOD) must be compensated too. Since most transparent materials have positive TOD, compression below two cycles is not possible relying solely on bulk compression. Prism compressors can be set to have both negative GDD and negative TOD, however the complexity of alignment and optical losses make them somewhat impractical to use. A more sophisticated solution to this problem is the use of dispersive mirrors (DMs) [27–31], which can be designed to have arbitrary spectral phase functions, therefore they can be made to have negative TOD. In order to verify the performance of the DMs after manufacturing, their spectral phase must be characterized.
Characterization was achieved by the newly developed, second harmonic assisted spectrally resolved interferometric (SH-SRI) technique, which is able to overcome the limited spectral resolution—a major bottleneck in spectrally resolved interferometric (SRI) measurements—of commercially available spectrometers in the MIR. The paper is constructed as follows: the 2nd chapter discusses the theoretical background of the applied method. The 3rd chapter describes the experimental setups for conventional SRI and SH-SRI. In the 4th chapter the SH-SRI is validated by measuring well-known and commonly used optical materials in the MIR. The 5th chapter discusses the characterization of the group delay (GD) of the newly developed and manufactured DM. The 6th chapter introduces the post-compression stage for our MIR OPCPA laser system. Using the characterized DMs, we achieved sub-two optical-cycle MIR pulses, and the pulse peak power increased by 30.3% after post-compression.
2. Working principle of the SH-SRI technique
Several measurement methods have been developed for the GD characterization of optical components. One of the most straightforward and reliable techniques is SRI [32, 33]. Thanks to its simplicity, linearity, one-dimensional imaging, high precision and wide range of applicability, SRI quickly became one of the most widely used methods in dispersion characterization. The other most prominent technique serving the same purpose is white light interferometry [34–37], however the spectral power density of white light sources is generally not sufficient to drive SH generation, which is a necessity in our case.
SRI utilizes a two-arm interferometer illuminated by a broadband light source and a high-resolution spectrometer to observe the fringe pattern. With the emergence of spectrometers providing high spectral resolution, it became evident that the most accurate evaluation methods are the ones based on the Fourier-transform (FT) [38–41], even when low dispersion values are measured. Most spectrometers in the MIR region typically have a few nm spectral resolution, which supports relatively low fringe density in the spectrum, therefore they yield inaccurate GD results.
Several solutions [42, 43] have been proposed for similar resolution problems encountered in the MIR region during different applications. For instance, by the nonlinear up or down conversion of the wavelengths of the pulse, the spectrum can be shifted to wavelength ranges where spectrometers with sufficiently high spectral resolutions are commercially available. This idea was already implemented in pulse duration measurement techniques e.g. in the different types of frequency-resolved optical gating (FROG). Marceau et al [42] presented a second harmonic generation (SHG) FROG method for spectral phase measurement that was based on several frequency conversions, and enabled detection spanning from 580 nm to 3250 nm. Johnson et al [43] have recently presented a hybrid second and third harmonic generation (THG) FROG scheme that allows for the measurement of both few-cycle and longer (several hundred fs) pulses across the entire visible and NIR spectral region using different materials of the SHG and the THG. Although these techniques are not suitable for the broadband characterization of optical elements, the underlying principle can be applied in the SRI method to implement the SH-SRI technique. Combined with the FT evaluation method, this technique is able to retrieve the GD of optical components from 2900 nm to 3400 nm with 0.05 nm resolution.
In the SH-SRI method, the incoming pulse is replicated in an interferometer. The resulting two pulses are then sent through a nonlinear crystal, where SH pulses are generated. With the fundamental pulses filtered, the remaining SH pulses interfere with twice the spectral phase difference compared to the spectral phase difference of the fundamental pulses.
To prove this fact, a simplistic theoretical model is used to describe the process: a one-dimensional pulse with kF wave number traveling in z direction. The complex electric field (EF) can be described by its real amplitude (AF) and its complex phase (φF). Let us also assume that the pulse is quasi-monochromatic with a central frequency ω, so its phase changes almost linearly with time. The deviation from this linear evolution is described by its temporal phase ϕF. The electric field of such a pulse can be written as

The generated SH electric field ESH is also a wave with a wave number kSH traveling in z direction, with a temporal phase ϕSH, amplitude AF and has twice the frequency of the fundamental, which can be written as

The two electric fields are coupled by the nonlinear polarization of the material [44]. The coupling strength depends on the effective value of the d matrix (deff), which is the effective nonlinear coefficient used to describe the conversion efficiency of nonlinear processes. The spatial evolution of the SH amplitude and its phase are described by equation (3)
For equation (3) to be fulfilled, both the amplitude and the spectral phase of the left and right sides must be equal. The spectral phase relation between fundamental and SH pulses is described as
Furthermore, let us assume that in the SH generation process the phase-mismatch is zero ( ), which is a good approximation for the whole fundamental spectrum in our experimental setup. In this case, the temporal phase of the SH pulse can be calculated using equation (5)
Note, that when the phase matching is not perfect, the phase mismatch of the SHG process can shift the spectral phase by an addition of a nonlinear function. However, both arms undergo the same SHG process, with the same imperfect phase mismatch conditions. Consequently, the phase difference between the arms would remain the same even in this case.
At the output of the interferometer, the two fundamental pulses are separated by a few picoseconds, which is significant compared to their pulse durations, which prevents parametric processes between the two pulse in the nonlinear crystal. Therefore, we can treat the two SH generation processes separately as follows

The intensities of the two pulses can be recorded by a spectrometer. The resulting interference is described by equation (7)

Using again the condition that the phase-mismatch is canceled, we get equation (8)

which connects the measured spectral phase difference at the second harmonic wavelength to the initial spectral phase difference at the fundamental wavelength. Equation (8) proves that the spectral phase extracted from the interference pattern at the SH wavelength is indeed twice the spectral phase difference between the two arms of the interferometer. Upon dividing the spectral phase by two and expanding it around the fundamental central frequency, one can easily extract the spectral phase derivatives at the fundamental frequency as well. One can see that based on our description, the presented method works similarly for third and higher order harmonic generation.
One of the experienced drawbacks of the proposed SH-SRI method is connected to the SHG process itself. The efficiency of the nonlinear conversion is proportional to the square of the intensity, which may cause information loss at the edges of the spectrum where the spectral intensity is low.
3. Dispersion measurement setups
For the experiment we used the MIR OPCPA [5, 6] laser system of ELI-ALPS Research Institute [45]. The system provides MIR laser pulses with 100 kHz repetition rate at 3170 nm central wavelength, with a 560 nm (full width at half maximum - FWHM) spectral bandwidth. The moderate peak power of the system is sufficient to drive inner-shell excitement [46] or solid HHG [47] experiments, but it can be further improved with the post-compression [18] technique, which is one of the main motivations of this article. The broadband spectral bandwidth also makes it suitable for broadband dispersion characterization. Approximately 7% (0.9 W) of the available 13.0 W output of MIR OPCPA was sent to the SH-SRI setup. For post-compression (discussed in the 6th chapter), the full power (13.0 W) was injected into the spectral broadening unit.
To highlight the advantages of the newly proposed SH-SRI scheme, first the performance of the conventional SRI method is examined, then it is compared to the SH-SRI results.
3.1. Conventional spectrally resolved interferometry
The schematic drawing of the SRI setup can be seen in figure 1. The arrangement is based on a Mach–Zehnder interferometer (MZI), where the input beam is divided into two parts by a beamsplitter. The sample and reference arms both contain three unprotected flat gold mirrors (GMs). The two beams are recombined by the same type of beamsplitter as the first one. Note that both the sample and the reference beams undergo one transmission and one reflection on each beamsplitter, which cancels the spectral phase difference between the two arms of the empty MZI. After recombination, the beams are sent to a MIR spectrometer (MOZZA, FASTLITE), which has a spectral resolution of 5 cm−1 (∼2.5 nm). The spectrum recorded by the MIR spectrometer after recombination can be seen in figure 2.
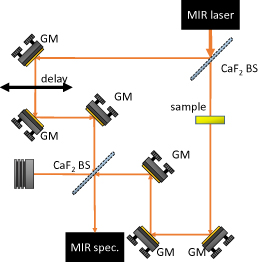
Figure 1. Schematic drawing of the SRI setup. BS—beamsplitter, GM—gold mirror.
Download figure:
Standard image High-resolution image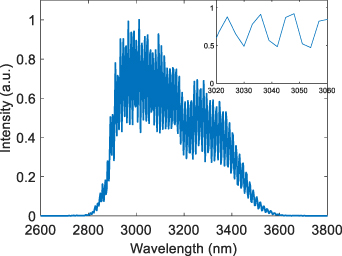
Figure 2. Recorded interference fringes with the MIR spectrometer at a central wavelength of 3170 nm. The group delay between the arms was 2.67 ps, and a 3 mm thick YAG window was included in the sample arm. The inset shows the recorded interference fringes in a smaller region for better visibility.
Download figure:
Standard image High-resolution image3.2. Second harmonic assisted spectrally resolved interferometry
The schematic drawing of the SH-SRI setup can be seen in figure 3. The arrangement is based on the same MZI as shown in figure 1, however, this time instead of a MIR spectrometer the output of the MZI was sent to an SH setup. The recombined beams were focused by a 150 mm focal length, CaF2 plan-convex lens with broadband antireflection (BBAR) (2–5 µm) coating into a 100 µm thick, silver gallium sulfide (AgGaS2, AGS) crystal (θ= 39°, ϕ= 45°) placed at the focus for frequency doubling. Both the fundamental and SH beams were collimated by another 150 mm focal length CaF2 lens, which had a BBAR (1.4–1.7 µm) coating for the wavelength of the SH. Then the fundamental and the SH beams were separated by a dichroic mirror. Finally, the SH beams were sent to a NIR optical spectrum analyzer (AQ6375B, YOKOGAWA) and the spectral resolution was set to 0.05 nm. The higher spectral resolution (compared to the MIR spectrometer) supports longer temporal delay between the two beams, resulting in a denser spectral fringe pattern, and consequently allowing for more accurate GD measurement. The recorded spectrum with the NIR optical spectrum analyzer can be seen in figure 4.
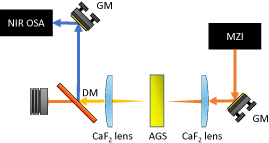
Figure 3. Schematic drawing of the SH-SRI setup. DM—dichroic mirror, GM—gold mirror, MZI—Mach–Zehnder interferometer (the same as in figure 1).
Download figure:
Standard image High-resolution image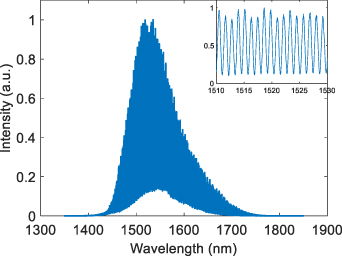
Figure 4. Recorded interference fringes with the NIR optical spectrum analyzer at a central wavelength of 1550 nm. The group delay between the arms was 10.07 ps, and a 3 mm thick YAG window was included in the sample arm. The inset shows the recorded interference fringes in a smaller region for better visibility.
Download figure:
Standard image High-resolution image4. Validation of the SH-SRI technique
In this chapter the performance of the conventional SRI and the SH-SRI methods is examined and compared by characterizing the GD spectrum of well-known optical materials which are transparent in the MIR. As the basis of the comparison, we chose the extracted GD spectrum instead of the spectral phase spectrum, because the measured GD spectrum is unambiguous up to an additive constant offset. Note that the spectra of higher order derivatives would be free from the above-mentioned constant offset, however, the accuracy of the retrieved spectra would decrease. The GD spectrum was obtained from the spectral phase spectrum with numerical derivation. One of the examined values was the root mean square deviation (RMSD) between the measured and the calculated GD spectra. The other considered quantity was the standard deviation (STD) of the measured GD spectra. The calculated GD spectra were extracted from the Sellmeier equations of the given materials with numerical derivation.
The inspected spectral region for the conventional SRI ranged from 2900 nm to 3400 nm, which corresponded to 1450 nm and 1700 nm in the case of the SH SRI, which was limited by the spectral bandwidth of the SH pulse, as one can see in figure 4. Although the conventional SRI technique itself is able to inspect a broader (fundamental) spectral region, for the sake of better comparison with SH-SRI, only a narrower spectral region was used for evaluation. For both the conventional and the SH-SRI techniques, 100 interference patterns were recorded at the same delay and evaluated employing the FT method [38–41]. The measured materials were barium fluoride (BaF2) [48], calcium fluoride (CaF2) [48], thallium bromo-iodide (KRS-5) [49], silicon (Si) [50] and YAG [51].
As an example, the GD spectra of a 3 mm thick YAG window measured by conventional and the SH-SRI methods are displayed in figures 5 and 6, respectively. The GD spectrum has a negative slope in the frequency domain, corresponding to the negative GDD of the material at this central wavelength. Similarly, the GD spectra of a 2 mm thick Si window are shown in figures 7 and 8. They have a positive slope in the frequency domain, corresponding to positive material GDD. Note, that to have a better comparison with theory the GD functions were shifted temporally so that they cross zero at the central wavelength. The RMSD and the STD were calculated for all the measured windows and summarized in table 1. It can be concluded that the SH-SRI technique yielded better results both in terms of RMSD and STD.
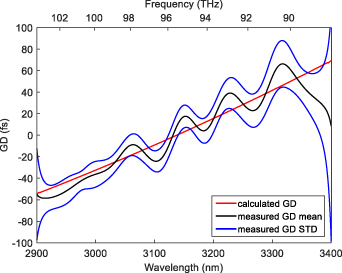
Figure 5. GD spectrum of the 3 mm thick YAG window with the conventional SRI.
Download figure:
Standard image High-resolution image
Figure 6. GD spectrum of the 3 mm thick YAG window with the SH-SRI.
Download figure:
Standard image High-resolution image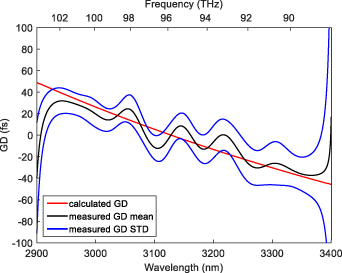
Figure 7. GD spectrum of the 2 mm thick Si window with the conventional SRI.
Download figure:
Standard image High-resolution image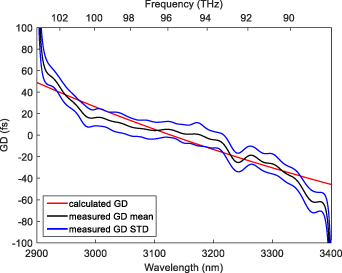
Figure 8. GD spectrum of the 2 mm thick SI window with the SH-SRI.
Download figure:
Standard image High-resolution imageTable 1. The RMSD and the STD of the GD spectrum in the case of conventional and SH-SRI measurements in the spectral range of 3000 nm to 3300 nm.
| GDSRI (fs) | GDSH-SRI (fs) | |||
|---|---|---|---|---|
| Windows | RMSD | STD | RMSD | STD |
| BaF2 (3 mm) | 9.46 | 11.94 | 3.92 | 8.18 |
| CaF2 (3 mm) | 7.94 | 12.50 | 4.32 | 7.50 |
| KRS-5 (4 mm) | 7.91 | 10.83 | 6.08 | 8.01 |
| Si (2 mm) | 8.79 | 12.79 | 6.81 | 8.35 |
| YAG (3 mm) | 8.61 | 11.12 | 4.57 | 7.78 |
There are significant differences between the results obtained by the two techniques. The first difference is in the shape of the GD spectra. It is clearly visible that in our case all GD spectra retrieved by the conventional SRI method are slightly modulated, while those retrieved by the SH-SRI technique are smoother. Since the spectral resolution of the spectrometer used for the conventional SRI method is quite low, these fluctuations do not have any physical meaning, otherwise they would be even more pronounced with the SH-SRI method. Since this is not the case and considering the periodical nature of these modulations, we concluded that they are a result of insufficient spectral resolution, the effect of which is magnified by the numerical derivation of the spectral phase. Furthermore, in a previous study [40] it is already described that interpolation in some cases may cause oscillation in the retrieved spectral phase. Although we proceeded with great care during the evaluation, we had no influence on the built-in interpolation of the software of the MIR spectrometer. Note, that the oscillation of the retrieved spectral phase can be minimized by decreasing its spectral range, which can be an acceptable compromise for some applications. The second observable difference, which in fact results from the high spectral resolution, is that the GD peak at 3250 nm is only detectable with the SH-SRI technique. This GD peak was observed above 3.34 ps GD between the two arms of the MZI, where the NIR optical spectrum analyzer was still able to resolve the interference pattern in the spectrum, while the MIR spectrometer was not. Since its magnitude is proportional to the delay between the two arms of the MZI, we concluded that it most probably originates from the absorption of methane (CH4) [52]. This result serves as a nice example of how advantageous the enhanced spectral resolution of the SH-SRI technique is.
5. DM characterization
As mentioned earlier, quite good dispersion management can be achieved in the MIR, by simply using transparent materials having the correct sign and sufficient magnitude of GDD to flatten the spectral phase spectrum. However, all transparent materials have positive TOD in the MIR, which limits the compression of laser pulses above two cycles. To overcome this limitation, DMs with positive GDD and negative TOD were designed and manufactured by OPTOMAN [53]. A multilayer was deposited by using the ion beam sputtering technology. The coating consists of 25 alternating layers, with a total thickness of 7.4 µm. A special time control strategy was used for precise termination of layers because in-situ optical monitoring in the MIR range is very complicated. The key feature of this DM is its GDD value, which gradually increases with the wavelength. By using a DM pair with mirrors placed at two different angles (10° and 25°) GDD oscillations can be somewhat minimized, leading to a smoother spectral phase response.
The GD of the DM was measured with both the conventional and the SH-SRI methods, by placing the mirrors in the sample arm of an MZI. In the MZI, the sample beam undergoes two reflections from two GMs, placed at 25° and 10° angles of incidence (AOIs), respectively. (Both AOIs correspond to the design angles of the DM pair). Careful exchange of these two GMs with the DMs one after the other and then both of them simultaneously, allowed us to measure their GD spectra without changing the optical path difference between the arms. Note, that even if this change in the optical path would not be negligible, since the dispersion of air in the studied wavelength range is insignificant it would only shift the GD by a constant function without affecting its shape. The baseline data of the empty interferometer was obtained by using exclusively GMs in the setup. The baseline data acquired above was then subtracted from the resulting GD spectra in all other measurement series. This way the effect of the CH4 absorption was also canceled. The measured GD spectra of the DM pair with the conventional and the SH-SRI methods are shown in figures 9 and 10, respectively. To have a better comparison with the GD curve of the DMs calculated during the design process, we shifted the GD functions temporally so that they cross zero at the central wavelength. In the case of the SH-SRI method, there is excellent agreement between the designed and measured GD spectra. The RMSD and the STD of the DM measurements are summarized in table 2.

Figure 9. GD spectrum of the DM pair (10° and 25° AOI) with the conventional SRI technique.
Download figure:
Standard image High-resolution image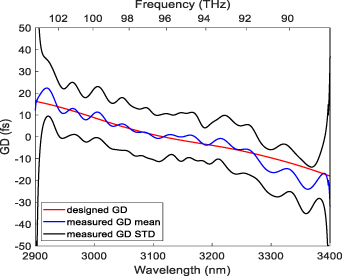
Figure 10. GD spectrum of the DM pair (10° and 25° AOI) with the SH-SRI technique.
Download figure:
Standard image High-resolution imageTable 2. The RMSD and the STD of the GD spectrum in the case of the conventional and the SH-SRI measurements in the spectral range of 3000 nm to 3300 nm.
| GDSRI (fs) | GDSH-SRI (fs) | |||
|---|---|---|---|---|
| Setup configuration | RMSD | STD | RMSD | STD |
| 1 DM (10° AOI) | 7.83 | 11.83 | 2.10 | 7.87 |
| 1 DM (25° AOI) | 4.31 | 11.44 | 1.82 | 10.88 |
| DM pair (10° and 25° AOI) | 8.83 | 10.07 | 1.64 | 10.61 |
It can be seen that the GD spectra measured with the SH-SRI technique have lower RMSD and lower STD than the GD spectra measured with the conventional SRI technique. The advantage of the SH-SRI technique is even more obvious when the GD values are small, like in the case of the DMs presented here. According to our measurements, the GDD and the TOD at the central wavelength of the DM pair are 274 fs2 and −7204 fs3, respectively, while the corresponding designed values are 270 fs2 and −7000 fs3. One can see that the measured and the calculated values match very well, the small differences can be attributed to the uncertainties of the measurement. It can be seen from our results that the DM pair indeed produces positive GDD and negative TOD, so in principle it can be used in combination with material dispersion to compensate for the spectral phase shift of a MIR pulse up to the fourth order dispersion.
6. Post-compression setup
Practically, one major bottleneck of the post-compression process is the subsequent dispersion management upon the recompression of a broadband spectrum close to Fourier transform limited (FTL) duration. The GDD of the spectrally broadened pulse can be compensated for by material dispersion, however the TOD cannot be removed solely by material dispersion. Nonetheless, the combination of bulk materials and DMs is capable of compensating for both.
The schematic drawing of our post-compression setup driven by the MIR OPCPA beam can be seen in figure 11. A similar scheme was introduced in our previous work [18]. That approach has been further investigated and improved by using other materials for enhanced spectral broadening and aiding bulk compression with the DMs to compress the pulses below two optical cycles. The 13.0 W (130 µJ, 42 fs FWHM, 100 kHz) beam was focused in ambient air with a concave spherical GM having—1000 mm radius of curvature, to guarantee a sufficiently large focal spot without plasma formation. Behind the focal plane of the focusing mirror, thin plates were positioned at normal incidence along the beam propagation axis for spectral broadening. The spectrally broadened beam was collimated with a 250 mm focal length, CaF2 BBAR (2 to5 µm) plan-convex lens. After collimation, the beam was sampled with a specially coated sapphire sampler window having 7% reflectance between 2.2 and 4.2 µm, and nearly zero GDD and TOD for both the reflected and transmitted beams. We used the reflected beam for the spectrum and the CEP measurements.

Figure 11. Schematic drawing of the post-compression setup. The compressor contains 3 DM and 5 mm CaF2 window. GM—gold mirror.
Download figure:
Standard image High-resolution imageSeveral materials (barium fluoride, calcium fluoride, gallium arsenide, potassium bromide, thallium bromo-iodide, magnesium fluoride, silicon, yttrium aluminum garnet, zinc sulfide and zinc selenide) were tested in the post-compression stage in order to get a sufficiently broad spectrum supporting two optical-cycle pulse durations. The broadest spectra were achieved using barium fluoride, potassium bromide (KBr), silicon and the combinations of these materials. In general, the double plate arrangements resulted in broader spectra than any of the single plates. The triple plate arrangement was also considered and tested, but it did not improve the achieved bandwidth. Note that the operation of the spectral broadening unit in ambient air is limited by the absorption of CO2 and H2O [52]. The initial spectrum and the spectra with the double plate arrangements can be seen in figure 12. The spectral hole at 4.2–4.3 µm is due to CO2 absorption in air, while the modulation at 2.6–2.7 µm is caused by the absorption of H2O vapor in the air of the laboratory (40% relative humidity) [52]. The FTL pulse durations corresponding to the BaF2-KBr (red), BaF2-Si (orange) and KBr-Si (purple) double plate arrangements were 16.9 fs, 16.7 fs and 18.2 fs, respectively. KBr was found to be very sensitive to laser-induced damage and since it is also hygroscopic, using the BaF2-Si double plate combination proved to be the most advantageous choice. Further details are included in table 3. The transmission of the BaF2-Si double plate combination was 83.6% including both linear and nonlinear losses, yielding 9.15 W right after the collimating lens (f = 250 mm) of the broadening unit.
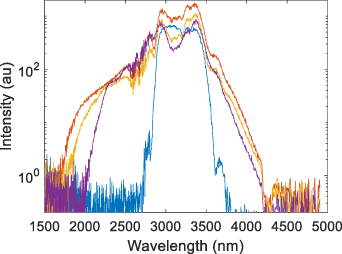
Figure 12. The initial spectrum (blue) before post-compression (OPCPA). The broadened spectra after the BaF2-KBr (red), the BaF2-Si (orange) and the KBr-Si (purple) plate combinations.
Download figure:
Standard image High-resolution imageTable 3. Measured parameters of the post-compression setup.
| Material | BaF2 | Si |
|---|---|---|
| Thickness (mm) | 3 | 1 |
| Position (mm) a | 530 | 650 |
| Intensity (GW cm−2) b | 336.2 | 21.2 |
| Loss (%) | 8.9 | 8.2 |
| FTL (fs) c | 26.6 | 16.7 |
a The position between the focusing mirror and the first surface of the plates. b The intensity on the plates. c The FTL of the spectrum after the plates.
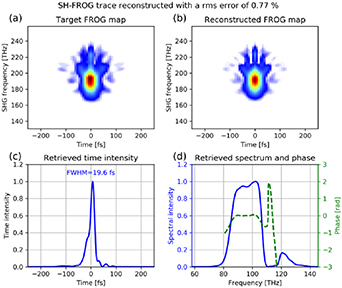
At first, the pulses were recompressed without DMs, relying solely on bulk compression. The best result was obtained by propagating the laser through a 2 mm thick CaF2 plate. This resulted in the compression of the pulses to 25.5 fs FWHM, which corresponds to less than two and a half optical cycles at 3170 nm. Next, we tested the compression with the combination of a bulk material and the DMs. With the help of three DMs aligned at 10°, 25° and 25° AOI, respectively, and a 5 mm thick CaF2 plate, the laser pulses were compressed to 19.6 fs FWHM, which is less than two optical cycles at this central wavelength. Among the several combinations tested systematically, the above arrangement provided the shortest measured pulse duration. The reflection losses of the CaF2 window (5.9%) and the three DMs (4.4%) totaled 10.0%. After recompression, we had an average power of 8.24 W. Pulse duration (19.6 fs) was measured by a locally developed, all-reflective SHG FROG (described in our earlier work [18]), the results of which can be seen in figure 13. The main peak contains 96.2% of the pulse energy. The peak power of the laser pulses improved from 3.10 GW (MIR OPCPA output) to 4.04 GW (post-compressed output), yielding an increment of 30.3%. The output peak power is a significant improvement compared to our earlier work [18].
Figure 13. Pulse duration characterization with the SHG FROG device: (a) measured trace, (b) reconstructed trace, (c) reconstructed temporal profile and (d) reconstructed spectral intensity and phase.
Download figure:
Standard image High-resolution image
The stability of the presented post-compression stage was tested in a four-hour-long period. During that time the average power, the spectrum and the CEP (with active feedback loop) were monitored. The root mean square error (RMSE) of the power was 2.1%, while that of the CEP was 240 mrad for the entire four-hour measurement. The corresponding values of the OPCPA output (RMSE: 0.7% and CEP RMSE: 65 mrad) are somewhat more stable, however it is an acceptable trade-off considering the shortened pulse duration and the increased peak power. The variation of the FTL of the spectrum was less than 1 fs during the same period, resulting in a stable pulse duration over hours. The above specifications make the post-compressed MIR output extremely attractive for future user experiments.
7. Conclusion
This work presents the SH-SRI technique, the key of which is SH generation, which allows for high resolution GD retrieval by shifting detection to the NIR regime instead of the MIR, where spectrometers with limited resolution are available only. This scheme notably improves measurement accuracy. The performance of the conventional and the SH-SRI method was compared by testing well-known optical windows transparent in the MIR, and it was found that the latter gives significantly better results in terms of RMSD and STD. The GD curve of DMs was measured using the SH-SRI technique, which resulted in excellent agreement between the designed and the measured values. Employing the DMs in the post-compression stage of our MIR OPCPA laser system resulted in 19.6 fs long, 82.4 µJ energy pulses at a central wavelength of 3170 nm. This translates to less than two optical cycles at the central wavelength. The presented post-compressed pulses are available for potential user experiments at the ELI-ALPS user facility.
Acknowledgments
The ELI-ALPS project (GINOP-2.3.6-15-2015-00001) is supported by the European Union and co-financed by the European Regional Development Fund.
Data availability statement
The data generated and/or analyzed during the current study are not publicly available for legal/ethical reasons but are available from the corresponding author on reasonable request.