

Abstract
We observed the spatial and temporal changes of the electron density (ne) and the electron temperature (Te) of hydrogen plasmas around a laser-produced Sn plasma EUV source. The plasma parameters were measured by the laser Thomson scattering (LTS) method. In the experiment, the Sn plasmas are produced in H2 gas at a pressure of 50–200 Pa and the hydrogen plasmas were induced by radiation from the Sn plasmas. The LTS measurements were performed at distances 30–90 mm away from the Sn plasmas. In all cases, the strong bremsstrahlung radiation of the Sn plasmas easily overwhelmed the weak LTS signals. To suppress noise due to the radiation, the solid angle of radiation from the Sn plasmas was restricted. The experimental results show that the ne was in the order of 1017 m−3 and Te was around 0.7 eV.
Export citation and abstract BibTeX RIS
1. Introduction
To realize miniaturization in semiconductor manufacturing technology, the development of EUV exposure equipment is in progress. EUV lithography is performed at a wavelength of 13.5 nm, which is one-tenth of or less than the wavelength of exposure using an existing ArF laser light source (193 nm). 1–3) Laser-produced plasmas with tin (Sn-LPPs) are used to obtain 13.5 nm of radiation. A reflective optical element with a large diameter (EUV collector) is installed at a location near the hot dense Sn-LPPs 4–6) to transmit the in-band EUV (13.5 nm ±1% width) to the subsequent exposure apparatus.
Sn-LPPs generate not only radiation, but also dust (debris) in the form of fine particles, ions, and neutral atoms. Sn debris can significantly deteriorate the reflectance of EUV collector. To protect the collector optics, various techniques for debris mitigation are being developed, e.g. collecting ions via a magnetic field, stopping and exhausting debris using background gas, and the two techniques combined. 7–10) In practice, hydrogen gas with pressures of 1–10 Pa is used as a background gas because of its low EUV absoption. 11) A higher pressure would be appropriate to stop debris more efficiently.
Around the EUV light source, the background gas is photoionized by radiation from dense Sn plasmas, then hydrogen radicals are generated. 12) Subsequently, the Sn deposited on the EUV collector surface can be etched through a chemical reaction between a Sn atom and four hydrogen atomic radicals, as follows: 13)

Here SnH4 is a volatile molecule. It has been reported that 90 000 hydrogen atoms are necessary to produce one SnH4 molecule. 14) Also, it has been confirmed that the etching rate is accelerated when hydrogen ions are involved. 15,16) To investigate the etching process on the surface of EUV collector, information of electron density (ne) and electron temperature (Te) is prerequisite, because ne and Te govern the production processes of ions and radicals.
Horst et al. performed line-averaged ne measurement of EUV-induced hydrogen plasmas using microwave cavity resonance spectroscopy (MCRS). 17–19) In their experiment, a wavelength region was limited to be 10–20 nm using bandpass filters. However, a significant amount of vacuum ultraviolet (VUV) light has been confirmed in radiation from Sn-LPPs, 20–22) whose photoionization cross-section is much larger than in-band EUV (λ = 13.5 nm ±1%). Therefore, the measurements should be performed without wavelength limitation. In addition, Te cannot be measured using MCRS.
On the other hand, in this study, we used laser Thomson scattering (LTS) to determine local values of ne and Te of photoionized hydrogen plasmas produced by radiations from Sn-LPPs with no wavelength filter. The plasmas were produced using solid Sn and nano-second pulsed Nd:YAG laser (λ = 1064 nm) with intensity of 2.2 × 10⁹ W cm−2. In the measurement, not only the stray light from the probing laser, but also the strong radiation from the dense and multi-ionized Sn plasma became a big problem. As described in the experimental section, these noises were successfully reduced, and clear LTS signals were obtained.
The important points of this study are as follows:
- 1.Temporal evolutions, spatial profiles, and pressure dependences of ne and Te were revealed for the first time using the LTS measurements. The measured ranges of ne and Te were 7.9 × 10¹⁶–2.4 × 10¹⁸ m−3 and 0.3–1.1 eV, respectively.
- 2.The LTS results imply that ne was not determined only by the EUV radiation. i.e. the VUV radiation, whose photoionization cross-section is much higher than that of the EUV, would play an important role to determine the ne profiles.
This paper is organized as follows:
In the Method section, an outline of the LTS is provided. The Experimental section describes the experimental equipment used for Sn-LPP generation and LTS measurement. In the Results and Discussion section, LTS measurement results of hydrogen plasma generated via Sn-LPP radiation are shown. Finally, the final section summarizes this study.
2. Experimental methods
2.1. Thomson scattering (TS)
TS is characterized by the parameter  where k is the absolute value of the differential wavenumber vector
k
, which is determined by the wavenumber vector
where k is the absolute value of the differential wavenumber vector
k
, which is determined by the wavenumber vector  of the incident laser and the wavenumber vector
  of the scattered light. The relationships among
 and
and  is determined by the arrangement of the experimental setup and is expressed as
 is the Debye length of the plasma. When
  scattering is caused by individually moving electrons. This regime, known as noncollective scattering, is the regime in which this study was performed.
23) The scattered light intensity is proportional to
scattering is caused by individually moving electrons. This regime, known as noncollective scattering, is the regime in which this study was performed.
23) The scattered light intensity is proportional to  Therefore, the absolute value of
  can be estimated by the absolute calibration of the detection system. The spectrum of the scattered light spreads based on Doppler broadening due to the thermal motion of electrons, and its spectral distribution is a one-dimensional projection of the electron velocity distribution function (EVDF) in the
k
-direction. The relationship between the Doppler shift and the
k
-direction component of the electron velocity
can be estimated by the absolute calibration of the detection system. The spectrum of the scattered light spreads based on Doppler broadening due to the thermal motion of electrons, and its spectral distribution is a one-dimensional projection of the electron velocity distribution function (EVDF) in the
k
-direction. The relationship between the Doppler shift and the
k
-direction component of the electron velocity  is expressed as

where c is the speed of light, λ0 the wavelength of the probe laser,  the difference in wavelength λ0, and θ the scattering angle.
On the other hand, when  the collective behavior of electrons affects scattering, and the scattered light spectrum is composed of ion and electron terms; moreover, the spectral shape does not directly reflect the EVDF. This regime is known as collective scattering, which is not relevant to this study. A detailed description of collective scattering is available in previous papers contributed by the authors.
24–26)
the collective behavior of electrons affects scattering, and the scattered light spectrum is composed of ion and electron terms; moreover, the spectral shape does not directly reflect the EVDF. This regime is known as collective scattering, which is not relevant to this study. A detailed description of collective scattering is available in previous papers contributed by the authors.
24–26)
2.2. Experimental setup
2.2.1. Generation of Sn-LPP
Figure 1(a) shows the configuration (or overview) of the Sn-LPP generation system. The origin of the x-axis (x = 0) is defined as the surface of the Sn plate.
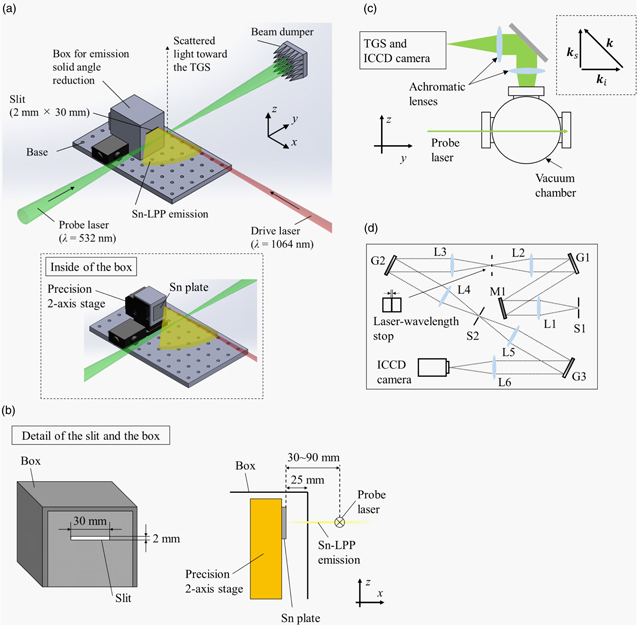
Fig. 1. (Color online) (a) Configuration of Sn-LPP generation system. (b) Details of box and slit for broad Sn-LPP emission reduction. (c) LTS system and relationships among ki-, ks-, and k-directions. (d) Optical setup of TGS.
Download figure:
Standard image High-resolution imageSn-LPP was generated inside the vacuum chamber, which was evacuated to 10−2 Pa or less. Hydrogen gas was introduced into the chamber to achieve a H2 pressure (PH2) of 50–200 Pa. The hydrogen flow rate was set to 50 sccm. To produce Sn-plasmas, the fundamental wave of Nd:YAG laser (Continuum, Surelite-II, wavelength 1064 nm, energy 200 mJ, pulse width 11.8 ns, repetition frequency 10 Hz) was used. The spot of the laser was 1 mm in diameter, and the intensity was 2.2 × 10⁹ W cm−2. The solid Sn target (50 mm × 50 mm × 1 mm thickness) installed in the chamber was finely moved in the y- and z- directions at a constant speed (0.5 m s−1) using a precision stage control system. The EUV energy from the plasma was measured using a calibrated EUV photodetector, which was composed of a spectral purify filter, a narrow-band EUV multilayer mirror, and a photodetector, each calibrated by Physikalisch-Technische Bundesanstalt. 27–29) It was confirmed that the conversion efficiency (CE) from the laser pulse to the in-band EUV (13.5 nm ±1%) was 2%/2π sr, by using the detector. Figure 1(b) indicates a detail of a slit and a box inside the plasma chamber depicted in Fig. 1(a), with which the radiation from the Sn plasma achieving to the LTS measurement position can be limited, as described later in Sect. 3.1.1. Figure 1(c) is the side view of the vacuum chamber and the LTS system.
2.2.2. LTS system
For the LTS measurements, the second harmonic of the Nd:YAG laser (Continuum, Surelite-II, wavelength 532 nm  laser energy 300 mJ, pulse width 8 ns, repetition frequency 10 Hz) was used as the probing laser. Two cylindrical lenses were used to focus the probing laser. The spot size at the measurement position was 5 mm in the z-direction and 0.2 mm in the x-direction, i.e. the laser intensity was 3.8 × 10⁹ W cm−2 and a spatial resolution to the x-direction was 0.2 mm. To obtain spatial profiles of ne and Te, the Sn target, the box with the slit, and the driving laser were moved to the x-direction.
The timing of the plasma generation and the probing laser were synchronized using a delay pulse generator (Stanford Research Systems, DG-645). In this study, 0 ns (t = 0) was set as the time when the driving laser pulse reached its peak.
LTS signals at an angle of 90° with respect to the incident angle of the probing laser were collected and focused on the entrance slit of a custom-made triple grating spectrometer (TGS). As shown in Fig. 1(d), the TGS consists of six achromatic lenses (L1–L5, f = 220 mm; L6, f = 250 mm), a mirror (M1), three diffraction gratings (G1–G3, 2400 grooves mm−1), an entrance slit (S1, width: 0.2 mm), an intermediate slit (S2, width: 0.2 mm), and a reverse slit (width: 0.5 mm) to block stray light, which is called as the laser-wavelength stop in this study. An intensified CCD (ICCD) camera (Princeton Instruments, PI-MAX4, quantum efficiency at λ0 of 45%, 1024 × 1024 pixels, pixel size 13 μm × 13 μm, and gate width 5 ns) was used as the detector. A spectrum resolution of the TGS was 0.2 nm full-width at half-maximum and a sufficient stray-light rejection at ±0.3 nm from λ0 were achieved. The time resolution of the measurement was 5 ns, which was determined by the gate width of the ICCD camera. To improve the signal-to-noise (S/N) ratio, the TS signals were spatially integrated over 5.2 mm along the probe laser (Y direction), and the TS signals from 1000 laser shots were accumulated.
As shown in Fig. 1(b), the radiation from the Sn plasma that can reach the measurement position was strictly limited using the box with the slit. This limitation was useful in suppressing noise due to radiation, as will be explained in detail in the next section.
3. Results and discussion
3.1. Results
3.1.1. Improvement of S/N ratio of LTS spectra
After the first try of the LTS measurement, it was found that the strong bremsstrahlung radiation from the dense Sn plasmas produced at the target surface (ne ∼ 1025 m−3, average ionic charge ∼10)
24) easily overwhelmed the weak LTS signals. Figures 2(a)–2(c) depict typical relationships between the radiation and the LTS signals. Figure 2(a) was measured without the probing laser, i.e. the spectrum contains only the radiation from the Sn plasma. Note that the spectrum at −0.5 nm < Δλ < 0.5 nm was cut by the laser-wavelength stop installed in the TGS. Figure 2(b) was measured with the probe laser, i.e. the spectrum consists of both the radiation and the LTS. The LTS spectrum can be extracted by subtracting the spectrum of Fig. 2(b) from that of Fig. 2(a), as to be shown in Fig. 2(c). However, since the radiation signal was much larger than that of the LTS, the extracted LTS spectrum includes a significant statistical error. As a result, it is difficult to determine ne and Te accurately. To improve the S/N ratio, the box with the slit as shown in Fig. 1(b) was set inside the chamber, with which the radiation from the Sn plasma achieving to the LTS measurement positions (30 mm < x < 90 mm) was strictly limited. Using this box, the radiation spectrum [Fig. 2(d)] and the spectrum including both the radiation and the LTS signal [Fig. 2(e)] were measured again. As can be seen from these figures, the radiation signal was extremely reduced. Then, the extracted LTS signal became clear as shown in Fig. 2(f). After that, all the LTS results in this study were performed by using the box to improve the S/N ratio. In Fig. 3, the LTS spectrum shown in Fig. 2(f) is plotted in a logarithmic scale against  where
where  is proportional to the energy of the electrons. As shown in this figure, The LTS spectrum is linear at 0.5 nm2 <
  < 2 nm2, i.e. the electron energy distribution function was Maxwellian in this energy range. The Te was determined to be 0.8 eV by a Gaussian fitting curve. The ne was determined to be 6.0 × 10¹⁷ m−3 by the signal intensity of the LTS spectrum. In the following sections, Te and ne were determined in the same manner.
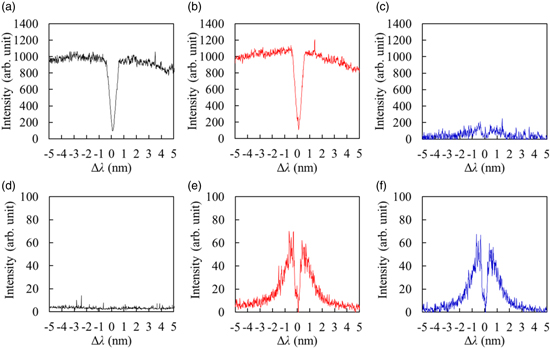
Fig. 2. (Color online) Spectrum measured at x = 50 mm and a hydrogen pressure of 200 Pa. (a) Radiation spectrum from the Sn plasma. (b) Radiation spectrum and LTS spectrum. (c) LTS signal extracted from (b). (d) Radiation spectrum and (e) spectrum including both radiation and LTS signal measured with the box. (f) extracted LTS signal by subtracting (d) from (e).
Download figure:
Standard image High-resolution image
Fig. 3. (Color online) The LTS spectrum [same data as shown in Fig. 2(f)] plotted in a logarithmic scale against  with a Gaussian fitting curve.
Download figure:
Standard image High-resolution image3.1.2. Temporal evolutions of ne and Te
Figures 4(a) and 4(b) show the temporal evolutions of ne and Te at x = 50 mm and H2 gas pressure of 200 Pa. We confirmed that there was no LTS signal when the chamber was in vacuum condition. In addition, it was also confirmed that there was no signal from hydrogen gas without the LPPs. As shown in these figures, both the ne and Te reached their peak values at t = 30 ns. At t > 30 ns, however, the temporal evolutions of ne and Te were different from each other completely; ne was almost constant, whereas Te decreased smoothly. The measurements were performed three times at t = 10 ns, six times at t = 20 ns, and one time for the other timings. For the results measured at t = 10 and 20 ns, the averaged values are plotted in Figs. 4(a) and 4(b), and the error bars illustrate the standard deviations of the measurements. For the other timings, uncertainties of the measured values were estimated to be at most within ±15%, which were determined by standard deviations of the parameters of the spectral fitting curves.

Fig. 4. (Color online) Temporal evolutions of (a) ne and (b) Te measured at x = 50 mm and H2 pressure of 200 Pa.
Download figure:
Standard image High-resolution image3.1.3. Pressure dependence and spatial profiles of ne and Te
Figures 5(a) and 5(b) depict the spatial profiles of ne and Te, respectively. For the measurements, the H2 pressure was changed to 50, 100, and 200 Pa. The LTS was performed at the positions of x = 30, 50, 70, and 90 mm and at the time of t = 100 ns. Various fitting curves in Fig. 5(a) will be explained in the discussion part later.

Fig. 5. (Color online) Spatial distributions of (a) ne and (b) Te measured at t = 100 ns. In Fig. 5(a), the expressions of the power fits are ne = 1.24 × 10²² x−2.66 for 50 Pa, ne = 1.33 × 10²² x−2.62 for 100 Pa, ne = 1.12 × 10²² x−2.49 for 200 Pa, respectively.
Download figure:
Standard image High-resolution image3.2. Discussion
3.2.1. Validity of ne and Te
The ne obtained in this study were in the range of 1017–1018 m−3. These values are much higher than those in the previous study, in which ne of the order of 1014 m−3 was reported using the MCRS method. 17) To confirm the validity of our results, we roughly estimated the electron density yielded through the photoionization process (ne_pi) using the following equation: 17)

where  is the ionization cross-section of H2,
  the background hydrogen density,
  the EUV pulse energy, x the distance from the Sn plasma, and
  the photon energy of the EUV light. These values are listed in Table I. We assumed that 30% of the drive-laser energy was converted to radiations in a range of 10 nm to 20 nm wavelength, i.e. EEUV = 0.06 J. This assumption is based on the measured in-band EUV (13.5 nm ± 1% wavelength) energy (4 mJ) and a previous study performed by George et al.
30) They measured absolute energy of radiation from Sn-LPPs in a wavelength range of 2–60 nm with various driving laser intensity. According to their results, the total energy in the "whole EUV range," which is defined as a wavelength range of 10–20 nm in this study, is estimated to be 15 times larger than that in the in-band EUV for our experiment condition, in which the intensity of the drive-laser was 2.2 × 10⁹ W cm−2. Using the values listed in Table I, ne_pi was calculated to 8 × 10¹⁶ m−3. The second process which should be considered is electron impact ionization. The single ionization energy of the hydrogen molecule is 15.4 eV.
31) Therefore, the electron yielded through the photoionization can yield additional electrons through electron impact ionization. For example, a photon at λ = 13.5 nm having 92 eV energy can produce at most five additional electrons through electron impact ionization. Therefore, it is concluded that the order of ne obtained by the LTS is reasonable.
the photon energy of the EUV light. These values are listed in Table I. We assumed that 30% of the drive-laser energy was converted to radiations in a range of 10 nm to 20 nm wavelength, i.e. EEUV = 0.06 J. This assumption is based on the measured in-band EUV (13.5 nm ± 1% wavelength) energy (4 mJ) and a previous study performed by George et al.
30) They measured absolute energy of radiation from Sn-LPPs in a wavelength range of 2–60 nm with various driving laser intensity. According to their results, the total energy in the "whole EUV range," which is defined as a wavelength range of 10–20 nm in this study, is estimated to be 15 times larger than that in the in-band EUV for our experiment condition, in which the intensity of the drive-laser was 2.2 × 10⁹ W cm−2. Using the values listed in Table I, ne_pi was calculated to 8 × 10¹⁶ m−3. The second process which should be considered is electron impact ionization. The single ionization energy of the hydrogen molecule is 15.4 eV.
31) Therefore, the electron yielded through the photoionization can yield additional electrons through electron impact ionization. For example, a photon at λ = 13.5 nm having 92 eV energy can produce at most five additional electrons through electron impact ionization. Therefore, it is concluded that the order of ne obtained by the LTS is reasonable.
Table I. Values used for ne estimation.
| Symbol | Value | Unit |
|---|---|---|
| σpi | 6.0 × 10⁻²⁴ | m2 |
| EEUV | 0.06 | J |
| Eph | 92 | eV |
| x | 0.05 | m |
| nα | 5.0 × 10²² | m−3 |
With regard to Te, only simulated values have been reported. The calculated Te values are in the range of 0.5–4.8 eV. 32) Meanwhile, the value of Te obtained in the experiment was 0.3–1.1 eV. Therefore, the measured Te was on the same order as that calculated in a previous study.
3.2.2. Temporal evolutions of ne and Te
Next, the temporal evolution of ne is discussed. As shown in Fig. 4, the decay speed of ne was much slower than that of Te. This tendency is reasonable considering the timescales of recombination and diffusion processes. The order of the recombination time was 102 s,
19) and the time scale of ambipolar diffusion  can be evaluated from Eq. (4):
33)
can be evaluated from Eq. (4):
33)

with R and H the radius and height of the vacuum chamber and  the ambipolar diffusion coefficient. Assuming that the photoionized hydrogen plasma is weakly ionized and Te is matched higher than ion temperature Ti

 can be calculated from the ion mobility
  and Te,
34)
and Te,
34)

with  the Boltzmann constant, e the elementary charge, respectively. Under the condition of our experiment,
  was estimated on the order of 1–10 m2 V−1 s−1 for atomic-hydrogen ions (H+) and molecular hydrogen ions (H2
+).
35) Based on estimated
was estimated on the order of 1–10 m2 V−1 s−1 for atomic-hydrogen ions (H+) and molecular hydrogen ions (H2
+).
35) Based on estimated  and Te obtained in the experiment, the
  was estimated in the order of 1–10 m2 s−1. As a result,
  was in the order of 10−5–10−4 s, which was much longer than the time range of the LTS. Meanwhile, the order of relaxation time between the electrons and hydrogen molecules was calculated to be 10−7 s based on the measured Te; it is of the same order as the LTS measurement in this study. Therefore, it is concluded that the temporal evolution of ne and Te measured in this study is reasonable.
3.2.3. Spatial profiles of ne
According to Eq. (3), electron density will be inversely proportional to the square of the distance x due to decreases of the photon flux. However, as shown in Fig. 5(a), the measured dne/dx were smaller than −2, i.e. the decaying ratio of ne is more rapidly than that expected from Eq. (3). Note that the decaying of the EUV radiation through the absorption by hydrogen is negligible, e.g. the absorption length, which is calculated as 1/(n α σpi), is around 3 m when H2 pressure is 200 Pa, and the absorption ratio at x = 90 mm is less than 3%. To explain the measured ne profiles, we considered photoionization processes by VUV radiation, whose absorption cross-section is much larger than that of the EUV region as shown in Table II. 36) It has been reported that Sn-LPPs yield not only EUV but also broadband VUV radiations. 21,22) Gambino et al. measured CEs of radiations to the EUV and the VUV regions. 22) Although their experiment was performed with a higher laser intensity (6.9 × 10¹⁰–1.24 × 10¹¹ W cm−2) than that in our experiment (2.2 × 10⁹ W cm−2), we referred to their results. Table III shows the CEs in each wavelength region, which were used to discuss our LTS results. Figure 6 shows revised calculated curves and the LTS results, which are the same as that shown in Fig. 5(a). The revised curves were produced as follows: first, ne measured at x = 30 mm was used as the initial values for the calculation. Second, using the photo-absorption cross-section σpi(λ) in Table II, ne_pi in Eq. (3) were calculated for each wavelength region. Third, electrons produced by electron impact ionization processes were added in the same manner explained in the Sect. 3.2.1. As shown in Fig. 6, the ne profiles are well explained by the revised curves.
Table II. Photo-absorption cross-sections of hydrogen molecule. 36)
| Wavelength | Absorption cross-section |
|---|---|
| 10 nm | 6 × 10⁻²⁴ m2 |
| 50 nm | 7 × 10⁻²² m2 |
| 70 nm | 1 × 10⁻²¹ m2 |
| 90 nm | 5 × 10⁻²¹ m2 |
Table III. Expected conversion efficiency from laser pulse energy to emission energy.
| Wavelength range | Conversion efficiency |
|---|---|
| 10–20 nm | 30% |
| 40–60 nm | 0.24% |
| 60–80 nm | 0.48% |
| 80–100 nm | 0.24% |

Fig. 6. (Color online) Comparison between calculated (dashed line) and measured (point) spatial distributions of ne. Calculation was based on expected EUV/VUV power.
Download figure:
Standard image High-resolution image
3.2.4. Improvement of S/N ratio
Next, the S/N ratio before and after the emission suppression is discussed. The dominant noise is expected to be the statistical shot noise both before and after Sn plasma emission suppression, and this noise is determined by the square root of the number of photoelectrons.
37) The total shot noise is expressed as  and the S/N ratio is determined by
  where
where  is the number of LTS photoelectrons and
  is the number of emission photoelectrons. As shown in Fig. 3, the LTS signal intensity was estimated to be one-half of
  = 0 nm at
  = 1.12 nm. The total number of photoelectrons of the LTS signal detected by the photo cathode per laser shot was 27, which was estimated from the configuration of the optical system used described in the Sect. 2.2. Because the scattered light intensity per CCD pixel was small, CCD pixels were combined (binned) over 9 CCD pixels in the wavelength direction and 401 pixels in the Y-direction of the space, to improve the S/N ratio. As a result, the region of 9 pixel × 401 pixel (108 μm × 5.2 mm) was used as a single light receiving region. The number of LTS photons counted at
  = 1.12 nm was 0.6 per laser shot. The signal was integrated over 1000 laser shots; therefore, the total number of LTS photons at
  = 1.12 nm was 600. Similarly, the number of photons emitted at this wavelength was 22 per laser shot without Sn plasma emission suppression, and the integrated value over 1000 laser shots was 2.2 × 10⁴. In this case, the shot noise was 152, and the S/N ratio was 4.0. On the other hand, when light emission was suppressed, the number of photons emitted at
  = 1.12 nm was 0.053 per laser shot, and the integrated value over 1000 laser shots was 53. In this case, the shot noise reduced to 25.6, and the S/N ratio improved to 23.
4. Conclusions
In this study, LTS measurements were applied to hydrogen plasmas, which were induced by radiation from Sn-LPPs produced for EUV light sources, for the first time. It was found that the noise signal due to the bremsstrahlung light from the highly ionized Sn plasmas readily overwhelmed the weak LTS signal. We obtained clear LTS spectra with a typical S/N ratio of 23 by reducing the amount of bremsstrahlung light.
In our experiment, the Sn plasmas were generated in H2 gas at a pressure of 50–200 Pa by YAG laser with an intensity of 2.2 × 10⁹ W cm−2. The LTS measurements were performed at distances 30–90 mm away from the Sn plasmas. The ranges of the measured ne and Te were 7.9 × 10¹⁶–2.4 × 10¹⁸ m−3 and 0.3–1.1 eV, respectively. Furthermore, the temporal evolution, pressure dependence, and spatial distribution of hydrogen plasmas were clarified. The LTS results indicate that the broadband VUV radiations play an important role to determine the ne profiles.