

Abstract
We measured Raman spectra in a cooking process of rice grains and applied principal component analysis (PCA) to confirm binary states of starch: ordered and disordered states of starch in the cooking process by analytically separating sharper and broader components for the bands around 870 and 940 cm−1 due to starch. These sharper and broader components were optimized by non-negative matrix factorization (NMF), based on the PCA. The ratio defined using these two components clearly distinguished before/after the cooking of rice grains. The ratio can be an effective indicator to estimate the degree of cooking.
Export citation and abstract BibTeX RIS
Research on live cells, biomolecules, and biological tissues using a Raman microscope (bio-Raman research) became possible in 1990. 1) Through the recent progress of hardware, software, and the use of analytical methods, bio-Raman research has become a powerful and versatile analytical approach in cell biology. 2) Raman scattering is non-destructive, non-labeling, less water influenced, and multi-dimensional (i.e., the simultaneous detection of many chemical species.) These features are proper to observe life phenomena. Bio-Raman data is rich but complicated in information because a lot of species of Raman active biomolecules coexist in a live cell and some of these Raman signals are overlapped with one another. The size of bio-Raman data is usually large. Empirically, the number of spectra frequently reaches more than a thousand to confirm life phenomena.
As bio-Raman information is rich, large, and complicated, it is difficult to analyze bio-Raman data directly. Advanced spectral analytical techniques 3–8) such as principal component analysis (PCA) 3,4) and non-negative matrix factorization (NMF) 5,6) are effective to disentangle complicated and large-sized spectral information. These analytical methods have been frequently used and sophisticated in the bio-Raman research field.
Starch, as the main component of rice grains, 9) is an attractive candidate for the recently advanced bio-Raman analysis, based on the comprehensive research findings that have been developed by traditional analytical tools. 10–14) Starch, a semicrystalline polymer, is composed of amylose and amylopectin (these chemical species are similar to each other; for the cooking process, we considered that these two are changed in a synchronized manner; we, therefore, called them simply "starch").
For starch 15–17) and glucose units, 18) many research articles using vibration (Raman and infrared) spectroscopy have been reported. Meanwhile, so far, the temperature-dependent Raman spectra of white rice grains in water (that is, spectra of the cooking process of rice) have been investigated in a limited manner. 19) The possible reasons are that the spectral changes were too complicated and chaotic to interpret the spectral changes, in which unknown other chemical species coexist as well as starch.
Incorporating recent progress of bio-Raman research and the advanced spectral analytical techniques such as PCA and NMF, we will be capable of separating states of starch during cooking of rice and estimating whether the white rice is edible or not by detecting different states of starch; furthermore, we may link it to the difference in taste for cooked rice.
The purpose of this study is to detect different states of starch of white rice grains with water in the cooking process by bio-Raman measurements and spectral analysis of PCA and NMF.
Figure 1(a) shows 12 Raman spectra, Y o (ν, t), of white rice grains where t is the cooking time and ν is Raman shift. Experimental details were described in supplementary data. 12 Raman spectra were measured three times. All the 12 × 3 = 36 spectra, Y o (ν, j), where j = 1,2 ... m = 36, were shown in Fig. S1 (which is available online at stacks.iop.org/JJAP/60/060903/mmedia). The cooking time ended at t = 46 min (beeper rang); after this, the inside of the cooking machine was kept warm. It took around 20 min for measuring a spectrum; what we observed was the averaged state that the rice grain became cooling down. Pretreatments of spectra were already done, 20–24) that is, the background component of the polystyrene plate was removed from the observed Raman data; 20–22) the water spectrum was not subtracted; we executed baseline corrections 23) using the 4th-degree polynomials and the vector normalizations of spectra; to yield derivative spectra, we used the Savitzky-Golay method; 24) for a spectrum y, the vector normalization is y ← y/f, where f is the factor given by the "square root of the sum of squares" of the values at all the spectral channels of a spectrum. While the spectra in Fig. 1 looked starch-like, 15,16,18,25,26) some bands of the spectra showed irregular changes. Assignments for remarkable bands 15,27,28) were summarized in supplementary data.
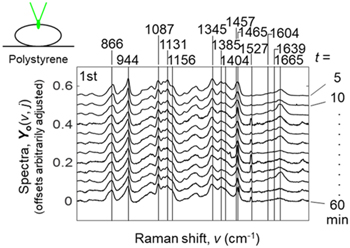
Fig. 1. (Color online) 12 Raman spectra of rice grains, Y o (ν, j), as a function of the cooking time, t (min).
Download figure:
Standard image High-resolution imageFigure 2(a) shows PCA results to the third principal component for the 12 × 3 = 36 Raman spectra in Fig. S1 in the supplementary data. First, Y o (ν, j) was mean centered to give Y (ν, j) = Y o (ν, j) A v (ν), where A v (ν) is the averaged spectrum for the index j; Then, Y was decomposed into the loading spectra, p 1 (ν), p 2 (ν), and p 3 (ν), and the scores, s1(j), s2(j), and s3(j), that is, Y (ν, j) = s1(j) p 1 (ν) + s2(j) p 2 (ν) + s3(j) p 3 (ν) + Residue. The contribution rates were 21.1%, 14.6%, 8.4%, 6.2%, 4.7%, 4.2% from the first to the sixth principal components, respectively; for lower principal components, the signal is rich; for higher principal components, noises are dominant where the contribution rate settles at a lower value.
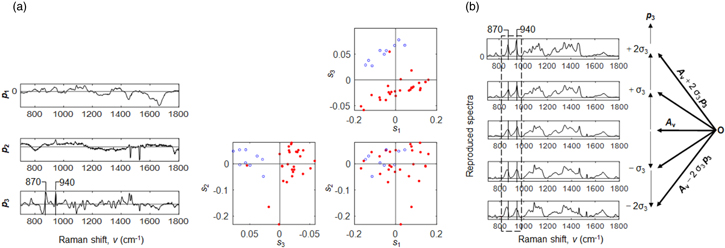
Fig. 2. (Color online) (a) PCA results for the 12 × 3 = 36 Raman spectra of Y o (ν, j) in Fig. S1 in the supplementary data. PCA loadings, p 1 , p 2 , and p 3 , and score scatter plots among s1, s2, and s3. Blue open circles are used for the cooking time of t = 5 to 15 min, while red solid circles are used for the cooking time of t = 20 to 60 min (b) Five redeveloped spectra, A v + 2σ3 p 3 , A v + σ3 p 3 , A v , A v − σ3 p 3 , and A v − 2σ3 p 3 , where A v is the averaged spectra of Y o and σ3 is the standard deviation value of the third score values, s3. The symbol O is the original point in the vector space before the mean centering of Y o .
Download figure:
Standard image High-resolution imageThe first loading spectrum, p 1 , gave positive peaks for the left side of the loading spectrum as well as negative peaks for the right side; the second loading spectrum, p 2 , gave two remarkable negative sharp bands between 1400 and 1600 cm−1 (the two sharp peaks at 1465 cm−1 and 1527 cm−1 are probably due to the background components from the instrument or due to the minute components of the bran surrounding a white rice grain); the third loading spectrum, p 3 , gave multiple positive peaks as well as multiple negative peaks. In the scatter plots of scores s1, s2, and s3, open and blue circles are used for the cooking time of t = 5 to 15 min of the cooking process, while solid red circles are used for the cooking time of t = 20 to 60 min. In the scatter plots of s1, s2, and s3, the s3 clearly distinguished these two groups, while the s1 and s2 do not distinguish them. The corresponding third loading spectrum, p 3 , showed multiple positive peaks as well as negative peaks, with these peaks overlapped with one another in a complicated manner.
Here, two Problems remained: (i) it is difficult to interpret the loading spectrum, p 3 , because of the heavily overlapped positive and negative signals; (ii) we do not know what physical states or chemical species contributed to distinguish the two groups of the blue open circles and the red solid circles. One of the reasons that cause the difficulty to interpret the third loading spectrum is that the averaged spectrum is removed before the calculation of PCA by the mean centering.
In Fig. 2(b), in order to interpret the third loading spectrum, p 3 , we added the averaged spectrum to the p 3 by changing the scaling factors, that is, A v + 2σ3 p 3 , A v + σ3 p 3 , A v , A v − σ3 p 3 , and A v − 2σ3 p 3 , where σ3 is the standard deviation value of the third score values, s3(j). Using these five redeveloped spectra, it is possible to interpret the third loading spectrum, p 3 , in an easier manner. Many peaks gave sharper bands when the third loading spectrum was added positively to the averaged spectrum, while they gave broader bands when added negatively.
Thus, for Problems, we consider that (i) there exist at least two components in the third loading spectrum, p 3 , that is, the positive sharper bands and the negative broader bands; (ii) the sharper bands correspond to the ordered state of starch, while the broader ones correspond to the disordered state of starch (as the broadening of the bands are caused by thermal motions of the long chains of starch losing the ordered state fixed by hydrogen bonds).
But these considerations are still ambiguous because some of the bands can be due to other chemical species such as protein and minute components of bran such as ferulic acid; because many bands are highly overlapped with one another.
In this regard, PCA was repeated for the smaller local region of 810 to 980 cm−1, because this region includes isolated two bands around 870 and 940 cm−1 due to starch, almost independent of bands due to other chemical species. Here, we recall that the band around 870 cm−1 due to the C- 1-H bending mode, the band around 940 cm−1 due to the skeletal mode involving α-(1 → 4) linkage (C–O–C); that is, this spectral region almost solely reflects information on starch. 15)
Figure 3(a) shows PCA results to the third component in the local region of 810 to 980 cm−1 of the 12 × 3 = 36 Raman spectra in Fig. S1, supplementary data, that is, Y '(ν, j) = s1'(j) p 1 '(ν) + s2'(j) p 2 '(ν) + s3'(j) p 3 '(ν) + Residue. The symbol ' was used for the smaller local region. The contribution rates were 23.0%, 17.9%, 8.1%, 6.3%, 4.4%, 3.7% from the first to the sixth principal components; the signal is rich in the first and second principal components. For higher principal components, noises are dominant where the contribution rate settles at a lower value.
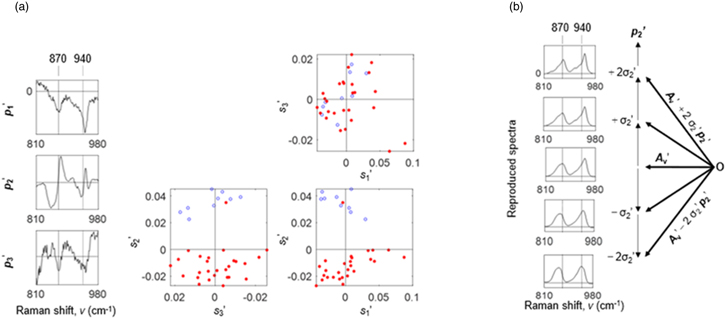
Fig. 3. (Color online) (a) PCA results for the 12 × 3 = 36 Raman spectra in the smaller local region of 810 to 980 cm−1 of Y o (ν, j) in Fig. 1. PCA loadings, p 1 ', p 2 ', and p 3 ', and score scatter plots among s1', s2', and s3'. Blue open circles are used for the cooking process of t = 5 to 15 min, while red solid circles are used for the cooking process of t = 20 to 60 min (b) Five redeveloped spectra, A v ' + 2σ2' p 2 ', A v ' + σ2' p 2 ', A v ', A v ' − σ2' p 3 ', and A v ' − 2σ2' p 2 ', where A v ' is the averaged spectrum of Y o ' and σ2' is the standard deviation value of the second score values, s2'.
Download figure:
Standard image High-resolution imageIn the scatter plots of s1', s2', and s3', the s2' clearly distinguished blue open (t = 5 to 15 min) from red solid circles (t = 20 to 60 min), while the s1' and s3' do not distinguish them. The third loading spectrum, p 3 , in Fig. 2(a) roughly corresponds to the second loading spectrum, p 2 ', in Fig. 3(a). The "third" in Fig. 2(a) became "second" in Fig. 3(a) as the local spectral region of 810 to 980 cm−1 almost solely reflects information on starch, reducing dimensions of signals of other chemical species including instrumental background components. Then, we added the averaged spectrum to the second loading spectrum, p 2 ', by changing the scaling factors, that is, A v ' + 2σ2' p 2 ', A v ' + σ2' p 2 ', A v ', A v ' − σ2' p 3 ', and A v ' − 2σ2' p 2 ', where σ2' is the standard deviation value of the second score values, s2'(j). The peaks at 875 and 945 cm−1 gave sharper bands when the second loading spectrum, p 2 ', was added positively to the averaged spectrum, while the peaks at 860 and 940 cm−1 gave broader bands when added negatively.
For the two bands around 870 and 940 cm−1 in the smaller spectral region of 810 to 980 cm−1, our considerations were true: there exist two states of starch, that is, one is sharper bands at 875 and 945 cm−1 corresponding to the ordered state of starch, while the other is broader bands at 860 and 940 cm−1 corresponding to the disordered state of starch.
Figure 4(a) shows the two spectra w 1 and w 2 optimized by non-negative matrix factorization (NMF) based on the initially set spectra, A v ' + 2σ2' p 2 ' and A v ' − 2σ2' p 2 '. NMF is the method where multiple spectra, Y , are factorized into spectra, W , and the scaling factors, H , that is, Y ≈ WH with all matrices Y , W , and H kept non-negative. 29,30) This non-negativity gives matrices easier to interpret especially for bio-chemical substances because the amounts of substances are always non-negative. Please see supplementary data for the detailed procedure about NMF. Y o ' was decomposed, that is, Y o '(ν, j) ≈ h1'(j) w 1 '(ν) + h2'(j) w 2 '(ν), where w 1 ' and w 2 ' are factorized spectra while h1' and h2' are the scaling factors.

Fig. 4. (Color online) (a) Solid lines: factorized spectral components, w 1 ' and w 2 ' by NMF; broken lines: initial settings of A v ' + 2σ2' p 2 ' and A v ' − 2σ2' p 2 ', based on PCA. (b) The ratio based on the factorized scaling factors of h1' and h2': r'(t) = h2' (t)/{h1'(t) + h2' (t)}.
Download figure:
Standard image High-resolution image
Figure 4(b) shows the plot, r'(t) = h2' (t)/{h1'(t) + h2' (t)}, where h1'(t) and h2'(t) are the scaling factors of Spectra w 1 ' and w 2 ', respectively; t is cooking time. The ratio r'(t) clearly showed the stepwise two states around 0.2 and 0.6 [please see supplementary data for the interpretation of r'(t)]. The ratio r'(t) can be used as an indicator to determine the texture (mainly, hardness or softness) of the cooked rice grains. We considered that the ordered state component corresponds to the hardness of the texture while the disordered state component corresponds to the softness of the texture. The lower r' value indicates that the rice is hard and inedible, while the higher r' indicates that the rice is soft enough to eat and digest.
In conclusion, binary states of starch of white rice grains were confirmed in the cooking process by bio-Raman measurements and spectral analysis of PCA and NMF. The ratio of the scaling factors defined between the two components due to the ordered and disordered states of rice grains clearly distinguished the cooking process of rice grains. This ratio can be an effective indicator to estimate whether cooking rice grains are edible or not. Also, the profile may be linked to estimate the deliciousness of cooked rice, because the profile will be unique to species of rice, be influenced by how to rinse and sharpen rice grains, and waiting time before the cooking. These findings in this article will be reported in a more comprehensive manner in the near future.