Collapse Analysis of a Transmission Tower-Line System Induced by Ice Shedding
 Jiaxiang Li
 Biao Wang
 Jian Sun1
 - 1Department of Civil Engineering, Northeastern University, Shenyang, China
- 2Civil Engineering and Applied Mechanics, McGill University, Montreal, QC, Canada
- 3Faculty of Infrastructure Engineering, Dalian University of Technology, Dalian, China
Ice shedding causes transmission lines to vibrate violently, which induces a sharp increase in the longitudinal unbalanced tension of the lines, even resulting in the progressive collapse of transmission towers in serious cases, which is a common ice-based disaster for transmission tower-line systems. Based on the actual engineering characteristics of a 500 kV transmission line taken as the research object, a finite element model of a two-tower, three-line system is established by commercial ANSYS finite element software. In the modeling process, the uniform mode method is used to introduce the initial defects, and the collapse caused by ice shedding and its influencing parameters are systematically studied. The results show that the higher the ice-shedding height is, the greater the threat of ice shedding to the system; furthermore, the greater the span is, the shorter the insulator length and the greater the dynamic response of the line; the impact of ice shedding should be considered in the design of transmission towers.
Introduction
As the physical electricity-carrying entities of the power transmission network, transmission lines often need to pass through severely cold areas, and as a result, ice may occasionally coat the conductors. When the temperature rises, this ice melts and falls off the line, causing the transmission line to vibrate; these vibrations can damage the transmission line and even cause its progressive collapse. Although the ice shedding effect was considered as unbalanced tension in the design codes [1–3], the accidents caused by ice shedding still occurs. For example, an investigation of the southern snow disaster in 2008 showed collapsed bases of 140,000 transmission towers below 110 kV; the bases of 1,000, 110–500 kV transmission towers collapsed; and the bases of 506,500 kV transmission towers fell, with the bases of 142 towers being damaged. Ultimately, ninety percent of all transmission tower collapses are caused by longitudinal unbalanced tension caused by uneven icing and uneven ice shedding [4]. With the development of the study on structural vibration control and structural healthy monitoring, these two methods are used to improve the safety operation of the transmission line [5–9]. To determine the key parameters for monitoring and controlling, the failure mechanism of the transmission line caused by ice-shedding should be studied.
The serious hazards imposed by ice shedding have attracted widespread attention from scholars worldwide. At present, the most common method for studying ice shedding problems is numerical simulation [10]. Kollar and Farzaneh [11–14] introduced a spacer bar into the conductor ice-shedding model, studied the ice shedding of the bundle conductor, and obtained the relationships between the maximum jump height and the ice thickness, initial tension, conductor spacing, and number of sub-conductors; a scale test verified the validity of the model, and the results showed that a spacer bar can effectively reduce the jump height of the conductor but has little effect on the torsion of the conductor. Because that the clearance reducing caused by ice-shedding could lead to electrical accident, the jump height is the one of the most concerned parameters for ice-shedding of transmission lines. Yan et al. [15] proposed a formula to predict the maximum jump height by fitting the numerical results between the maximum jump height and sag difference before and after ice shedding. Based on the conservation of energy and the geometrical relationship between the span and the swing of an insulator, Wu et al. [16] proposed a theoretical calculation method for the largest jump height of a transmission line; a comparison of the results with a finite element analysis revealed good agreement, and the theoretical method exhibited the advantages of both accuracy and convenience. Huang et al. [17] proposed a method to study ice shedding using a scale test and verified the effectiveness of the proposed method by comparing the results with two full-scale tests. However, the paper mentioned above ignored the stiffness of ice, and assumed that the ice on the conductor fell off in a certain pattern that was unrealistic. To obtain the real dynamic response of the conductor induced by ice-shedding, the ice failure model should be considered. Kalman et al. [18] first introduced the ice failure model to predict the ice shedding. In their study, if the plastic strain is greater than 10−10, the element of ice will be killed to simulate ice shedding. Mirshafiei et al. [19, 20] proposed another ice failure criterion. In Mirshafiei’s criterion, the ice would have been shed if the ice strain reached the maximum effective plastic strain. The numerical results showed that Mirshafiei’s criterion had a better performance in prediction of the ice shedding by comparison with the experimental results than Kalman’s criterion. However, these two ice failure criterions both overrated the ice-shedding rate. Ji et al. [21–24] proposed a new criterion predicting the ice-shedding rate better. They thought that ice breakage and ice detachment were two different stages. Only ice detachment would occur if the inertia forces overcoming the adhesive/cohesive forces on the ice. After that, they studied influence parameters in the ice shedding progress and give suggestions to improve the de-icing efficiency of the shock-load method and reduce the adverse transient effects on the line components [25]. Yang et al. [26, 27] performed the numerical simulation to study the dynamic response of transmission tower-line system and found that the interphase space could effectively decrease the dynamic response of the tower-line system; dynamic amplifying effect of the vertical load from ice shedding conductors cannot be ignored.
Transmission towers are an important part of the transmission tower-line system, as they play the crucial role of supporting the transmission lines. However, the role of transmission towers in the ice-shedding response has been ignored in all research to date, with few studies considering the influence of ice-shedding on transmission towers response. Shen et al. [28, 29] established a tower-line system model and analyzed the vibration characteristics caused by the ice shedding of the transmission tower-line system. The results showed that the shear and bending moment of the transmission tower base were zero before ice shedding but increased significantly thereafter, and the closer the ice-shedding is, the greater the basal shear and moment. Additionally, a comparison with a two-speed conductor model test verified the impact of ice shedding on the transmission tower. However, the above research is limited to the elastic stage of the transmission lines and does not involve the collapse of transmission lines caused by ice shedding. In fact, more and more attentions are attractive to tower collapse [30–34].
In summary, a paucity of studies has considered the collapse and damage of transmission lines due to icing and ice shedding under the coupling of transmission towers and lines. In this paper, using a numerical method to establish the transmission line model and considering transmission towers with initial defects, the dynamic response of the transmission tower-line system induced by ice shedding is studied; furthermore, the damage to the transmission tower and the influencing parameters are analyzed.
Establishment of the Finite Element Model
Model Parameters
In this paper, a finite element model is established for a transmission tower-line system with two towers and three lines. The conductors at both ends of the model are consolidated. The model of the four-bundle conductor in the line is LGJ-630/45, the model of the ground conductor is LB20A-150, and the mechanical parameters are shown in Table 1.
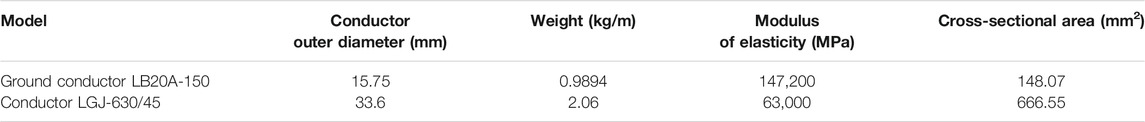
TABLE 1. Mechanical parameters of the conductor.
To simplify the modeling process of the transmission tower-line system and improve the computational efficiency, the following assumptions are adopted in this paper.
(1) In the modeling process, the conductor bundle is modeled as a single conductor, and in the ice-shedding process [33–35], it is assumed that all the sub-conductors of the bundle conductor bundle experience ice shedding at the same time.
(2) Ice is evenly distributed on the conductor and the ground, and it is assumed that the ice cross section is circular.
(3) Only the mass of the ice cover is considered, whereas the influence of the ice cover stiffness is ignored, and the possibility of the ice cover falling off and breaking during vibration is ignored.
This paper selects a 500 kV double-circuit angle steel transmission tower as the research object with a height of 99.9 m and a base size of 18 m × 18 m. The dimensions of the transmission tower are presented in Figure 1. The length of the insulator is 6.6 m, the initial tension conductor is 141.3 kN, and the initial tension of the ground conductor is 30.5 kN. The main material of the transmission tower is Q420 and Q345 steel, as shown in Figure 1, and Q235 steel is used for the auxiliary materials.
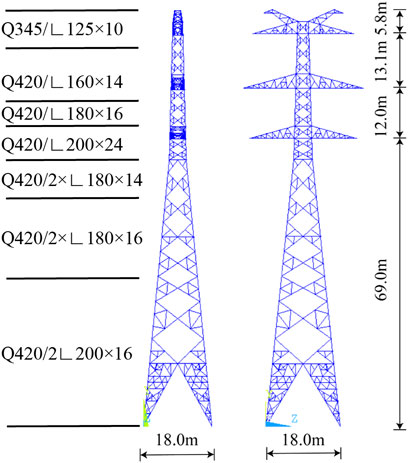
FIGURE 1. Tower dimensions.
The ice on the transmission lines is affected by natural factors such as wind, and the icing cross sections are mostly crescent-shaped, crescent-shaped or D-shaped, although other irregular shapes are also possible. Previously, scholars mostly assumed that the ice is ring-shaped when studying ice-shedding phenomena; this article also adopts this assumption. In this paper, ANSYS simulation software is used for modeling, and the LINK10 element is used to simulate the conductor. The ice coating on the conductor is also simulated by the LINK10 element, which shares the node with the conductor. The constitutive model of tower is shown in Figure 2, the tower member would lose its load carrying capacity once the strain reaches 0.02.
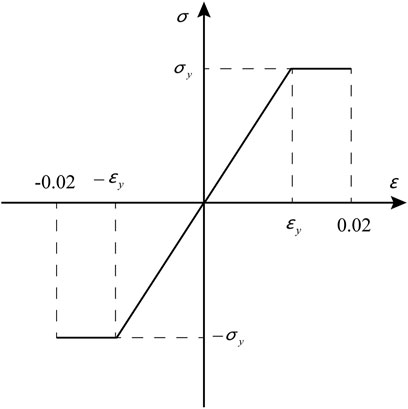
FIGURE 2. Material model of tower member.
The two-tower, three-line transmission tower-line system model established in this article is illustrated in Figure 3. The ice shedding of conductors 1, 2, and 3 represents the three cases of conductor ice shedding. In the past, when analyzing the vibration characteristics of transmission towers, the apex of the tower was set as a key point, and its displacement changes were analyzed to study the vibration characteristics of the transmission tower. Therefore, this paper defines the apex of the ice-shedding side of Tower 1 as key Point K. The steel density of the transmission tower is 7,850 kg/m3, and the elastic modulus is 206,000 MPa. In addition, the density of the ice coating is 900 kg/m3. Since the ice coating stiffness is ignored, the elastic modulus of the ice coating is set to 1 in the numerical model.
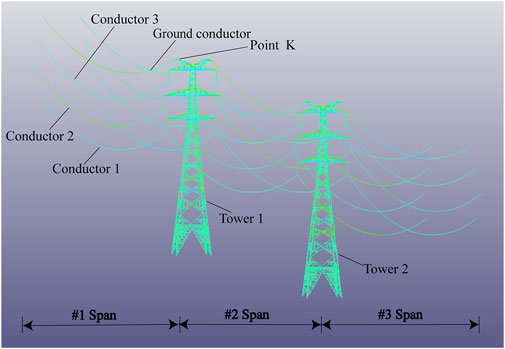
FIGURE 3. Finite element model of the transmission tower-line system.
Initial Defects
During the manufacture and transportation of the members used to construct power transmission towers, members with defects will inevitably be produced, and in their subsequent welding and assembly, residual stresses and welding defects will be generated due to factors such as the processing technology and worker mistakes. Accordingly, the bearing capacity of the power transmission tower members will be affected. Therefore, in the dynamic analysis of the transmission tower, the influences of these initial defects should be considered. Fu et al. [36, 37] used the uniform mode method to consider the initial defects of a transmission tower in their numerical model. This method assumes that the initial defects of a structure are consistent with the lowest buckling mode, and hence, this approach is widely used in the force analysis of complex structures such as reticulated shell structures and transmission towers. In this paper, the uniform mode method is adopted to consider the initial defects of the transmission tower, and on this basis, the dynamic response of the tower-line system induced by ice shedding is analyzed.
Dynamic Analysis of Ice-Shedding
The current electric power design code in China calculates the unbalanced tension caused by uneven ice cover during the transmission tower design according to the static load and takes the value according to the maximum working tension percentage of the conductor. This method is simple and easy to apply in engineering, but it ignores the dynamic impact during the ice-shedding process. Thus, the dynamic impact of conductor ice shedding is simulated in this paper. The simulation process is outlined in Figure 4. First, the finite element model of the transmission tower is established by using ANSYS, the initial defects are considered according to the minimum-order mode obtained by eigenvalue buckling analysis under ice-shedding load in ANSYS, and the finite element model is updated to introduce the initial defects of the transmission tower (uniform mode method) [36, 37]. In this way, the two-tower three-conductor finite element model is established. Finally, the static characteristics of the tower-line system are subjected to nonlinear analysis. Since the ANSYS implicit algorithm has long been used to analyze the dynamic responses of tower-line systems, the ANSYS LS-DYNA display algorithm is used to analyze the dynamic response of the transmission tower-line system to an ice-shedding load. The results of the preceding ANSYS static analysis are taken as the initial state of the LS-DYNA calculation, after that, delete the ice element which will shed from the conductor and use the equivalent nodal force to simulate the ice load. Then, the equivalent nodal force is removed to simulate ice shedding, and the dynamic analysis of ice falling off of the transmission tower-line system is carried out. Subsequently, the ice load is increased until the transmission line collapses and is destroyed.
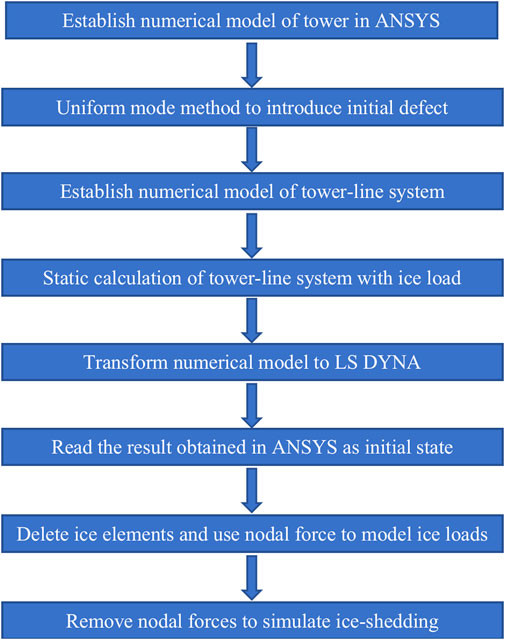
FIGURE 4. Flowchart for the dynamic analysis of ice shedding.
Failure Mode Analysis of Transmission Tower
The simulation parameters are as follows: 1) the length of the insulator is 6.6 m; 2) all the span of the conductor are 500 m; and 3) the initial tension of the conductor is 141.3 kN.
Taking conductor 2 (the middle conductor shown in Figure 3) as an example, the ice-shedding process of the transmission tower is depicted in Figure 5. If the ice thickness is 45.6 mm, as shown in Figure 5, then conductor ice shedding can lead to progressive collapse of the transmission tower-line system. At 1.0 s after ice shedding, the system is elastic, and the transmission tower vibrates as a result of the longitudinal unbalanced load. However, the tower members do not undergo buckling failure. Then, Tower 1 is affected by the longitudinal unbalanced load. At 1.5 s after ice shedding, units 2,334, 2,337, 2,148, and 2,151 at heights ranging from 81.0 to 84.5 m (i.e., the connections of the cross-arms to the tower head with ice-shedding conductors) fail. In addition, Tower 2 violently shakes. At 2.15 s after ice shedding, Tower 1 is subjected to longitudinal unbalanced loads, and units 2,850, 2,851, 2,852, and 2,853 (i.e., the connections between the tower head and the tower body) between the heights of 61.0 and 64.0 m begin to be destroyed. At 5.5 s after ice-shedding, Tower 1 collapses. Additionally, the members connecting the Tower 2 head to its body begin to fail. At 7.0 s after ice shedding, Tower 2 collapses, and the tower-line system completely loses its bearing capacity. The damage state of Tower 2 at 5.5 s is similar to that of Tower 1 at 2.15 s.
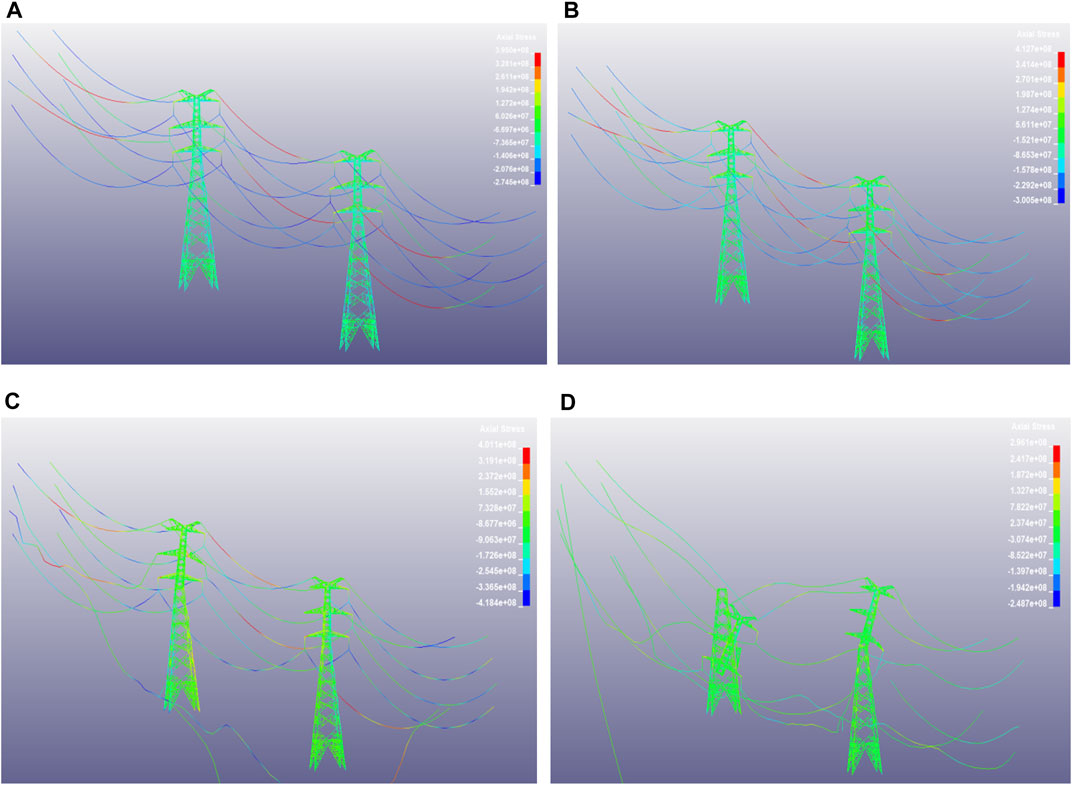
FIGURE 5. Collapse process of the tower-line system due to ice shedding of the middle (A) 1.0 s (B) 1.5 s (C) 5.5 s (D) 7.0 s.
From these simulation results, the failure processes and collapse mechanisms of the two towers in the two-tower, three-conductor model are basically the same except that the ice shedding of the ground conductor will not cause damage to the transmission tower-conductor system. Then, the insulator and conductor fall, the tower body vibrates violently, and the Tower 2 ice-shedding side is disconnected from the upper conductor. Finally, the head and body connections on Tower 1 are damaged and ultimately collapse, and Tower 2 is affected by the collapse of Tower 1.
From the simulation failure process, we can identify the positions of weakness where ice shedding on the three conductors can easily cause damage and the collapse of the transmission tower. The weakness of the employed tower is as follows: 1) the cross-arm connected to the ice-shedding conductor (the tower height ranges from 81.0 to 84.5 m); and 2) The tower head and tower body connection (the tower height ranges from 61.0 to 64.0 m). Based on the simulation, the reinforcement of the above positions can effectively strengthen the ability of the transmission tower to resist the unbalanced load caused by the falling off of ice.
The ice thickness during the collapse process of the transmission tower is 43.3 mm when the upper conductor experiences ice shedding, 45.6 mm when the middle conductor experiences ice shedding, and 48.1 mm when the lower conductor experiences ice shedding. Hence, with an increase in the ice-shedding height, the ice thickness required for the transmission tower to collapse decreases gradually; moreover, the higher the ice-shedding position is under the same ice thickness, the greater the threat to the tower-line system.
Analysis of the Ice-Shedding Parameters
When transmission line ice shedding occurs, the span and insulator length are important parameters of the line affecting the unbalanced tension. To better study the influences of these parameters on the longitudinal unbalanced load, the impact coefficient of the unbalanced tension is defined in Eq. 1.
Td is the maximum longitudinal unbalanced tension after ice shedding; Ts is the static stable longitudinal unbalanced tension after ice shedding; and η is the unbalanced tension impact coefficient used to show the relationship between the maximum longitudinal unbalanced tension after ice shedding and the static longitudinal unbalanced tension, i.e., the dynamic effect of the reaction to ice shedding. The final displacement of Point K on the tower is represented by the parameter X. For clarity, in the parameter analysis, all the conductors that experience ice shedding are the middle conductor, that is, conductor 2.
Span
Span is a key parameter that affects the dynamic response of the transmission tower to conductor ice shedding. When the span is 500 m and the ice thickness exceeds 45.6 mm, the tower-line system collapses. However, the simulation results also show that when the span is 400 m and the ice thickness is greater than 48.3 mm, tower-line system collapses.
Figure 6 shows the variation in the static longitudinal unbalanced tension, the unbalanced tension impact coefficient η, and the maximum displacement of Point K with the different ice thickness under spans of 500, 400, and 300 m. The change trend in Figure 6A indicates that the larger the span is under the same ice thickness, the greater the Ts experienced by the transmission tower after ice shedding occurs. When the span increases from 300 to 400 m, Ts increases from 11.05 to 22.3 kN (an increase of 101.8%), and when the span increases from 400 to 500 m, Ts increases from 22.3 to 40 kN (an increase of 79.37%). Hence, the increase in Ts is more obvious when increasing from 300 to 400 m. From the perspective of the simulated damage time, the 500 m tower is the first to be damaged, which shows that the larger Ts is, the more likely the transmission tower will be damaged.
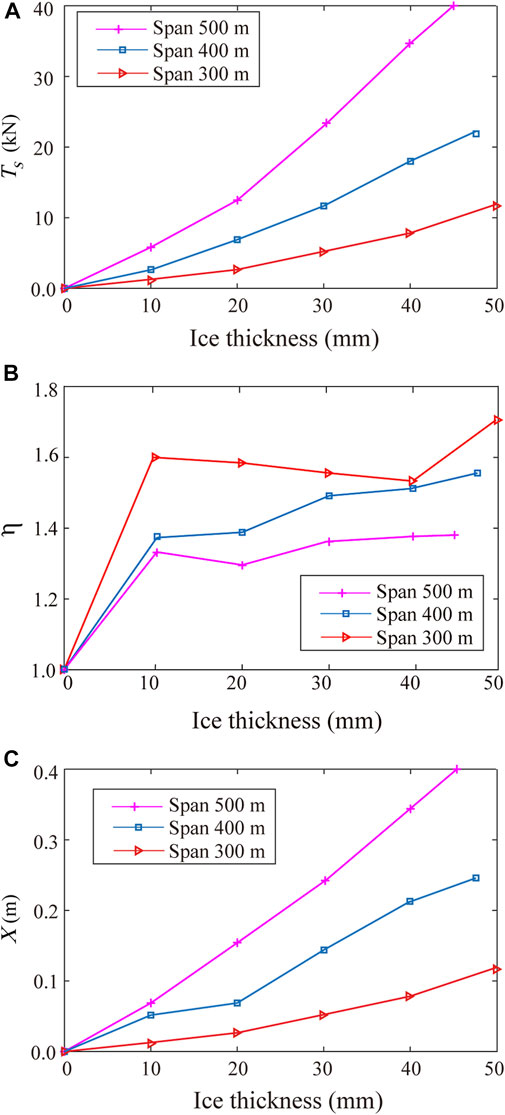
FIGURE 6. Variations in the responses of the tower-line system with different spans (A) static longitudinal unbalanced tension (B) impact coefficient of the unbalanced tension (C) displacement of Point K.
The unbalanced tensions are considered in the design code as static loads. In fact, the unbalanced tensions caused by ice-shedding are dynamic, the impact effect plays a very important role. Figure 6B further demonstrates that the larger the span, the smaller η is under the same ice thickness. η reflects the impact effect of the longitudinal unbalanced tension. In other words, the larger η is, the stronger the impact. It is especially important to note that when the span is reduced from 500 to 400 m, η increases from 1.39 to 1.55, which is an increase of 11.51%. When the span is reduced from 400 to 300 m, η increases from 1.55 to 1.71 (an increase of 10.32%), meaning that the dynamic maximum unbalanced tension is nearly 1.71 time of the static unbalanced tension. η is considerable, the influence of the impact factor should be considered in the design of transmission lines.
Figure 6C indicates that the larger the span is under the same ice thickness, the larger the maximum displacement of Point K caused by ice shedding. When the span increases from 300 to 400 m, X increases from 0.12 to 0.25 m (an increase of 108.3%), and when the span increases from 400 to 500 m, X increases from 0.25 to 0.4 m (an increase of 60%). Hence, the increase in X is more obvious when increasing from 300 to 400 m.
In summary, as the span increases, the dynamic response of the transmission tower-line system increases. Therefore, in areas with severe icing, appropriately reducing the span is highly beneficial for protecting transmission towers from the longitudinal imbalance tension caused by ice shedding.
Insulator Length
The length of the insulator is another important parameter that affects the dynamic response of the transmission tower-line system. Figure 7 shows the variations in the static longitudinal unbalanced tension, unbalanced tension impact coefficient η, and maximum displacement of Point K with the ice load at different insulator lengths.
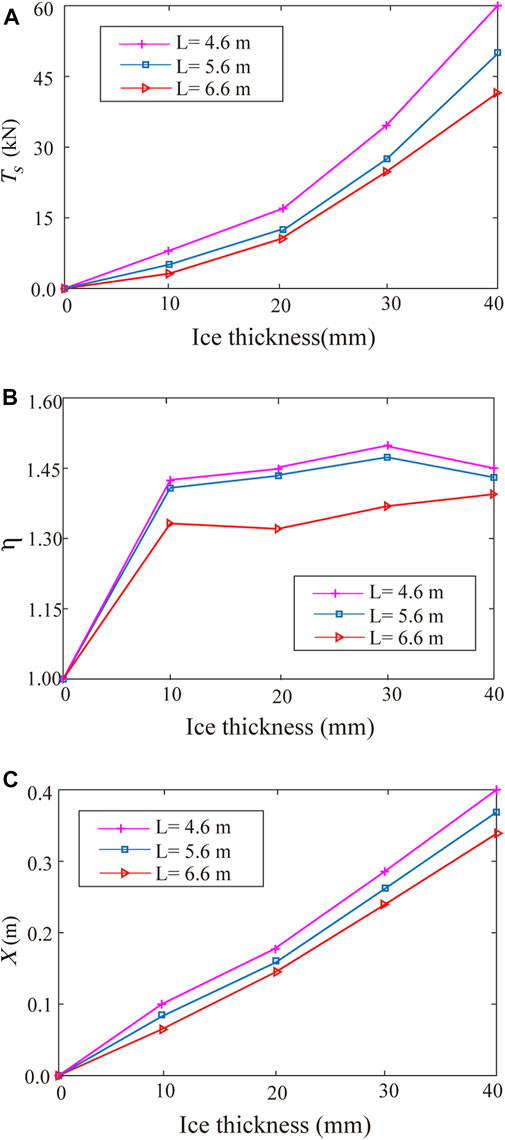
FIGURE 7. Variations in the responses of the tower-line system with the different insulator lengths (A) static longitudinal unbalanced tension (B) impact coefficient of the unbalanced tension (C) displacement of Point K.
Figure 7A suggests that the static longitudinal unbalanced tension increases with decreasing insulator length, indicating that long insulators can effectively reduce the longitudinal unbalanced tension caused by ice shedding. Therefore, longer insulators should be selected as much as possible in the design and construction of transmission lines.
Furthermore, Figure 7B shows that η decreases with increasing insulator length. Hence, increasing the insulator length can reduce the impact of ice shedding on the tower-line system and reduce the threat of collapse of the system.
In addition, Figure 7C shows that the maximum displacement of Point K decreases as the length of the insulator increases. Since Point K exhibits the most obvious deformation on the tower, an increase in the insulator length can reduce the overall displacement of the transmission tower.
In summary, as the length of the insulator increases, longitudinal unbalanced tension in the line decrease. At the same time, the impact coefficient and tower displacement will also decrease. Therefore, the response of the tower-line system is reduced, indicating that the length of the selected insulator should be increased as much as possible within the allowable range in the design process of the transmission line.
Conclusion
In this paper, a numerical model of a two-tower, three-line transmission tower-line system is established, and the damage of the transmission line caused by ice shedding is studied. The influence parameters are studied through a parameter analysis. According to the research in this article, the following conclusions can be drawn:
1) For the transmission tower employed in this article, the cross-arm connected to the ice-shedding conductor (the tower height ranges from 81.0 to 84.5 m) and the tower head and tower body connection (the tower height ranges from 61.0 to 64.0 m) are prone to damage when ice shedding occurs. If these positions are strengthened, then the ability of the transmission tower to resist longitudinal unbalanced tension can effectively increase.
2) The higher the ice-shedding position along the height of the transmission line is, the greater the threat of collapse of the tower-line system.
3) The larger the span is, the greater the threat of ice shedding on the transmission line. Therefore, in an actual line, for areas with severe icing, large spans should be avoided during the design process.
4) The larger the insulator is, the smaller response of the tower-line system.
5) The impact of ice shedding will amplify the longitudinal unbalanced tension in the line, and attention should be paid to the impact on the line.
Data Availability Statement
The raw data supporting the conclusion of this article will be made available by the authors, without undue reservation.
Author Contributions
JL contributed to the conception of the study, analyzed the data and wrote the paper. BW performed the numerical simulation. JS performed the numerical simulation.4 SW contributed to the conception of the study. XZ helped perform the analysis with constructive discussions. XF helped perform the analysis with constructive discussions. All authors have read and agreed to the published version of the manuscript.
Funding
The research described in this paper was financially supported by the National Natural Science Foundation of China (grant no. 51808100), the China Postdoctoral Science Foundation (grant no 2018M631808) and Liaoning Provincial Natural Science Foundation of China (grant no. 2019-ZD_0004).
Conflict of Interest
The authors declare that the research was conducted in the absence of any commercial or financial relationships that could be construed as a potential conflict of interest.
References
1.ASCE. Guidelines for Electrical Transmission Line Structural Loading, 74. Reston, VA: ASCE (1991).
2.China Planning Press. Code For Design of 110 kV ∼750 kV Overhead Transmission Line. GB50545-2010. China: Ministry of Housing and Urban Rural Development of the Peoples Republic of China (2010).
3.IEC (International Electrotechnical Commission). Overhead transmission Line—Design Criteria. IEC60826:2017. Geneva: ISO (2017).
4. Li Z, Yang J, Han J, Huang T, Huang H. Analysis on Transmission tower Toppling Caused by Icing Disaster in 2008. Power Syst Tech (2009) 33(02):31–5. doi:10.13335/j.1000-3673.pst.2009.02.005
5. Qu C, Li H, Huo L, Yi T. Optimum Value of Negative Stiffness and Additional Damping in Civil Structures. J Struct Eng (2017) 143(8):04017068. doi:10.1061/(ASCE)ST.1943-541X.0001805
6. Qu C, Huo L, Li H, Wang Y. A Double Homotopy Approach for Decentralized H∞ Control of Civil Structures. Struct Control Health Monit (2014) 21(3):269–81. doi:10.1002/stc.1552
7. Qu CX, Yi TH, Li HN. Mode Identification by Eigensystem Realization Algorithm through Virtual Frequency Response Function. Struct Control Health Monit (2019) 26(10):e2429. doi:10.1002/stc.2429
8. Zhao L, Huang X, Zhang Y, Zhu Y, Jia J, Zhu C. Aeolian Vibration‐based Structural Health Monitoring System for Transmission Line Conductors. Struct Control Health Monit (2020) 27(6):e2538. doi:10.1002/stc.2538
9. Tian L, Zhou M, Qiu C, Pan H, Rong K. Seismic Response Control of Transmission tower-line System Using SMA-Based TMD. Struct Eng Mech (2020) 74(1):129–43. doi:10.12989/sem.2020.74.1.129
10. Li J, McClure G, Wang S. Ensuring the Structural Safety of Overhead Transmission Lines by Design. J Aerospace Eng (2021) 34(3):04021010. doi:10.1061/(ASCE)AS.1943-5525.0001245
11. Kollar LE, Farzaneh M. Vibration of Bundled Conductors Following Ice Shedding. IEEE Trans Power Deliv (2008) 23(2):1097–104. doi:10.1109/TPWRD.2007.915876
12. Kollár LE, Farzaneh M. Modeling Sudden Ice Shedding from Conductor Bundles. IEEE Trans Power Deliv (2013) 28(2):604–11. doi:10.1109/TPWRD.2012.2227281
13. Kollár LE, Farzaneh M, Van Dyke P. Modeling Ice Shedding Propagation on Transmission Lines with or without Interphase Spacers. IEEE Trans Power Deliv (2013) 28(1):261–7. doi:10.1109/TPWRD.2012.2212918
14. Kollár LE, Farzaneh M. Modeling the Dynamic Effects of Ice Shedding on Spacer Dampers. Cold Regions Sci Tech (2009) 57(2-3):91–8. doi:10.1016/j.coldregions.2009.03.004
15. Yan B, Chen K, Guo Y, Liang M, Yuan Q. Numerical Simulation Study on Jump Height of Iced Transmission Lines after Ice Shedding. IEEE Trans Power Deliv (2013) 28(1):216–25. doi:10.1109/TPWRD.2012.2219324
16. Wu C, Yan B, Zhang L, Zhang B, Li Q. A Method to Calculate Jump Height of Iced Transmission Lines after Ice-Shedding. Cold Regions Sci Tech (2016) 125:40–7. doi:10.1016/j.coldregions.2016.02.001
17. Huang G, Yan B, Wen N, Wu C, Li Q. Study on Jump Height of Transmission Lines after Ice-Shedding by Reduced-Scale Modeling Test. Cold Regions Sci Tech (2019) 165:102781. doi:10.1016/j.coldregions.2019.102781
18. Kálmán T, Farzaneh M, McClure G. Numerical Analysis of the Dynamic Effects of Shock-Load-Induced Ice Shedding on Overhead Ground Wires. Comput Structures (2007) 85(7-8):375–84. doi:10.1016/j.compstruc.2006.11.026
19. Mirshafiei F, McClure G, Kalman T, Farzaneh M. Improved Ice Shedding Modelling of Iced Cables: a Comparison with Experimental Data. In: Proceedings of the 2nd International Structural Specialty Conference. Winnipeg, Canada (2010). p. 978–87.
20. Mirshafiei F, Mcclure G, Farzaneh M. Modelling the Dynamic Response of Iced Transmission Lines Subjected to cable Rupture and Ice Shedding. IEEE Trans Power Deliv (2013) 28(2):948–54. doi:10.1109/TPWRD.2012.2233221
21. McClure G, Ji K, Rui X. An Integrated Ice-Shedding Model of Electric Transmission Lines with Consideration of Ice Adhesive/cohesive Failure. In: Proceedings of the 9th International Conference on Structural Dynamics. Portugal: Porto (2014). p. 3731–6.
22. Ji K, Rui X, Li L, Leblond A, Mcclure G. A Novel Ice-Shedding Model for Overhead Power Line Conductors with the Consideration of Adhesive/cohesive Forces. Comput Structures (2015) 157:153–64. doi:10.1016/j.compstruc.2015.05.014
23. Rui X, Ji K, Li L, McClure G. Dynamic Response of Overhead Transmission Lines with Eccentric Ice Deposits Following Shock Loads. IEEE Trans Power Deliv (2017) 32(3):1287–94. doi:10.1109/TPWRD.2015.2501029
24. Ji K, Rui X, Li L, Yang F, Mcclure G. Dynamic Response of Iced Overhead Electric Transmission Lines Following cable Rupture Shock and Induced Ice Shedding. IEEE Trans Power Deliv (2016) 31(5):2215–22. doi:10.1109/TPWRD.2016.2520082
25. Ji K, Liu B, Cheng Y, Zhan X, McClure G. Evaluation and Optimization of a Shock Load De-icing Method for Transmission Lines with Combined Ice Failure Criteria. Cold Regions Sci Tech (2019) 165:102818. doi:10.1016/j.coldregions.2019.102818
26. Yang F, Yang J, Han J, Fu D. Dynamic Responses of Transmission tower-line System under Ice Shedding. Int J Str Stab Dyn (2010) 10(3):461–81. doi:10.1142/s0219455410003579
27. Yang F, Yang J, Zhang H. Analyzing Loads from Ice Shedding Conductors for UHV Transmission Towers in Heavy Icing Areas. J Cold Regions Eng (2014) 28(3):04014004. doi:10.1061/(ASCE)CR.1943-5495.0000070
28. Shen G, Yuan G, Sun B, Lou W. Dynamic Impact Effects on tower-line System Due to Ice-Shedding. Eng Mech (2010) 27(5):210–7.
29. Shen G, Yuan G, Xing Y, Lou W, Sun B. Numerical Simulation and Parameter Analysis of Conductor Icing Loss. Vibration and Impact (2012) 31(5):604–11. doi:10.13465/j.cnki.jvs.2012.05.035
30. Fu X, Li H-N, Li G, Dong Z-Q, Zhao M. Failure Analysis of a Transmission Line Considering the Joint Probability Distribution of Wind Speed and Rain Intensity. Eng Structures (2021) 233(2021):111913. doi:10.1016/j.engstruct.2021.111913
31. Fu X, Li H-N, Li G, Dong Z-Q. Fragility Analysis of a Transmission tower under Combined Wind and Rain Loads. J Wind Eng Ind Aerodynamics (2020) 199(2020):104098. doi:10.1016/j.jweia.2020.104098
32. Tian L, Pan H, Ma R, Zhang L, Liu Z. Full-scale Test and Numerical Failure Analysis of a Latticed Steel Tubular Transmission tower. Eng Structures (2020) 208:109919. doi:10.1016/j.engstruct.2019.109919
33. Li J-X, Li H-N, Fu X. Dynamic Behavior of Transmission tower-line Systems Subjected to Insulator Breakage. Int J Str Stab Dyn (2018) 18(3):1850036. doi:10.1142/S0219455418500360
34. Li J-X, Li H-N, Fu X. Stability and Dynamic Analyses of Transmission tower-line Systems Subjected to Conductor Breaking. Int J Str Stab Dyn (2017) 17(6):1771013. doi:10.1142/S0219455417710134
35. Zhang Q, Popplewell N, Shah AH. Galloping of Bundle Conductor. J Sound Vibration (2000) 234(1):115–34. doi:10.1006/jsvi.1999.2858
36. Fu X, Wang J, Li H-N, Li J-X, Yang L-D. Full-scale Test and its Numerical Simulation of a Transmission tower under Extreme Wind Loads. J Wind Eng Ind Aerodynamics (2019) 190:119–33. doi:10.1016/j.jweia.2019.04.011
Keywords: index terms: transmission line, ice shedding, numerical simulation, dynamic response, progressive collapse
Citation: Li J, Wang B, Sun J, Wang S, Zhang X and Fu X (2021) Collapse Analysis of a Transmission Tower-Line System Induced by Ice Shedding. Front. Phys. 9:712161. doi: 10.3389/fphy.2021.712161
Received: 20 May 2021; Accepted: 08 June 2021;
Published: 18 June 2021.
Edited by:
Yunlai Zhou, Universidade Lusófona, PortugalCopyright © 2021 Li, Wang, Sun, Wang, Zhang and Fu. This is an open-access article distributed under the terms of the Creative Commons Attribution License (CC BY). The use, distribution or reproduction in other forums is permitted, provided the original author(s) and the copyright owner(s) are credited and that the original publication in this journal is cited, in accordance with accepted academic practice. No use, distribution or reproduction is permitted which does not comply with these terms.
*Correspondence: Shuhong Wang, wangshuhong@mail.neu.edu.cn