the Creative Commons Attribution 4.0 License.
the Creative Commons Attribution 4.0 License.
 | 04 Jun 2021
Tropospheric NO2 measurements using a three-wavelength optical parametric oscillator differential absorption lidar
Jia Su
M. Patrick McCormick
Matthew S. Johnson
John T. Sullivan
Michael J. Newchurch
Timothy A. Berkoff
Shi Kuang
Guillaume P. Gronoff
The conventional two-wavelength differential absorption lidar (DIAL) has measured air pollutants such as nitrogen dioxide (NO2). However, high concentrations of aerosol within the planetary boundary layer (PBL) can cause significant retrieval errors using only a two-wavelength DIAL technique to measure NO2. We proposed a new technique to obtain more accurate measurements of NO2 using a three-wavelength DIAL technique based on an optical parametric oscillator (OPO) laser. This study derives the three-wavelength DIAL retrieval equations necessary to retrieve vertical profiles of NO2 in the troposphere. Additionally, two rules to obtain the optimum choice of the three wavelengths applied in the retrieval are designed to help increase the differences in the NO2 absorption cross-sections and reduce aerosol interference. NO2 retrieval relative uncertainties caused by aerosol extinction, molecular extinction, absorption of gases other than the gas of interest and backscattering are calculated using two-wavelength DIAL (438 and 439.5 nm) and three-wavelength DIAL (438, 439.5 and 441 nm) techniques. The retrieval uncertainties in aerosol extinction using the three-wavelength DIAL technique are reduced to less than 2 % of those when using the two-wavelength DIAL technique. Moreover, the retrieval uncertainty analysis indicates that the three-wavelength DIAL technique can reduce more fluctuation caused by aerosol backscattering than the two-wavelength DIAL technique. This study presents NO2 concentration profiles which were obtained using the HU (Hampton University) three-wavelength OPO DIAL. As a first step to assess the accuracy of the HU lidar NO2 profiles, we compared the NO2 profiles to simulated data from the Weather Research and Forecasting Chemistry (WRF-Chem) model. This comparison suggests that the NO2 profiles retrieved with the three-wavelength DIAL technique have similar vertical structure and magnitudes typically within ±0.1 ppb compared to modeled profiles.
- Article
(2117 KB) -
Supplement
(162 KB) - BibTeX
- EndNote


Nitrogen dioxide (NO2) plays a critical role in the tropospheric chemistry and is one of the reactive gases collectively referred to as “nitrogen oxides” (NOx = nitric oxide and nitrogen dioxide, NO + NO2) (U.S. EPA, 2020). The sources of NOx emissions include transportation (on-road vehicles, airplanes, trains, ships), wood burning, industrial and chemical processes, activities for oil and gas development, soil emissions, lightning, and wildfires (see Nitrogen Oxides Emissions indicator) (U.S. EPA, 2020). Once emitted, NO reacts rapidly in the presence of ozone to form NO2. In US urban locations, most measured airborne NO2 comes from the reaction of these two precursors rather than from direct NO2 emissions (Bertram, et al., 2005; Beirle, et al., 2011). Scientific evidence indicates that short-term NO2 exposure, ranging from 30 min to 24 h, can cause the exacerbation of asthma symptoms, in some cases resulting in hospitalization (Berglund, et al., 1993). Long-term NO2 exposure is likely to have a causal relationship with respiratory effects, based on evidence for the development of asthma (U.S. EPA, 2016). And NO2 will be included in future cycles of the Global Burden of Disease as global exposure estimates and evidence of their role as independent risk factors accumulate (Larkin et al., 2017). Additionally, atmospheric processing of NO2 leads to the formation of nitrogen-bearing particles that can eventually deposit to the surface, causing acidification, nitrogen enrichment and other ecological effects (Russell et al., 2012). Local or global NO2 monitoring is essential for understanding atmospheric chemistry as well as for human-health and environmental management and control.
Measurements of the intensity of ultraviolet or visible absorption spectra from the ground or from satellites are commonly used to retrieve the column density of NO2 (Celarier et al., 2008; Valks et al., 2011; Berg et al., 2012). Satellite-based instruments such as the Ozone Monitoring Instrument (OMI), Global Ozone Monitoring Experiment (GOME and GOME-2) and SCanning Imaging Absorption SpectroMeter for Atmospheric CHartographY (SCIAMACHY) can provide global-scale NO2 column measurements during daytime (Boersma et al., 2008; Bucsela et al., 2008). Moreover, plumes of NO2 by cities, power plants and even ships have been able to be tracked using the recent high-spatial-resolution observations of NO2 from the TROPOspheric Monitoring Instrument (TROPOMI) on Sentinel-5P since 2017 (Lorente, et al., 2019; Georgoulias et al., 2020). However, they are unable to obtain local high-temporal-resolution NO2 emissions such as variations in hourly NO2 concentrations due to their long repeat cycle since the lifetime of tropospheric NO2 is only about 6 h in summer and 18–24 h in winter due to the photochemical effect (Beirle, et al., 2003; Cui et al., 2016). In addition, measurements of tropospheric NO2 from satellites or aircraft are also influenced and limited by clouds (Bovensmann et al., 1999; Liang et al., 2017). Ground-based measurements of column NO2 from instruments such as Pandora using differential optical absorption spectroscopy (DOAS) are often used for the validation of satellite instruments (Herman et al., 2009; Lamsal et al., 2014; Kollonige et al., 2018). In situ measurements of near-surface NO2 can best monitor local emissions. However, at this point in time, they cannot provide vertically resolved measurements. Balloon measurements using a NO2 sonde can produce vertical profiles, but these measurements are very limited in time and space, especially in the Southern Hemisphere. The primary source of data on the vertical distribution of NO2 comes from operational sites around the world. However, their operation can be expensive and labor-intensive (Scott et al., 1999; Herman et al., 2009; Sluis et al., 2010).
The differential absorption lidar (DIAL) technique offers the potential for autonomous, 24 × 7 operation, with improved temporal resolution. Absorption of light by molecules is the basis for DIAL and numerous atmospheric constituents absorbing light. Conventional DIAL operates at two absorbing wavelengths, one stronger than the other, indicated by the on (λon) and off (λoff) wavelength of the gaseous absorption feature of interest. Because of different absorption at λon and λoff, the difference between the backscattered laser signals at the two wavelengths can be used to derive the number density of the absorption gas. Taking the log-ratio of these returns at closely spaced wavelengths removes system parameters and attenuation to and from the target of interest (Rothe et al., 1974; Sullivan et al., 2014). Thus, this technology provides measurements of the concentration of gas, such as NO2, O3 and SO2, at a particular location and time (Fredriksson and Hertz, 1984; Newchurch et al., 2003; Volten et al., 2009; Kuang et al., 2013; Sullivan et al., 2017). The DIAL technique provides the unique capability of remotely monitoring localized NO2 concentrations and emissions in urban and rural areas and profiling their tropospheric vertical NO2 concentration. However, aerosols are abundant within the planetary boundary layer (PBL) and can cause significant retrieval errors in a two-wavelength DIAL technique to measure NO2. To better understand this aerosol problem and produce a more accurate NO2 profile measurement, we described a new technique using a three-wavelength DIAL technique based on the intrinsic capabilities of using a multi-wavelength optical parametric oscillator (OPO) laser system. Hampton University (HU) has incorporated an OPO laser into its lidar system. The OPO laser enables researchers to optimize (tune) wavelength choices for specific measurements (Weibring et al., 2003). The three-wavelength DIAL retrieval equations are derived in this study. Our optimum choices for the three wavelengths to be used for our NO2 retrievals are designed to help increase the difference in NO2 absorption cross-section and reduce aerosol influence. NO2 retrieval relative uncertainties are calculated using the two-wavelength DIAL (438 and 439.5 nm) and the three-wavelength DIAL (438, 439.5 and 441 nm). Tropospheric NO2 profiles were obtained by applying the proposed technique to HU OPO DIAL lidar. As a first-order assessment, the HU lidar results were compared with simulated data from the Weather Research and Forecasting Chemistry (WRF-Chem) air quality model.
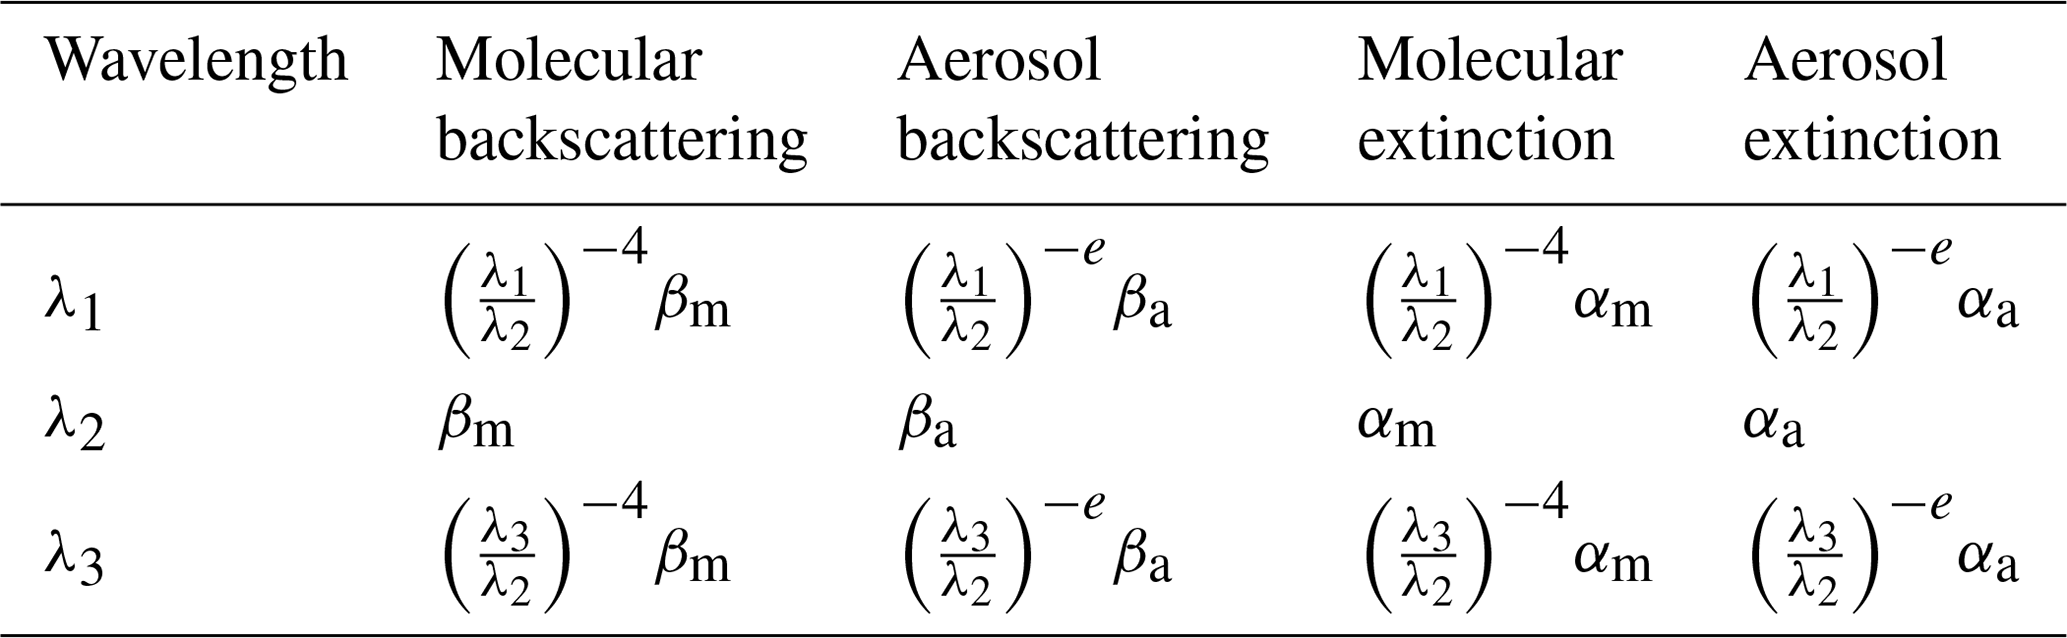
To minimize aerosols-interference in the retrievals of NO2, a three-wavelength DIAL technique was proposed with . Table 1 shows expressions for the extinction and backscatter of molecules and aerosols for these three wavelengths. In Table 1, βm and βa are backscatter from molecules and aerosols for the wavelength of λ2; αm and αa are the extinction of molecules and aerosols for the wavelength of λ2; and e is the aerosol Ångström exponent, assumed to be equal for the three wavelengths because the three wavelengths are very close.
Table 1Extinction and backscatter of molecule and aerosol for wavelengths of λ1, λ2 and λ3.
The three elastic lidar equations can be expressed as
where X is the lidar signal; C1, C2 and C3 are lidar constants; the subscripts a and m represent aerosol and molecule, respectively; σN is the absorption cross-section for the gas of interest; NN is the molecular density of the gas of interest; Oabs is absorption of gases other than the gas of interest; and z is the altitude. The molecular density of the gas of interest can be obtained using Eqs. (1), (2) and (3).
The NO2 density retrieval equation can be expressed as
where AED, MED, OAD and B are the correction terms of aerosol extinction, molecular extinction, absorption of gases other than the gas of interest and backscattering, respectively. Because the atmospheric molecular density is relatively stable, MED can be corrected using a numerical model or local real-time radiosonde data. OAD can be removed by choosing appropriate wavelengths. However, aerosol is variable, especially in the PBL. For correction of AED and B, we need accurate aerosol measurements. However, accurate aerosol measurements are not easily obtained. From the above NO2 retrieval relative equation, all of the correction terms are related to the three wavelengths, so how to choose the three wavelengths is very critical to reduce correction terms and improve the accuracy of NO2 retrievals. We designed two rules to obtain the optimum choice for the three wavelengths:
- a.
The three chosen wavelengths increase differences in the NO2 absorption cross-section (ΔσN) to improve NO2 retrieval.
According to Eq. (4), the greater ΔσN is, the less all of the correction terms are. So the three chosen wavelengths should help to increase ΔσN. Generally, researchers only used an increasing absorption method () or a decreasing absorption method () (illustrated in Fig. 1) to choose the three wavelengths (Wang, et al., 1997; Liu, et al., 2017). Wang used three wavelengths corresponding to the strong, medium and weak absorption of O3 to obtain an accurate stratospheric ozone profile in the presence of volcanic aerosols. Liu used three wavelengths of 448.10, 447.20 and 446.60 nm corresponding to the strong, medium and weak absorption of NO2 to retrieve NO2. Equations (10) and (11) are calculated values of ΔσN for the increasing absorption method and the decreasing absorption method using Eq. (5). Using the increasing absorption method and the decreasing absorption method to choose the three wavelengths, the values of ΔσN are both decreased according to Eqs. (10) and (11) compared to the conventional two-wavelength DIAL technique (the conventional two-wavelength DIAL technique retrieval equation is in the Supplement). According to characteristics of the NO2 absorption spectrum shown in Fig. 2, a bumping absorption method (σN(λ1)<σN(λ2) & σN(λ3)<σN(λ2)) is designed to choose the three wavelengths which can increase the value of ΔσN compared to the two-wavelength DIAL technique according to Eq. (12). However, for DIAL systems to measure other atmospheric gases like ozone, it is only practical to use wavelength selection Method B because of the shape of the ozone absorption spectrum (lacking narrow peaks).
Increasing absorption method:
Decreasing absorption method:
Bumping absorption method:
- b.
The three chosen wavelengths can reduce or remove AED.
It means the value of AED is equal or close to 0. Choosing the appropriate three wavelengths to make the value of K in Eq. (12) equal or close to 0, the value of AED will be equal or close to 0. The value of K in Eq. (12) changes with different aerosol Ångström exponents. For example, to remove boundary layer aerosol influence, we can set aerosol Ångström exponents to 1 to calculate the value of K to choose the three wavelengths because the size of aerosol in the boundary layer is typically large (Schuster et al., 2006; Li et al., 2017).

Figure 1The chosen three-wavelength methods: increasing absorption method (a), decreasing absorption method (b) and bumping absorption method (c).
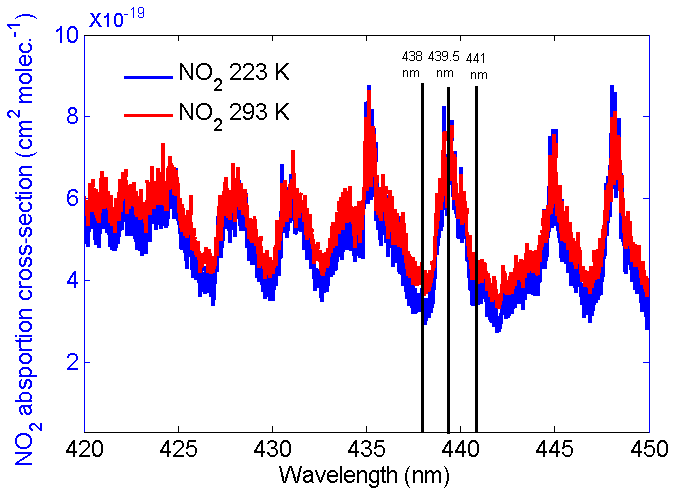
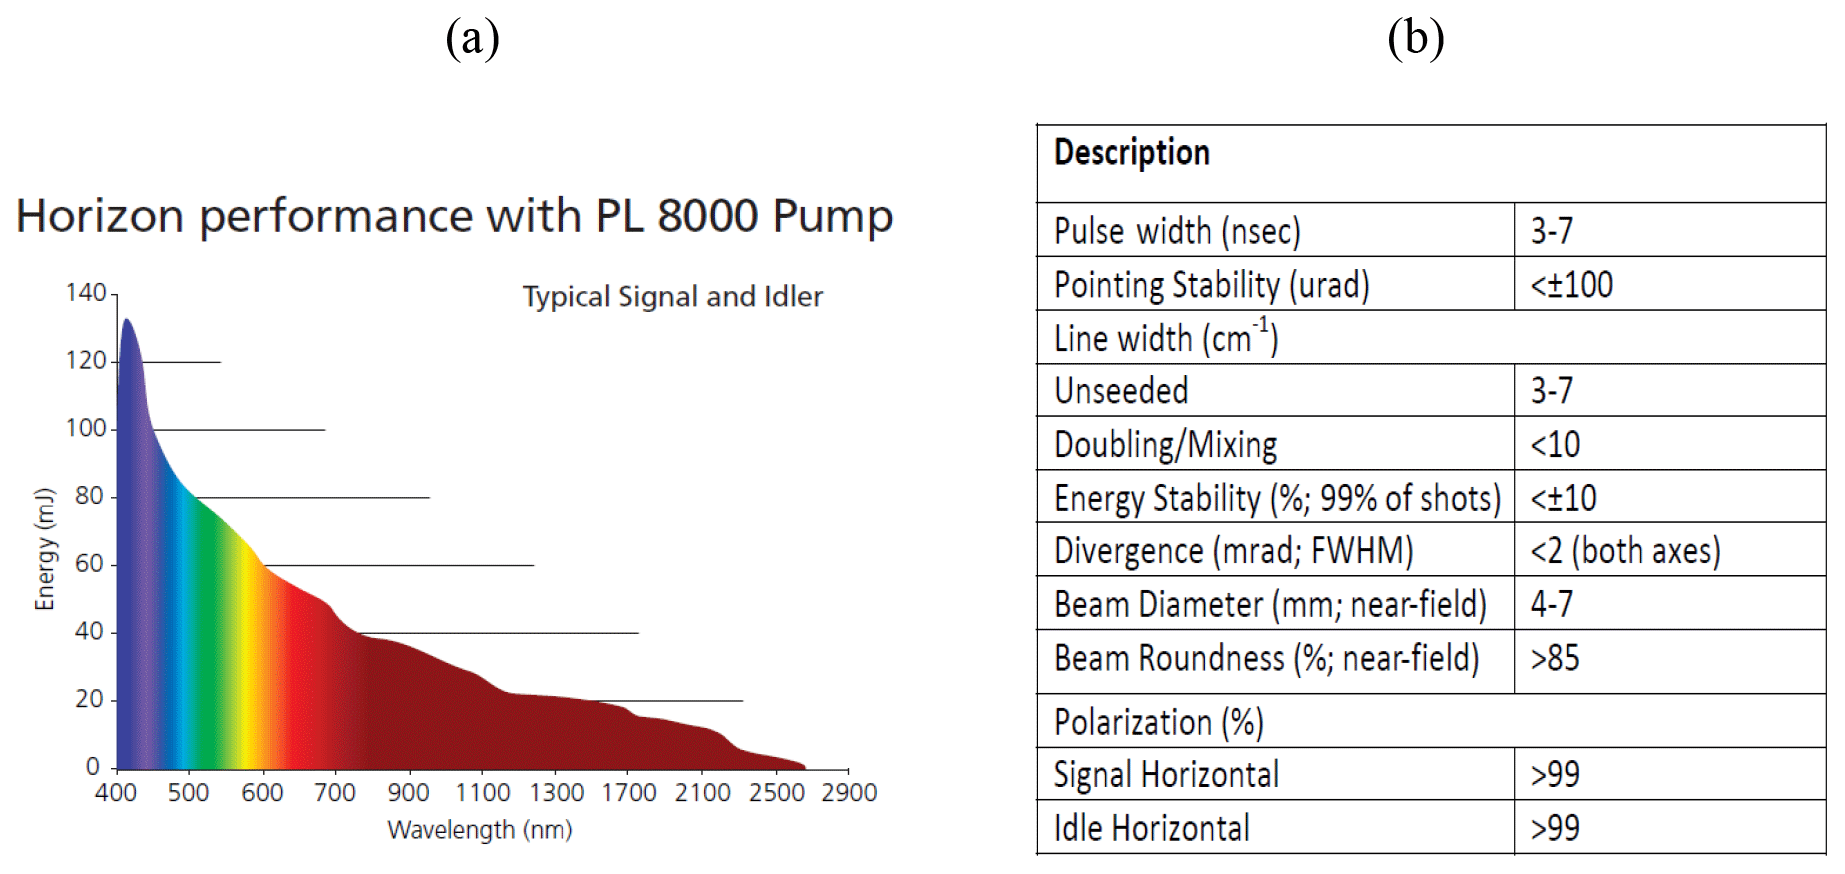
The HU lidar is located on the campus of HU (37.02∘ N, 76.34∘ W) in Hampton, VA. A Continuum Horizon II tunable OPO laser and a Continuum Powerlite DLS 8000 pump laser have recently been incorporated into the HU lidar system. The OPO laser enables researchers to optimize (tune) the wavelength choices and provides more flexibility than fixed-frequency wavelength shifters such as Raman cells. The wavelength tuning range of our OPO extends from 192 to 2750 nm. This range is fully automated with precision scanning for true hands-free operation. Figure 3a and b show the Continuum Horizon II output energy and its parameters. The OPO laser energy outputs between 400 and 500 nm, which overlaps with the NO2 strong-absorption spectral zone in Fig. 2 produced near the maximum possible power in the spectrum. Combining the OPO laser energy outputs, NO2 absorption spectrum and two chosen three-wavelength rules, 438, 439.5 and 441 nm shown in Fig. 2 result in the wavelengths of the HU three-wavelength DIAL system because ΔσN of the three-wavelength pair is more than other three-wavelength pairs in NO2 strong-absorption spectral zone, and the K value of the three-wavelength DIAL system is 0.000023 (close to 0). The HU lidar system currently consists of a Continuum OPO laser system as the light source, a 48 in. (1.22 m) non-coaxial Cassegrainian-configured telescope receiver, a light separation system that uses beam splitters and interference filters, a detecting system including photomultiplier tubes (PMTs) and avalanche photodiodes (APDs), and a Licel optical transient recorder. A schematic of the lidar system is shown in Fig. 4. The system can be configured to measure multi-wavelength aerosols and NO2 density. High-resolution backscatter measurements extend from the boundary layer (1.2 km) to the free troposphere. The pump laser operates at three fixed wavelengths (1064, 532 and 354.7 nm). The 354.7 nm laser is mostly reflected into the OPO laser to produce three wavelengths (338, 339.5 and 441 nm). Steering mirrors whose axes are aligned with a receiving telescope axis direct these laser outputs into the atmosphere. The laser backscatter is collected by a 48 in. (1.22 m) diameter telescope and split into specific wavelength bands by a beam separation unit, which combines filters and beam splitters for dispersion of the return backscatter to various detection channels. Using filters and beam splitters makes the beam-splitting system simple, compact, and easy to change or add other spectral channels for other measurements. Currently, wavelengths of 438, 439.5, 441, 354.7, 532 and 1064 nm are focused on PMTs and APDs and recorded by a Licel data-collecting system for measurements of aerosol and NO2.
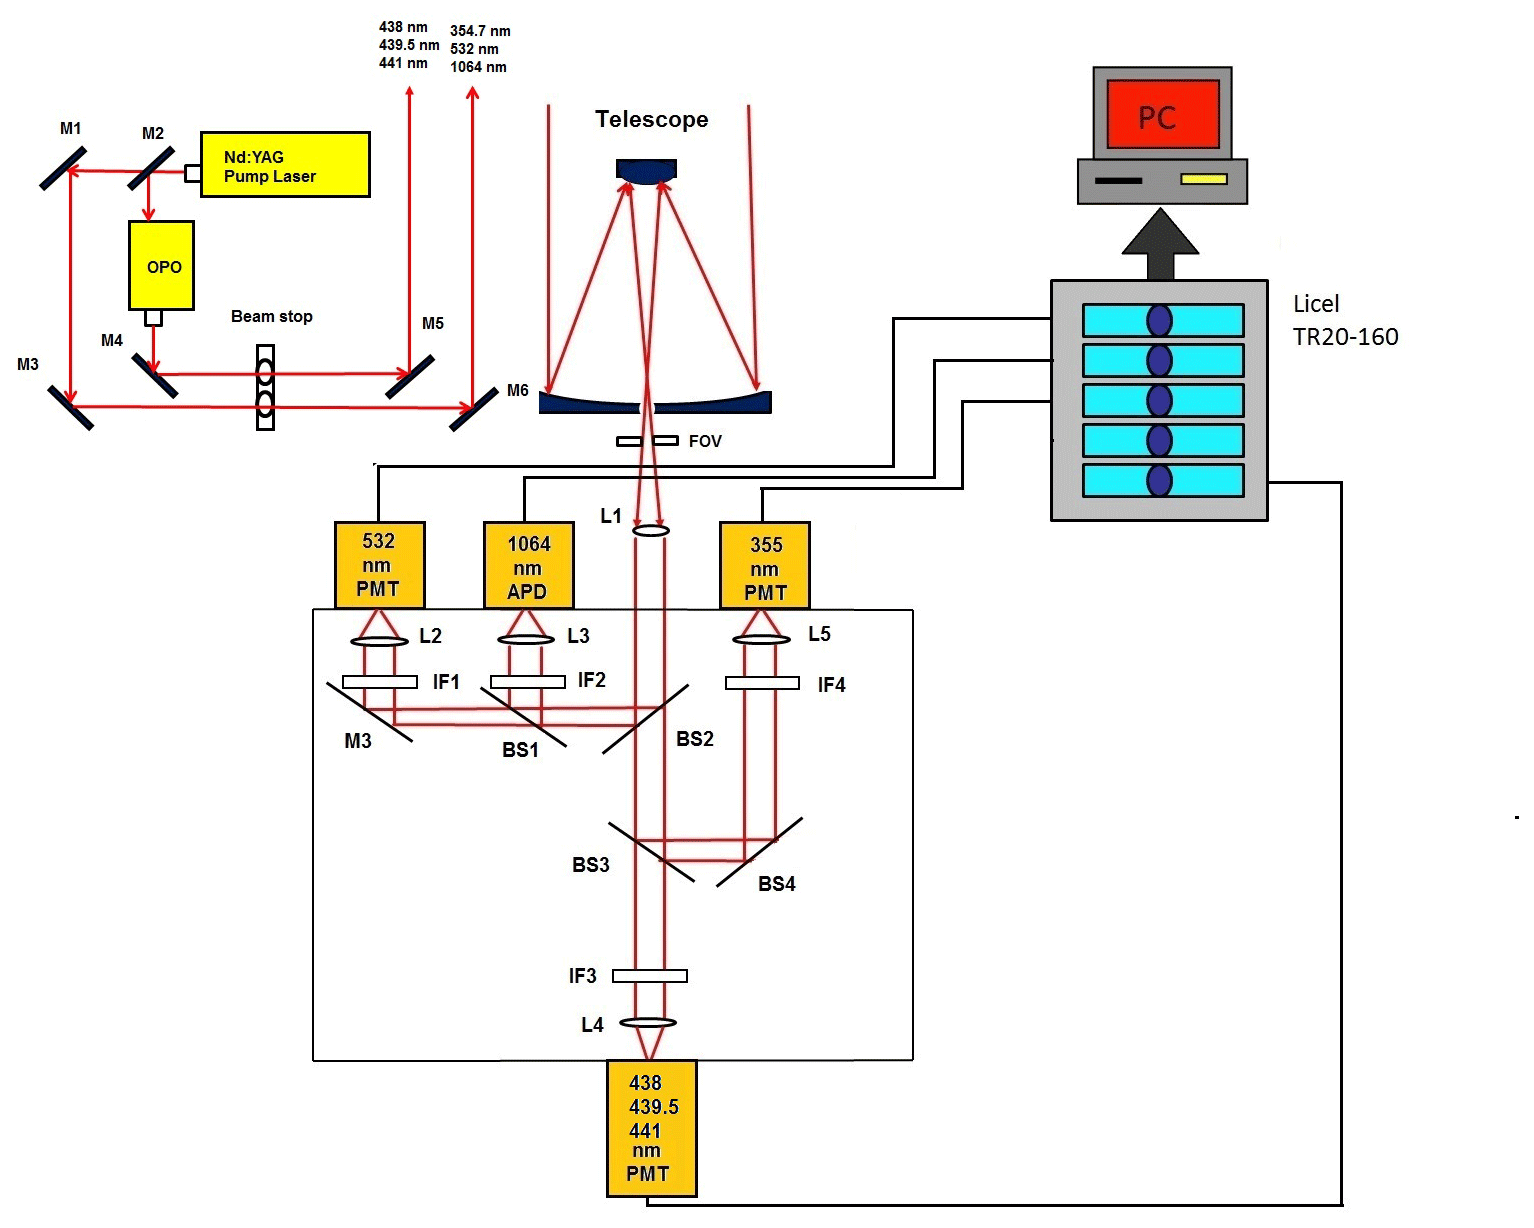
Figure 4HU lidar system (L: lens; M: mirror; BS: beam splitter; IF: interference filter; FOV: field of view; PMT: photomultiplier tube; APD: avalanche photodetector).
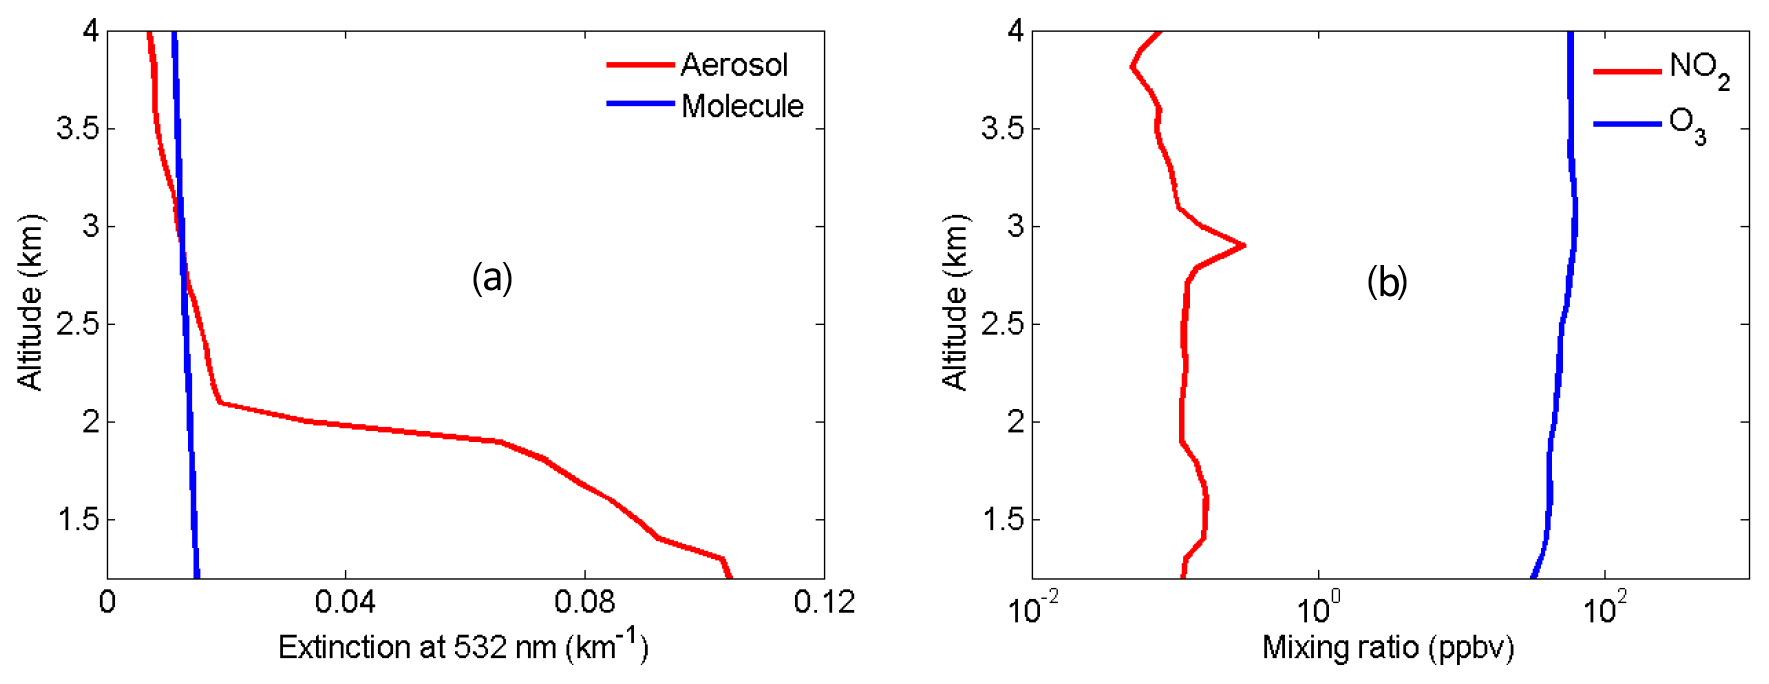
Figure 5Atmospheric profiles used for modeling NO2 lidar correction terms. (a) Aerosol extinction profile (red) at 532 nm measured by the HU lidar and molecular extinction profile (blue) at 532 nm derived from local radiosonde data, (b) NO2 (red) and O3 (blue) mixing ratio profiles from NASA DISCOVER-AQ and TOLNet.
To demonstrate that the HU three-wavelength OPO DIAL system can effectively reduce aerosol influence and accurately retrieve NO2, retrieval correction terms of AED, MED, OAD and B in Eq. (4) are simulated using the two-wavelength DIAL technique (438 and 439.5 nm) and the three-wavelength DIAL technique (438, 439.5 and 441 nm). Ozone was used for the simulation of OAD because only ozone absorption can produce a little influence on NO2 retrieval based on the HITRAN 1.1.2.0 database. Atmospheric data of aerosol, molecules, O3 and NO2 for these simulations are from the HU local lidar aerosol measurements, radiosonde, NASA Tropospheric Ozone Lidar Network (TOLNet), and NASA Deriving Information on Surface Conditions from COlumn and VERtically Resolved Observations Relevant to Air Quality (DISCOVER-AQ) measurements shown in Fig. 5. Extinction and backscatter of aerosol at 438, 439.5 and 441 nm can be calculated from the aerosol extinction profile at 532 nm in Fig. 5a with the setting of the lidar ratio = 50 and e=1, 2 and 3. The lidar ratio is wavelength-dependent, and its value in the visible band is in general smaller than in the UV band for the same type of aerosols (Kuang et al., 2020; Reid et al., 2017). Absorption of NO2 and O3 at 438, 439.5 and 441 nm can be calculated using their mixing ratio profiles in Fig. 5b and their absorption cross-sections from the HITRAN 1.1.2.0 database. MED, AED, OAD, B and absorption difference in NO2 (NAD) are simulated using the two-wavelength DIAL technique with different aerosol Ångström exponents (e=1, 2 and 3) shown in Fig. 6a, c and e and the three-wavelength DIAL technique shown in Fig. 6b, d and f. In Fig. 6, red lines are NAD, black lines are MED, deep-blue lines are AED, and light-blue lines are OAD. In Fig. 6, all OAD is far less than NAD. It is concluded that ozone absorption has a negligible influence on the retrieval of NO2. In Fig. 6a, c and d, MED and AED in the PBL are both more than NAD using the two-wavelength DIAL technique. Because atmospheric molecules are relatively stable, MED can be corrected using local model or real-time radiosonde data. However, aerosol is variable, so aerosols are a significant uncertainty for retrieving NO2 with the conventional two-wavelength DIAL technique. In Fig. 6b, d and f, MED and AED in the boundary layer are both much smaller than NAD using the proposed three-wavelength DIAL technique. It is proven that the three-wavelength DIAL technique can effectively decrease retrieval errors caused by aerosol extinction. From Fig. 5, we can see that AED using the three-wavelength DIAL technique can be reduced to less than 2 % of AED using the two-wavelength DIAL technique at least. Therefore, even if AED is not corrected, NO2 can still be accurately retrieved. Moreover, simulated B using the two-wavelength DIAL technique and the three-wavelength DIAL technique is shown in Fig. 6 with green lines. The sharp change in vertical adjacent aerosol backscatter can cause drastic changes in the B term. In Fig. 6, the value of the B term using the three-wavelength DIAL technique is far less than using the two-wavelength DIAL technique. So the three-wavelength DIAL technique can reduce more fluctuation caused by aerosol backscattering than the two-wavelength DIAL technique.
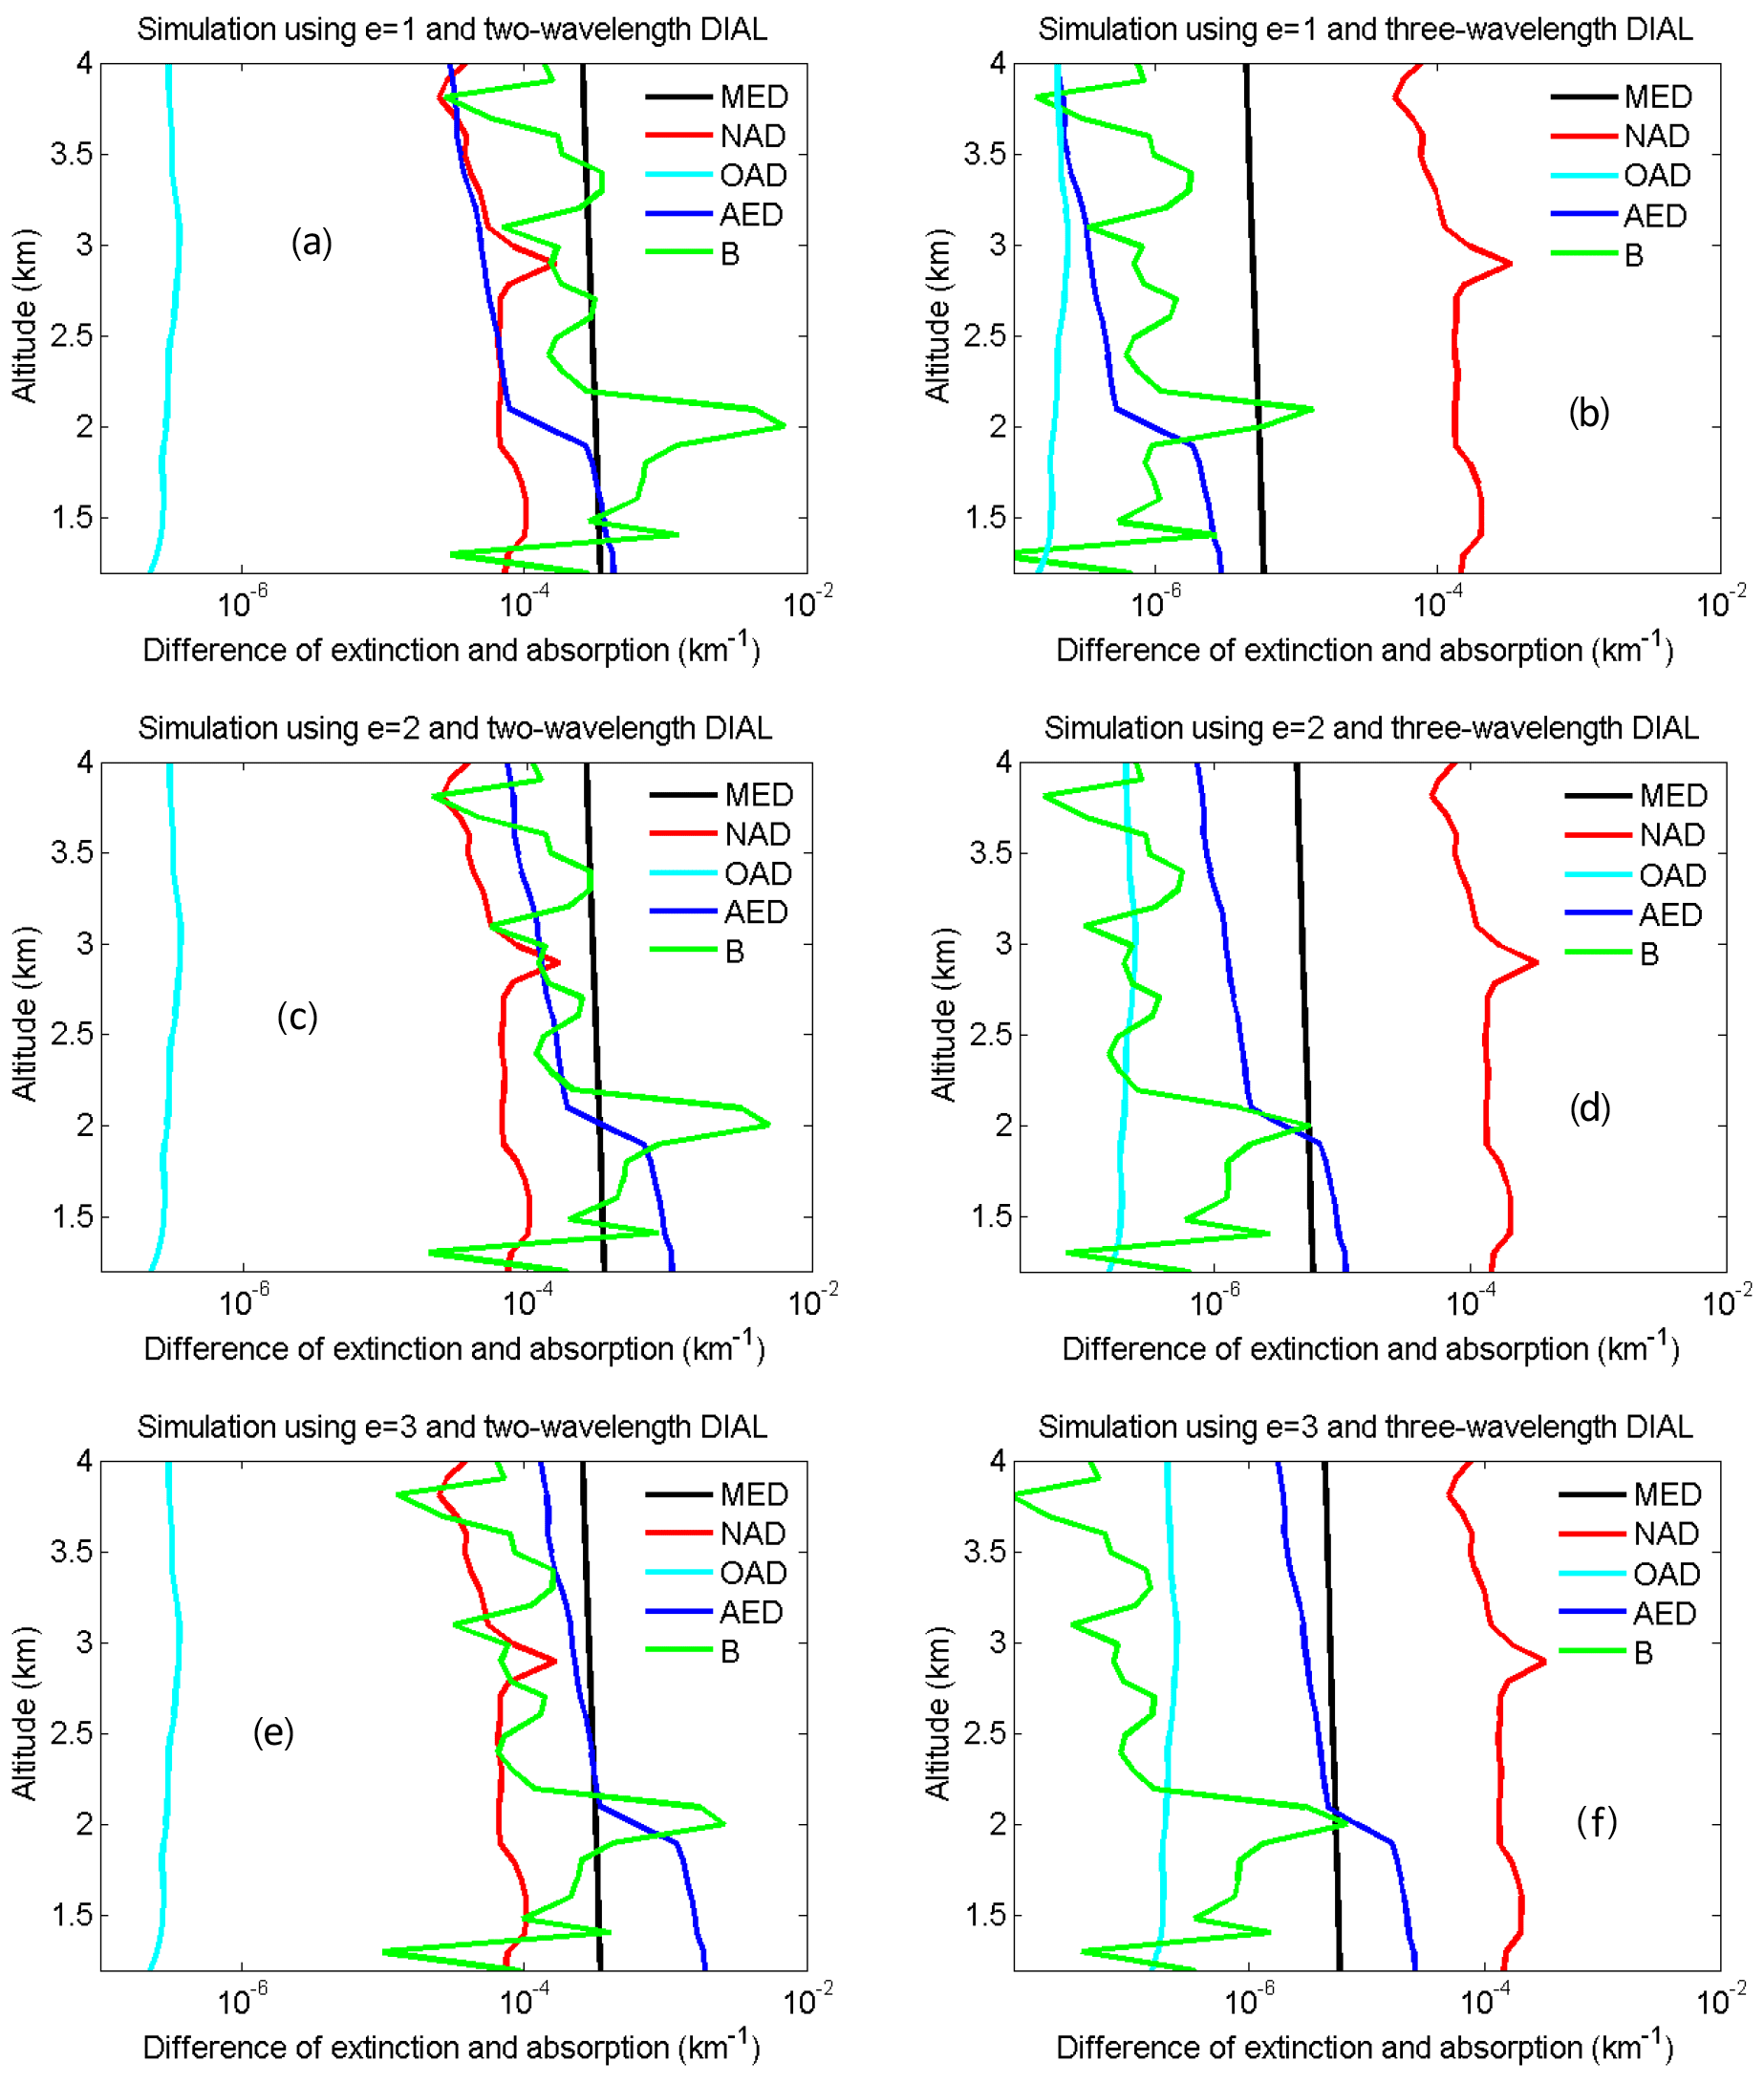
Figure 6Simulated MED (black), NAD (red), OAD (light blue), AED (deep blue) and B (green) using the two-wavelength DIAL technique with e = 1 (a), e = 2 (c) and e = 3 (e) and the three-wavelength DIAL technique with e = 1 (b), e = 2 (d) and e = 3 (f).
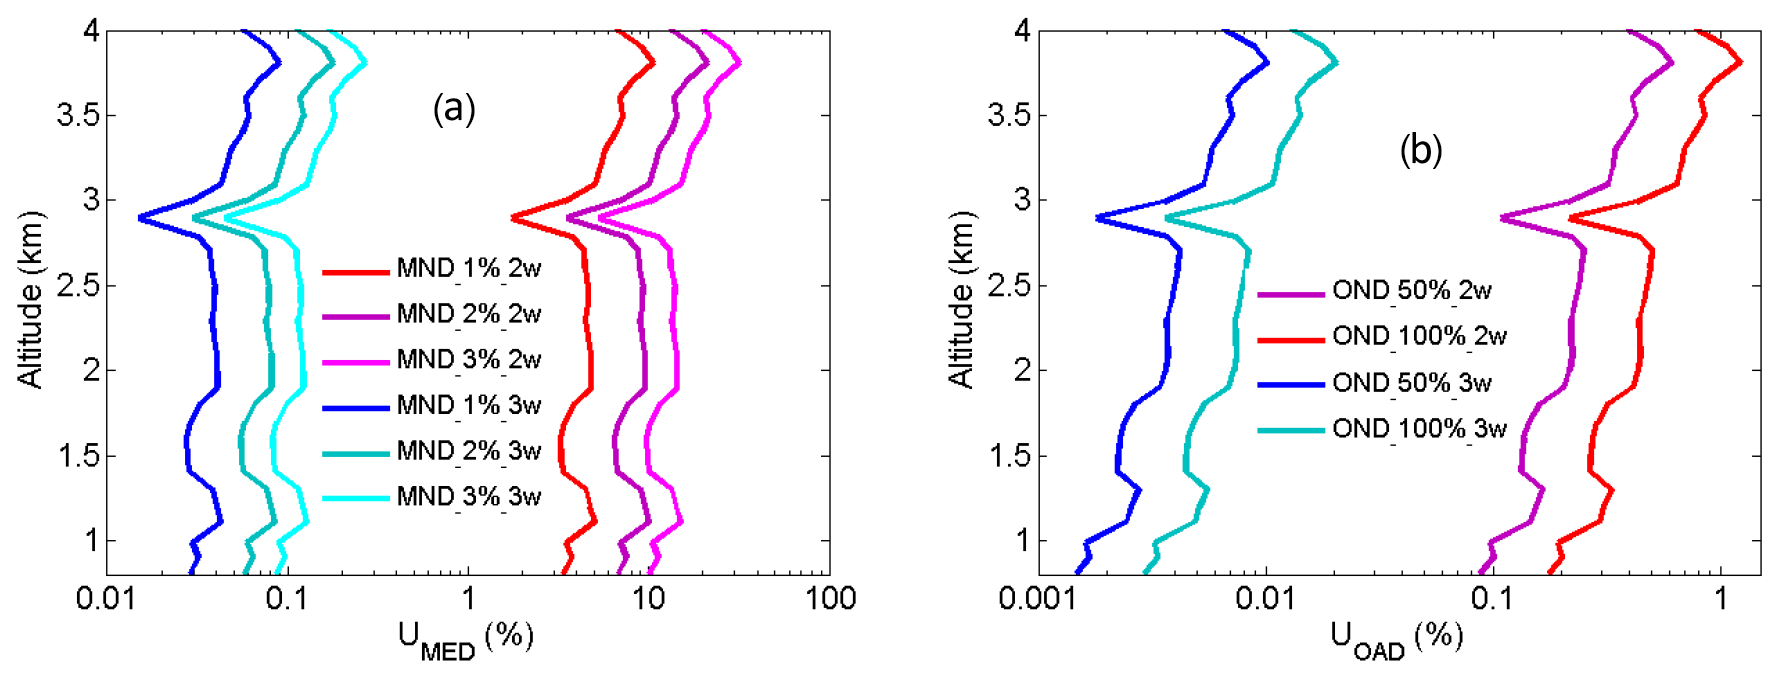
Figure 7NO2 number density relative uncertainty owing to air number density (a) and ozone number density (b).
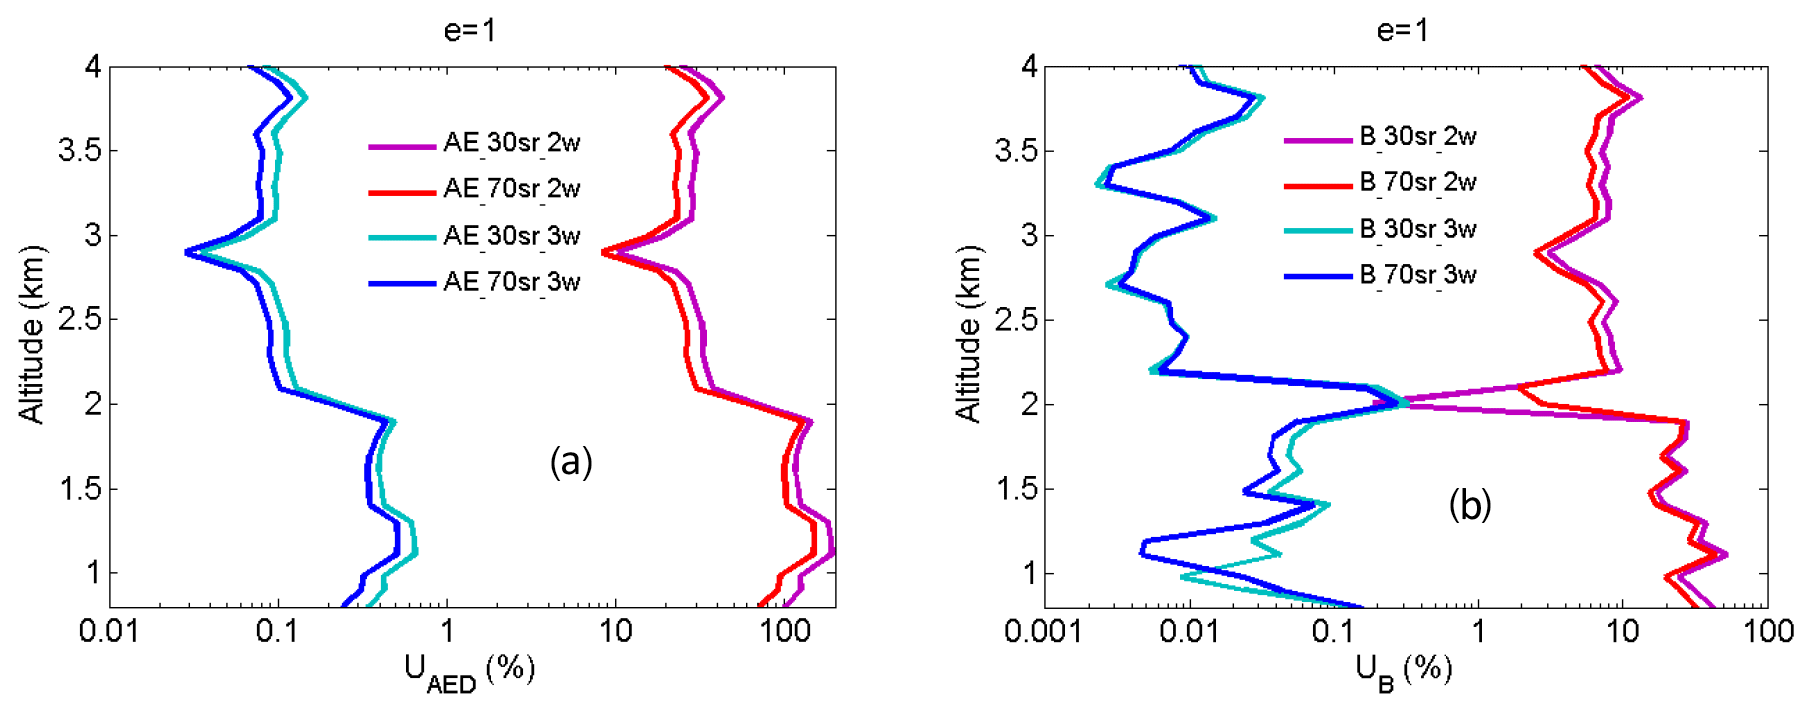
Figure 8NO2 number density relative uncertainty owing to aerosol extinction (a) and backscatter (b) with e = 1.
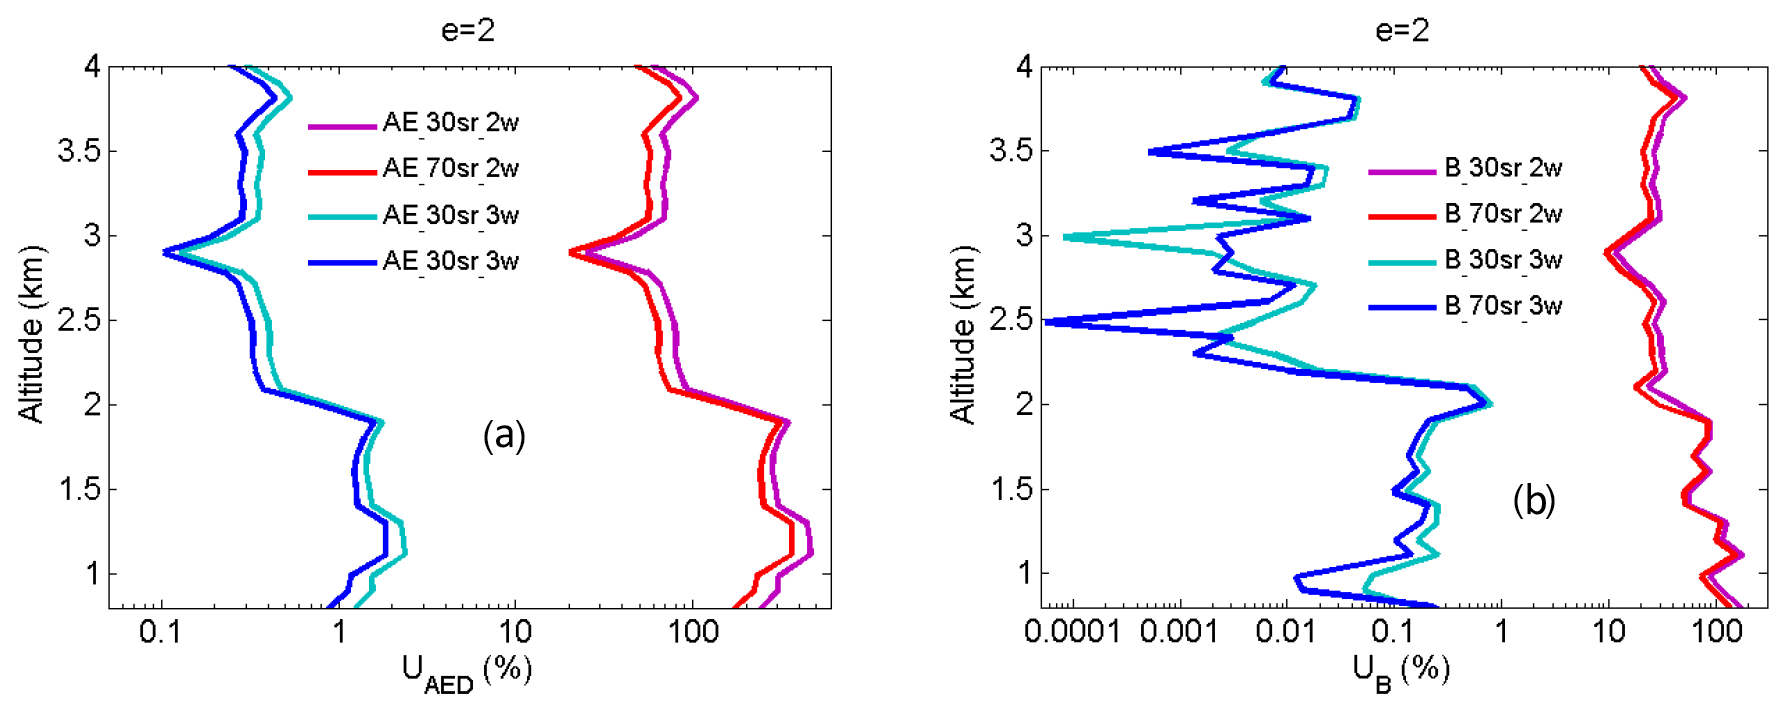
Figure 9NO2 number density relative uncertainty owing to aerosol extinction (a) and backscatter (b) with e = 2.
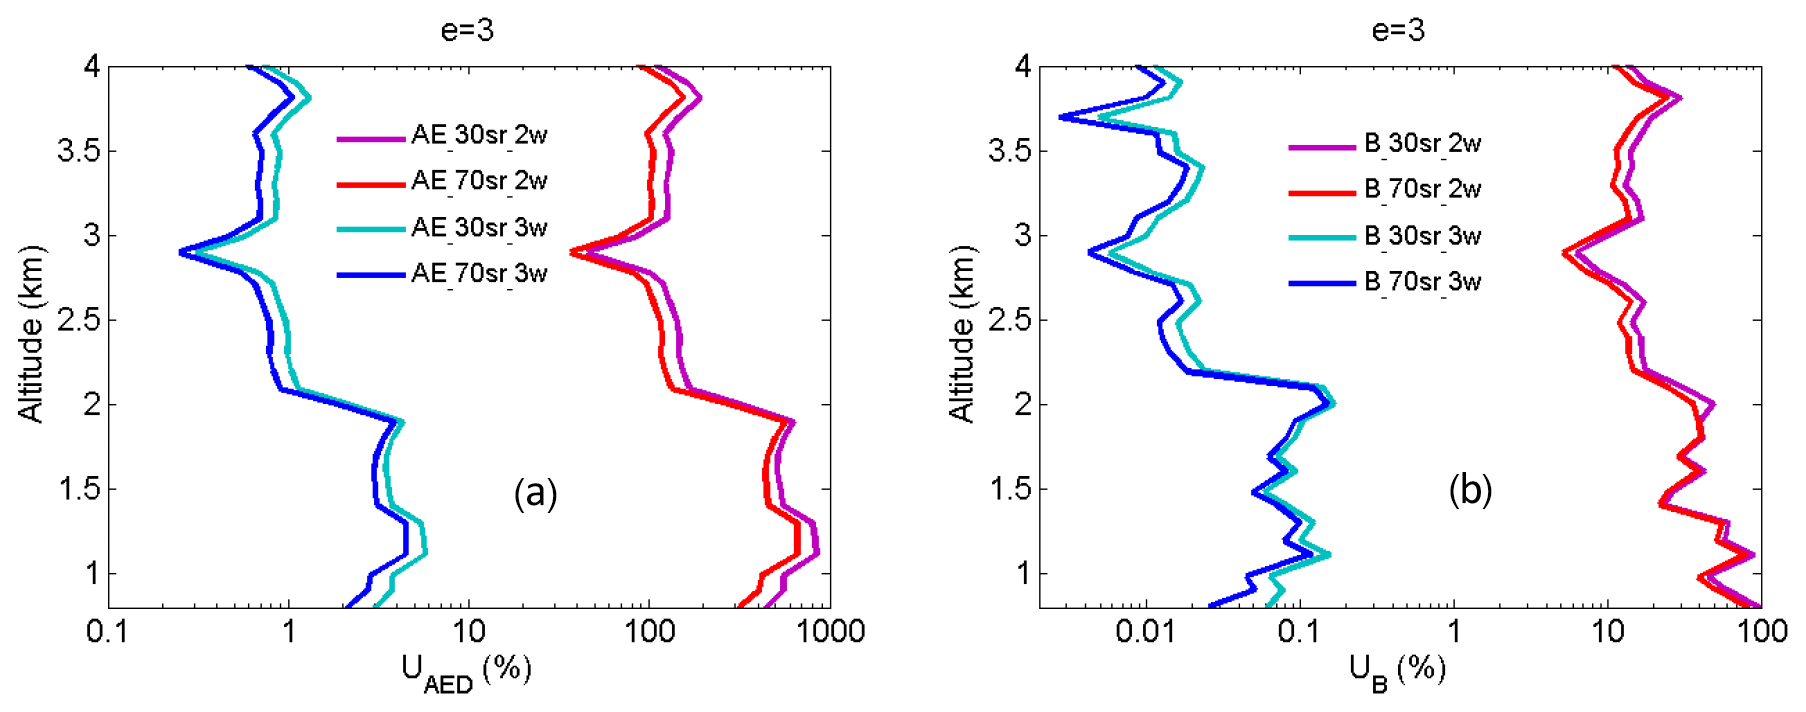
Figure 10NO2 number density relative uncertainty owing to aerosol extinction (a) and backscatter (b) with e = 3.
According to NO2 retrieval Eq. (4), the NO2 measurement uncertainty is due to molecules, absorption of gases other than the gas of interest, aerosol and noise of lidar signals. The total relative uncertainty can be expressed as Eq. (13) (Leblanc et al., 2016).
where is NO2 total retrieval relative uncertainty using the three-wavelength DIAL technique; UMED, UOAD, UAED, UB and US are NO2 retrieval relative uncertainty caused by molecules, absorption of gases other than the gas of interest, aerosol (extinction and backscattering) and noise of lidar signals expressed as Eqs. (14), (15), (16), (17) and (18); u is the uncertainty function; Nm and No are the number density (ND) of air and ozone; σm is the Rayleigh scattering cross-section; σo is the absorption cross-section of ozone; and S is the lidar ratio.

Figure 11NO2 number density relative uncertainty owing to the noise of signals with an average of 1 and 2 min.
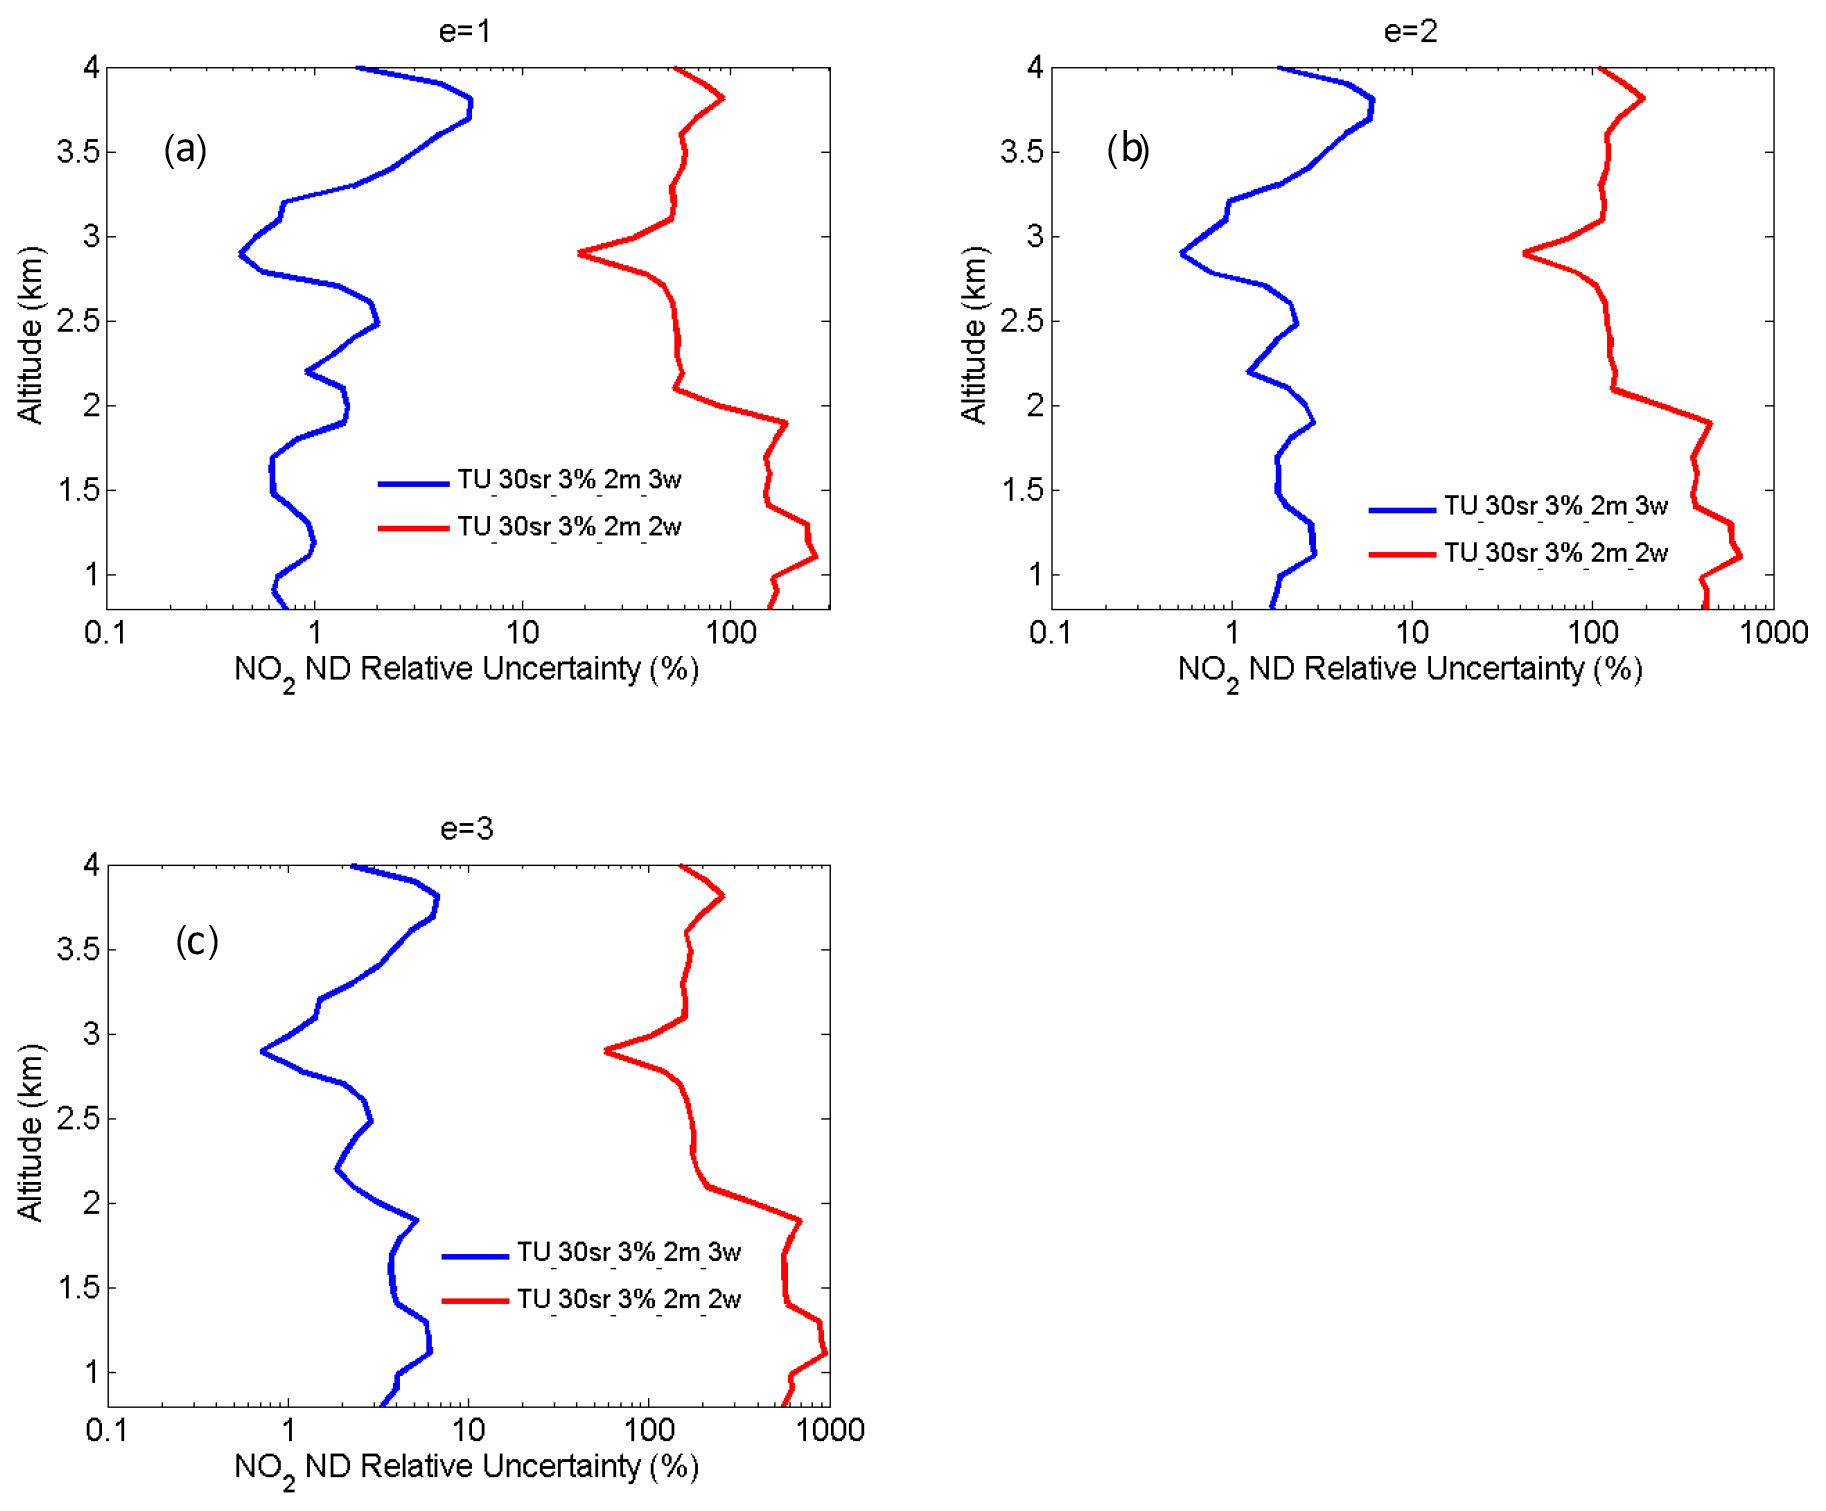
Figure 12NO2 number density total relative uncertainty with e = 1 (a), e = 2 (b) and e = 3 (c).
From Eqs. (14) and (15), UMED and UOAD are determined by u[Nm(z)] and u[No(z)] (uncertainties in Nm and No). In our measurements, profiles of temperature and pressure from local radiosondes are used to calculate Nm. Usually, one radiosonde is launched for about 8 h of measurement. One profile of air number density from local radiosondes is used to correct 8 h NO2 measurements. According to statistics of 8 h variation in temperature and pressure in four local seasons, the uncertainty in Nm is between 1 % and 3 %. UMED using the two-wavelength DIAL technique and the three-wavelength DIAL technique is calculated according to Eq. (14), with the uncertainty in Na as 1 %, 2 % and 3 %, as shown in Fig. 7a. UMED using the three-wavelength DIAL technique is far less than using the two-wavelength DIAL technique. No is obtained from local measurements. Because of very low values of ozone absorption cross-section differentials, with the uncertainty in No as 50 % and 100 %, UOAD using the two-wavelength DIAL technique and UOAD using the three-wavelength DIAL technique are both less than 0.5 %, as seen in Fig. 7b. Ozone absorption correction is neglected in NO2 retrieval. From Eqs. (16) and (17), UAED and UB are determined by uncertainties in aa, βa and e. For the HU lidar system, 532 nm elastic signals are used to calculate aa and βa with the Fernald method to correct NO2 retrieval (Fernald et al., 1972). A value of 50 sr is usually chosen as a lidar ratio to retrieve aa and βa. The lidar ratio is variable, so uncertainties in aa and βa are caused by the chosen lidar ratio. The range of the lidar ratio is about 30 to 70 sr for 532 nm. The uncertainty in the lidar ratio is 40 % for 50 sr. The uncertainties in aa and βa are calculated with uncertainty in the lidar ratio as 40 %. Finally, UAED and UB using the two-wavelength DIAL technique and using the three-wavelength DIAL technique are calculated with the Ångström exponent as 1, 2 and 3, as shown in Figs. 8, 9 and 10. From these figures, UAED and UB using the three-wavelength DIAL technique are both less than 4 %. However, UAED below 2 km using the two-wavelength DIAL technique is more than 90 % after correction of aerosol extinction. From Eq. (18), US is determined by uncertainties in three-wavelength lidar signals. The uncertainties in lidar signals with an average integration time of 1 and 2 min are derived from Poisson statistics associated with the probability of detection of a repeated random event (Megie, 1985; Leblanc et al., 2016). NO2 number density relative uncertainty owing to the noise of lidar signals with an average integration time of 1 and 2 min is obtained, as shown in Fig. 11. We can see that US using the two-wavelength DIAL technique is smaller than using the three-wavelength DIAL technique. With an increase in average integration time from 1 to 2 min, US can be effectively reduced. At last, (the total relative uncertainties in NO2) with e as 1, 2 and 3 is calculated, as shown in Fig. 12a, b and c.
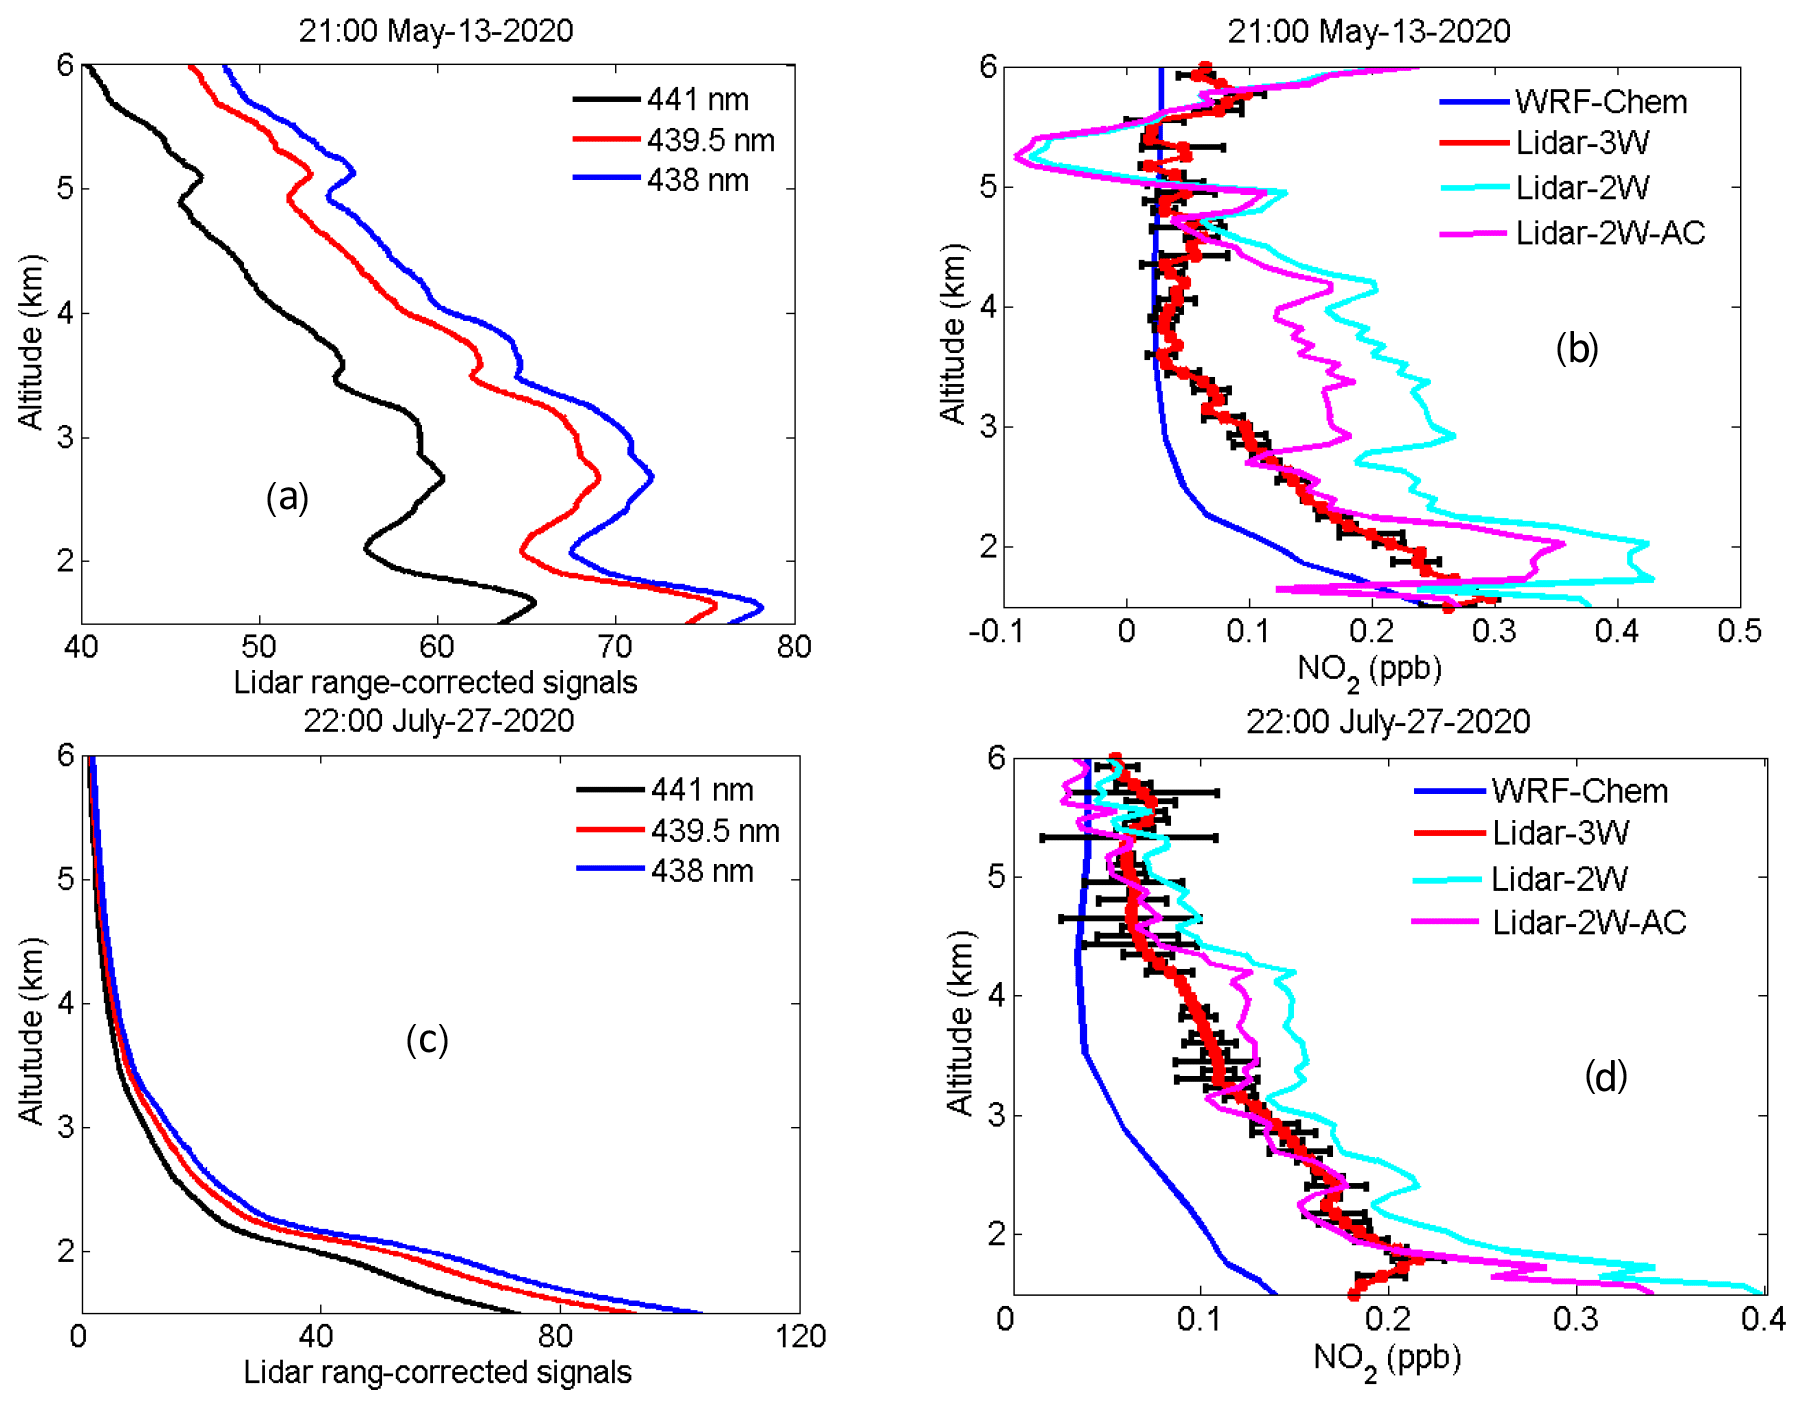
Figure 13HU lidar 438, 439.5 and 441 nm elastic signals measured at 21:00 LT on 13 May 2020 (a) and 22:00 LT on 27 July 2020 (c); NO2 profiles obtained using the three-wavelength DIAL technique, two-wavelength DIAL technique and WRF-Chem model at 21:00 LT on 13 May 2020 (b) and 22:00 LT on 27 July 2020 (d).
The three-wavelength DIAL technique was implemented by the HU lidar measurements during two cases at night, and the resulting vertical profiles are presented in Fig. 13. All NO2 lidar measurements presented here are obtained at times with less than 10 % cloud coverage below 8 km. HU lidar 438 nm (blue line), 439.5 nm (red line) and 441 nm (black line) elastic signals measured at 21:00 LT on 13 May 2020 and 22:00 LT on 27 July 2020 are shown in Fig. 13a and c, respectively. The average integration time for these signals is 2 min. Determined from the lidar elastic signals in Fig. 13a and c, there is an existing aerosol layer between 2.2 and 3.5 km on 13 May, while 27 July presented a clean atmosphere. Figure 13b and d show retrieved NO2 profiles using the three-wavelength DIAL technique (red line). The black error bars in Fig. 13b and d indicate the uncertainty in NO2 retrieval calculated using Eq. (13). In Fig. 13b, the retrieved NO2 profile between 2.2 and 3.5 km on 13 May is smooth and not affected by the aerosol layer. The NO2 profiles (sky-blue line and purple line) were also retrieved using the conventional two-wavelength DIAL technique without and with aerosol correction, as shown in Fig. 13b, resulting in a bump between 2.2 and 3.5 km in the NO2 profile retrieved using the two-wavelength DIAL technique. This inconsistency suggests that the two-wavelength DIAL technique cannot remove AED of the aerosol layer between 2.2 and 3.5 km, and the retrieved NO2 profile contains AED interference. Moreover, the NO2 retrievals below 2 km using the two-wavelength DIAL technique shown in Fig. 13b and d are more than the three-wavelength DIAL technique, suggesting that the AED of boundary aerosol was not correctly removed. Aerosol correction is very important for NO2 retrieval using the conventional two-wavelength DIAL technique (Sasano et al., 1985). These results suggest that the proposed three-wavelength DIAL technique can effectively remove the influence of aerosol on the retrieval of NO2. As a first-order assessment of the HU lidar NO2 profiles, we compare the retrieval results to simulated data from the Weather Research and Forecasting Chemistry (WRF-Chem) model (Grell et al., 2005) at 12 km × 12 km spatial resolution and 200 m vertical resolution. Past studies have demonstrated that WRF-Chem-simulated NO2 results show good agreement between the OMI satellite measurements and aircraft measurements (Amnuaylojaroen et al., 2019; Barten et al., 2020), providing a data source to examine the accuracy of the HU retrievals using both the two-wavelength DIAL technique and the three-wavelength DIAL technique. The HU local NO2 profiles for these two cases are simulated using the WRF-Chem model and shown in Fig. 13b and d. WRF-Chem-simulated NO2 magnitudes tend to be lower compared to HU-retrieved NO2 profiles using the three-wavelength DIAL technique (typically within ±0.1 ppb), except above 3.5 km on 13 May 2020; however, the comparison demonstrates a consistent vertical profile shape between observations and the model simulation. And retrieval results using the three-wavelength DIAL technique are much closer to simulated values compared to using the two-wavelength DIAL technique. These figures also demonstrate that the reduced fluctuations caused by aerosol backscatter when using the three-wavelength DIAL technique result in vertical profiles of NO2 which are much more consistent with simulated data when compared to results of the two-wavelength DIAL retrievals. Both the WRF-Chem-simulated profiles and the HU retrievals of NO2 using the three-wavelength DIAL technique are associated with uncertainties which could result in the differences in magnitude; however, the consistent nature in the vertical profile shapes from both data sources provides confidence that the HU lidar is retrieving NO2 vertical profiles using the three-wavelength DIAL technique in the troposphere.
This study describes a lidar retrieval technique using three wavelengths simultaneously emitted from an OPO laser to measure tropospheric NO2 profiles. The three-wavelength DIAL retrieval equations describe how the retrievals decrease errors caused by aerosol interference. Aerosol extinction differences using this proposed technique can be decreased to less than 2 % of the aerosol extinction differences resulting from a conventional two-wavelength DIAL technique. Comparing the HU lidar results to WRF-Chem model output demonstrates that the NO2 magnitudes and vertical structure are in much better agreement with simulated data when applying the three-wavelength DIAL technique compared to using the two-wavelength technique. In the future, we will add new filters to obtain daytime NO2 measurements. We also plan to purchase NO2 balloon sondes for acquiring true validation data to evaluate HU lidar NO2 results.
The software code for this paper is available from the first author.
The HU lidar data are archived at http://cas.hamptonu.edu/data-products/ (Su, 2020). DISCOVER-AQ data and WRF-Chem model output data are available from the first authors upon request.
The supplement related to this article is available online at: https://doi.org/10.5194/amt-14-4069-2021-supplement.
JS designed the three-wavelength OPO DIAL system, did simulation work for the system, developed the NO2 retrieval algorithm and prepared the original manuscript. PMM was responsible for funding acquisition. MSJ provided simulated data from the WRF-Chem model to verify NO2 retrieval in this study. JTS, MJN, TAB, SK and GPG contributed to the analysis of NO2 retrieval uncertainty. All listed authors contributed to the review and editing of this paper.
The authors declare that they have no conflict of interest.
The statements contained within the research article are not the opinions of the funding agency or the US government but reflect the author's opinions.
We thank NASA TOLNet and NASA DISCOVER-AQ for measurements for our simulation
work. Matthew S. Johnson's contribution was supported by NASA's TOLNet science team and the Tropospheric Composition Program. We also thank Gabriele Pfister from the Atmospheric Chemistry Observations and Modeling Lab at the National Center for Atmospheric Research for providing the WRF-Chem calculation applied in this study.
This research has been supported by the PIRT project funded by the US Army Research, Development and Engineering Command (AQC) Center (DOD) under HU PIRT award no. 551150-211150 and the National Oceanic and Atmospheric Administration Cooperative Science Center for Earth System and Sciences and Remote Sensing Technologies (NOAA-CESSRST) under the cooperative agreement grant no. NA16SEC4810008
This paper was edited by Piet Stammes and reviewed by one anonymous referee.
Amnuaylojaroen, T., Macatangay, R. C., and Khodmanee, S.: Modeling the effect of VOCs from biomass burning emissions on ozone pollution in upper Southeast Asia, Heliyon., 5, e02661, https://doi.org/10.1016/j.heliyon.2019.e02661, 2019.
Barten, J. G. M., Ganzeveld, L. N., Visser, A. J., Jiménez, R., and Krol, M. C.: Evaluation of nitrogen oxides (NOx) sources and sinks and ozone production in Colombia and surrounding areas, Atmos. Chem. Phys., 20, 9441–9458, https://doi.org/10.5194/acp-20-9441-2020, 2020.
Beirle, S., Platt, U., Wenig, M., and Wagner, T.: Weekly cycle of NO2 by GOME measurements: a signature of anthropogenic sources, Atmos. Chem. Phys., 3, 2225–2232, https://doi.org/10.5194/acp-3-2225-2003, 2003.
Beirle, S., Boersma, K., Platt, U., Lawrence, M., and Wagner, T.: Megacity Emissions and Lifetimes of Nitrogen Oxides Probed from Space, Science, 333, 1737–1739, 2011.
Berg, N., Mellqvist, J., Jalkanen, J.-P., and Balzani, J.: Ship emissions of SO2 and NO2: DOAS measurements from airborne platforms, Atmos. Meas. Tech., 5, 1085–1098, https://doi.org/10.5194/amt-5-1085-2012, 2012.
Berglund, M., Boström, C. E., Bylin, G., Ewetz, L., Gustafsson, L., Moldéus, P., Norberg, S., Pershagen, G., and Victorin, K.: Health risk evaluation of nitrogen oxides, Scand. J. Work Env. Hea., 19, 67–69, 1993.
Bertram, T. H., Heckel, A., Richter, A., Burrows, J. P., and Cohen, R. C.: Satellite measurements of daily variations in soil NOx emissions, Geophys. Res. Lett., 32, L24812, https://doi.org/10.1029/2005GL024640, 2005.
Boersma, K. F., Jacob, D. J., Eskes, H. J., Pinder, R. W., Wang, J., and Van Der A, R. J.: Intercomparison of SCIAMACHY and OMI tropospheric NO2 columns: Observing the diurnal evolution of chemistry and emissions from space, J. Geophys. Res., 113, D16S26, https://doi.org/10.1029/2007JD008816, 2008.
Bovensmann, H., Burrows, J. P., Buchwitz, M., Frerick, J., Noel, S., Rozanov, V. V., Chance, K. V., and Goede, A. P. H.: SCIAMACHY: Mission objectives and measurement modes, J. Atmos. Sci., 56, 127–150, 1999.
Bucsela, E. J., Perring, A. E., Cohen, R. C., Boersma, K. F., Celarier, E. A., Gleason, J. F., Wenig, M. O., Bertram, T. H., Wooldridge, P. J., Dirksen, R., and Veefkind, J. P.: Comparison of tropospheric NO2 in situ aircraft measurements with near-real-time and standard product data from the Ozone Monitoring Instrument, J. Geophys. Res., 113, D16S31, https://doi.org/10.1029/2007JD008838, 2008.
Celarier, E. A., Brinksma, E. J., Gleason, J. F., Veefkind, J. P., Cede, A., Herman, J. R., Ionov, D., Goutail, F., Pommereau, J. P., Lambert, J. C., Roozendael, M. V., Pinardi, G., Wittrock, F., Schönhardt, A., Richter, A., Ibrahim, O. W., Wagner, T., Bojkov, Mount, B., G., Spinei, E., Chen, C. M., Pongetti, T. J., Sander, S. P., Bucsela, E. J., Wenig, M. O., Swart, D. P. J., Volten, H., Kroon, M., and Levelt, P. F.: Validation of Ozone Monitoring Instrument nitrogen dioxide columns, J. Geophys. Res., 113, D15S15, https://doi.org/10.1029/2007JD008908, 2008.
Cui, Y., Lin, J., Song, C., Liu, M., Yan, Y., Xu, Y., and Huang, B.: Rapid growth in nitrogen dioxide pollution over Western China, 2005–2013, Atmos. Chem. Phys., 16, 6207–6221, https://doi.org/10.5194/acp-16-6207-2016, 2016.
Fernald, F. G., Herman, B. M., and Reagan, J. A.: Determination of aerosol height distributions by lidar, J. Appl. Meteorol., 11, 482–489, 1972
Fredriksson, K. A. and Hertz, H. M.: Evaluation of the DIAL technique for studies on NO2 using a mobile lidarsystem, Appl. Opt., 23, 1403–1411, 1984.
Georgoulias, A. K., Boersma, K. F., Vliet, J., Zhang, X., Ronald, A., Zani, P., and Laa, J.: Detection of NO2 pollution plumes from individual ships with the TROPOMI/S5P satellite sensor, Environ. Res. Lett., 15, 124037, https://doi.org/10.1088/1748-9326/abc445, 2020.
Grell, G. A., Peckham, S. E., Schmitz, R., McKeen, S. A., Frost, G., Skamarock, W. C., and Eder B.: Fully coupled “online” chemistry within the WRF model, Atmos. Environ., 39, 6957–6975, https://doi.org/10.1016/j.atmosenv.2005.04.027, 2005.
Herman, J., Cede, A., Spinei, E., Mount, G., Tzortziou, M., and Abuhassan, N.: NO2 column amounts from ground-based Pandora and DOAS spectrometers using the direct-sun DOAS technique: Intercomparisons and application to OMI validation, J. Geophys. Res., 114, D13307, https://doi.org/10.1029/2009JD011848, 2009.
Kollonige, D. E., Thompson, A. M., Josipovic, M., Tzortziou, M., Beukes, J. P., Burger, R., Martins, D. K., van Zyl, P. G., Vakkari, V., and Laakso, L.: OMI satellite and ground-based Pandora observations and their application to surface NO2 estimations at terrestrial and marine sites, J. Geophys. Res., 123, 1441–1459, 2018.
Kuang, S., Newchurch, M. J., Burris, J., and Liu, X.: Ground-based lidar for atmospheric boundary layer ozone measurements, Appl. Opt., 52, 3557–3566, https://doi.org/10.1364/AO.52.003557, 2013.
Kuang, S., Wang, B., Newchurch, M. J., Knupp, K., Tucker, P., Eloranta, E. W., Garcia, J. P., Razenkov, I., Sullivan, J. T., Berkoff, T. A., Gronoff, G., Lei, L., Senff, C. J., Langford, A. O., Leblanc, T., and Natraj, V.: Evaluation of UV aerosol retrievals from an ozone lidar, Atmos. Meas. Tech., 13, 5277–5292, https://doi.org/10.5194/amt-13-5277-2020, 2020.
Lamsal, L. N., Krotkov, N. A., Celarier, E. A., Swartz, W. H., Pickering, K. E., Bucsela, E. J., Gleason, J. F., Martin, R. V., Philip, S., Irie, H., Cede, A., Herman, J., Weinheimer, A., Szykman, J. J., and Knepp, T. N.: Evaluation of OMI operational standard NO2 column retrievals using in situ and surface-based NO2 observations, Atmos. Chem. Phys., 14, 11587–11609, https://doi.org/10.5194/acp-14-11587-2014, 2014.
Larkin, A., Geddes, J. A., Martin, R. V., Xiao, Q., Liu, Y., Marshall, J. D., Brauer, M., and Hystad, P.: Global Land Use Regression Model for Nitrogen Dioxide Air Pollution, Environ. Sci. Technol., 51, 6957–6964, 2017.
Leblanc, T., Sica, R. J., van Gijsel, J. A. E., Godin-Beekmann, S., Haefele, A., Trickl, T., Payen, G., and Liberti, G.: Proposed standardized definitions for vertical resolution and uncertainty in the NDACC lidar ozone and temperature algorithms – Part 2: Ozone DIAL uncertainty budget, Atmos. Meas. Tech., 9, 4051–4078, https://doi.org/10.5194/amt-9-4051-2016, 2016.
Li, Z., Guo, J., Ding, A., Liao, H., Liu, J., Sun Y., Wang, T., Xue, H., Zhang, H., and Zhu, B.: Aerosol and boundary-layer interactions and impact on air quality, Natl. Sci. Rev., 4, 810–833, https://doi.org/10.1093/nsr/nwx117, 2017.
Liang, M., Guan, P., and Zheng, K.: Remote sensing of atmospheric NO2 by employing the continuous-wave differential absorption lidar technique, Opt. Express., 25, A953–A962, 2017.
Liu, Q., Chen,Yafeng, J., Wang, J., and Hu, S.: Measurement of atmospheric NO2 profile using three-wavelength dual-differential absorption lidar, Proc. SPIE., 10605, 106053L, https://doi.org/10.1117/12.2295725, 2017.
Lorente, A. B., Boersma K. F., Eskes, H. J., Veefkind, J. P., Geffen, J. H. G. M., Zeeuw, M. B., Denier, H. A. C., Beirle, S., and Krol, M. C.: Quantification of nitrogen oxides emissions from build-up of pollution over Paris with TROPOMI, Sci. Rep., 9, 20033, https://doi.org/10.1038/s41598-019-56428-5, 2019.
Megie, G.: Laser remote sensing: fundamentals and applications, EOS, 66, 686, https://doi.org/10.1029/EO066i040p00686-05, 1985.
Newchurch, M. J., Ayoub, M. A., Oltmans, S., Johnson, B., and Schmidlin, F. J.: Vertical distribution of ozone at four sites in the United States, J. Geophys. Res., 108, 4031–4038, https://doi.org/10.1029/2002JD002059, 2003.
Reid, J. S., Kuehn, R. E., Holz, R. E., Eloranta, E. W., Kaku,K. C., Kuang, S., Newchurch, M. J., Thompson, A. M., Trepte, C. R., Zhang, J., Atwood, S. A., Hand, J. L., Holben, B. N., Minnis, P., and Posselt, D. J.: Ground based high spectral resolution lidar observation of aerosol vertical distribution in the summertime Southeast United States, J. Geophys. Res.-Atmos., 122, 2970–3004, https://doi.org/10.1002/2016JD025798, 2017.
Rothe, K. W., Brinkmann, U., and Walther, H.: Applications of tunable dye lasers to air pollution detection: measurements of atmospheric NO2 concentrations by differential absorption, Appl. Phys., 3, 115–119, https://doi.org/10.1007/BF00884408, 1974.
Russell, A. R., Valin, L. C., and Cohen, R. C.: Trends in OMI NO2 observations over the United States: effects of emission control technology and the economic recession, Atmos. Chem. Phys., 12, 12197–12209, https://doi.org/10.5194/acp-12-12197-2012, 2012.
Sasano, Y., Browell, E. V., and Ismail, S.: Error caused by using a constant extinction/ backscattering ratio in the lidar solution, Appl. Opt., 24, 3929–3932, 1985.
Schuster, G., Dubovik, O., and Holben, B. N.: Ångström exponent and bimodal aerosol size distributions, J. Geophys. Res., 111, D07207, https://doi.org/10.1029/2005JD006328, 2006.
Scott, D. C., Herman, R. L., Webster, C. R., May, R. D., Flesch, G. J., and Moyer, E. J.: Airborne Laser Infrared Absorption Spectrometer (ALIAS-II) for in situ atmospheric measurements of N2O, CH4, CO, HCL, and NO2 from balloon or remotely piloted aircraft platforms, Appl. Opt., 38, 4609–4622, 1999.
Sluis, W. W., Allaart, M. A. F., Piters, A. J. M., and Gast, L. F. L.: The development of a nitrogen dioxide sonde, Atmos. Meas. Tech., 3, 1753–1762, https://doi.org/10.5194/amt-3-1753-2010, 2010.
Su, J.: Hampton University Lidar data, avaialble at: http://cas.hamptonu.edu/data-products/, last access: 18 October 2020.
Sullivan, J., Rabenhorst, S. D., Dreessen, J., McGee, T. J., Delgado, R., Twigg, L., and Sumnicht, G.: Lidar observations revealing transport of O3 in the presence of a nocturnal low-level jet: Regional implications for “next-day” pollution, Atmos. Environ., 158, 160–171, 2017.
Sullivan, J. T., McGee, T. J., Sumnicht, G. K., Twigg, L. W., and Hoff, R. M.: A mobile differential absorption lidar to measure sub-hourly fluctuation of tropospheric ozone profiles in the Baltimore–Washington, D.C. region, Atmos. Meas. Tech., 7, 3529–3548, https://doi.org/10.5194/amt-7-3529-2014, 2014.
U.S. EPA: Climate change indicators in the United States, 2016, 4th edition, Washington D.C., USA, EPA 430-R-16-004, 2016.
U.S. EPA: Data from the Air Pollutant Emission Trends Data website, available at: https://www.epa.gov/air-emissions-inventories/air-pollutant-emissions-trends-data, last access: 6 March 2020.
Valks, P., Pinardi, G., Richter, A., Lambert, J.-C., Hao, N., Loyola, D., Van Roozendael, M., and Emmadi, S.: Operational total and tropospheric NO2 column retrieval for GOME-2, Atmos. Meas. Tech., 4, 1491–1514, https://doi.org/10.5194/amt-4-1491-2011, 2011.
Volten, H., Brinksma, E. J., Berkhout, A. J. C., Hains, J., Bergwerff, J. B., Van der Hoff, G. R., Apituley, A., Dirksen, R. J., Calabretta, J. S., and Swart, D. P. J.: NO2 lidar profile measurements for satellite interpretation and validation, J. Geophys. Res., 114, D24301, https://doi.org/10.1029/2009JD012441, 2009.
Wang, Z., Nakane, H., Hu, H., and Zhou J.: Three-wavelength dual differential absorption lidar method for stratospheric ozone measurements in the presence of volcanic aerosols, Appl. Opt., 36, 1245–1252, 1997.
Weibring, P., Smith, J. N., Edner, H., and Svanberg, S.: Development and testing of a frequency-agile optical parametric oscillator system for differential absorption lidar, Rev. Sci. Instrum., 74, 4478–4486, https://doi.org/10.1063/1.1599065, 2003.