the Creative Commons Attribution 4.0 License.
the Creative Commons Attribution 4.0 License.
 | 02 Jun 2021
Oxygen isotope exchange between water and carbon dioxide in soils is controlled by pH, nitrate and microbial biomass through links to carbonic anhydrase activity
Sam P. Jones
Aurore Kaisermann
Jérôme Ogée
Steven Wohl
Alexander W. Cheesman
Lucas A. Cernusak
Lisa Wingate
The oxygen isotope composition of atmospheric carbon dioxide (CO2) is intimately linked to large-scale variations in the cycling of CO2 and water across the Earth's surface. Understanding the role the biosphere plays in modifying the oxygen isotope composition of atmospheric CO2 is particularly important as this isotopic tracer has the potential to constrain estimates of important processes such as gross primary production at large scales. However, constraining the atmospheric mass budget for the oxygen isotope composition of CO2 also requires that we understand better the contribution of soil communities and how they influence the rate of oxygen isotope exchange between soil water and CO2 (kiso) across a wide range of soil types and climatic zones. As the carbonic anhydrases (CAs) group of enzymes enhances the rate of CO2 hydration within the water-filled pore spaces of soils, it is important to develop understanding of how environmental drivers can impact kiso through changes in their activity. Here we estimate kiso and measure associated soil properties in laboratory incubation experiments using 44 soils sampled from sites across western Eurasia and north-eastern Australia. Observed values for kiso always exceeded theoretically derived uncatalysed rates, indicating a significant influence of CAs on the variability of kiso across the soils studied. We identify soil pH as the principal source of variation, with greater kiso under alkaline conditions suggesting that shifts in microbial community composition or intra–extra-cellular dissolved inorganic carbon gradients induce the expression of more or higher activity forms of CAs. We also show for the first time in soils that the presence of nitrate under naturally acidic conditions reduces kiso, potentially reflecting a direct or indirect inhibition of CAs. This effect appears to be supported by a supplementary ammonium nitrate fertilisation experiment conducted on a subset of the soils. Greater microbial biomass also increased kiso under a given set of chemical conditions, highlighting a putative link between CA expression and the abundance of soil microbes. These data provide the most extensive analysis of spatial variations in soil kiso to date and indicate the key soil trait datasets required to predict variations in kiso at large spatial scales, a necessary next step to constrain the important role of soil communities in the atmospheric mass budget of the oxygen isotope composition of CO2.
- Article
(1458 KB) - Full-text XML
-
Supplement
(4882 KB) - BibTeX
- EndNote


Quantifying the carbon storage potential of terrestrial ecosystems and its sensitivity to climate change relies on our ability to obtain observational constraints of photosynthesis and respiration at large scales (Beer et al., 2010). Over recent decades there has been increasing interest in using the oxygen isotope composition (δ18O and δ17O) of atmospheric carbon dioxide (CO2) to trace these large and opposing CO2 fluxes. This is possible because the δ18O of leaf–atmosphere CO2 exchange is relatively enriched in 18O compared to that of atmospheric CO2 and the δ18O of soil–atmosphere CO2 exchange (Francey and Tans, 1987; Wingate et al., 2009; Welp et al., 2011). Similarly, photochemical processes in the stratosphere cause anomalies between the δ17O and δ18O of atmospheric CO2 that are subsequently reset during leaf–atmosphere CO2 exchange (Hoag et al., 2005; Koren et al., 2019; Adnew et al., 2020). However, the routine use of these tracers to constrain the photosynthetic term of the atmospheric mass budget for the δ18O and δ17O of CO2 has been hampered by an incomplete understanding of how the influence of soil–atmosphere CO2 exchange varies across different soil types and environmental conditions. Here we focus on δ18O, but the key challenges to understanding these variations are also relevant to considerations of δ17O.
Both soil respiration and leaf photosynthesis influence the δ18O of atmospheric CO2 because of the exchange of oxygen isotopes between water and CO2 molecules during the reversible hydration of CO2 to bicarbonate (Mills and Urey, 1940). In a closed system at chemical equilibrium, CO2 will reach isotopic equilibrium with water after some time depending on the rate of this oxygen isotope exchange, kiso (s−1) (Uchikawa and Zeebe, 2012). Predicting variations in kiso within soils is one of the key uncertainties in estimating the δ18O of soil–atmosphere CO2 exchange at large scales. As a consequence of this isotopic exchange, any CO2 molecules invading soils from the atmosphere or being produced in the soil during respiration or organic matter decomposition will gradually inherit the δ18O of the soil water pool as it diffuses within the soil profile (Tans, 1998). The degree to which the δ18O of CO2 inherits the δ18O of a given soil water pool is determined by the residence time of dissolved CO2 and the apparent kiso (Miller et al., 1999). Longer residence times or greater kiso move the system closer to isotopic equilibrium. As kiso results from the interconversion of aqueous CO2 and bicarbonate, kiso is expected to vary as a function of the combined rates of CO2 hydration, kh, and hydroxylation reactions as well as the pH-dependent speciation of dissolved inorganic carbon (DIC) (Uchikawa and Zeebe, 2012) (Fig. 1).
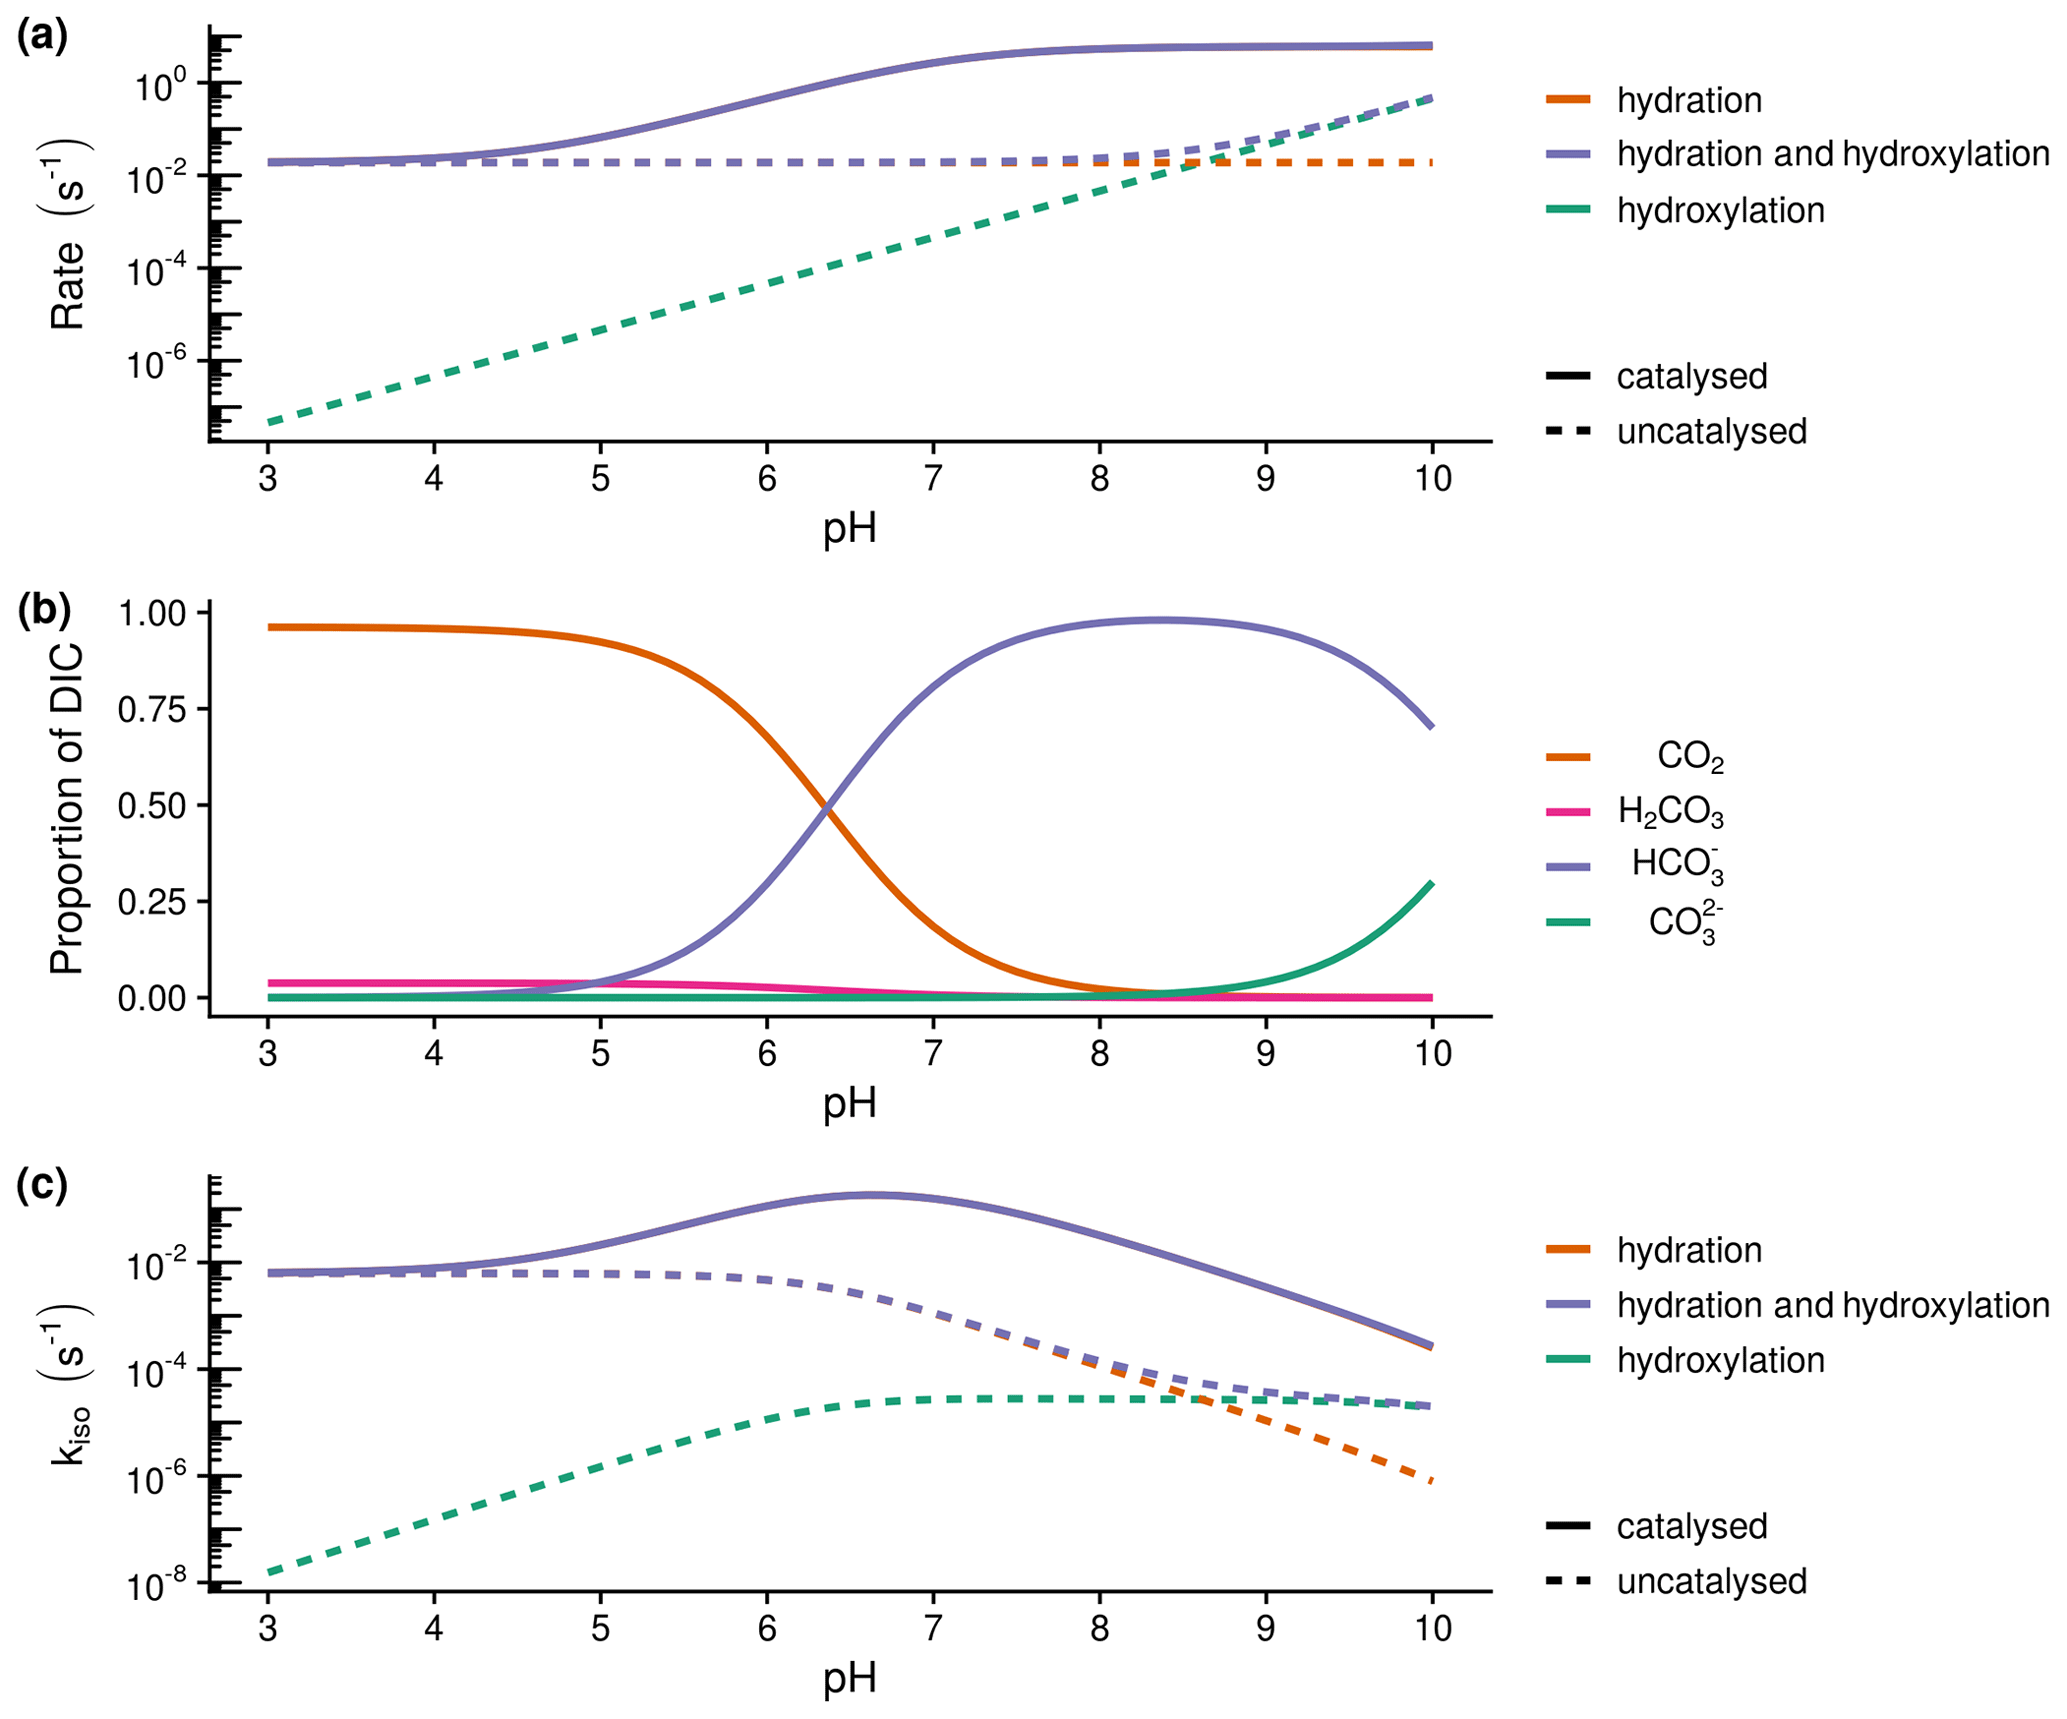
Figure 1Theoretical calculations of the expected relationship between the rate of hydration (kh) and hydroxylation reactions, the speciation of dissolved inorganic carbon (DIC) and the rate of oxygen isotope exchange (kiso): (a) expected variations in the rate of hydration (kh) and hydroxylation reactions with pH at 21 ∘C calculated following Uchikawa and Zeebe (2012) and Sauze et al. (2018). Dashed lines indicate uncatalysed rates, whilst solid lines include the presence of 200 nM of carbonic anhyrdrase with M s−1 and a pka of 7.1. The catalysed rate of hydration decreases under acidic conditions as high proton concentrations limit enzyme regeneration, (b) speciation of dissolved inorganic carbon (DIC) calculated from rate constants at 21 ∘C, and (c) expected variations in the rate of isotope exchange (kiso) with pH calculated as in the first panel (a). The rate of exchange is limited by enzyme regeneration under acidic conditions and the availability of CO2 under alkaline conditions.
The rate of CO2 hydration, kh, is enhanced in the presence of enzymes known as carbonic anhydrases (CAs). Currently, at least seven distinct CA gene families have been identified, with each catalysing the reversible hydration of CO2 to bicarbonate (Jensen et al., 2019). Whilst this reaction occurs abiotically (Fig. 1a), kh is generally considered too slow for metabolic processes (Bar-Even et al., 2011; Merlin et al., 2003; Smith and Ferry, 2000). Consequently, the need for organisms to rapidly control the transport and availability of CO2, bicarbonate and protons in numerous metabolic pathways is considered the main driver underlying the convergent evolution of these enzymes (Smith and Ferry, 2000). Various lines of evidence indicate that a wide diversity of microbes carry the genes for multiple CAs (Smith et al., 1999) and that these genes are expressed in soils (Meredith et al., 2019). The presence of active CAs in soils, through the influence of enhanced kh on kiso, helps explain variations in the δ18O of soil–atmosphere CO2 exchange observed under field (Seibt et al., 2006; Wingate et al., 2008, 2009, 2010) and laboratory conditions (Jones et al., 2017; Meredith et al., 2019; Sauze et al., 2017, 2018). The size and composition of microbial communities present may thus be an important control on the apparent kiso of soils (Wingate et al. 2009).
Soil pH strongly regulates the capacity of soils to store and supply nutrients and exerts control on the productivity of terrestrial ecosystems (Slessarev et al., 2016). It is well established that pH has a strong effect on the dominant forms of DIC (Fig. 1b) and thus may influence the δ18O of soil–atmosphere CO2 exchange through its affect on kiso (Fig. 1c). Moreover, the combined impact of pH and DIC speciation leads to an optimum, occurring under slightly acidic conditions, in the response of kiso to increased rates of CO2 hydration, kh, in the presence of CAs (Fig. 1c). Laboratory experiments have shown that kh and consequently kiso for different carbonic anhydrases (α-CA and β-CA for a given concentration and efficiency) are relatively lower under acidic conditions compared to the rates observed in neutral and slightly alkaline conditions (Rowlett et al., 2002; Sauze et al., 2018). Primarily, this behaviour is caused by the presence of high proton concentrations surrounding the enzyme at low pH values that leads to an inhibition of the de-protonation step required for enzyme regeneration (Rowlett et al., 2002). In contrast, kiso decreases independently from kh under alkaline conditions owing to a predominance of bicarbonate and carbonate ions and a correspondingly low abundance of CO2 (Fig. 1b; Uchikawa and Zeebe, 2012). Based on this knowledge of how kiso varies with pH and DIC in the presence (and absence) of CA, it seems probable that spatial variations in soil pH often found in different biomes will impact the apparent kiso and δ18O of soil–atmosphere CO2 exchange.
Microbes, like most organisms, must maintain a tightly regulated internal pH value of around 7 to ensure protein function and survive in a vast majority of soil environments (Hesse et al., 2002; Krulwich et al., 2011; Slonczewski et al., 2009). It appears that CAs may play an important role in buffering organisms from potentially harmful changes in the pH (Slonczewski et al., 2009; Krulwich et al., 2011) and DIC levels of their surrounding environment (Smith and Ferry, 2000). For example, Krulwich et al. (2011) indicate that there may be an up-regulation of CA expression as certain microbes are moved from neutral to acidic pH conditions. Likewise, bacteria and fungi grown under CO2-limited conditions can also up-regulate their CA expression (Amoroso et al., 2005; Kaur et al., 2009; Kozliak et al., 1995; Merlin et al., 2003). This suggests that the simple relationships with pH described in Fig. 1 for pure CAs in aqueous solutions may not hold for soils where microbial communities may utilise both intra- and extra-cellular CAs and dynamically fine-tune CA expression in response to changes in the surrounding environment. Currently, very few datasets exist to be able to probe this caveat, but it remains an important challenge that must be resolved to understand large-scale variations in apparent kiso and the δ18O of soil–atmosphere CO2 exchange.
Various anions may also play a role in controlling the activity of CAs (Tibell et al., 1984). In particular, nitrate () has been shown to inhibit different CAs in a range of microbes and plants (Amoroso et al., 2005; Innocenti et al., 2004; Peltier et al., 1995). This suggests that variations in soil nutrient availability between ecosystems could give rise to differences in kiso. Furthermore, the addition of common fertilisers such as ammonium nitrate (NH4NO3) to agricultural soils could have an inhibitory effect on CA activity in addition to causing shifts in the size and composition of microbial communities present. Indeed, this hypothesis is supported by recent NH4NO3 fertilising experiments that demonstrated decreases in the CA-catalysed hydrolysis of carbonyl sulfide (Kaisermann et al., 2018b). So far, the impact of nitrates on kiso has not been investigated in soils.
Here we investigate variations in the rate of oxygen isotope exchange, kiso, using controlled laboratory gas exchange measurements on soil incubations. To understand the drivers of these variations, we measured soils, with different chemical and physical properties, sampled from 44 sites across western Eurasia and north-eastern Australia. We also conducted a fertilisation experiment on a subset of these soils to investigate the influence of changes in nitrogen availability. Based on the potential controls on kiso presented above, we tested three specific, non-exclusive, hypotheses: (1) kiso increases as microbial biomass increases (H1), (2) kiso increases as soil pH increases (H2), and (3) kiso decreases as the presence of increases (H3). For the Eurasian soils we also compare these drivers to the predictive power of relatively invariant soil properties that might be used to estimate the kiso in soils at the regional scale and above as required by efforts to better constrain gross primary production.
To investigate the outlined hypotheses, two similar measurement campaigns, each consisting of a spatial survey and an NH4NO3 addition experiment, were conducted. These campaigns set out to characterise the variability and controls on the rate of oxygen isotope exchange, kiso, across soils from a wide range of environments. In both cases we estimated kiso from gas exchange and soil physical property measurements (Jones et al., 2017; Sauze et al., 2018). In addition, we measured the pH, microbial biomass, exchangeable and exchangeable of the incubated soils to investigate the controls on kiso. The first campaign focused on soils sampled from across western Eurasia (EUR), whilst the second (AUS) focused on soils sampled in northern Queensland, Australia. Sampling sites were broadly classified using the principal land cover reported by previous studies or observed during sampling and climatic zone as indicated by the Köppen–Geiger climate classification map of Kottek et al. (2006) and Rubel et al. (2017).
2.1 Soil sampling and incubation preparation
For the EUR campaign, the superficial 10 cm of soil was sampled at three locations within each of the 27 sites during the Northern Hemisphere summer of 2016 (Fig. S1a in the Supplement). These sites represented a range of forests (n=16) and grasslands (n=6) located in subarctic (Dfc; n=6), temperate oceanic (Cfb; n=13), hot-summer Mediterranean (Csa; n=7) and hot semi-arid (Bsh; n=1) climate zones. In addition, we also sampled an agricultural field (n=1), a peatland (n=1) and some orchards (n=3). Soil samples were transported at ambient temperatures to the Bordeaux-Nouvelle Aquitaine Center of the National Institute of Agricultural and Environmental Research (INRAE), France. Upon arrival, samples were passed through a 4 mm sieve and mixed to create one homogeneous sample for each site. These soils were stored at 4 ∘C. A sub-sample of each of these soils was used to determine the initial water content and the soil water-holding capacity (Haney and Haney, 2010). For each soil three replicated incubations were prepared with glass jars of 15.54 cm in height and an internal diameter of 8.74 cm. Each jar was filled with the wet weight equivalent of 115 to 300 g of dry soil and the water content adjusted to 30 % of the water-holding capacity to create a soil column with a surface area of 60.0 cm2 and a depth of approximately 4 to 7 cm. The jars were then pre-incubated in a climate-controlled cabinet (MD1400, Snijders, Tilburg, NL) for 2 weeks in the dark at 22±1 ∘C. This cabinet was continuously flushed with approximately 20 L min−1 of ambient air provided by a pump with an intake line outside the building to avoid exposing the soil to elevated CO2 concentrations found within the laboratory. During this period, soil water content was periodically adjusted to account for evaporation. Approximately 18 h prior to measurement the jar was closed with a screw-tight glass lid equipped with inlet and outlet connections and flushed at 250 mL min−1 with dry, synthetic air to promote steady-state conditions. This flow was produced using an in-house dilution system that mixed pure CO2 from a cylinder into CO2-free air generated by an air compressor (FM2 Atlas Copto, Nacka, Sweden) equipped with a scrubbing column (Ecodry K-MT6, Parker Hannifin, USA). This system was set to achieve a CO2 concentration of 400±5 ppm and, reflecting the origin of the CO2 in the cylinder used, had a δ18O of approximately −25 ‰ VPDBg. Subsequently the jar was removed to conduct gas exchange and soil property measurements.
For the AUS campaign, we sampled the superficial 10 cm of soil at four locations within each of the 17 sites during July of 2017 and returned these samples on the same day to the Cairns campus of James Cook University (Fig. S1b). These sites fell within tropical monsoon (Am; n=3), humid subtropical (Cfa; n=9) and monsoon-influenced humid subtropical (Cwa; n=5) climate zones and were principally found in forests (n=9) and savannas (n=6), with the other remaining sites located in a pasture (n=1) and a stunted shrub-rich forest (n=1). These soils were passed through a 4 mm sieve and mixed to create a homogenous sample for each site. A sub-sample of each of these soils was used to determine the initial water content and estimate the re-packed bulk density of the soils. As with the EUR campaign, three replicate incubations were prepared in glass jars for each soil. These jars had a height of 11.56 cm and an internal diameter of 7.45 cm. A jar was filled with the wet weight equivalent of 215 to 450 g of dry soil and the water content adjusted to 30 % water-filled pore space to create a soil column with a surface area of 43.5 cm2 and a depth of approximately 8.5 cm. The jar was then pre-incubated in an insulated box for 1 week in the dark at 23±1 ∘C with periodic adjustments to the water content to account for evaporation. This box was continuously flushed with approximately 10 L min−1 of air provided by a compressor that serviced building-wide laboratory air distribution. The concentration of CO2 in this air was approximately 420 ppm and, reflecting its atmospheric origin, had a δ18O of approximately 0 ‰ VPDBg. Following pre-incubation the jar was removed to conduct gas exchange and soil property measurements.
An NH4NO3 addition experiment was also conducted in both campaigns. This involved the preparation of three additional replicated incubations as described above, for nine of the EUR sites and five of the AUS sites. Prior to the pre-incubation step, 0.7 mg of NH4NO3 g dry soil−1 was dissolved in water and used to adjust the water content of these additional replicate incubations. These were then incubated alongside the three other “control” incubations prepared as part of the spatial survey described above. The quantity of NH4NO3 applied was chosen to approximate a fertilisation treatment comparable to those typically applied in field studies (Ramirez et al., 2012).
2.2 Gas exchange measurements
Gas exchange measurements were made using a similar experimental set-up to that described in Jones et al. (2017). Each jar was connected to a gas delivery system that supplied one of two gas sources, δb,atm or δb,mix, to its inlet. The first inlet condition, δb,atm, consisted of a continuous flow of atmospheric air pumped from an external buffer volume, through a Drierite column (W. A. Hammond Drierite Co. Ltd, USA) to dry the air and directly to the inlet of the jar. The second condition, δb,mix, was produced by a second continuous flow of atmospheric air pumped from the buffer, through a soda lime column to remove CO2 and a second Drierite column. A mass-flow controller was used to dilute pure CO2 from a cylinder into this dry CO2 free air, and then this mix was supplied to the inlet of the jar. The flow rate of pure CO2 was controlled to match the concentration of the CO2 in δb,mix to that of δb,atm using a control loop feedback based on the difference in concentration between sub-samples of both flows measured with an infrared CO2 analyser (Li-6262, LI-COR Biosciences, USA). By doing so the principal difference between the two conditions was the isotopic composition of the CO2 present reflecting its origin in the atmosphere (δ18O–CO2 of ‰ VPDBg) or a cylinder (δ18O–CO2 of ‰ VPDBg). Following this system the selected gas flow was split into a chamber line with a flow rate of 171.48 µmol s−1, to which the jar was connected, and a bypass line that was measured by a CO2 isotope ratio infrared spectrometer (Delta Ray IRIS, Thermo Fischer Scientific, Germany). The gas supply system sequentially supplied the two inlet conditions to these measurement lines. Both inlet conditions were supplied for either 32 (EUR) or 34 (AUS) minutes. The first 20 (EUR) or 22 (AUS) minutes under each condition were used to flush the system and promote steady-state conditions in the incubation jar. The turnover time of air in the jar was less than 10 min. After this period, the final 12 min during which the condition was supplied was used for gas-exchange measurements. During this period the IRIS measured the chamber and bypass lines three times each for 2 min. Calibration gas was measured every 16 (EUR) or 18 (AUS) minutes with sequential 2 min measurements of two cylinders containing synthetic air with different CO2 concentrations but similar isotopic compositions. The concentrations of 12C16O16O, 13C16O16O and 12C18O16O recorded by the IRIS were processed as described in detail by Jones et al. (2017) to average the final 40 s of data collected for each measurement and calculate corrected concentrations and isotope ratios. The associated precision for the total concentration and δ18O of CO2 was 0.02 ppm and 0.06 ‰ VPDBg, respectively.
Reflecting the pre-incubation conditions, measurements for EUR began with δb,mix as the inlet condition before switching to δb,atm, whilst for AUS the sequence began with δb,atm and then switched to δb,mix. For EUR, the calibration cylinders (21 % O2 and 0.93 % Ar in a N2 balance, Deuste Steininger GmbH, Germany) had a total concentration, carbon isotope composition and δ18O of CO2, respectively, of 380.26 ppm, −3.06 ‰ VPDB and −14.63 ‰ VPDBg for the first cylinder and 481.62 ppm, −3.07 ‰ VPDB and 14.70 ‰ VPDBg for the second cylinder (IsoLab, Max Planck Institute for Biogeochemistry, Germany). For AUS, the calibration cylinders (21 % O2 and 1.12 % Ar in a N2 balance, BOC, Australia) had a total concentration, carbon isotope composition and δ18O of CO2, respectively, of 386.7 ppm, −33.42 ‰ VPDB and −26.33 ‰ VPDBg for the first cylinder and 486.7 ppm, −33.64 ‰ VPDB and −26.60 ‰ VPDBg for the second cylinder (Farquhar Laboratory, Australian National University, Australia).
The net CO2 flux, FR (), was calculated from corrected values for the three pairs of chamber and bypass line measurements made at each inlet condition following Eq. (1):
where u is the flow rate (mol s−1) through the chamber line, Cc is the total CO2 concentration (ppm) of the chamber line, Cb is the total CO2 concentration (ppm) of the bypass line and A is the surface area (m2) of the soil in the chamber. The resultant three values for each inlet condition were then averaged to yield a single flux rate. Similarly, the δ18O of CO2 exchange, δR (‰ VPDBg), was calculated following Eq. (2):
where δc is the δ18O of CO2 (‰ VPDBg) in the chamber line, δb is the δ18O of CO2 (‰ VPDBg) in the bypass line, Cc,12 (ppm) is the concentration of 12C16O16O in the chamber line and Cb,12 (ppm) is the concentration of 12C16O16O in the bypass line.
2.3 Soil properties
After being disconnected from the gas exchange system, a jar was weighed to determine the wet weight of the incubated soil and the total soil depth, zmax (m), measured using a caliper. Soil was then removed from the jar to determine soil water content, pH, microbial biomass, exchangeable and exchangeable . Soil water contents were determined gravimetrically for sub-samples based on water loss after oven drying for 24 h at 105 ∘C. In the EUR campaign, soil water content was determined for three 1.5 cm thick intervals between 0 and 4.5 cm depth. An average gravimetric water content (g g dry soil−1) was calculated for the soil column after weighting by total soil depth. In the AUS campaign, soil water content was determined for a single sample covering the total soil depth. Soil bulk density (g cm−3) was calculated from the gravimetric water content, the wet weight of the soil in the jar and the volume of the soil column. Total porosity, ϕt, was calculated from bulk density assuming a particle density of 2.65 g cm−3 (Linn and Doran, 1984). Volumetric water content, θw (m3 m−3), was calculated as the product of gravimetric water content and bulk density. The soil air-filled porosity, ϕa, was calculated as the difference between the total porosity and volumetric water content. The remaining soil column in the jar was then mixed and sub-samples were taken to determine pH, microbial biomass, exchangeable and exchangeable . Soil pH was determined in a slurry with a dry weight equivalent soil-to-water ratio of 1:5. Soil microbial biomass (µg C g dry soil−1) was determined based on the difference between dissolved carbon extracted from non-fumigated and chloroform-fumigated sub-samples using a slurry with a dry weight equivalent soil-to-potassium sulfate solution (0.5 M) ratio of 1:5 and an extraction efficiency value of 0.35. Exchangeable (µg N g dry soil−1) and (µg N g dry soil−1) were extracted in a slurry with a dry weight equivalent soil-to-potassium chloride solution (1 M) ratio of These extracts were filtered, frozen at −20 ∘C and shipped on dry ice to commercial laboratories (EUR: LAS INRAE Hauts-de-France, Arras, France; AUS: ASL Environmental, Brisbane, Queensland, Australia) for determination of dissolved carbon, and concentrations. Sub-samples of the homogenised soil used to fill jars in the EUR campaign were also taken to determine soil texture and carbon and nitrogen content by sampling site as part of a related study (Kaisermann et al., 2018a).
2.4 Estimating the oxygen isotope exchange rate
Following Jones et al. (2017), the rate of oxygen isotope exchange between soil water and CO2, kiso, was estimated from the inverse of the slope of the linear relationship between the δ18O of CO2 exchange and the δ18O of CO2 at the soil surface. Briefly, under the two gas-exchange measurement conditions induced by varying the δ18O of CO2 at the incubation inlet (δb,mix and δb,atm), the invasion flux or piston velocity of CO2, vinv (m s−1), can be estimated following Eq. (3):
where δR (‰ VPDBg) is the δ18O of CO2 exchange and δa (‰ VPDBg) is the δ18O of CO2 at the soil surface under the two different inlet conditions (δb,mix and δb,atm) and FR,μ () is the mean net CO2 flux under both conditions and Ca,μ (µmol m−3) is the mean total CO2 concentration at the soil surface measured under both conditions. Both δa and Ca were assumed equal to the δc and Cc measured in the chamber line as discussed previously. To correct for the influence of boundary conditions found at the bottom of incubation jars, particularly in shallower soil columns, the soil-depth-adjusted invasion flux, (m s−1), was determined iteratively to satisfy Eq. (4):
where zmax (m) is the total soil-column depth, κ is soil tortuosity calculated here following the formulation of Moldrup et al. (2003) for repacked soils, D (m2 s−1) is the diffusivity of 12C16O18O in air (Massman, 1998; Tans, 1998) and ϕa is the air-filled porosity of the soil (see Sauze et al., 2018, for the derivation). Subsequently kiso (s−1) was calculated following Eq. (5):
where B (m3 m−3) is the Bunsen solubility coefficient for CO2 in water (Weiss, 1974) and θw (m3 m−3) is the soil volumetric water content.
2.5 Statistical analyses
Statistical analyses were conducted in R version 3.5 (R Core Team, 2019). Of the 174 individual incubations prepared, 10 were excluded from the dataset because a record for one of the variables of interest, the rate, kiso, of oxygen isotope exchange, pH, microbial biomass, exchangeable or exchangeable , was missing. For the remaining 164 incubations with complete records, these variables were averaged by sampling site and, for the relevant subset, by whether they received a NH4NO3 addition.
The resultant dataset consisted of mean observations for 44 untreated soils (n=27/EUR and 17/AUS) and 14 soils (n=9/EUR and 5/AUS) that received a NH4NO3 addition. Spatial controls on kiso were investigated across the means of untreated soils. Correlations between kiso, pH, microbial biomass, exchangeable and exchangeable were investigated through Spearman's rank correlation between pairs of variables. To test the outlined hypotheses, a multiple generalised linear modelling approach was used to investigate which variables best explained variations in kiso (Thomas et al., 2017). As pH and exchangeable were strongly negatively correlated (Spearman's ), they were not considered together in the same model, whilst all other possible combinations, including the sampling campaign (EUR or AUS) to test for the undue influence of systematic experimental differences, were tested. Combinations were limited to models containing four or less predictive terms to prevent over-fitting, and each independent variable was centered and scaled to facilitate comparison among the different measurement scales. The model structure and predictive terms included in the minimal adequate model required to explain variations in kiso were selected based on a comparison of a sample size corrected Aikake information criterion (AICc) and visual assessment of the conformity of model residuals to the assumptions of normality, homogeneity and the absence of undue influential observations. This model was subsequently re-fitted with the original unstandardised variables. The same approach was also applied to the 27 soils from the EUR sampling campaign and extended to consider the relationships with soil texture and carbon and nitrogen contents to investigate their utility in up-scaling efforts. To prevent over-fitting, these models were limited to a maximum of two predictive terms. The predictive terms considered were soil sand, silt, clay, carbon and nitrogen content, the ratio of carbon to nitrogen content and soil pH.
To investigate the influence of the NH4NO3 addition on kiso, the variables of interest were expressed as the ratio of the mean of the soils that received an addition and that of their respective untreated counterparts with quotients smaller and greater than one, respectively, indicating a reduction and increase following addition. Correlations between these fractional changes for kiso, microbial biomass, pH, exchangeable and exchangeable were investigated through Spearman's rank correlation between pairs of variables. The minimal adequate, generalised linear model describing the fractional change in kiso across these soils was investigated by comparing the AICc and visual inspection of the residuals for models that considered each independent variable separately to avoid over-fitting.
3.1 Variations among untreated soils
Clear differences in kiso, pH, microbial biomass, exchangeable and exchangeable were not apparent as a function of sampling site climatic zone or land cover (Fig. 2). Estimates of kiso ranged from 0.01 to 0.40 s−1, with the greatest rates occurring in soils sampled from hot-summer Mediterranean (Csa), hot semi-arid (Bsh) and subtropical (Cfa and Cwa) climates (Fig. 2a). Soil pH ranged from 3.9 to 8.6 and was mostly acidic or neutral, with alkaline conditions only found for soils sampled from hot-summer Mediterranean (Csa) and hot semi-arid (Bsh) climates (Fig. 2b). Ranging from 98.5 to 2898.1 µg C g dry soil−1, microbial biomass did not appear to vary systematically with sampling site origin. Exchangeable ranged from 0.3 to 275.7 µg N g dry soil−1 (Fig. 2d) and exchangeable ranged from 2.5 to 64.7 µg N g dry soil−1, with the greatest values found in soils sampled from temperate climates (Fig. 2e).
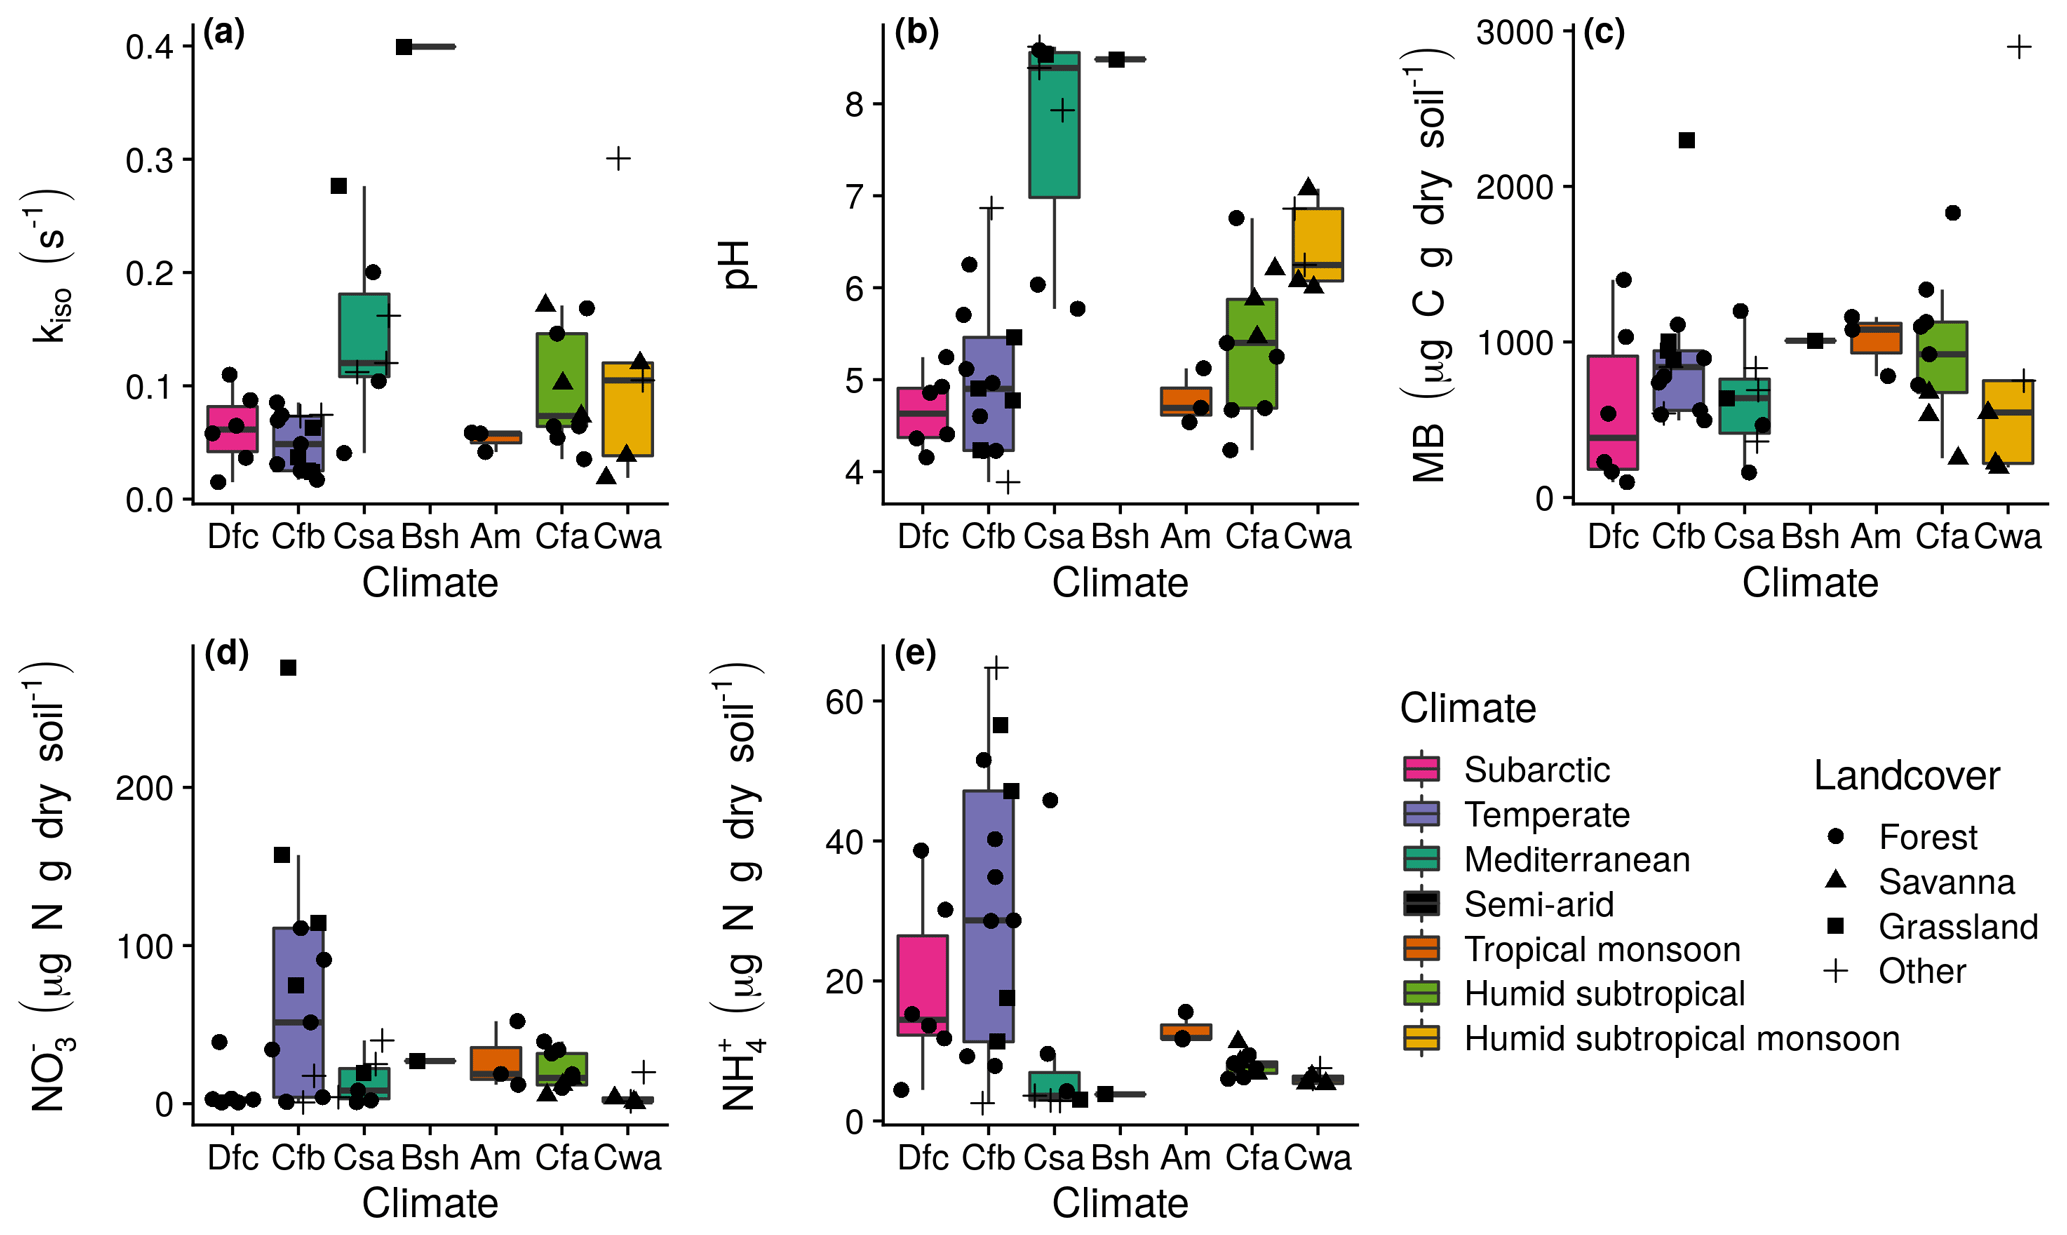
Figure 2Measurement summaries of mean untreated soils by the Köppen–Geiger climatic zone of the sampling site. The 27 sites in western Eurasia (EUR) were within subarctic (Dfc; n=6), temperate oceanic (Cfb; n=13), hot-summer Mediterranean (Csa; n=7) and hot semi-arid (Bsh; n=1) climate zones, and the 17 sites in northern Queensland, Australia (AUS), were within tropical monsoon (Am; n=3), humid subtropical (Cfa; n=9) and monsoon-influenced humid subtropical (Cwa; n=5) climate zones. Box lower, middle and upper hinges, respectively, indicate 0.25, 0.5 and 0.75 quantiles. Over-plotted points are the associated site means (n=2 or 3) with shape indicating land cover: (a) kiso, (b) pH, (c) microbial biomass (MB), (d) exchangeable , and (d) exchangeable .
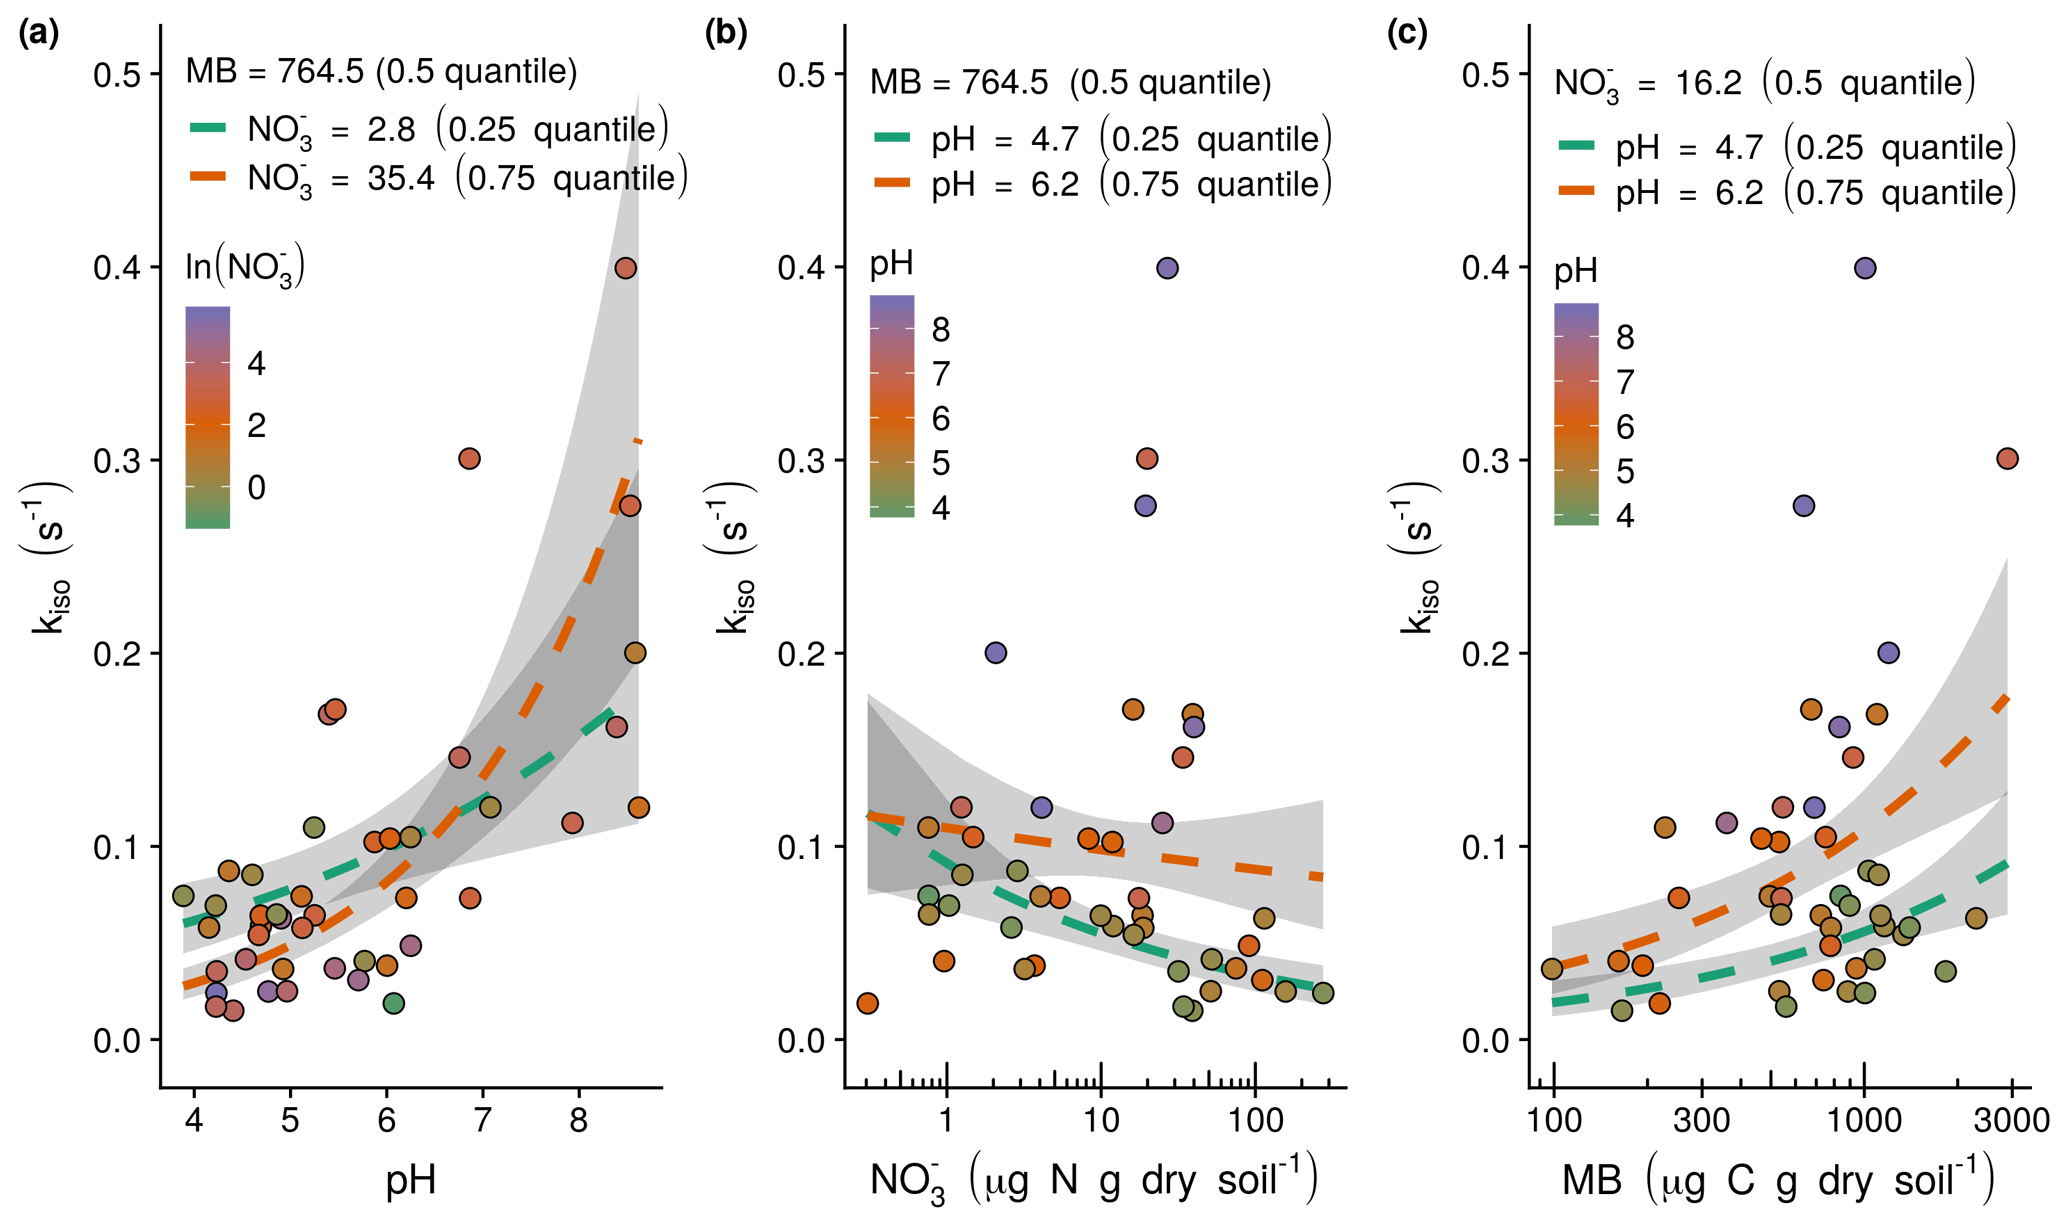
Figure 3Observed (points) and modelled relationships following Eq. (6) (dashed lines) between the rate of oxygen isotope exchange (kiso) and soil pH, exchangeable and microbial biomass (MB): (a) the positive relationship between kiso and soil pH with model response as a function of the shown range in soil pH calculated with median microbial biomass and lower quartile (green dashed line) and upper quartile (orange dashed line) exchangeable , (b) the negative relationship between kiso and exchangeable with model response as a function of the shown range in exchangeable calculated with median microbial biomass and lower quartile (green dashed line) and upper quartile (orange dashed line) soil pH, and (c) the positive relationship between kiso and microbial biomass with the model response as a function of the shown range in microbial biomass calculated with median exchangeable and lower quartile (green dashed line) and upper quartile (orange dashed line) soil pH. Grey shaded areas indicate the 95 % confidence intervals associated with model fits.
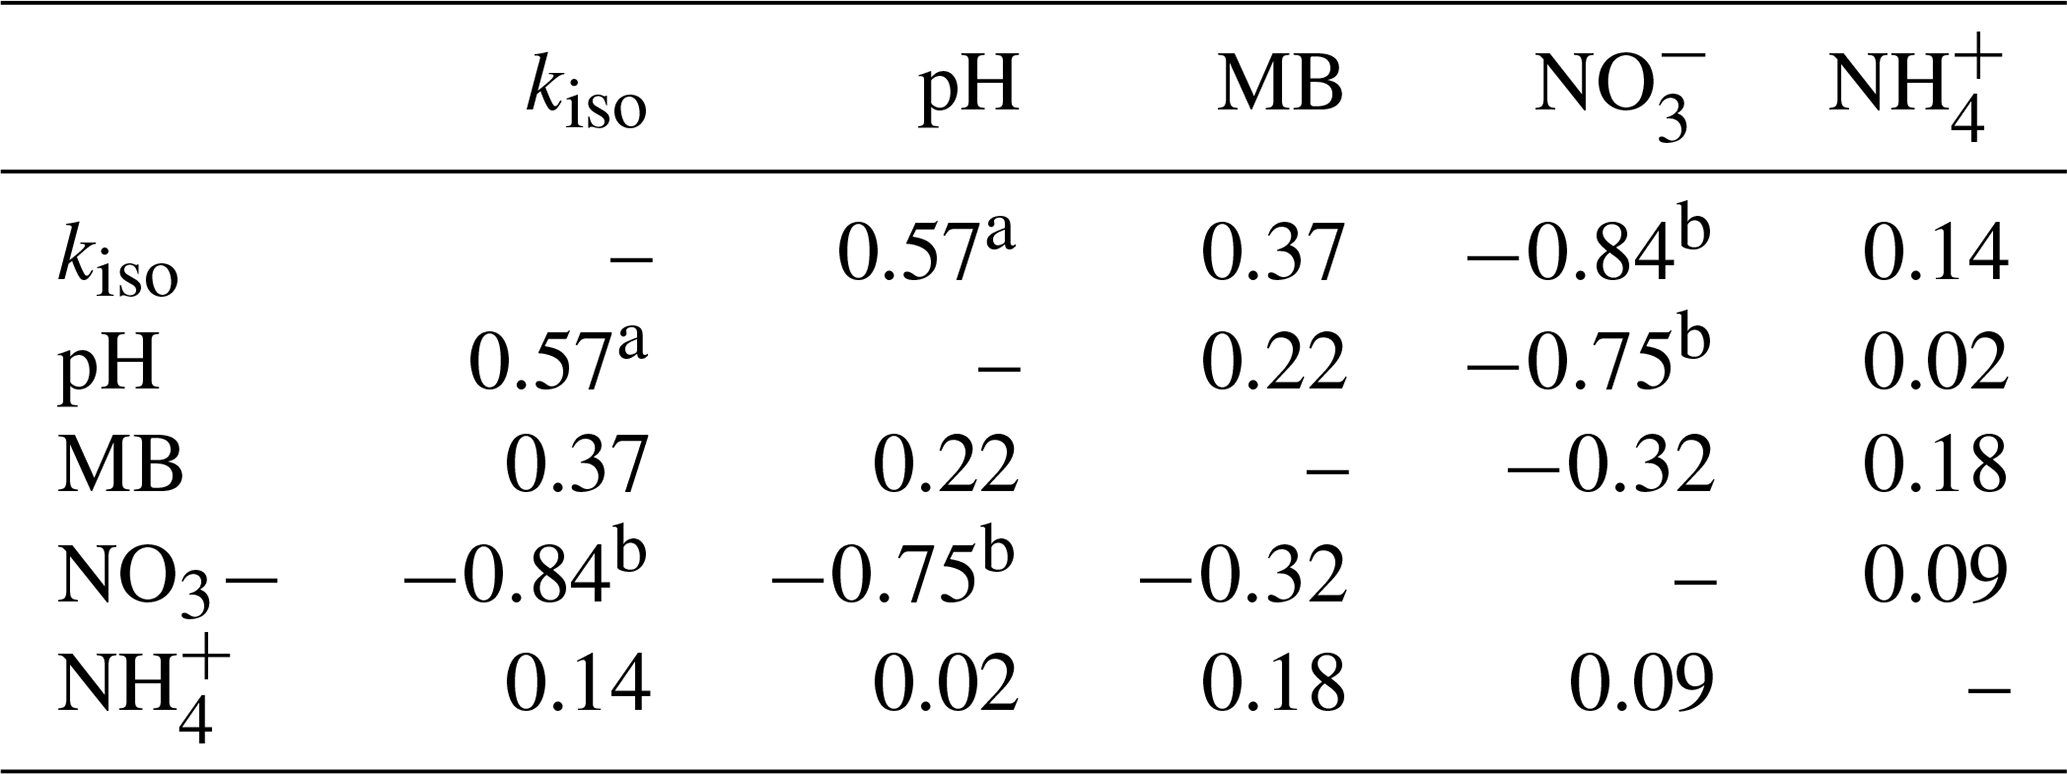
Individual relationships between pairs of these variables were investigated through Spearman's rank correlation (Table 1). Strong, significant correlations (p<0.05) were only found between kiso and soil pH (Spearman's ρ=0.58), kiso and exchangeable (Spearman's ) and soil pH and exchangeable (Spearman's ). Correlations between all other variable pairings were weaker and non-significant (p>0.05).
Table 1Spearman's rank correlation coefficients (ρ) for relationships between site mean oxygen isotope exchange rate (kiso), soil pH, microbial biomass (MB), exchangeable and exchangeable measured in untreated soils (n=44).
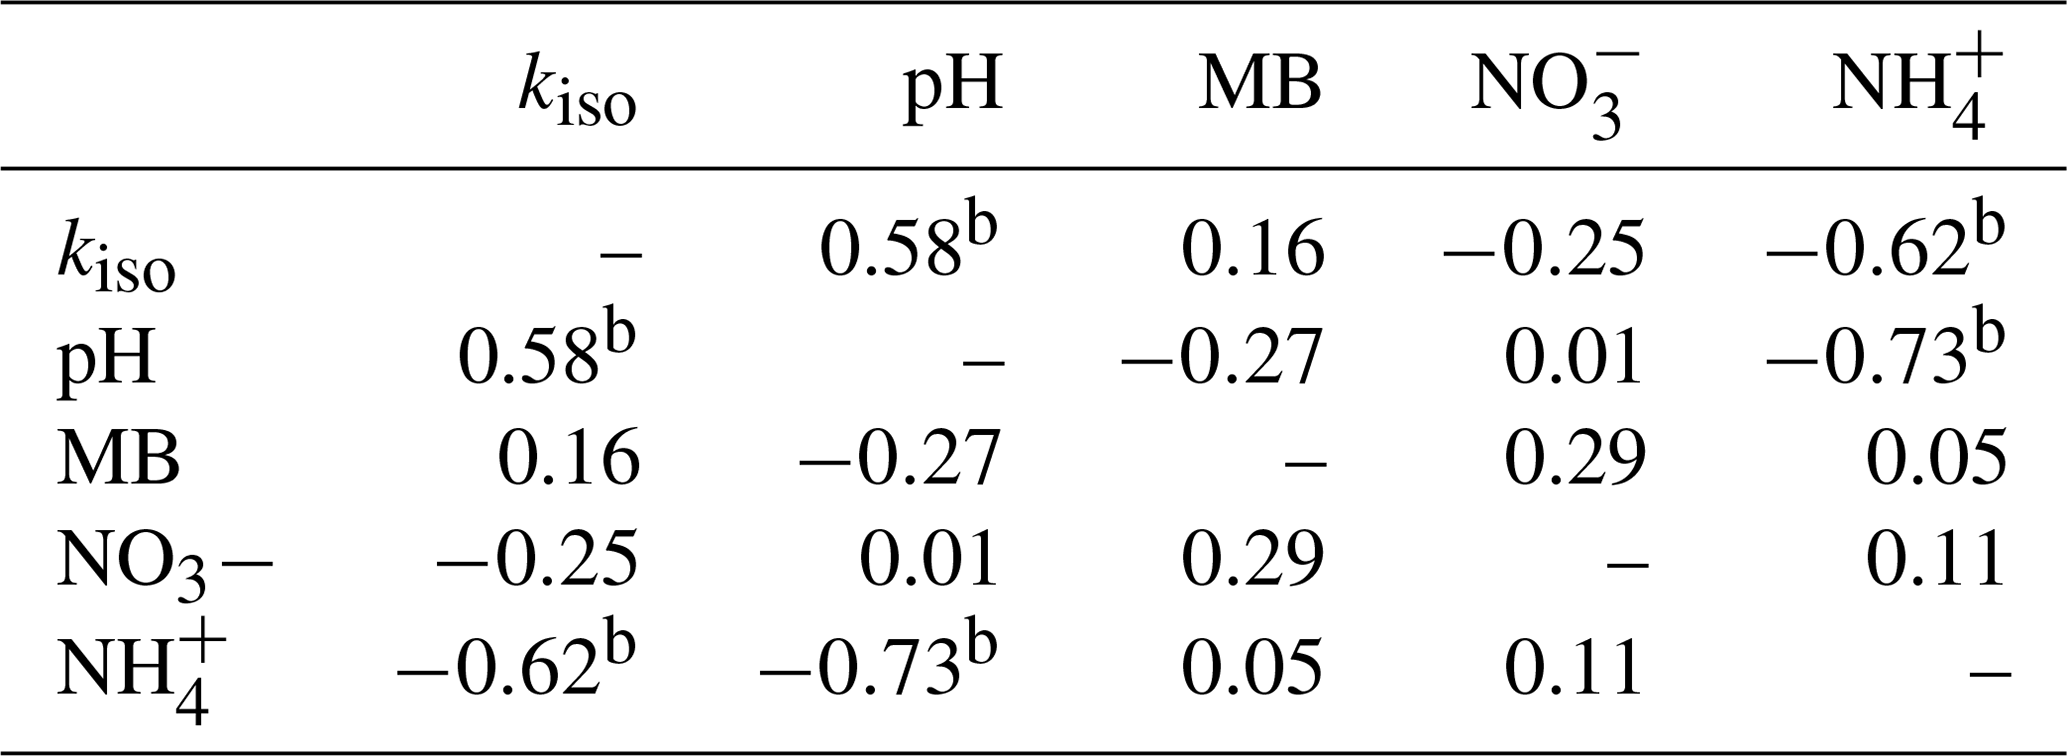
a indicates p<0.05 and b indicates p<0.01.
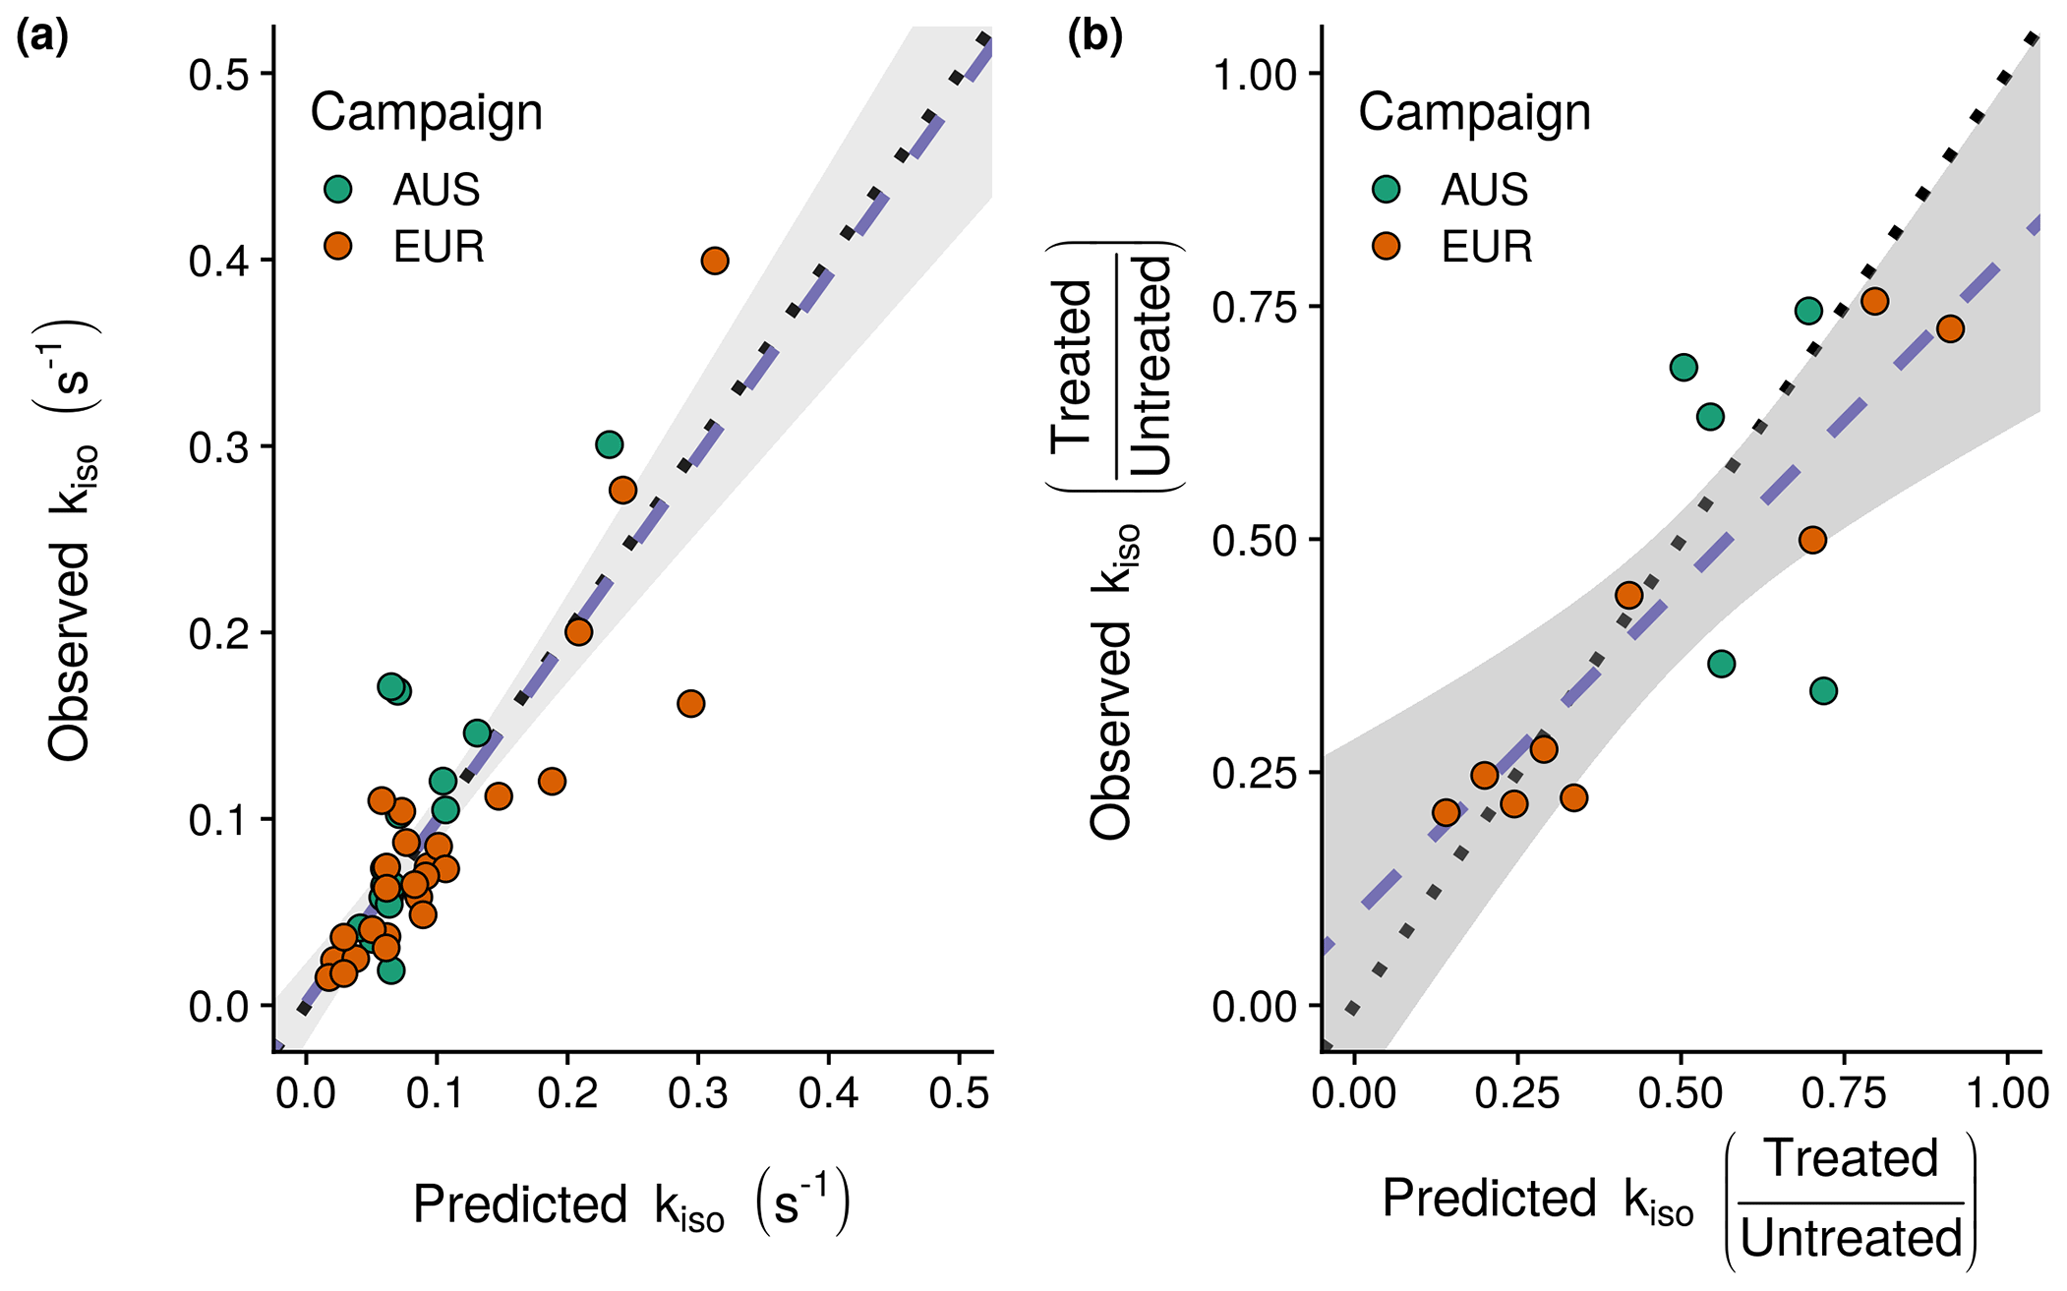
Figure 4Rates of oxygen isotope exchange (kiso) predicted by the minimal adequate statistical model identified (Eq. 6): (a) model predictions for the 44 untreated soils against the observations for these soils used in model fitting and (b) predicted fractional changes in kiso between treated and untreated soils against the changes observed following NH4 NO3 addition. Plotted points indicate individual sites with the associate sampling campaign indicated by colour (EUR: orange, AUS: green), dotted lines indicate the 1:1 line and dashed blue lines indicate linear relationships between predicted and observed values with a shaded 95 % confidence interval.
Based on AICc and visual inspection of model fit and residuals (Fig. S2 in the Supplement), the structure of the generalised linear model describing variations in kiso as the response variable was specified with a Gaussian error distribution and log–link function (Thomas et al., 2017). The minimal adequate model with this structure included the additive effects of soil pH, the natural logarithm of exchangeable , the natural logarithm of microbial biomass, the interaction between soil pH and the natural logarithm of exchangeable and an intercept term (Fig. 3). This model explained 71 % of the deviance in kiso (Fig. 4a) compared to the null model containing only an intercept term. Its AICc was 6.1 lower than the next best alternative model that omitted the interaction term, 7.1 lower than the closest model containing the sampling campaign and 13.3 lower than the closest model containing the natural logarithm of exchangeable (Table S1 in the Supplement). The AICc values of single-term models containing only pH or the natural logarithms of microbial biomass or exchangeable were, respectively, 21.6, 43.6, and 50.2 greater than the best model. The selected model predicts the response variable, kiso-pred (s−1), in the original measurement units following Eq. (6):
where pH is soil pH, is exchangeable (µg N g dry soil−1) and MB is microbial biomass (µg C g dry soil−1). The model predicts that variations in kiso result from positive correlations with soil pH (Fig. 3a) and microbial biomass (Fig. 3c) and negative correlation with exchangeable . The interaction between soil pH and exchangeable is such that the negative influence of on kiso occurs mainly under acidic conditions and is marginal at neutral to alkaline pH (Fig. 3b).
As with the full dataset, across the 27 soils from the EUR sampling campaign the strongest relationship describing kiso was found with pH (Spearman's ρ=0.58), whilst a weaker but still significant (p<0.05) relationship with exchangeable (Spearman's ) was also identified. No significant (p>0.05) relationships between kiso and clay (Spearman's ρ=0.11), silt (Spearman's ), sand (Spearman's ρ=0.00), carbon (Spearman's ) or nitrogen (Spearman's ) contents were found, whilst the relationship with the ratio of total carbon to nitrogen content (Spearman's ρ=0.38) was marginal (p=0.05). The minimal adequate generalised linear model (Table S2 in the Supplement) explaining variations in kiso selected from only the relatively invariant properties of soil texture and carbon and nitrogen content included only the intercept (−2.128) and the effect of nitrogen content (−0.119). This model explained 11 % of the deviance in kiso compared to the null model. After inclusion of soil pH, the minimal adequate model included the intercept (−4.535) and the additive effects of soil pH (0.4028) and clay content (−0.0017). This model explained 61 % of the deviance in kiso compared to 54 % for the model containing only the intercept (−4.535) and influence of soil pH (0.339).
3.2 Variations induced by NH4NO3 addition
The addition of NH4NO3 systematically increased exchangeable and and decreased kiso and soil pH. Exchangeable and in the treated soils that received the NH4NO3 addition were, respectively, 1.9 to 173.6 and 3.7 to 18.8 times greater than in the corresponding untreated soils. Soil pH and kiso were, respectively, 0.86 to 0.98 and 0.21 to 0.76 times smaller in the soils that received the addition compared with the corresponding untreated soils. The addition did not have a systematic influence on microbial biomass, which varied between 0.64 and 1.84 of the magnitude in the corresponding untreated soils. The absolute values of these changes are shown in Fig. S3 in the Supplement.
Table 2Spearman's rank correlation coefficients (ρ) for relationships between fractional changes in the mean rate of oxygen isotope exchange (kiso), soil pH, microbial biomass (MB), exchangeable and exchangeable between soils receiving a NH4NO3 addition and that of the corresponding untreated soils (n=14).
a indicates p<0.05 and b indicates p<0.01.
Individual relationships between pairs of these fractional changes were investigated through Spearman's rank correlation (Table 2). Strong, significant correlations (p<0.05) for variable pairs were found between the fractional changes in kiso and soil pH (Spearman's ρ=0.57), kiso and exchangeable (Spearman's ) and soil pH and exchangeable (Spearman's ). Correlations between all other variable pairings were weaker and non-significant (p>0.05).
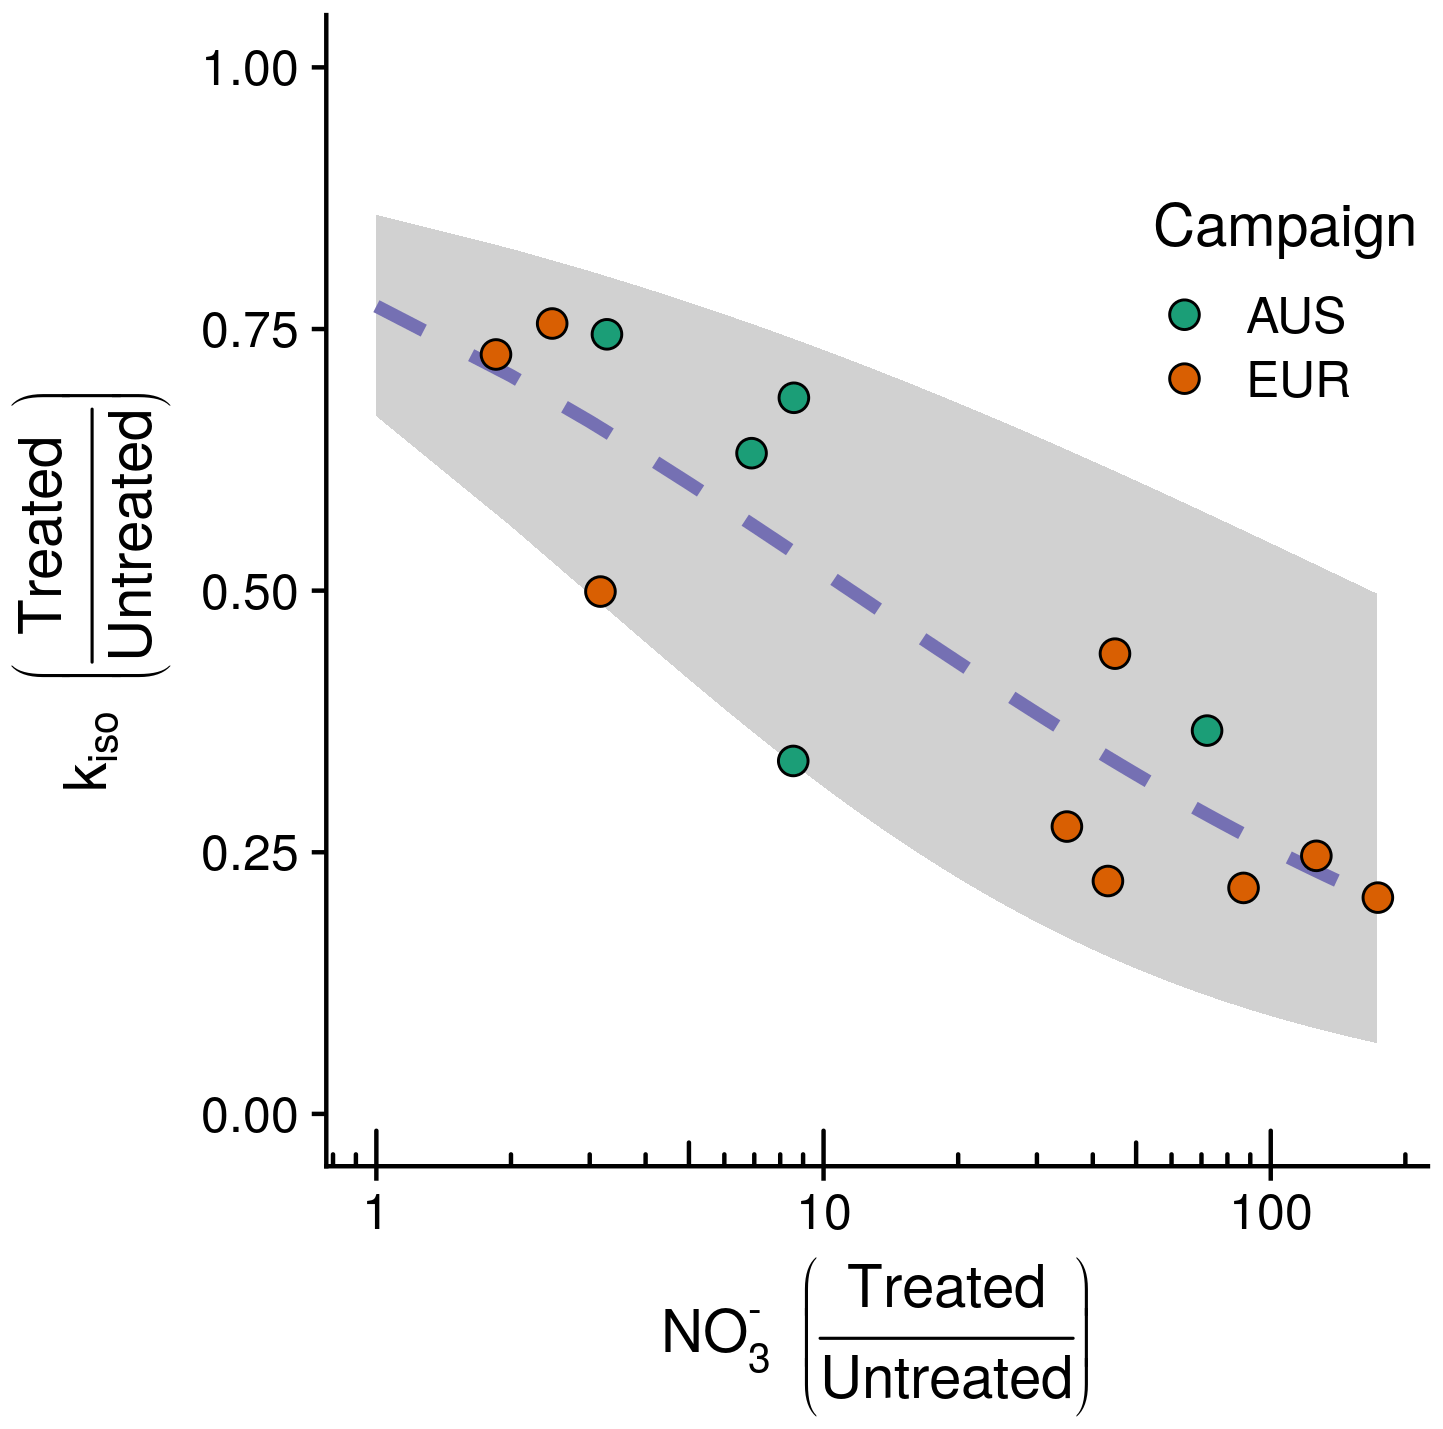
Figure 5Observed negative relationship between the fractional change in the rate of oxygen isotope exchange (kiso) and the fractional change in exchangeable between treated and untreated soils following NH4NO3 addition for the 14 sites considered. Plotted points indicate the change for individual sites with the associate sampling campaign indicated by colour (EUR: orange, n=9; AUS: green, n=5). On the y axis, quotients below 1 indicate that kiso in soils receiving the treatment decreased relative to corresponding untreated soils for each site. On the x axis, quotients above 1 indicate that availability in soils receiving the treatment increased relative to corresponding untreated soils for each site. The blue dashed line shows the fit of the minimal adequate generalised linear model describing the change in kiso with 95 % confidence intervals shaded in grey.
Based on AICc and visual inspection of model fit and residuals, the structure of the generalised linear model describing variations in the fractional change in kiso as the response variable was specified with a betareg error distribution and identity link function (Thomas et al., 2017). The minimal adequate, single-term model with this structure included the natural logarithm of the fractional change in exchangeable (−0.499) and an intercept term (1.219). This model predicts the variations in the fractional change in kiso following NH4NO3 addition across soils from the 14 sites' considered result from a negative relationship with fractional changes in exchangeable (Fig. 5). This relationship explained 76 % of the deviance in the fractional change in kiso, and the model had an AICc that was 13.2 lower than the model that included the fractional change in soil pH and an intercept term (Table S3).
This study aimed to reveal the drivers of variations in the oxygen isotope exchange rate, kiso, to make it possible to predict the influence of different soil characteristics on the δ18O of atmospheric CO2 and improve our understanding of soil CA activity. To do so, controlled incubation experiments were conducted to estimate kiso from soils collected across western Eurasia and north-eastern Australia. Estimates of kiso for untreated soils in this study ranged from 0.01 to 0.4 s−1 (Fig. 2a). In all cases these rates exceeded theoretical uncatalysed rates (from 0.00008 to 0.008 s−1 depending on soil pH, Uchikawa and Zeebe, 2012), indicating the presence of active CAs. The median kiso of 0.07 s−1 reported here is in the range of previously published values for sieved soils incubated in the dark (between 0.03 and 0.15 s−1, Jones et al., 2017; Sauze et al., 2018, 2017) but lower than those reported by Meredith et al. (2019), with a median and range of 0.46 s−1 and 0.08 to 0.88 s−1, respectively. These greater kiso values reported by Meredith et al. (2019) are more comparable to values (between 0.01 and 0.75 s−1) reported by Sauze et al. (2017) for soils with well-developed phototroph communities. Direct comparison of our estimates of kiso with those observed in the field is challenging because these older studies (Seibt et al., 2006; Wingate et al., 2008, 2009, 2010) estimated soil CA activity as a range of enhancement factors over a temperature-sensitive uncatalysed rate of hydration. However, using the mid-point of the enhancement factors and soil temperatures reported by Wingate et al. (2009), we estimate that kiso varied between 0.04 and 13 s−1 with a median of 0.31 s−1 across the seven ecosystems considered in their analysis. Understanding why kiso can be orders of magnitude greater in the field compared to values observed in laboratory incubations is a key question for further studies. Potentially, the abundance and activity of CAs may be reduced during the process of sieving soils and incubating them for prolonged periods in the dark. For example, the exclusion of intact roots and mycorrhizal fungi interacting within the rhizosphere might reduce kiso (Li et al., 2005). Equally, the suppression of phototrophic community members by incubating soils in the dark (Sauze et al., 2017) may also contribute to differences in kiso between the field and such experiments. Furthermore, we cannot exclude the possibility that determining kiso accurately under field conditions is less reliable. For example, the calculation of kiso relies on determining the δ18O of the soil water pool in equilibrium with CO2. Given the potential for increased heterogeneity in the soil water pool in natural conditions, this may make it more challenging to determine kiso robustly in the field (Jones et al., 2017).
At the outset of our study we hypothesised that kiso might be positively correlated with microbial biomass (H1), positively correlated with soil pH (H2) and negatively correlated with the presence of (H3). We found evidence in support of all three hypotheses, with the minimal adequate statistical model explaining variations in kiso observed across untreated soils including all three of these terms (Eq. 6). The model suggests that the positive relationship with soil pH (Fig. 3a), the strongest single predictor of variations in kiso, reinforces the emergent view of soil pH as the principal driver of variations in CA expression in soil microbial communities (Sauze et al., 2018). The marked increases in kiso observed for alkaline soils might reflect a shift in microbial community composition towards organisms that either express more CA protein as soil pH increases and/or express more efficient CAs than those found in acidic soils (Meredith et al., 2019; Sauze et al., 2018, 2017). Such putative mechanisms could be required to control the transport and availability of CO2 and bicarbonate in response to the pH-dependent speciation of DIC (Fig. 1b) as previously observed for both intra- and extra-cellular CA activity in non-soil settings (Hopkinson et al., 2013; Kaur et al., 2009; Kozliak et al., 1995; Merlin et al., 2003). Similarly, the positive relationship found between kiso and microbial biomass (Fig. 3c) supports a secondary role, linking the abundance of microbes to the expression of CAs and kiso for a given set of biogeochemical conditions (Wingate et al., 2009; Sauze et al., 2017). Finally, the negative relationship with exchangeable (Fig. 3b) shows for the first time that kiso in soils is sensitive to dissolved inorganic nitrogen chemistry. Anions including have previously been shown to inhibit CA activity by binding with the enzyme in non-soil systems (Amoroso et al., 2005; Peltier et al., 1995; Tibell et al., 1984). The fact that the binding and subsequent inhibition of CA activity have been shown to be more efficient under acidic conditions but have minimal influence at high pH may reflect the role of protonation in this behaviour (Johansson and Forsman, 1993, 1994). Interestingly, the larger negative influence of exchangeable in acidic soils identified here is in agreement with this observation (Fig. 3b). This suggests that the influence of exchangeable on CA activity is reduced in neutral and alkaline soils and that the constraints imposed by pH and microbial community size are of greater importance. To better understand the relationship between kiso and soil inorganic nitrogen, we conducted an NH4NO3 addition experiment. As in other studies, the addition of NH4NO3 not only increased exchangeable and , but also decreased soil pH and caused non-systematic changes in microbial biomass (Fig. S3; Zhang et al., 2017). Reflecting the different magnitudes of these changes, the observed decrease in kiso in soils receiving the addition relative to their untreated counterparts was best explained by the increase in exchangeable (Fig. 5). Notably, the weak relationship between changes in kiso and exchangeable identified in this experiment (Table 2) suggests the relationship between these variables across the untreated soils (Table 1) does indeed reflect a co-correlation with soil pH rather than a direct causal link. The negative relationship between exchangeable and kiso appears to support the proposed mechanism of CA inhibition. However, an alternative explanation, invoked to explain reductions in the activity of enzymes involved in nitrogen acquisition following fertilisation (Zhang et al., 2017), may be that CAs play some role in the soil nitrogen cycle that is alleviated by increases in exchangeable following NH4NO3 addition and thus leads to a down-regulation in CA expression (DiMario et al., 2017; Kalloniati et al., 2009; Rigobello-Masini et al., 2006). Indeed, such a function would help explain why the microbial communities in the untreated acidic soils with higher exchangeable do not appear to need to compensate for the inhibition of CA. Such compensation might otherwise be expected from the economic theory of enzyme investment if CAs are facilitating important metabolic reactions (Burns et al., 2013). It is important to note that whilst the relationship between the changes in kiso and exchangeable support observations from across the wider untreated dataset, the experimental design used in this addition experiment is not sufficient to fully test the influence of the combined changes in soil pH, exchangeable , exchangeable and microbial biomass on kiso. Further controlled, factorial experiments are required for this purpose. Further understanding of the intra- and extra-cellular distribution of microbial CAs and their relationship with spatial and temporal variations in soil chemical conditions is now required to confirm the mechanistic link among these observations.
Improvements in our ability to predict soil kiso and its influence on the δ18O of atmospheric CO2 are important in refining the use of this tracer and others such as δ17O to constrain photosynthesis and respiration at large scales (Wingate et al., 2009; Welp et al., 2011; Koren et al., 2019). Previous predictions of the δ18O of soil–atmosphere CO2 exchange were up-scaled using relationships observed in the field between kiso and climate and/or land cover (Wingate et al., 2009). In this study containing more measurements from a wider range of sites, strong patterns with climate or land cover were absent (Fig. 2a). However, this could reflect the fact that the temperature and moisture conditions used in this study were unrepresentative of the field conditions, especially for colder and drier sites. Our empirical model (Eq. 6) could provide broadly unbiased estimates of the observed variations in kiso across the untreated soils of the 44 sites (Fig. 4a). Indeed, the ability of this model to reasonably predict fractional changes in kiso between untreated control soils, which were used to build the model, and their fertiliser-treated counterparts, which were not used to “train” the model selection process, is encouraging (Fig. 4b). However, more observations from alkaline soils would be extremely useful for reducing the uncertainty found at greater kiso (Fig. 3a). A significant challenge to using this statistical relationship to predict kiso is underpinned by our capacity to describe the spatial and temporal variations in the important drivers of kiso, namely soil pH, microbial biomass and exchangeable . For this reason we also considered whether more readily available parameters such as soil texture, carbon content and nitrogen content might provide an alternative basis for empirical predictions of kiso (Van Looy et al., 2017). However, relationships between these variables and kiso were relatively weak and could only explain a marginal amount of the observed variability. Fortunately, a number of promising spatial databases are evolving for soil characteristics such as pH and microbial biomass (Serna-Chavez et al., 2013; Slessarev et al., 2016). Likewise a number of land surface models can now estimate the spatial and temporal dynamics of the biosphere nitrogen cycle convincingly (Zaehle, 2013). Predictions of soil nutrient dynamics will likely depend on the use of such advanced soil nitrogen cycle models. Given the interaction between soil pH and exchangeable (Fig. 3a and b), the absence of such data may not seriously compromise predictions for fertilised agricultural soils, as typically they are not strongly acidic. However, accurately predicting natural spatial and seasonal variability and the influence of future changes in atmospheric deposition (DeForest et al., 2004) may be more problematic. Nonetheless, the data reported in this study now lay the foundations for an empirical approach to predicting kiso for a wide range of soils using readily available maps of key soil traits. This represents an important breakthrough in predicting how variations in soil community CA activity impact the δ18O of atmospheric CO2.
The data produced in this study have been archived with PANGAEA (https://doi.pangaea.de/10.1594/PANGAEA.928394, last access: 8 March 2021). The data may also be requested from the corresponding author by email.
The supplement related to this article is available online at: https://doi.org/10.5194/soil-7-145-2021-supplement.
All the authors were involved in the conceptualisation of the work presented. Jérôme Ogée and Lisa Wingate acquired the funding that supported this work and, along with Lucas A. Cernusak, provided additional resources required in its execution. The methodology used was developed by Sam P. Jones, Aurore Kaisermann, Jérôme Ogée, Steven Wohl and Lisa Wingate, and the investigation was conducted by Sam P. Jones, Aurore Kaisermann, Steven Wohl, Alexander W. Cheesman and Lisa Wingate. Formal analysis of the data was carried out by Sam P. Jones and Aurore Kaisermann. The original manuscript was drafted by Sam P. Jones, and subsequent review and editing was carried out by Sam P. Jones, Jérôme Ogée, Alexander W. Cheesman, Lucas A. Cernusak and Lisa Wingate.
The authors declare that they have no conflict of interest.
This work was funded by the European Research Council (ERC) under the European Union's Seventh Framework Programme (FP7/2007-2013) grant agreement no. 338264, and the Agence Nationale de la Recherche (ANR) grant no. ANR-13-BS06-0005-01. Many thanks to Jorge Curiel-Yuste, Alexandria Correia, Jean-Marc Ourcival, Jukka Pumpanen, Huizhong Zhang, Carmen Emmel, Nina Buchmann, Sabina Keller, Irene Lehner, Anders Lindroth, Andreas Ibrom, Jens Schaarup Sorensen, Dan Yakir, Fulin Yang, Michal Heliasz, Susanne Burri, Penelope Serrano Ortiz, Maria Rosario Moya Jimenez, Jose Luis Vicente, Holger Tulp, Per Marklund, John Marshall, Nils Henriksson, Raquel Lobo de Vale, Lukas Siebicke, Bernard Longdoz, Pascal Courtois, and Katja Klumpp for providing soil from Eurasian sites, Joana Sauze, Ana Gutierrez, and Bastien Frejaville for facilitating analyses made in France, and Jon Lloyd, Camille Bathellier, Rolf Seigwolf, Matthias Saurer, Paul Nelson, Niels Munksgaard, Jen Whan, Michael Bird, Chris Wurster, and Hilary Stuart-Williams for facilitating analyses made in Australia.
This research has been supported by the European Research Council (grant no. SOLCA (338264)) and the Agence Nationale de la Recherche (grant no. 13-BS06-0005-01).
This paper was edited by Steven Sleutel and reviewed by one anonymous referee.
Adnew, G. A., Pons, T. L., Koren, G., Peters, W., and Röckmann, T.: Leaf-scale quantification of the effect of photosynthetic gas exchange on Δ17O of atmospheric CO2, Biogeosciences, 17, 3903–3922, https://doi.org/10.5194/bg-17-3903-2020, 2020.
Amoroso, G., Morell-Avrahov, L., Müller, D., Klug, K., and Sültemeyer, D.: The gene NCE103 (YNL036w) from Saccharomyces cerevisiae encodes a functional carbonic anhydrase and its transcription is regulated by the concentration of inorganic carbon in the medium, Mol. Microbiol., 56, 549–558, https://doi.org/10.1111/j.1365-2958.2005.04560.x, 2005.
Bar-Even, A., Noor, E., Savir, Y., Liebermeister, W., Davidi, D., Tawfik, D. S., and Milo, R.: The Moderately Efficient Enzyme: Evolutionary and Physicochemical Trends Shaping Enzyme Parameters, Biochemistry, 50, 4402–4410, https://doi.org/10.1021/bi2002289, 2011.
Beer, C., Reichstein, M., Tomelleri, E., Ciais, P., Jung, M., Carvalhais, N., Rödenbeck, C., Arain, M. A., Baldocchi, D., Bonan, G. B., Bondeau, A., Cescatti, A., Lasslop, G., Lindroth, A., Lomas, M., Luyssaert, S., Margolis, H., Oleson, K. W., Roupsard, O., Veenendaal, E., Viovy, N., Williams, C., Woodward, F. I., and Papale, D.: Terrestrial Gross Carbon Dioxide Uptake: Global Distribution and Covariation with Climate, Science, 329, 834–838, https://doi.org/10.1126/science.1184984, 2010.
Burns, R. G., DeForest, J. L., Marxsen, J., Sinsabaugh, R. L., Stromberger, M. E., Wallenstein, M. D., Weintraub, M. N., and Zoppini, A.: Soil enzymes in a changing environment: Current knowledge and future directions, Soil Biol. Biochem., 58, 216–234, https://doi.org/10.1016/j.soilbio.2012.11.009, 2013.
DeForest, J. L., Zak, D. R., Pregitzer, K. S., and Burton, A. J.: Atmospheric Nitrate Deposition, Microbial Community Composition, and Enzyme Activity in Northern Hardwood Forests, Soil Sci. Soc. Am. J., 68, 132–138, https://doi.org/10.2136/sssaj2004.1320, 2004.
DiMario, R. J., Clayton, H., Mukherjee, A., Ludwig, M., and Moroney, J. V.: Plant Carbonic Anhydrases: Structures, Locations, Evolution, and Physiological Roles, Mol. Plant, 10, 30–46, https://doi.org/10.1016/j.molp.2016.09.001, 2017.
Francey, R. J. and Tans, P. P.: Latitudinal variation in oxygen-18 of atmospheric CO2, Nature, 327, 495–497, https://doi.org/10.1038/327495a0, 1987.
Haney, R. L. and Haney, E. B.: Simple and Rapid Laboratory Method for Rewetting Dry Soil for Incubations, Commun. Soil Sci. Plan., 41, 1493–1501, https://doi.org/10.1080/00103624.2010.482171, 2010.
Hesse, S. J. A., Ruijter, G. J. G., Dijkema, C., and Visser, J.: Intracellular pH homeostasis in the filamentous fungus Aspergillus niger, Eur. J. Biochem., 269, 3485–3494, https://doi.org/10.1046/j.1432-1033.2002.03042.x, 2002.
Hoag, K. J., Still, C. J., Fung, I. Y., and Boering, K. A.: Triple oxygen isotope composition of tropospheric carbon dioxide as a tracer of terrestrial gross carbon fluxes, Geophys. Res. Lett., 32, L02802, https://doi.org/10.1029/2004GL021011, 2005.
Hopkinson, B. M., Meile, C., and Shen, C.: Quantification of Extracellular Carbonic Anhydrase Activity in Two Marine Diatoms and Investigation of Its Role, Plant Physiol., 162, 1142–1152, https://doi.org/10.1104/pp.113.217737, 2013.
Innocenti, A., Zimmerman, S., Ferry, J., Scozzafava, A., and Supuran, C.: Carbonic anhydrase inhibitors, Inhibition of the beta-class enzyme from the methanoarchaeon Methanobacterium thermoautotrophicum (Cab) with anions, Bioorg. Med. Chem. Lett., 14, 4563–4567, https://doi.org/10.1016/j.bmcl.2004.06.073, 2004.
Jensen, E. L., Clement, R., Kosta, A., Maberly, S. C., and Gontero, B.: A new widespread subclass of carbonic anhydrase in marine phytoplankton, ISME J., 13, 2094–2106, https://doi.org/10.1038/s41396-019-0426-8, 2019.
Johansson, I.-M. and Forsman, C.: Kinetic studies of pea carbonic anhydrase, Eur. J. Biochem., 218, 439–446, https://doi.org/10.1111/j.1432-1033.1993.tb18394.x, 1993.
Johansson, I.-M. and Forsman, C.: Solvent Hydrogen Isotope Effects and Anion Inhibition of CO2 Hydration Catalysed by Carbonic Anhydrase from Pisum sativum, Eur. J. Biochem., 224, 901–907, https://doi.org/10.1111/j.1432-1033.1994.00901.x, 1994.
Jones, S. P., Ogée, J., Sauze, J., Wohl, S., Saavedra, N., Fernández-Prado, N., Maire, J., Launois, T., Bosc, A., and Wingate, L.: Non-destructive estimates of soil carbonic anhydrase activity and associated soil water oxygen isotope composition, Hydrol. Earth Syst. Sci., 21, 6363–6377, https://doi.org/10.5194/hess-21-6363-2017, 2017.
Jones, S. P., Kaisermann, A., Ogée, J., Wohl, S., Cheesman, A. W., Cernusak, L. A., and Wingate, L.: Measurements of net soil-atmosphere carbon dioxide exchange and its oxygen and carbon isotope composition in incubations of soil sampled from 44 sites in western Eurasia and northeastern Australia [data set], PANGAEA, available at: https://doi.pangaea.de/10.1594/PANGAEA.928394, last access: 8 March 2021.
Kaisermann, A., Ogée, J., Sauze, J., Wohl, S., Jones, S. P., Gutierrez, A., and Wingate, L.: Disentangling the rates of carbonyl sulfide (COS) production and consumption and their dependency on soil properties across biomes and land use types, Atmos. Chem. Phys., 18, 9425–9440, https://doi.org/10.5194/acp-18-9425-2018, 2018a.
Kaisermann, A., Jones, S. P., Wohl, S., Ogée, J., and Wingate, L.: Nitrogen Fertilization Reduces the Capacity of Soils to Take up Atmospheric Carbonyl Sulphide, Soil Systems, 2, 62, https://doi.org/10.3390/soilsystems2040062, 2018b.
Kalloniati, C., Tsikou, D., Lampiri, V., Fotelli, M. N., Rennenberg, H., Chatzipavlidis, I., Fasseas, C., Katinakis, P., and Flemetakis, E.: Characterization of a Mesorhizobium loti α-Type Carbonic Anhydrase and Its Role in Symbiotic Nitrogen Fixation, J. Bacteriol., 191, 2593–2600, https://doi.org/10.1128/JB.01456-08, 2009.
Kaur, S., Mishra, M. N. and Tripathi, A. K.: Regulation of expression and biochemical characterization of a β-class carbonic anhydrase from the plant growth-promoting rhizobacterium, Azospirillum brasilense Sp7, FEMS Microbiol. Lett., 299, 149–158, https://doi.org/10.1111/j.1574-6968.2009.01736.x, 2009.
Koren, G., Schneider, L., Velde, I. R. van der, Schaik, E. van, Gromov, S. S., Adnew, G. A., Martino, D. J. M., Hofmann, M. E. G., Liang, M.-C., Mahata, S., Bergamaschi, P., Laan-Luijkx, I. T. van der, Krol, M. C., Röckmann, T., and Peters, W.: Global 3-D Simulations of the Triple Oxygen Isotope Signature Δ17O in Atmospheric CO2, J. Geophys. Res.-Atmos., 124, 8808–8836, https://doi.org/10.1029/2019JD030387, 2019.
Kottek, M., Grieser, J., Beck, C., Rudolf, B., and Rubel, F.: World Map of the Köppen-Geiger climate classification updated, metz, 15, 259–263, https://doi.org/10.1127/0941-2948/2006/0130, 2006.
Kozliak, E. I., Fuchs, J. A., Guilloton, M. B., and Anderson, P. M.: Role of bicarbonate/CO2 in the inhibition of Escherichia coli growth by cyanate, J. Bacteriol., 177, 3213–3219, https://doi.org/10.1128/jb.177.11.3213-3219.1995, 1995.
Krulwich, T. A., Sachs, G., and Padan, E.: Molecular aspects of bacterial pH sensing and homeostasis, Nat. Rev. Microbiol., 9, 330, https://doi.org/10.1038/nrmicro2549, 2011.
Li, W., Yu, L., Yuan, D., Wu, Y., and Zeng, X.: A study of the activity and ecological significance of carbonic anhydrase from soil and its microbes from different karst ecosystems of Southwest China, Plant Soil, 272, 133–141, https://doi.org/10.1007/s11104-004-4335-9, 2005.
Linn, D. M. and Doran, J. W.: Effect of Water-Filled Pore Space on Carbon Dioxide and Nitrous Oxide Production in Tilled and Nontilled Soils, Soil Sci. Soc. Am. J., 48, 1267–1272, https://doi.org/10.2136/sssaj1984.03615995004800060013x, 1984.
Massman, W. J.: A review of the molecular diffusivities of H2O, CO2, CH4, CO, O3, SO2, NH3, N2O, NO, and NO2 in air, O2 and N2 near STP, Atmos. Environ., 32, 1111–1127, https://doi.org/10.1016/S1352-2310(97)00391-9, 1998.
Meredith, L. K., Ogée, J., Boye, K., Singer, E., Wingate, L., Sperber, C. von, Sengupta, A., Whelan, M., Pang, E., Keiluweit, M., Brüggemann, N., Berry, J. A., and Welander, P. V.: Soil exchange rates of COS and CO18O differ with the diversity of microbial communities and their carbonic anhydrase enzymes, ISME J., 13, 290, https://doi.org/10.1038/s41396-018-0270-2, 2019.
Merlin, C., Masters, M., McAteer, S., and Coulson, A.: Why Is Carbonic Anhydrase Essential to Escherichia coli?, J. Bacteriol., 185, 6415–6424, https://doi.org/10.1128/JB.185.21.6415-6424.2003, 2003.
Miller, J. B., Yakir, D., White, J. W. C., and Tans, P. P.: Measurement of 18O/16O in the soil-atmosphere CO2 flux, Global Biogeochem. Cy., 13, 761–774, https://doi.org/10.1029/1999GB900028, 1999.
Mills, G. A. and Urey, H. C.: The Kinetics of Isotopic Exchange between Carbon Dioxide, Bicarbonate Ion, Carbonate Ion and Water1, J. Am. Chem. Soc., 62, 1019–1026, https://doi.org/10.1021/ja01862a010, 1940.
Moldrup, P., Olesen, T., Komatsu, T., Yoshikawa, S., Schjønning, P., and Rolston, D.: Modeling diffusion and reaction in soils: X. A unifying model for solute and gas diffusivity in unsaturated soil, Soil Sci., 168, 321–337, 2003.
Peltier, G., Cournac, L., Despax, V., Dimon, B., Fina, L., Genty, B., and Rumeau, D.: Carbonic anhydrase activity in leaves as measured in vivo by 18O exchange between carbon dioxide and water, Planta, 196, 732–739, https://doi.org/10.1007/BF01106768, 1995.
R Core Team: R: A Language and Environment for Statistical Computing, R Foundation for Statistical Computing, Vienna, Austria, available at: https://www.R-project.org/, last access: 8 April 2019.
Ramirez, K. S., Craine, J. M., and Fierer, N.: Consistent effects of nitrogen amendments on soil microbial communities and processes across biomes, Glob. Change Biol., 18, 1918–1927, https://doi.org/10.1111/j.1365-2486.2012.02639.x, 2012.
Rigobello-Masini, M., Masini, J. C., and Aidar, E.: The profiles of nitrate reductase and carbonic anhydrase activity in batch cultivation of the marine microalgae Tetraselmis gracilis growing under different aeration conditions, FEMS Microbiol. Ecol., 57, 18–25, https://doi.org/10.1111/j.1574-6941.2006.00106.x, 2006.
Rowlett, R. S., Tu, C., McKay, M. M., Preiss, J. R., Loomis, R. J., Hicks, K. A., Marchione, R. J., Strong, J. A., Donovan Jr., G. S., and Chamberlin, J. E.: Kinetic characterization of wild-type and proton transfer-impaired variants of β-carbonic anhydrase from Arabidopsis thaliana, Arch. Biochem. Biophys., 404, 197–209, https://doi.org/10.1016/S0003-9861(02)00243-6, 2002.
Rubel, F., Brugger, K., Haslinger, K., and Auer, I.: The climate of the European Alps: Shift of very high resolution Köppen-Geiger climate zones 1800–2100, metz, 26, 115–125, https://doi.org/10.1127/metz/2016/0816, 2017.
Sauze, J., Ogée, J., Maron, P.-A., Crouzet, O., Nowak, V., Wohl, S., Kaisermann, A., Jones, S. P., and Wingate, L.: The interaction of soil phototrophs and fungi with pH and their impact on soil CO2, CO18O and OCS exchange, Soil Biol. Biochem., 115, Supplement C, 371–382, https://doi.org/10.1016/j.soilbio.2017.09.009, 2017.
Sauze, J., Jones, S. P., Wingate, L., Wohl, S., and Ogée, J.: The role of soil pH on soil carbonic anhydrase activity, Biogeosciences, 15, 597–612, https://doi.org/10.5194/bg-15-597-2018, 2018.
Seibt, U., Wingate, L., Lloyd, J., and Berry, J. A.: Diurnally variable δ18O signatures of soil CO2 fluxes indicate carbonic anhydrase activity in a forest soil, J. Geophys. Res., 111, G04005, https://doi.org/10.1029/2006JG000177, 2006.
Serna-Chavez, H. M., Fierer, N., and Bodegom, P. M. van: Global drivers and patterns of microbial abundance in soil, Global Ecol. Biogeogr., 22, 1162–1172, https://doi.org/10.1111/geb.12070, 2013.
Slessarev, E. W., Lin, Y., Bingham, N. L., Johnson, J. E., Dai, Y., Schimel, J. P., and Chadwick, O. A.: Water balance creates a threshold in soil pH at the global scale, 540, 567–569, https://doi.org/10.1038/nature20139, 2016.
Slonczewski, J. L., Fujisawa, M., Dopson, M., and Krulwich, T. A.: Cytoplasmic pH Measurement and Homeostasis in Bacteria and Archaea, edited by Poole, R. K., Adv. Microb. Physiol., 55, 1–317, https://doi.org/10.1016/S0065-2911(09)05501-5, 2009.
Smith, K. S. and Ferry, J. G.: Prokaryotic carbonic anhydrases, FEMS Microbiol. Rev., 24, 335–366, https://doi.org/10.1111/j.1574-6976.2000.tb00546.x, 2000.
Smith, K. S., Jakubzick, C., Whittam, T. S., and Ferry, J. G.: Carbonic anhydrase is an ancient enzyme widespread in prokaryotes, P. Natl. Acad. Sci. USA, 96, 15184–15189, https://doi.org/10.1073/pnas.96.26.15184, 1999.
Tans, P. P.: Oxygen isotopic equilibrium between carbon dioxide and water in soils, Tellus B, 50, 163–178, https://doi.org/10.3402/tellusb.v50i2.16094, 1998.
Thomas, R., Lello, J., Medeiros, R., Pollard, A., Robinson, P., Seward, A., Smith, J., Vafidis, J., and Vaughan, I.: Data Analysis with R Statistical Software: A guidebook for Scientists, Eco-explore, Caerphilly, Wales, 2017.
Tibell, L., Forsman, C., Simonsson, I., and Lindskog, S.: Anion Inhibition of CO2 hydration catalyzed by human carbonic anhydrase II: Mechanistic implications, BBA-Protein Struct. M., 789, 302–310, https://doi.org/10.1016/0167-4838(84)90186-9, 1984.
Uchikawa, J. and Zeebe, R. E.: The effect of carbonic anhydrase on the kinetics and equilibrium of the oxygen isotope exchange in the CO2–H2O system: Implications for δ18O vital effects in biogenic carbonates, Geochim. Cosmochim. Ac., 95, 15–34, https://doi.org/10.1016/j.gca.2012.07.022, 2012.
Van Looy, K., Bouma, J., Herbst, M., Koestel, J., Minasny, B., Mishra, U., Montzka, C., Nemes, A., Pachepsky, Y. A., Padarian, J., Schaap, M. G., Tóth, B., Verhoef, A., Vanderborght, J., Ploeg, M. J. van der, Weihermüller, L., Zacharias, S., Zhang, Y., and Vereecken, H.: Pedotransfer Functions in Earth System Science: Challenges and Perspectives, Rev. Geophys., 55, 1199–1256, https://doi.org/10.1002/2017RG000581, 2017.
Weiss, R. F.: Carbon dioxide in water and seawater: the solubility of a non-ideal gas, Mar. Chem., 2, 203–215, https://doi.org/10.1016/0304-4203(74)90015-2, 1974.
Welp, L. R., Keeling, R. F., Meijer, H. A. J., Bollenbacher, A. F., Piper, S. C., Yoshimura, K., Francey, R. J., Allison, C. E., and Wahlen, M.: Interannual variability in the oxygen isotopes of atmospheric CO2 driven by El Niño, Nature, 477, 579–582, https://doi.org/10.1038/nature10421, 2011.
Wingate, L., Seibt, U., Maseyk, K., Ogée, J., Almeida, P., Yakir, D., Pereira, J. S., and Mencuccini, M.: Evaporation and carbonic anhydrase activity recorded in oxygen isotope signatures of net CO2 fluxes from a Mediterranean soil, Glob. Change Biol., 14, 2178–2193, https://doi.org/10.1111/j.1365-2486.2008.01635.x, 2008.
Wingate, L., Ogée, J., Cuntz, M., Genty, B., Reiter, I., Seibt, U., Yakir, D., Maseyk, K., Pendall, E. G., Barbour, M. M., Mortazavi, B., Burlett, R., Peylin, P., Miller, J., Mencuccini, M., Shim, J. H., Hunt, J., and Grace, J.: The impact of soil microorganisms on the global budget of δ18O in atmospheric CO2, P. Natl. Acad. Sci USA, 106, 22411–22415, https://doi.org/10.1073/pnas.0905210106, 2009.
Wingate, L., Ogée, J., Burlett, R., and Bosc, A.: Strong seasonal disequilibrium measured between the oxygen isotope signals of leaf and soil CO2 exchange, Glob. Change Biol., 16, 3048–3064, https://doi.org/10.1111/j.1365-2486.2010.02186.x, 2010.
Zaehle, S.: Terrestrial nitrogen–carbon cycle interactions at the global scale, Philos. T. R. Soc. B, 368, 20130125, https://doi.org/10.1098/rstb.2013.0125, 2013.
Zhang, C., Zhang, X.-Y., Zou, H.-T., Kou, L., Yang, Y., Wen, X.-F., Li, S.-G., Wang, H.-M., and Sun, X.-M.: Contrasting effects of ammonium and nitrate additions on the biomass of soil microbial communities and enzyme activities in subtropical China, Biogeosciences, 14, 4815–4827, https://doi.org/10.5194/bg-14-4815-2017, 2017.