
Can Economic Factors Improve Momentum Trading Strategies? The Case of Managed Futures during the COVID-19 Pandemic


Finance Department, Faculty of Economics and Business Administration, Vilnius University, LT-10223 Vilnius, Lithuania
*
Author to whom correspondence should be addressed.
Economies 2021, 9(2), 86; https://doi.org/10.3390/economies9020086
Submission received: 6 March 2021
/
Revised: 25 May 2021
/
Accepted: 26 May 2021
/
Published: 28 May 2021
(This article belongs to the Special Issue Asset Pricing, Investment, and Trading Strategies)
Abstract
:Systematic momentum trading is a prevalent risk premium strategy in different portfolios. This paper focuses on the performance of the managed futures strategy based on the momentum signal across different economic regimes, focusing on the COVID-19 pandemic period. COVID-19 had a solid but short-lived impact on financial markets, and therefore gives a unique insight into momentum strategies’ performance during such critical moments of market stress. We offer a new approach to implementing momentum strategies by adding macroeconomic variables to the model. We test a managed futures strategy’s performance with a well-diversified futures portfolio across different asset classes. The research concludes that constructing a portfolio based on academically/economically sound momentum signals with its allocation timing based on broader economic factors significantly improves managed futures strategies and adds significant diversification benefits to the investors’ portfolios.
1. Introduction
From difficult lessons learned in 2008, the traditional “suspects” in institutional investors’ portfolios (i.e., equity, fixed income) face a significant problem. In a period of crisis, their prices tend to move together. Therefore, opportunities to diversify the portfolio become very limited. As investors seek to diversify into other asset classes, many turn to alternative assets as a solution, with managed futures strategies firmly in focus. In this study, we test the performance of managed futures strategies based on a theoretically proven momentum effect across different asset classes. This research aims to identify if the construction of a portfolio, based on academically/economically sound momentum signals, and its allocation timing based on broader economic factors, can significantly improve the performance of managed futures strategies and add significant diversification to investors’ portfolios. The particular focus is placed on the recent COVID-19 period as a natural experiment of increased market uncertainty.
The managed futures are a sub-class of alternative investment strategies that take long/short positions across various futures markets (commodity, equity indices, foreign currency, bonds) globally. Some studies showed that tactical trading in futures markets had generated abnormal returns in the past (Gorton and Rouwenhorst 2006; Erb and Harvey 2006; Shen et al. 2007; Fuertes et al. 2010; Szymanowska et al. 2014). However, considering that managed futures strategies only trade in financial instruments listed on the exchanges, their positions are transparent, highly liquid (exchange trading, no asymmetry between short/long positions), with the minimum counterparty or credit risk. Thus, such strategies offer access to leverage, high liquidity, low transaction costs, and complete transparency. The studies also suggest that managed futures have performed exceptionally well during down markets and still delivered positive results during the up periods in equity markets.
Systematic momentum trading is a very popular risk premium strategy in different portfolios, where, according to a BarclayHedge report (2020), more than 70% of managed futures funds are estimated to follow momentum signals.
In this study, we selected to test the performance of managed futures strategies based on a theoretically proven momentum effect across various (i.e., equity index, foreign exchange, bonds, and commodity futures) markets. Our contribution to the current stream of literature on momentum strategies is twofold: (1) we estimate, compare, and analyze strategies based on long- and short-term momentum signals, respectively; (2) we offer a new approach to implementing momentum strategies by adding macroeconomic variables to the analysis. Our theoretical model for estimating a momentum strategy’s returns is based on Elaut and Erdős’s (2019) proposed asset-based factor that aggregates time-series momentum signals over different time horizons. Due to this model flexibility, it is possible to construct a momentum portfolio strategy with the selected lookback period length. Therefore, we can separate the momentum signal into “short-term” and “long-term” effects and separately assess their impact on portfolio performance. Furthermore, considering that the momentum strategy is highly dynamic and depends on the broader market, we also add some macroeconomic indicators to the model. To distinguish between different economic states, we use the Markov regime-switching model and test for the existence of one, two, and three different market states. Furthermore, we use an economic sentiment indicator (ESI) series available from Eurostat to confirm periods of economic recession and add the VIX index series to measure the increased uncertainty in the market. In addition, we assess the benefits of adding a managed futures’ exposure to institutional investors’ portfolios. A “traditional” institutional portfolio, in this case, is approximated by a 60% investment in equity and 40% in fixed income; then, considering this portfolio as a benchmark, we test what effect an increasing managed futures’ position has on the overall performance of the portfolio.
We thoroughly compare the results across the portfolios and find that separating “short-term” and “long-term” momentum effects as two distinct factors in portfolio construction adds value by increasing returns and reducing the standard deviation of returns. We agree with Barroso and Santa-Clara (2012) that momentum strategies can increase the profitability and Sharpe ratio of a portfolio. Given their performance, the “long-term” momentum seems to capture a general trend in the market, and “short-term” momentum refers to the reversal effect due to market overreaction, liquidity, or trading issues. The results also show that the performance of each factor largely depends on the general economic conditions. Therefore, market timing is an essential component of a successful momentum strategy and can positively affect both risks and return on the portfolio. As expected, portfolios with combined long exposure to both “long-term” and “short-term” momentum factors performed exceptionally well during the COVID-19 financial crisis and can be considered a hedging instrument for improving the overall portfolio’s performance during periods of financial distress.
In summary, our paper focuses on the performance of the managed futures strategy based on two “long-term” and “short-term” momentum signals across different economic regimes, with a particular focus on the COVID-19 pandemic period. The performance of each of the momentum series largely depends on the general economic conditions of the market. We offer a new approach to momentum strategies because we found that the momentum strategy’s performance could be improved if broader macroeconomic variables were added to the analysis. We also address the critical characteristics of momentum strategies that can benefit institutional investors and highlight the potential advantages of including managed futures in a diversified portfolio. In particular, managed futures can be helpful as a hedging tool during a financial crisis.
The rest of the paper is organized as follows. Firstly, we discuss the main theoretical issues and academic literature related to managed futures portfolio management strategies. Secondly, we present the methodologies used and give our insights on each topic. We also add Markov regime-switching model to identify different types of decisions required, depending on the economic cycle. Finally, we present our results, discuss the main findings, and conclude.
2. Literature Review
The presence of profound economic reasons is a comforting indicator of the robustness of the expected managed futures’ returns. Keynes (1930) explained two types of participants in futures markets: hedgers and speculators. The hedgers (producers and issuers) buy insurance for a price risk and pay a premium to the market. Speculators (traders and investors) assume price risk, provide liquidity, and are rewarded by collecting this insurance premium.
In more recent studies, the risk premium can be modeled via different observable factors in futures markets. Two major factors discussed in academic literature include momentum (Erb and Harvey 2006; Miffre and Rallis 2007; Shen et al. 2007; Szakmary et al. 2010; Moskowitz et al. 2012) and the slope of a futures’ term-structure (Erb and Harvey 2006; Gorton and Rouwenhorst 2006; Fuertes et al. 2010). The momentum strategy attempts to capture significant directional moves across a diversified portfolio of assets. The model that generates buy or sell signals can be as straightforward as a price-moving average or exiting the price channel. The term structure strategy exploits the signals from a managed futures’ price curve—it buys most backwardated contracts (with a downward sloping term structure) and shorts most contangoed ones (with an upward-sloping term structure). Some alternative strategies can also be based on other factors such as value (Asness et al. 2013), market volatility (Frazzini and Pedersen 2014), liquidity/open interest (Szymanowska et al. 2014), inflation (Erb and Harvey 2006), skewness (Fernández-Pérez et al. 2015), and idiosyncratic risk (Miffre et al. 2015).
Another part of the research tries to combine different strategies, including momentum. Baz et al. (2015) made an analysis using three different strategies: carry, momentum, and value using different ways of implementation (directional and cross-asset). Bender et al. (2013) focused on factor investing, stressing that value, low size, and momentum strategies traditionally offered excess long-term returns. Those authors expanded the group of systematic factors and conducted research with MSCI indices. Momentum strategies were analyzed by Chabot et al. (2008); Chabot et al. (2014); Campbell (2004); Vogel and Gray (2015); Elias et al. (2014); Foltice and Langer (2015); Hong and Stein (1998); Hurst et al. (2014); Yu and Chen (2012); Krauss et al. (2015); Martin (2021); Martins et al. (2016); Menkhoff et al. (2012); Roncalli (2017); (Shen et al. 2007); and Tauseef and Nishat (2018). Some authors even focused on modern machine learning ranking algorithms for cross-sectional momentum strategies (Poh et al. 2020). Fong et al. (2005) analyzed international momentum strategies using a stochastic dominance approach and identified that momentum could be found globally. However, models considering investors’ mood are non-satiated, and that risk-averse models could not explain momentum.
Our study focuses on the time-series momentum factor that was first introduced by Moskowitz et al. (2012). Their paper offers one of the most comprehensive time-series momentum studies across various futures markets (equity index, commodity, foreign exchange, and fixed income). Balta and Kosowski (2012) contribute by suggesting several alternative estimates for a time series momentum: return sign, moving average, trend extraction, time-series t-statistics, and statistically meaningful trend, with the last alternative being referred to as the most efficient. We use the model proposed by Elaut and Erdős (2019), which is based on Moskowitz et al. (2012), and allow for estimating and comparing time-series momentum signals over selected lookback periods.
Because of significant returns and a low correlation with traditional asset classes, managed futures can also be successfully used for strategic asset allocation (Jensen et al. 2000; Erb and Harvey 2006). In her paper, Kaminski (2016) notes that managed futures seem to be an excellent instrument for risk hedging during a financial crisis. For example, in the 2018 financial crisis, managed futures benefited from the distressed market and were recorded as the most profitable investment category. We also test this property by assessing the impact of adding a managed futures momentum exposure to the broader portfolio performance.
3. Methodology
For an investment strategy to be sustainable over a more extended period, there must be an underlying structural property in the market for a risk premium to exist and conditions for the trading strategy to capture it. Till (2016) suggests that there are some solid, economically grounded reasons for consistent returns in futures’ markets to exist due to:
- Momentum;
- Term-structure; and
- Portfolio rebalancing.
Momentum is simply a “bet” that the past performance contains valuable information for estimating expected returns in the future. Indeed, securities with high average returns in the past can outperform equities with the worst performance up to 12 months ahead. Erb and Harvey (2006), Gorton and Rouwenhorst (2006), and Miffre and Rallis (2007) confirm that the momentum strategy works well in the futures markets. A momentum portfolio systematically longs futures with the best performance and shorts futures with the worst performance in these studies. This momentum estimate is typically referred to as a cross-sectional momentum, as it picks the best- and worst-performing contracts out of a cross-section of selected futures. An alternative method is a time-series momentum (Szakmary et al. 2010; Moskowitz et al. 2012). It focuses on each futures’ past returns—buys if its past performance is positive and sells if the performance is negative. An aggregated time-series momentum strategy is, then, a weighted portfolio of these individual positions. This method allows for easy comparison and use of various asset classes with very different return distributions.
The term-structure of individual futures’ contracts can also be considered a structural source of returns, especially over a more extended period. It is specific to the futures market, as a futures contract price today is paid for delivering an underlying asset at a pre-specified date in the future. When a futures’ contract trades at a discount to a spot price, we call this futures’ price curve slope a backwardation, and when a deferred futures’ contract trades at a premium to a spot price, we refer to it as a contango. As maturity approaches, the futures’ price of a backwardated (contangoed) contract is expected to increase (decrease) towards the expected spot price, enabling long (short) speculators to earn positive returns (Erb and Harvey 2006; Gorton and Rouwenhorst 2006; Gorton et al. 2013). Feldman and Till (2006) show that the deeper the futures market is in backwardation (or contango), the stronger the performance. When the futures’ contract is in backwardation, an investor faces two potential return sources: an increase in the futures’ price and a positive “roll-yield”. Even if the spot price starts declining, an investor can still profit from a so-called “roll-yield”. As the futures’ contact maturity approaches, an investor needs to roll his/her near-term expiring futures’ contracts into contracts with expiration dates further in the future to keep his/her positions open. In backwardation, the “roll-yield” (i.e., a price difference between the nearby contract that is closed and a more distant contract that is rolled into) is expected to be positive. However, if the market is in contango, rolling the long positions can negatively affect “roll-yields” and have a very damaging effect on total returns.
Portfolio rebalancing is the third structural source of return (Till 2016; Bakshi et al. 2019). The studies show meaningful returns from rebalancing portfolios of low-correlated, mean-reverting, high volatility investments, such as futures contracts. A rebalancing return can be accrued from periodically resetting the portfolio to its initial (often, equal) weights that cause an investor to frequently sell assets that have gone up and sell assets that have declined in value. Erb and Harvey (2006) and Sanders and Irwin (2012) have empirically confirmed that portfolio rebalancing represents a robust source of returns from owning and rolling a portfolio of futures.
In this study, we test the performance of the managed futures strategy that is based on momentum effects across various (i.e., equity index, FX, bonds, and commodity) futures markets. We construct a long/short futures portfolio based on the momentum factor. The momentum returns are estimated with the Elaut and Erdős (2019) asset-based momentum factor that aggregates time-series momentum signals over different time horizons. The strategy is called “adaptive time-series momentum” (ATSMOM), in which the momentum signal for any given security in the portfolio is averaged over several lookback horizons:
where sgn is the sign of the two-day lagged return, L is the number of assets in the strategy, and σ is the two-day lagged, exponentially weighted moving average (EWMA) estimator of volatility with a 60-day rolling window that can be estimated as follows:
with λ as a decay factor. Similarly to Elaut and Erdős (2019), we use a decay factor of 0.4 as a way to achieve an ex ante volatility of 40% per security, which can be expected to result risk factors with an ex post volatility of approximately 12% per year (which represents a typical CTA target volatility of around 12%).
This model is based on the earlier works of Moskowitz et al. (2012) and Baltas and Kosowski (2012). The term “time-series momentum” was first introduced by Moskowitz et al. (2012) who documented a presence of persistent “trend” factors across a broad range of futures markets. Baltas and Kosowski (2012) later proposed improved volatility and momentum estimates for this model. In the Moskowitz et al. (2012) paper, the momentum strategy is called the “time-series momentum” (TSMOM), where the return of the momentum futures portfolio is calculated as follows:
If we compare the models, Moskowitz et al. (2012) estimate the momentum only as a binary signal that can be equal to only 1 (“up”) or –1 (“down”). Considering that Elaut and Erdős (2019) aggregate the time-series momentum signals over several lookback periods, the momentum can result in any value within the range [−1,1], also referred to as the strength of this signal. In practice, if the TSMOM is only a sign or direction of a 251-day trend, the ATSMOM averages a range of TSMOM signals looking backward from 10 to 251 trading days. This new development introduces an opportunity to use Elaut and Erdős’s (2019) model for quickly estimating and comparing momentum signals based on different lookback periods.
This study takes a closer look at a time-series strategy’s performance based on two key separate long- and short- momentum signals. Due to the flexibility of the Elaut and Erdős (2019) model, it is possible to construct a momentum portfolio strategy with a selected lookback period length. For this purpose, we define a 1–3 month lookback period as a short-term momentum and a 9–12 month period as a long-term momentum. Thus, we contribute to “time-series momentum” research by estimating momentum signals separately for long and short horizons and further documenting that both signals respond differently to market conditions changes.
Indeed, each structural source of return’s performance largely depends on a general situation in the market (Routledge et al. 2000; Koijen et al. 2018; Bakshi et al. 2019). This paper examines the relationship between a selected managed futures strategy’s performance and the general economic conditions across time and markets. Given the current, rapidly changing market conditions, the market timing is an essential component of each successful managed futures’ strategy. Hong and Yogo (2012) suggest that managed futures’ returns vary with time and are predictable from macroeconomic and other specific variables. In particular, Sakkas and Tessaromatis (2020) relate that market volatility is a key factor for predicting returns in managed futures portfolios.
We use the Markov regime-switching model based on the S&P 500 time series for the sample period to distinguish between different economic states. Its performance is closely related to the general economic conditions. To allow for asymmetric exposure, we test for the existence of one, two, and three different states. Since the objective is to get an economic interpretation for managed futures’ strategies, we start testing a three-state system. The test data is arranged so that state 1 represents an “up” state, state 2 a “down” state, and state 3 is an “intermediate” state in the Markov regime-switching model. To estimate the Markov regime-switching, we use the MATLAB package provided by Perlin (2015). In addition, we include an economic sentiment indicator (ESI) series available from Eurostat to confirm periods of economic recession. We also add the VIX index series as a proxy for future market uncertainty and conditions (low during expansions and high during recessions). Of particular interest is the period of the COVID-19 crisis. Contrary to traditional investments, the managed futures strategies are expected to perform exceptionally well during this clearly defined period of financial distress.
This paper also analyzes the benefits of adding a managed futures’ exposure to institutional investors’ portfolios. Considering that a long-term recorded correlation between futures’ returns and a traditional (i.e., equity and bond) investment portfolio returns are surprisingly low or even negative, the institutional investors can potentially benefit from increased risk-adjusted returns and better portfolio resilience by including managed futures to their portfolio (Lintner 1996). We use our estimated portfolio (based on two short-term and long-term momentum factors) to represent managed futures investments. A “traditional” institutional portfolio is approximated by a 60% long position in the S&P 500 Index and a 40% long position Bloomberg Barclays US Aggregate Bond Index. We construct several portfolios with different (increasing) allocations to a managed futures’ exposure for this analysis. Considering the pure 60:40 equity/bond portfolio as a benchmark, we will estimate how an increasing managed futures’ position affects the overall portfolio’s performance. Given the modern portfolio theory, a managed futures exposure should contribute to an absolute return and add valuable diversification to a “traditional portfolio” of stocks and bonds.
The daily data across futures markets is available from Tick Data LLC (www.tickdata.com, accessed as of 3 December 2020) that offers historical tick-by-tick prices on the futures and index markets. Our dataset consists of futures prices for 54 futures contracts in four asset classes (25 commodities, 9 equity index, 10 foreign exchange, 10 bond futures). We report the list of futures contracts in Table A1 (Appendix A). Both the daily S&P 500 and Bloomberg Barclays US Aggregate Bond indices’ levels are available from Bloomberg. The sample period ranges from January 2010 to December 2020. The futures investment will be represented by a long/short position in front-month futures fully collateralized by holding a corresponding value of the contract in US government bills or a bank deposit paying EURIBOR interest rates. At the end of the day, all positions are rebalanced by marking them to market and adjusting the collateral position to reflect the corresponding cash inflow or outflow. The futures’ positions are rolled into the next month’s contract at the close on the day before expiration. Following Moskowitz et al. (2012), the most liquid contracts in each market will be considered.
4. Results and Discussion
In this section, we test and compare the performance of the managed futures’ portfolios constructed based on two “short-term” and “long-term” momentum factors with the data set ranging from January 2010 to December 2020 and check whether the results are robust within a more extended period. In addition, we analyze the benefits of adding managed futures’ exposure to the “traditional” equity/bond portfolio and confirm the substantial advantages over the sample period.
4.1. Momentum Factors
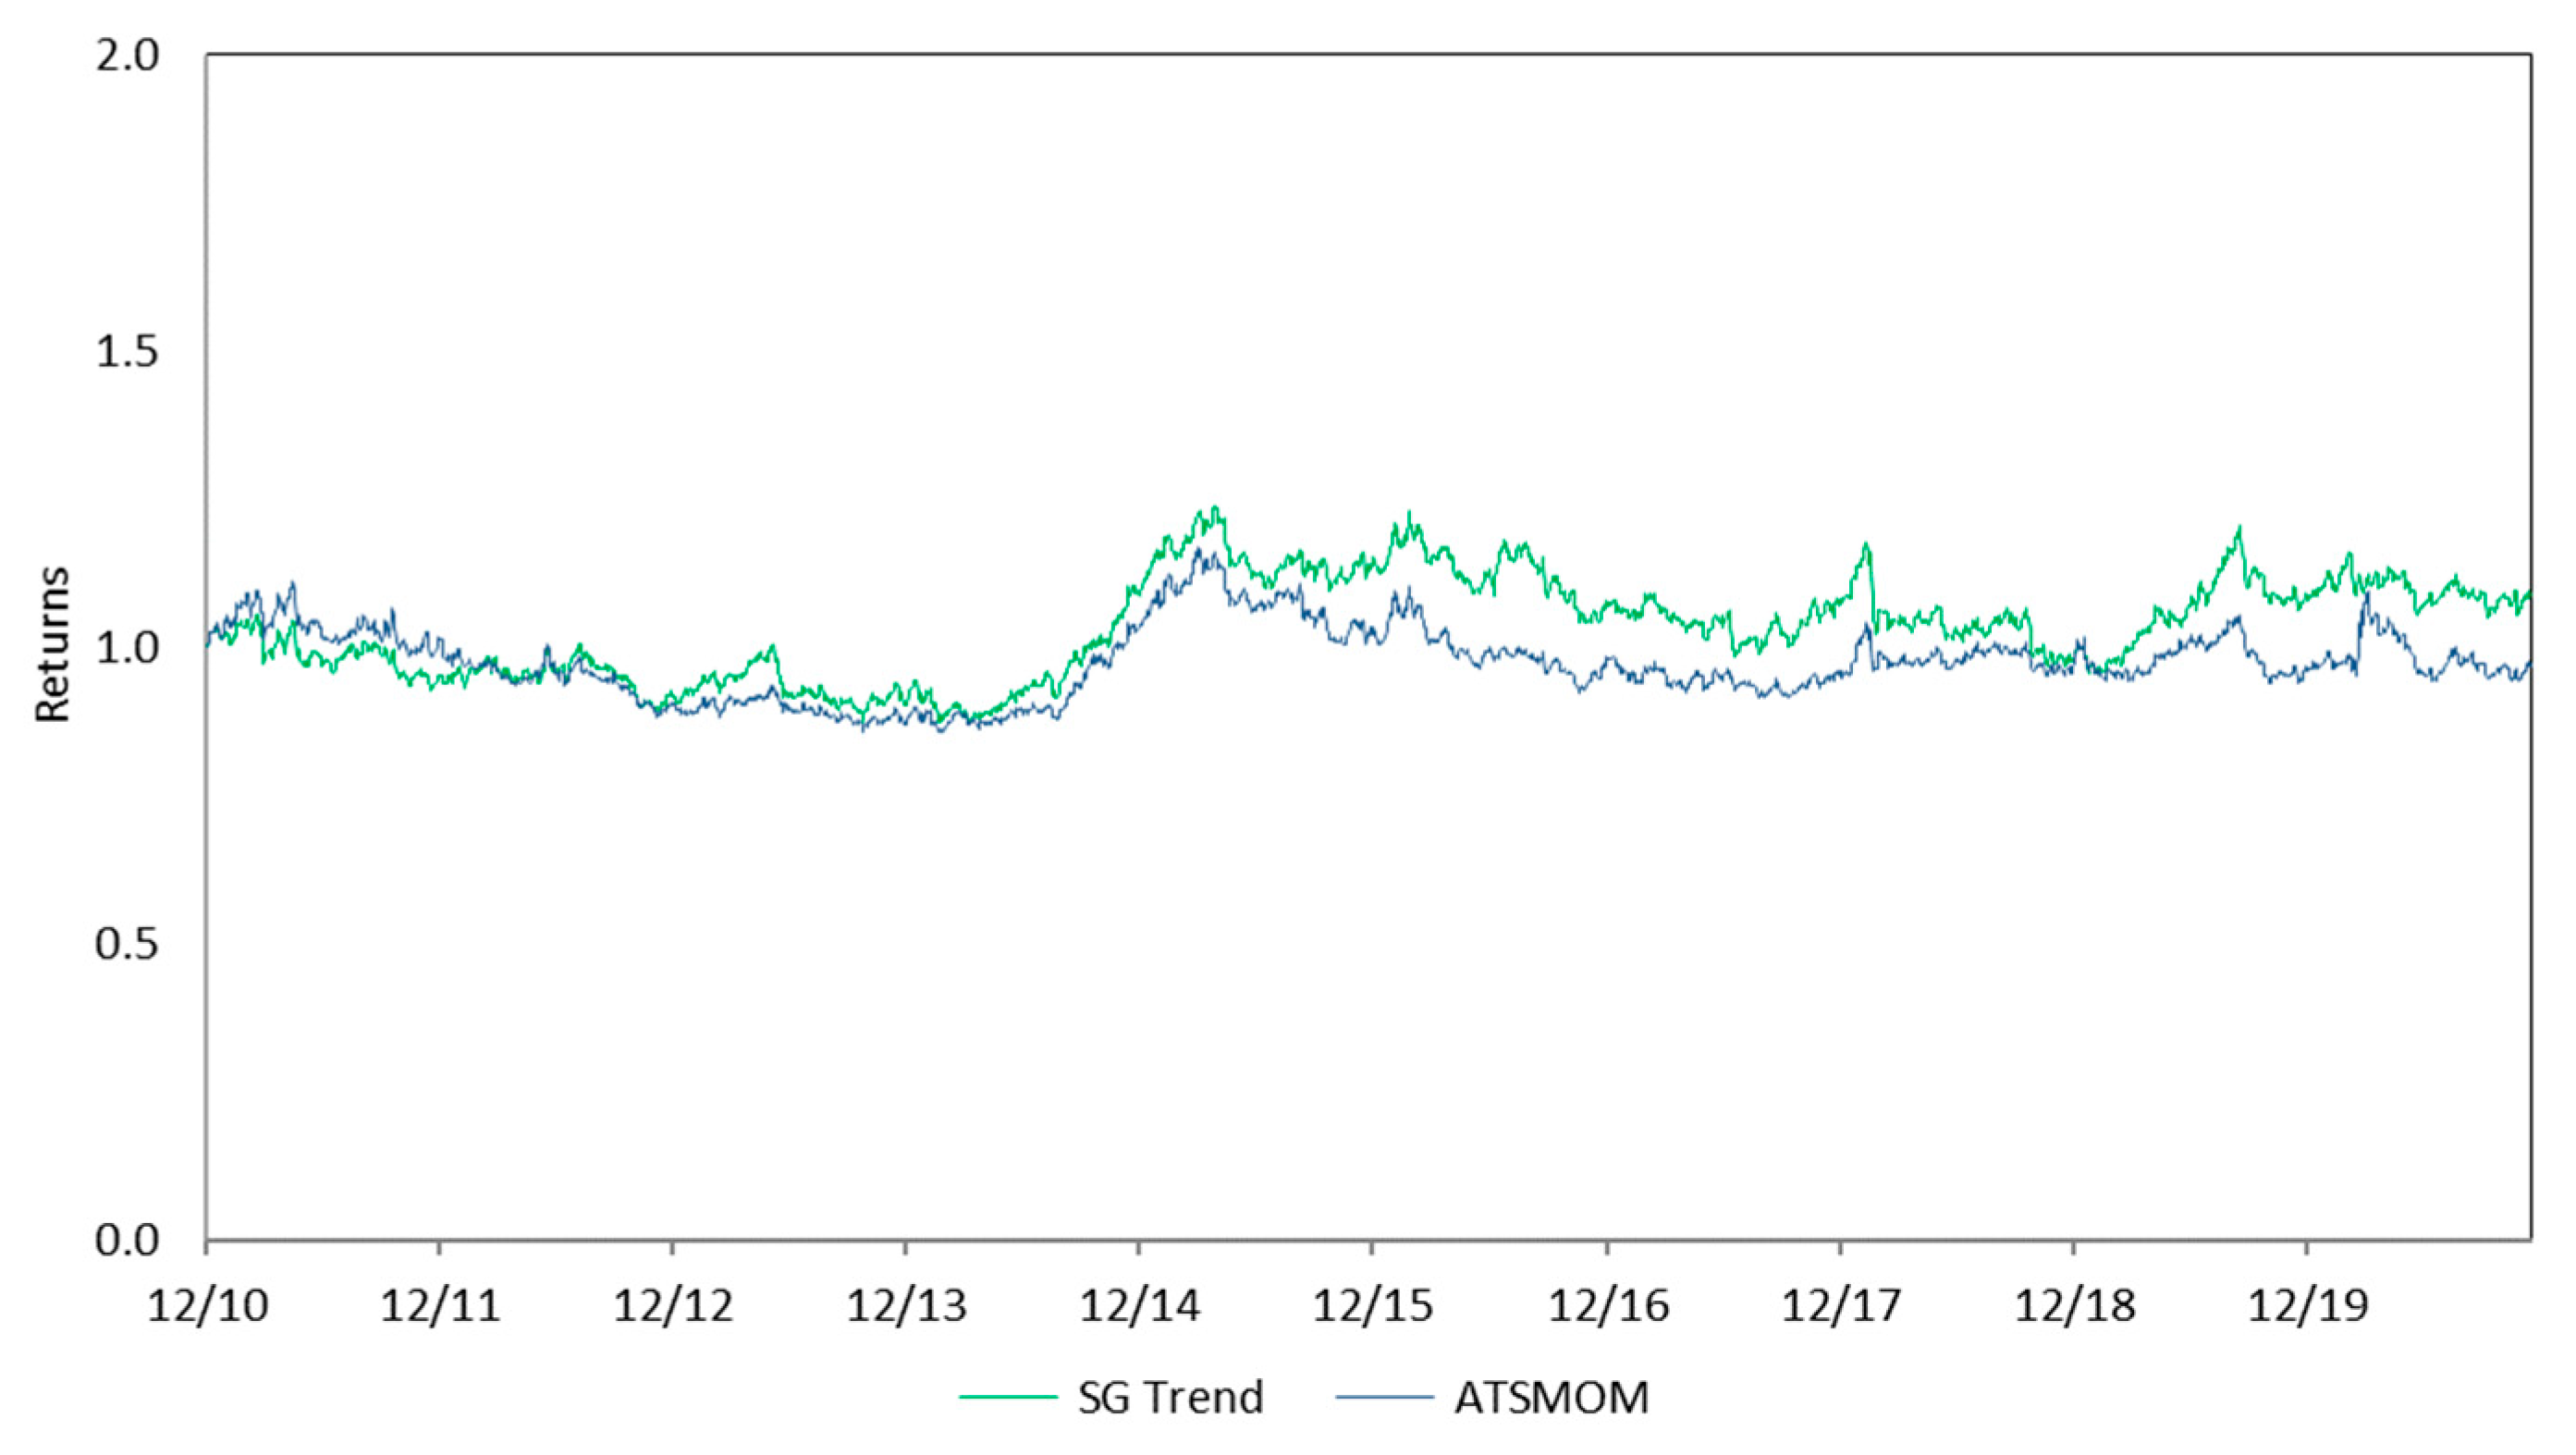
To evaluate the managed futures strategy that is based on momentum effect, we construct the time series that is based on the ATSMOM (“adaptive time-series momentum”) factor as described in Elaut and Erdős’s (2019) paper. To get an intial sense of the series performance, we plot it against the benchmark SG Trend Index. The SG Trend Sub-Index is a subset of the SG CTA Index designed to track the 10 largest (by AUM) trend-following CTAs and represent the momentum followers’ performance in the managed futures market.
Figure 1 shows the ATSMOM factor’s time-series compared to the SG Trend Index, based on daily returns data ranging from January 2010 to December 2020. For comparison purposes, an initial level for each series is set at one (as, for example, we invested USD 1 at the beginning of the period) and then adjusted based on their corresponding returns. We found a substantial correlation of 0.7397 between two series for the sample period that confirms, in essence, that the ATSMOM factor performs as it was expected to, i.e., it follows a general, average momentum strategy in the market. The performance of the ATSMOM factor is slightly worse than the benchmark index. However, this is mostly due to the transaction costs, as we added the average transaction costs per trade in our analysis to account for practical implementation issues of the ATSMOM strategy.
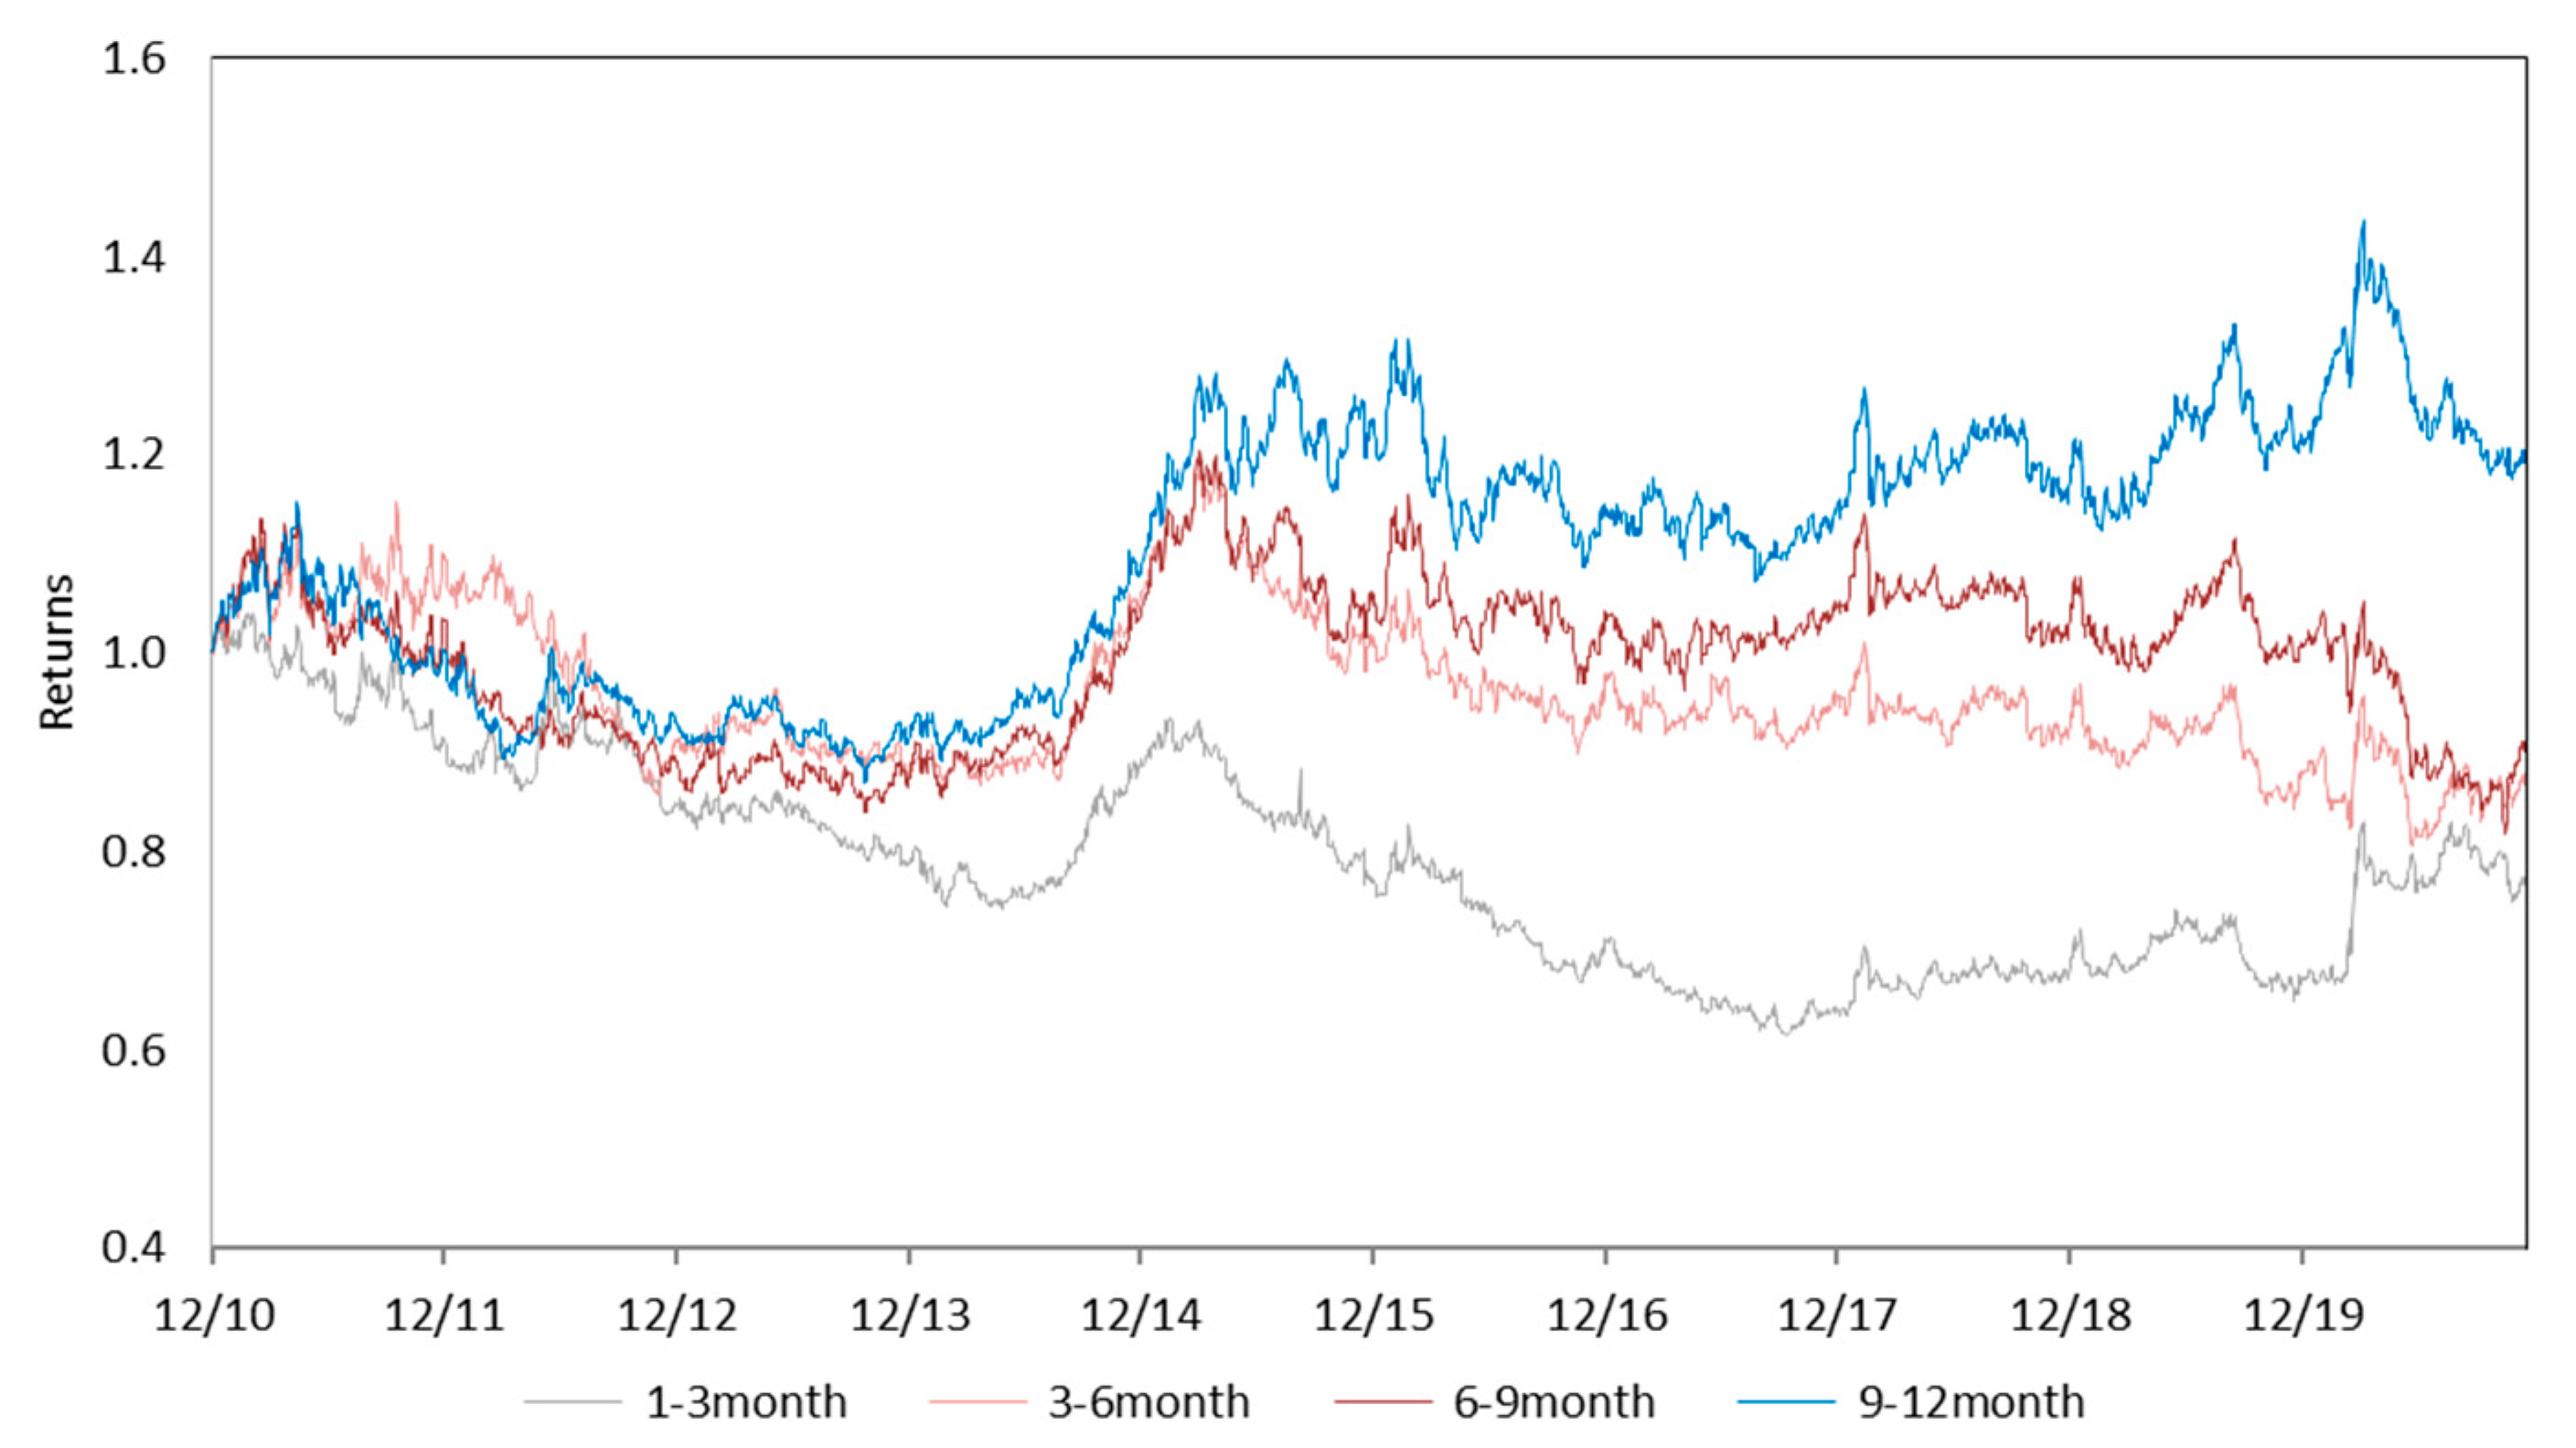
Due to the flexibility of the Elaut and Erdős (2019) model, estimating and comparing momentum factors is possible based on different lookback periods. To take a closer look at the momentum factor performance, we estimate an ATSMOM series with four distinct lookback periods: 1–3 months, 3–6 months, 6–9 months, and 9–12 months (see Figure 2). The results indicate that “short-term” (e.g., 1–3 months) and “long-term” (e.g., 9–12 moth) series are often minor or even negatively correlated. For example, we found a negative correlation of −0.414 between the “short-term” and the “long-term” momentum series during the sample period from January 2010 to December 2020. The economic reasoning for this might be that the “long-term” series is more sensitive to the overall market’s general trend. In contrast, the “short-term” series represents a correcting reversal to the mean effect. This phenomenon is already documented in other financial markets. For example, Zaremba et al. (2019) confirm that, contrary to the general trend, the stocks with a high (low) return in the previous month underperform (overperform) in the following month. It is a short-term reversal effect due to investors’ overreaction, liquidity issues, institutional behavior, trading frictions, and/or transaction costs. We found this effect present in the futures market, too; contrary to a long-term momentum, short-term momentum is negatively correlated with the overall market trend.
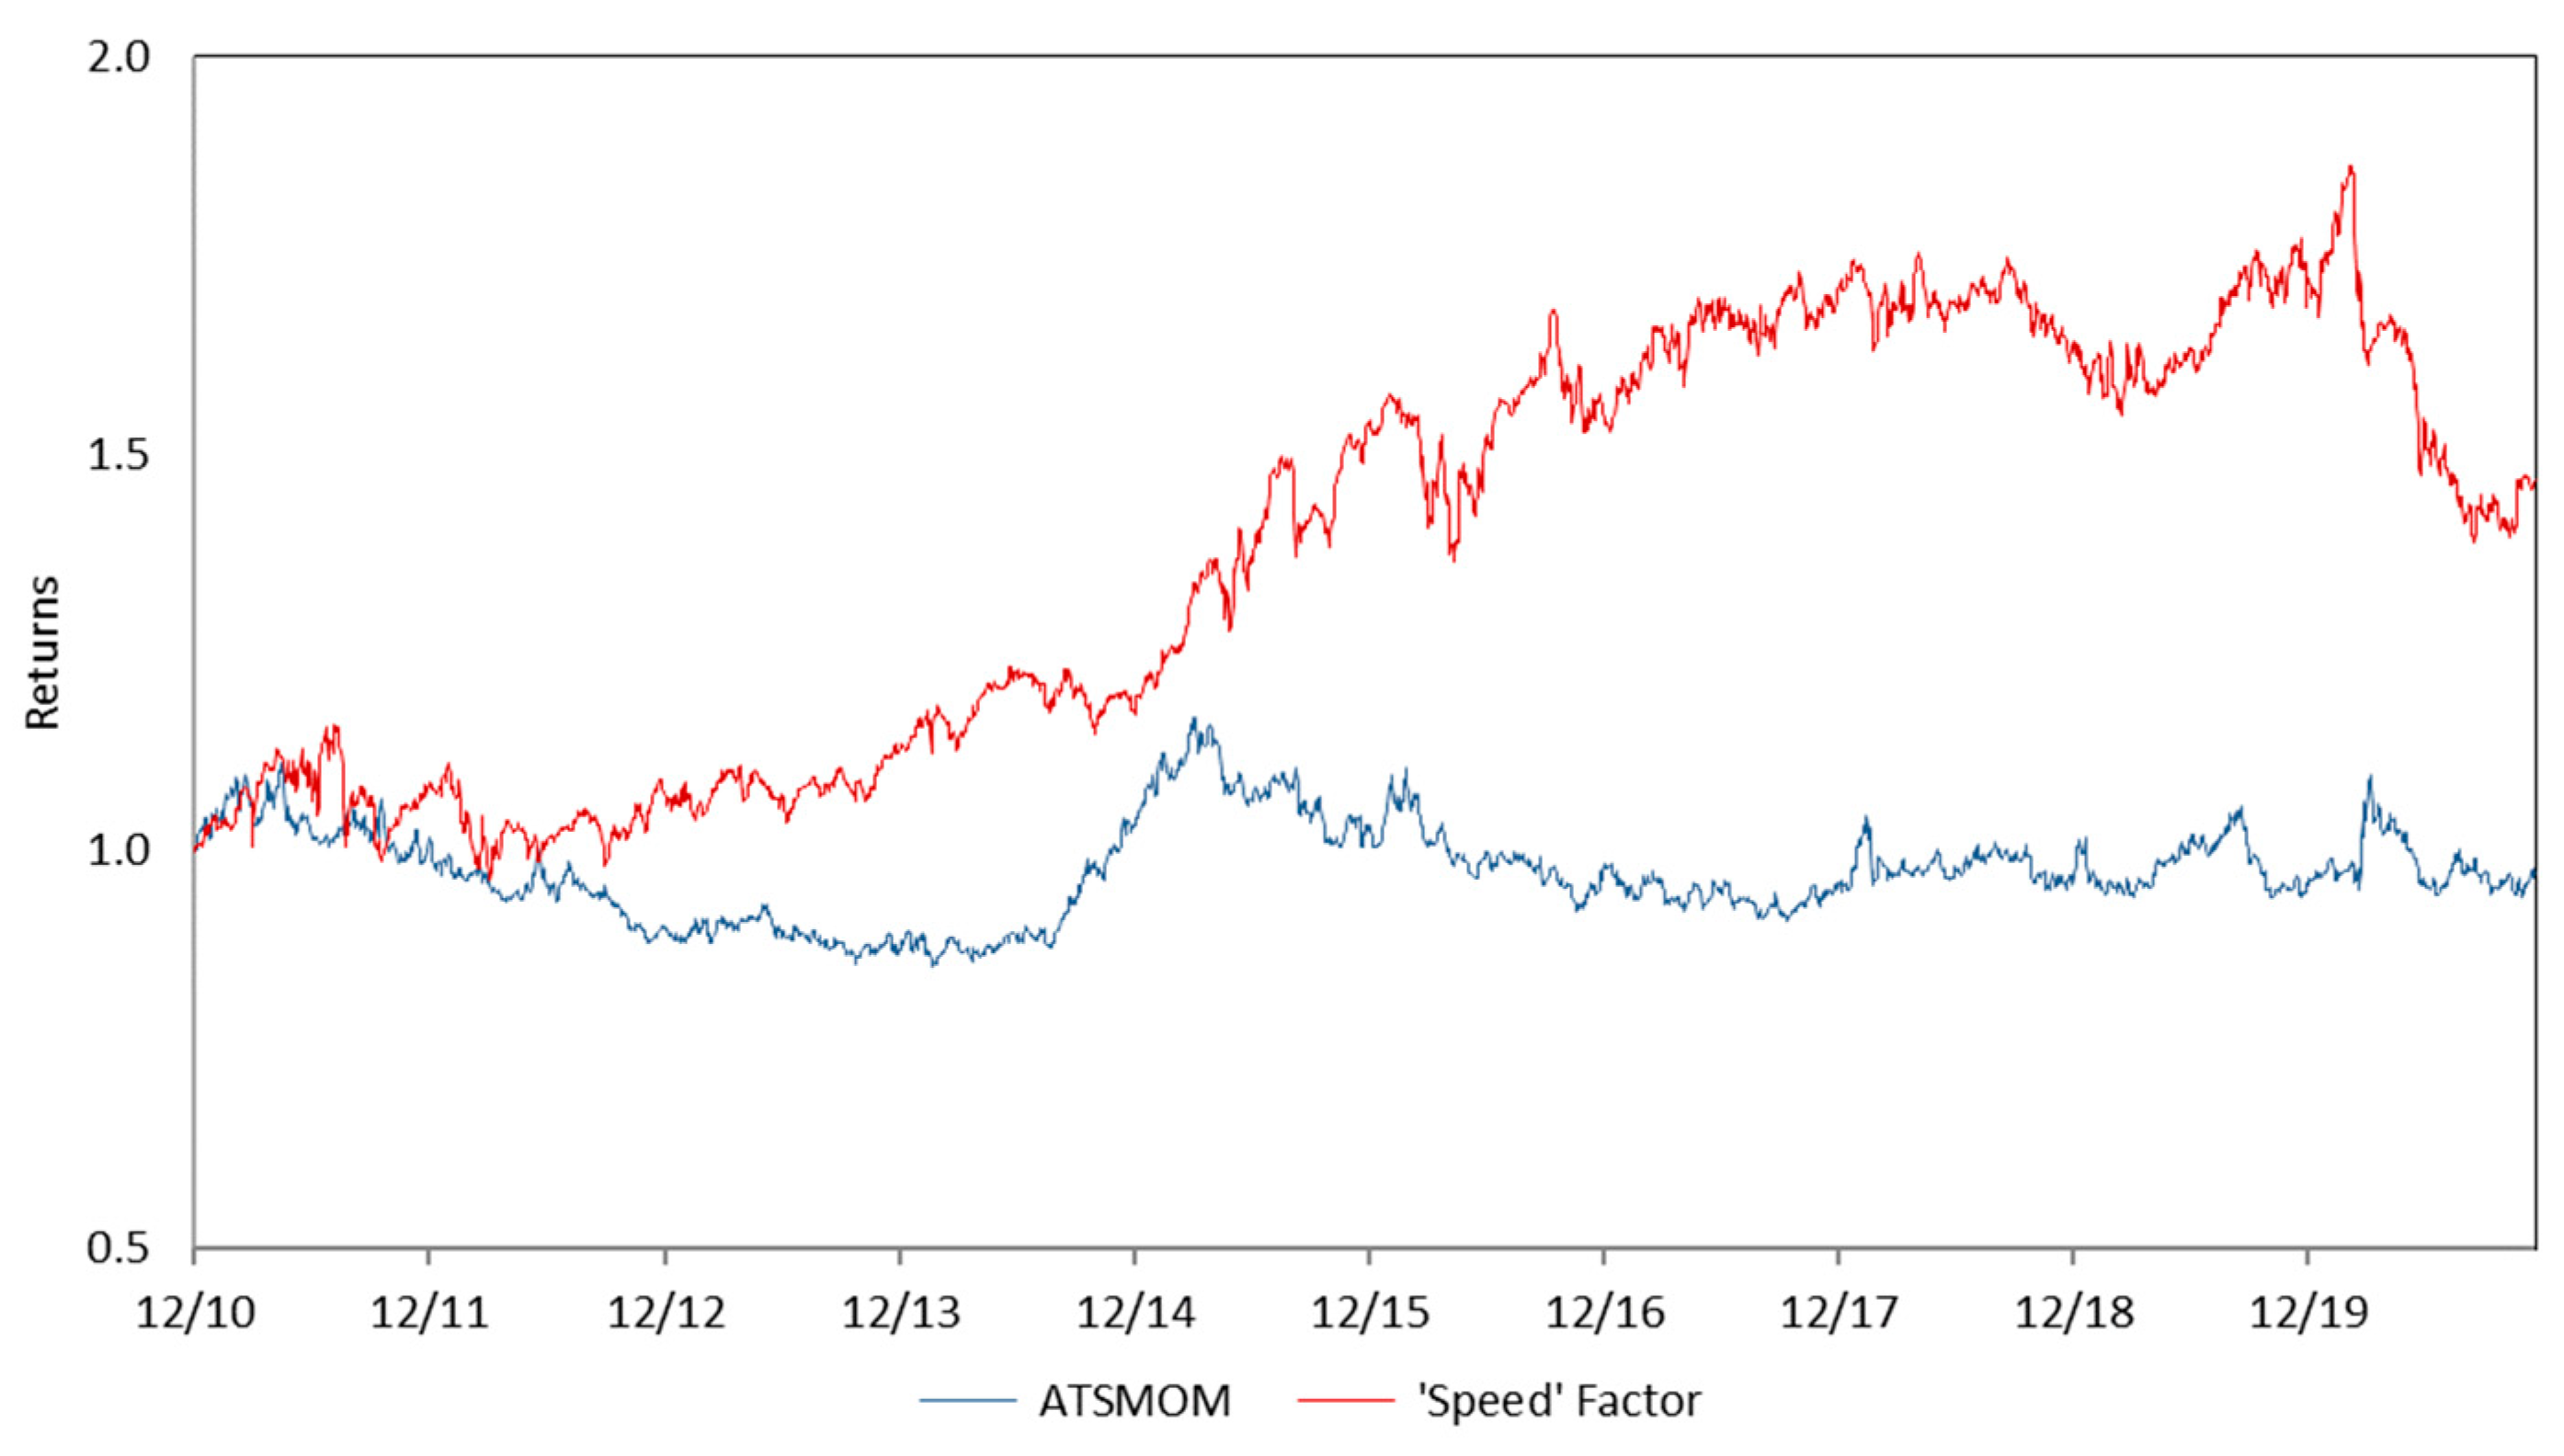
To evaluate the significance this effect has on the momentum strategy’s performance, we construct an alternative portfolio where the positions with “long-term” momentum are bought (long position), and the ones with “short-term” momentum are sold (short position). Elaut and Erdős (2019) refer to this position as the “speed” factor. As illustrated in Figure 3, the momentum portfolio with the “speed” factor presents a better investment opportunity as it outperforms the ATSMOM portfolio during the sample period.
To compare performances of the portfolios, the main characteristics are presented in Table 1. Although the volatilities of both portfolios for the sample period are relatively similar (10.3% p.a. for the ATSMOM portfolio, 11.7% for the portfolio with the “speed” factor), the returns are improved in the case of the portfolio with the “speed” factor (i.e., 4.3% p.a. as compared to a 0.3% p.a. return of ATSMOM portfolio). This significantly increases the Sharpe ratio from 0.027 for the ATSMOM portfolio to 0.363 for the portfolio with the “speed” factor. The results also indicate that both portfolios’ returns are negatively skewed (−0.432 for the ATSMOM portfolio, −0.285 for the portfolio with the “speed” factor), however, including the “speed” factor positively affects the portfolio skewness. However, it also increased the portfolio kurtosis, which refers to a higher probability of obtaining extreme return values in the future.
Our main results favor the portfolio with the “speed” factor, as it is expected to increase the expected returns on a risk-adjusted basis. However, it should be noted that it also outperforms SG Trend Index (a benchmark for the industry) by offering increased returns and the reduced standard deviation of returns.
4.2. Market Regimes
We extend the analysis by comparing the performance of both “short-term” and “long-term” momentum series across economic regimes. Several studies (Routledge et al. 2000; Hong and Yogo 2012; Bakshi et al. 2019) indicate that the performance of the momentum factor series largely depends on the general economic conditions. Therefore, market timing is an essential component of each systematic momentum strategy.
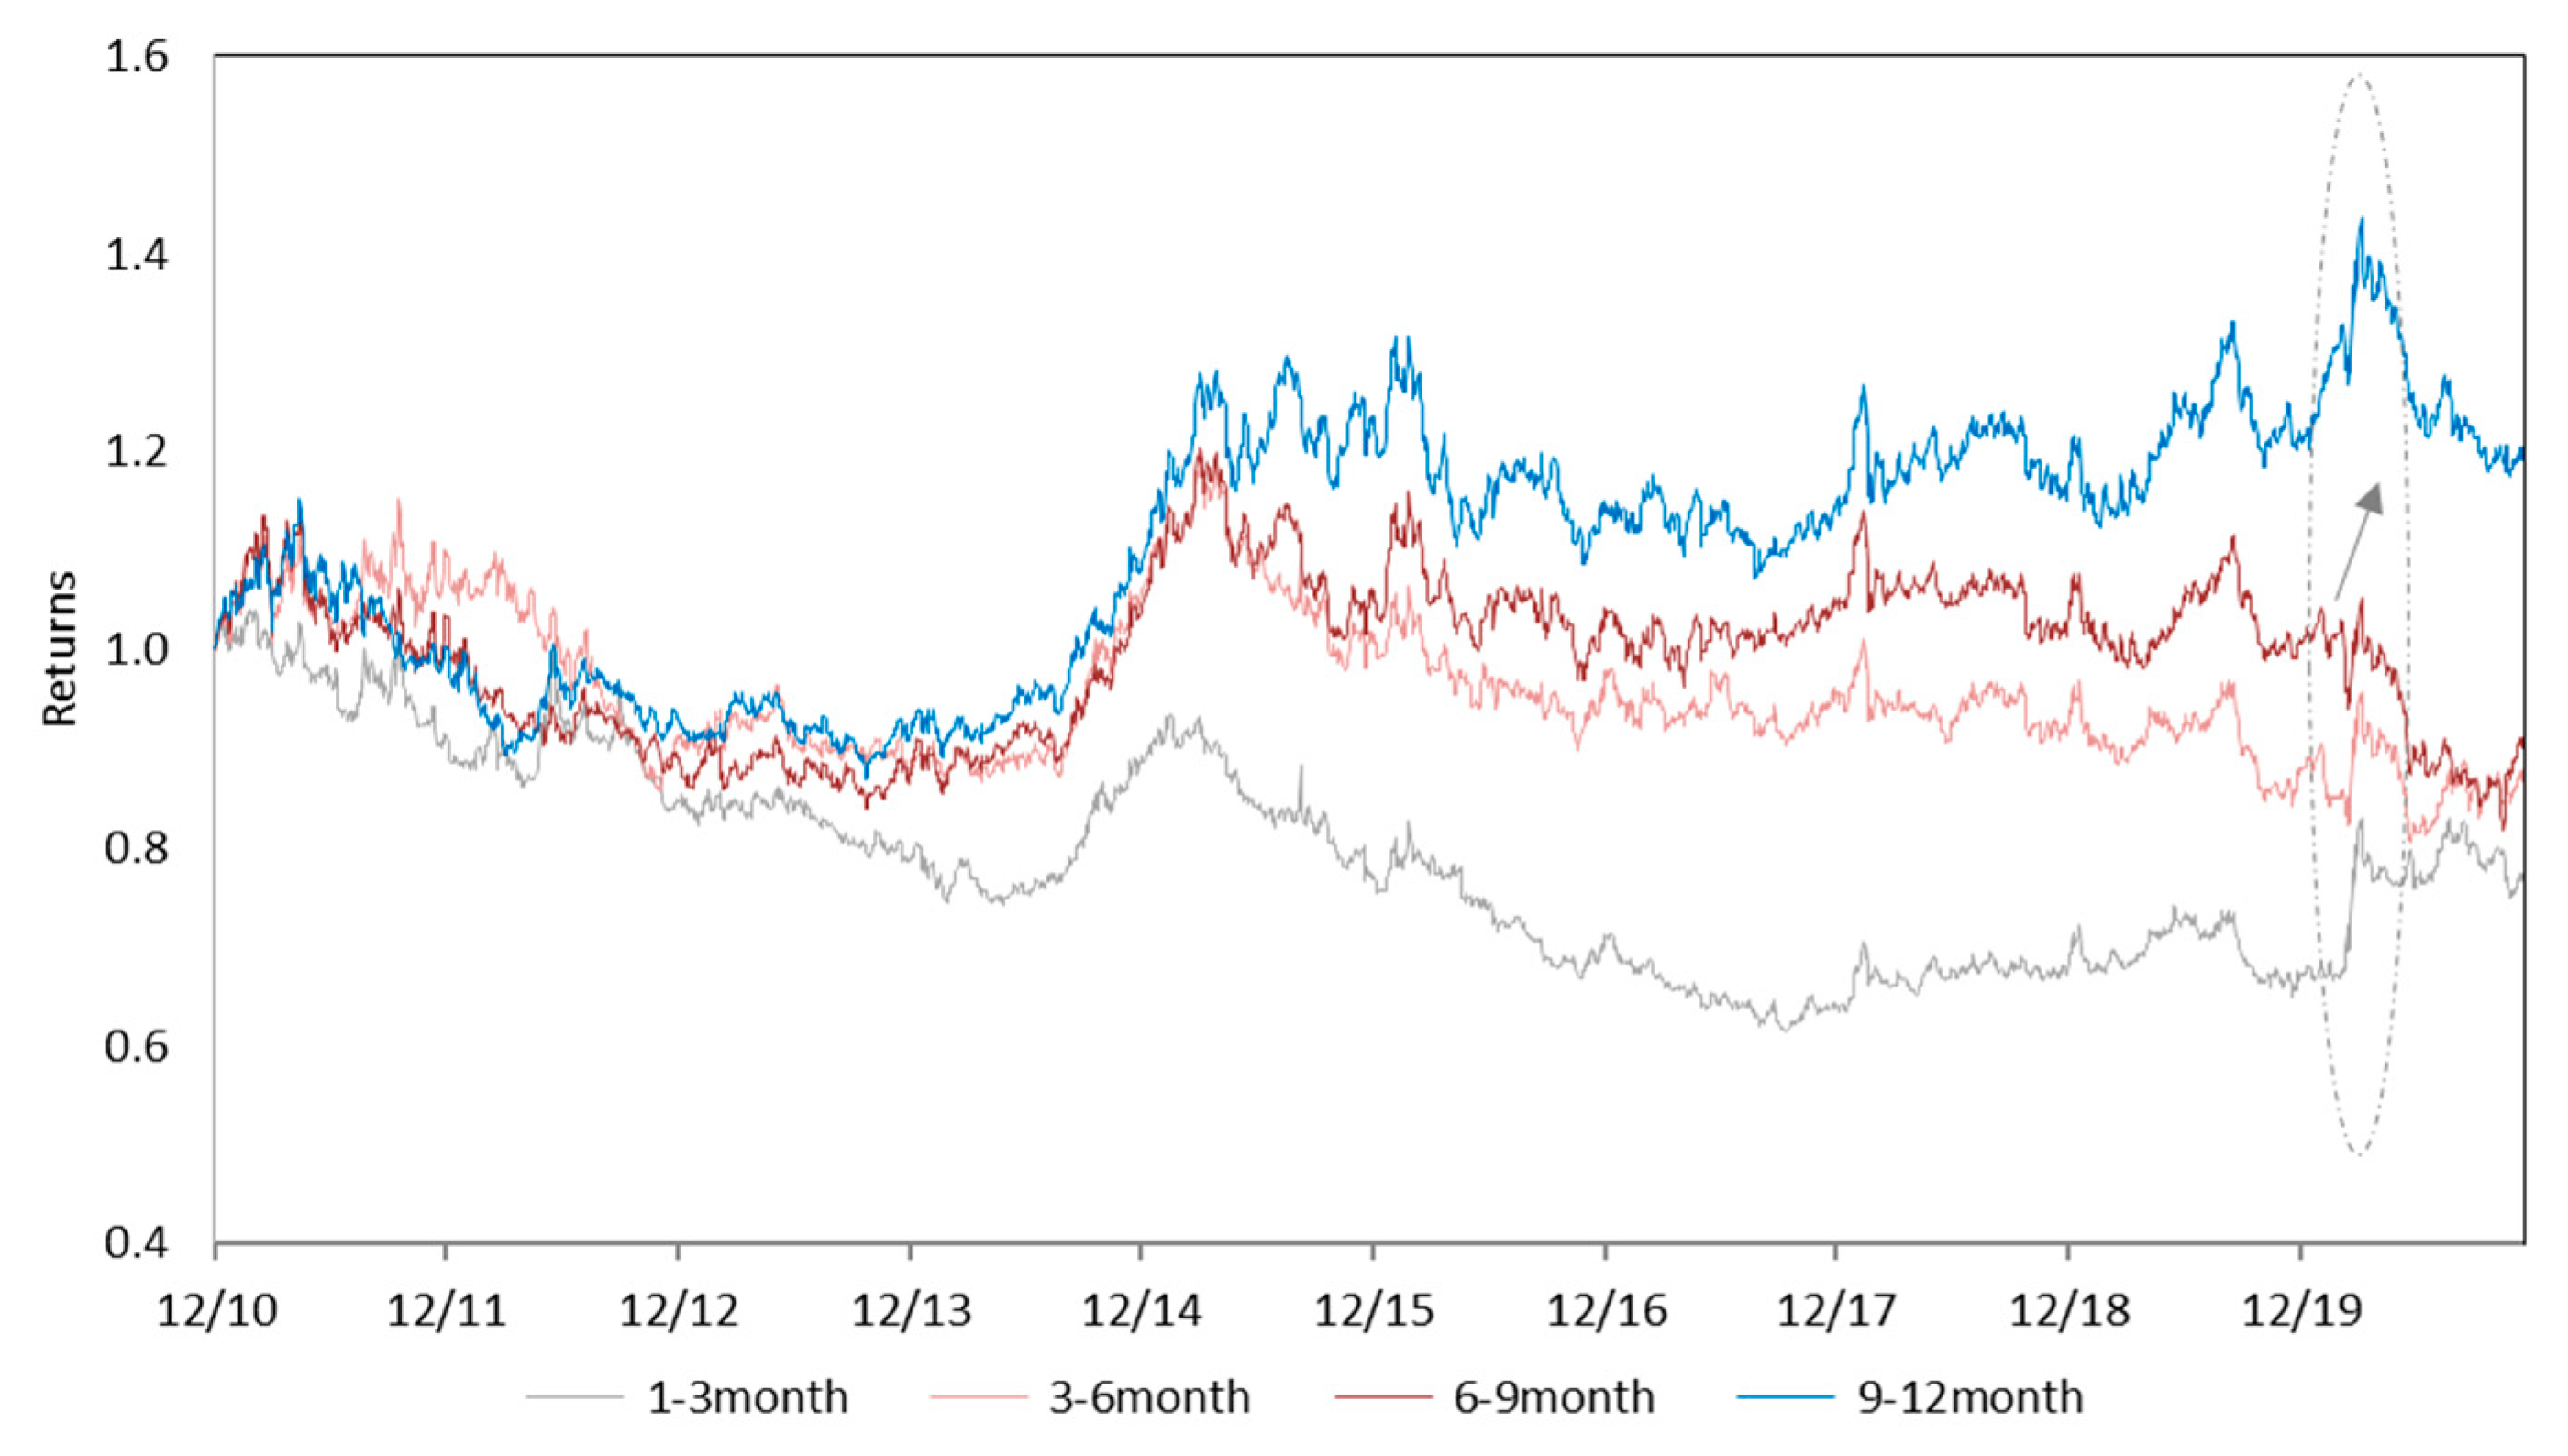
We found that the correlation between the “short-term” and “long-term” momentum series increases during periods of financial distress, as “short-term” momentum also starts capturing a robust and prominent trend in the market. During the COVID-19 crisis, both series exhibit a coordinated upward movement (see Figure 4). The COVID-19 pandemic had a powerful impact on financial markets, but looking back, we can observe that the negative effect was concise. It gives valuable insight into momentum strategies’ performance during such critical moments of market distress. Our estimated correlation between the “short-term” and “long-term” momentum series increased up to 0.9811 during the COVID-19 crisis compared to a negative correlation of −0.414 between the two series during the sample period of January 2010 to December 2020.
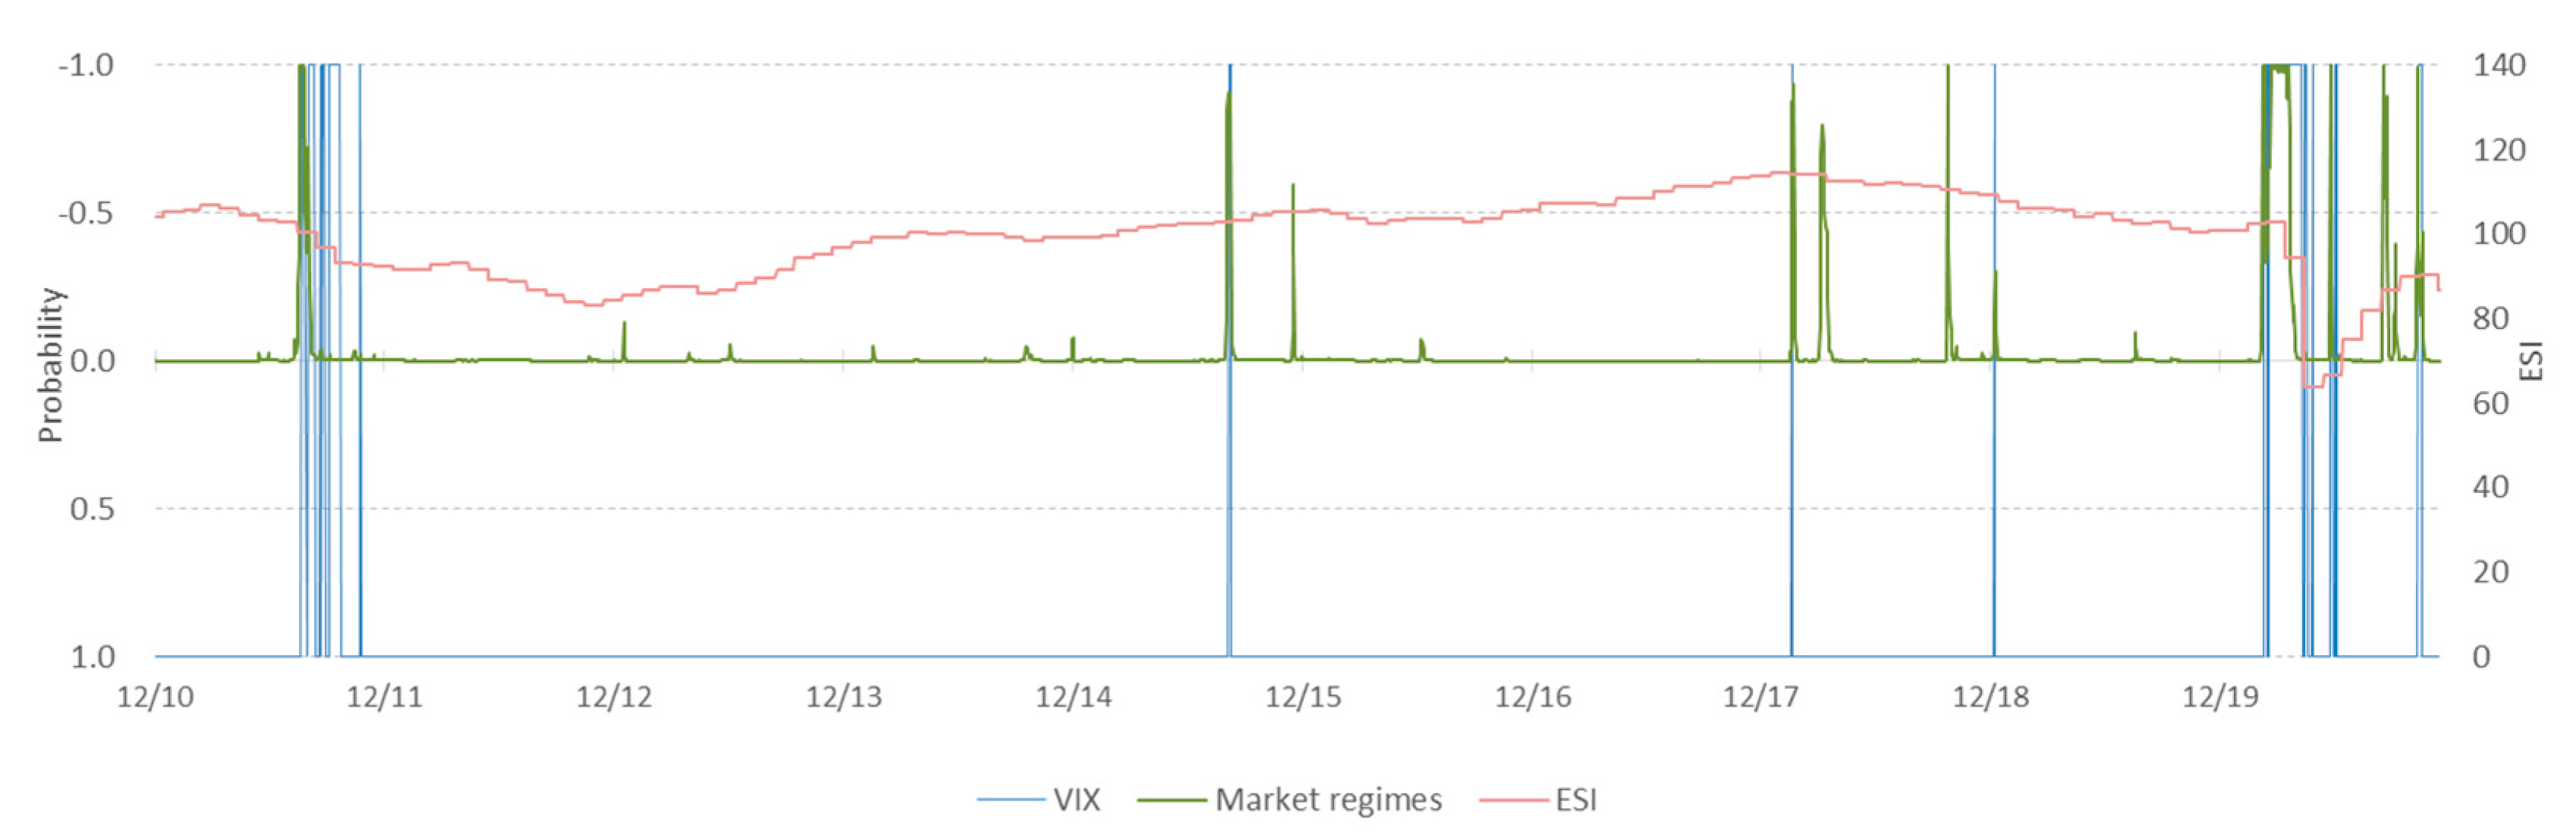
We used a Markov regime-switching model to distinguish between the periods of high and low volatility in the equity market (Perlin 2015). Using daily S&P 500 Index data, we define the periods of the “up”, “intermediate”, and “down” states of economic regimes. The evolving probability of the “down” economic state is presented in Figure 5. In addition, we use the economic sentiment indicator (ESI) series available from Eurostat as a control variable to confirm periods of economic recession. Considering that volatility is singled out as one of the most critical factors in the market (Sakkas and Tessaromatis 2020), we also consider the VIX Index as a proxy for the market’s uncertainty. By definition, the VIX index measures an expected stock market volatility over the next 30 days as implied by the S&P 500 index options. Therefore, it must be strongly correlated with market sentiment and its current economic state. In general, VIX values greater than 30 are already linked to increased uncertainty and risk; therefore, we set a critical value of 30 to define the periods of significant financial distress. It seems that all indicators jointly capture critical moments in financial markets that occurred during the sample period from January 2010 to December 2020: the Black Monday in 2011 (when US sovereign debt was downgraded for the first time), the 2015 Chinese stock market turbulence, and the recent COVID-19 financial crisis.
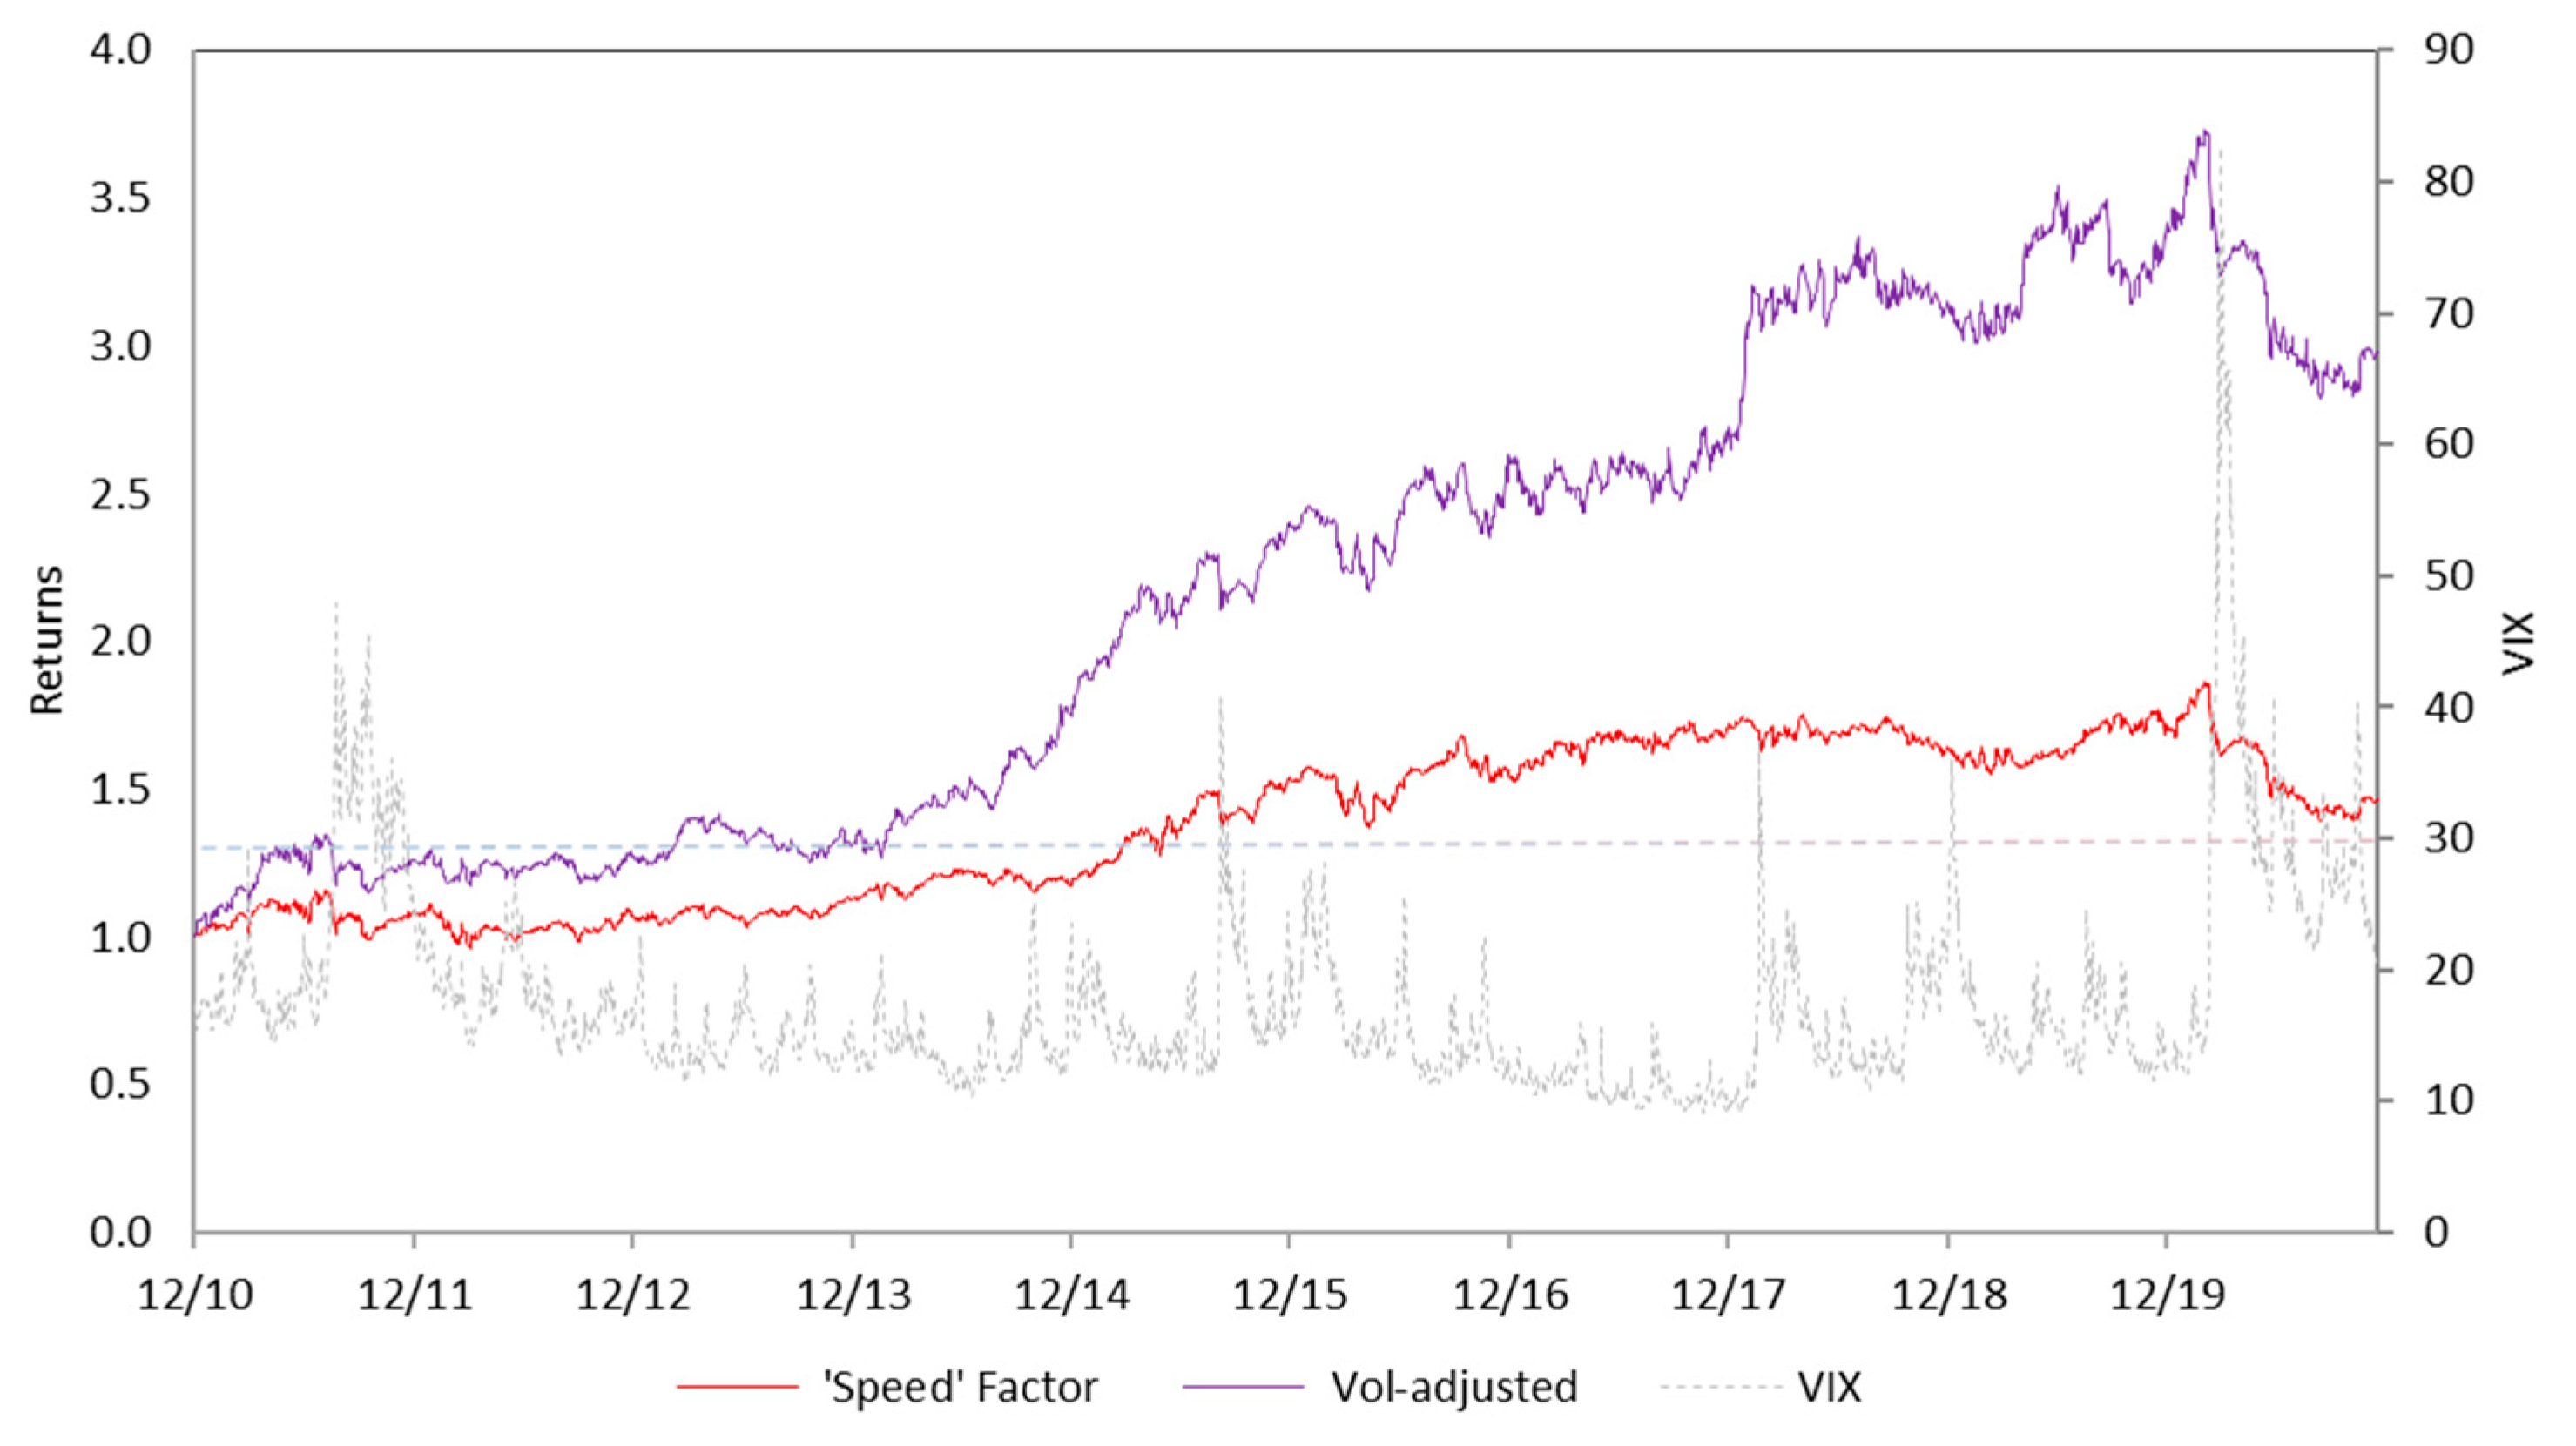
To incorporate the economic regime’s effects into our momentum strategy, we use our portfolio with the “speed” factor, as constructed in the previous section. However, we allow for the long position in both “long-term” and “short-term” momentum factors during “down” state economic regimes. As illustrated in Figure 6, the resulting time series refers that the momentum portfolio, adjusted for the economic regimes, outperforms an initial “speed” factor portfolio. Both portfolios perform relatively similarly during periods of low volatility, and the volatility-adjusted momentum portfolio always outperforms the “speed-factor” portfolio during high volatility periods.
A more detailed analysis of the results is presented in Table 2. The results are clearly in favor of the momentum portfolio, adjusted for corresponding market regimes. Adjusting the portfolio exposure to incorporate a broader set of economic factors positively affects both risk and return of the portfolio, resulting in a significant increase in its Sharpe ratio (0.805 compared to 0.363 of the portfolio with the “speed” factor and 0.129 of the SG Trend Index). For example, the portfolio with the “speed” factor earns a 4.3% p.a. return with an 11.7% p.a. volatility for the sample period, and the portfolio adjusted for the market regimes has a somewhat similar 13.8% p.a. volatility but results in an impressive 11.1% p.a. return over the same period. Interestingly, both the portfolio skewness and kurtosis are also improved in the momentum portfolio adjusted for market regimes.
Overall, the results provide strong evidence of the benefits of adding the market outlook and its volatility to the portfolio construction. Furthermore, it indicates that adjusting the momentum portfolio exposure based on economic regimes increases its return performance and improves its key risk characteristics (e.g., standard deviation, skewness, kurtosis).
Unfortunately, the current sample period (from January 2010 to December 2020) is relatively short. Performing an out-of-sample test would be difficult as part of the data would still have to be withheld for validation purposes. Instead, in order to check if the momentum portfolio performance is robust over time, we constructed a smaller futures portfolio including only 28 futures contracts for which a complete data period is available for a more extended sample period ranging from July 2003 to December 2020. The results are presented in Table A2 (Appendix B) and confirm that the performances of all estimated portfolios’ are consistent over this greater extended period and its corresponding market conditions.
We conclude that managed futures strategy’s (based on two momentum signals) performance is highly correlated with the economy’s state. Therefore, adjusting the strategy based on economic factors and/or volatility can significantly improve managed futures’ portfolio performance.
4.3. Portfolio Diversification
Finally, we analyze the benefits of adding a managed futures’ exposure to institutional investors’ portfolios. Several studies indicate that a long-term correlation between managed futures returns and traditional (i.e., equity and/or bond) investment portfolio returns is low or even negative. Therefore, institutional investors can potentially benefit from increased diversification benefits. This section wants to assess whether those benefits can be found by including our proposed managed futures momentum strategy in their portfolio. We use our estimated portfolio constructed on two “short-term” and “long-term” momentum factors (and adjusted for the economic regimes) as a proxy for an efficient momentum strategy. A “traditional” institutional portfolio is approximated by a 60% long position in the S&P 500 Index and a 40% short position in the Bloomberg Barclays US Aggregate Bond Index.
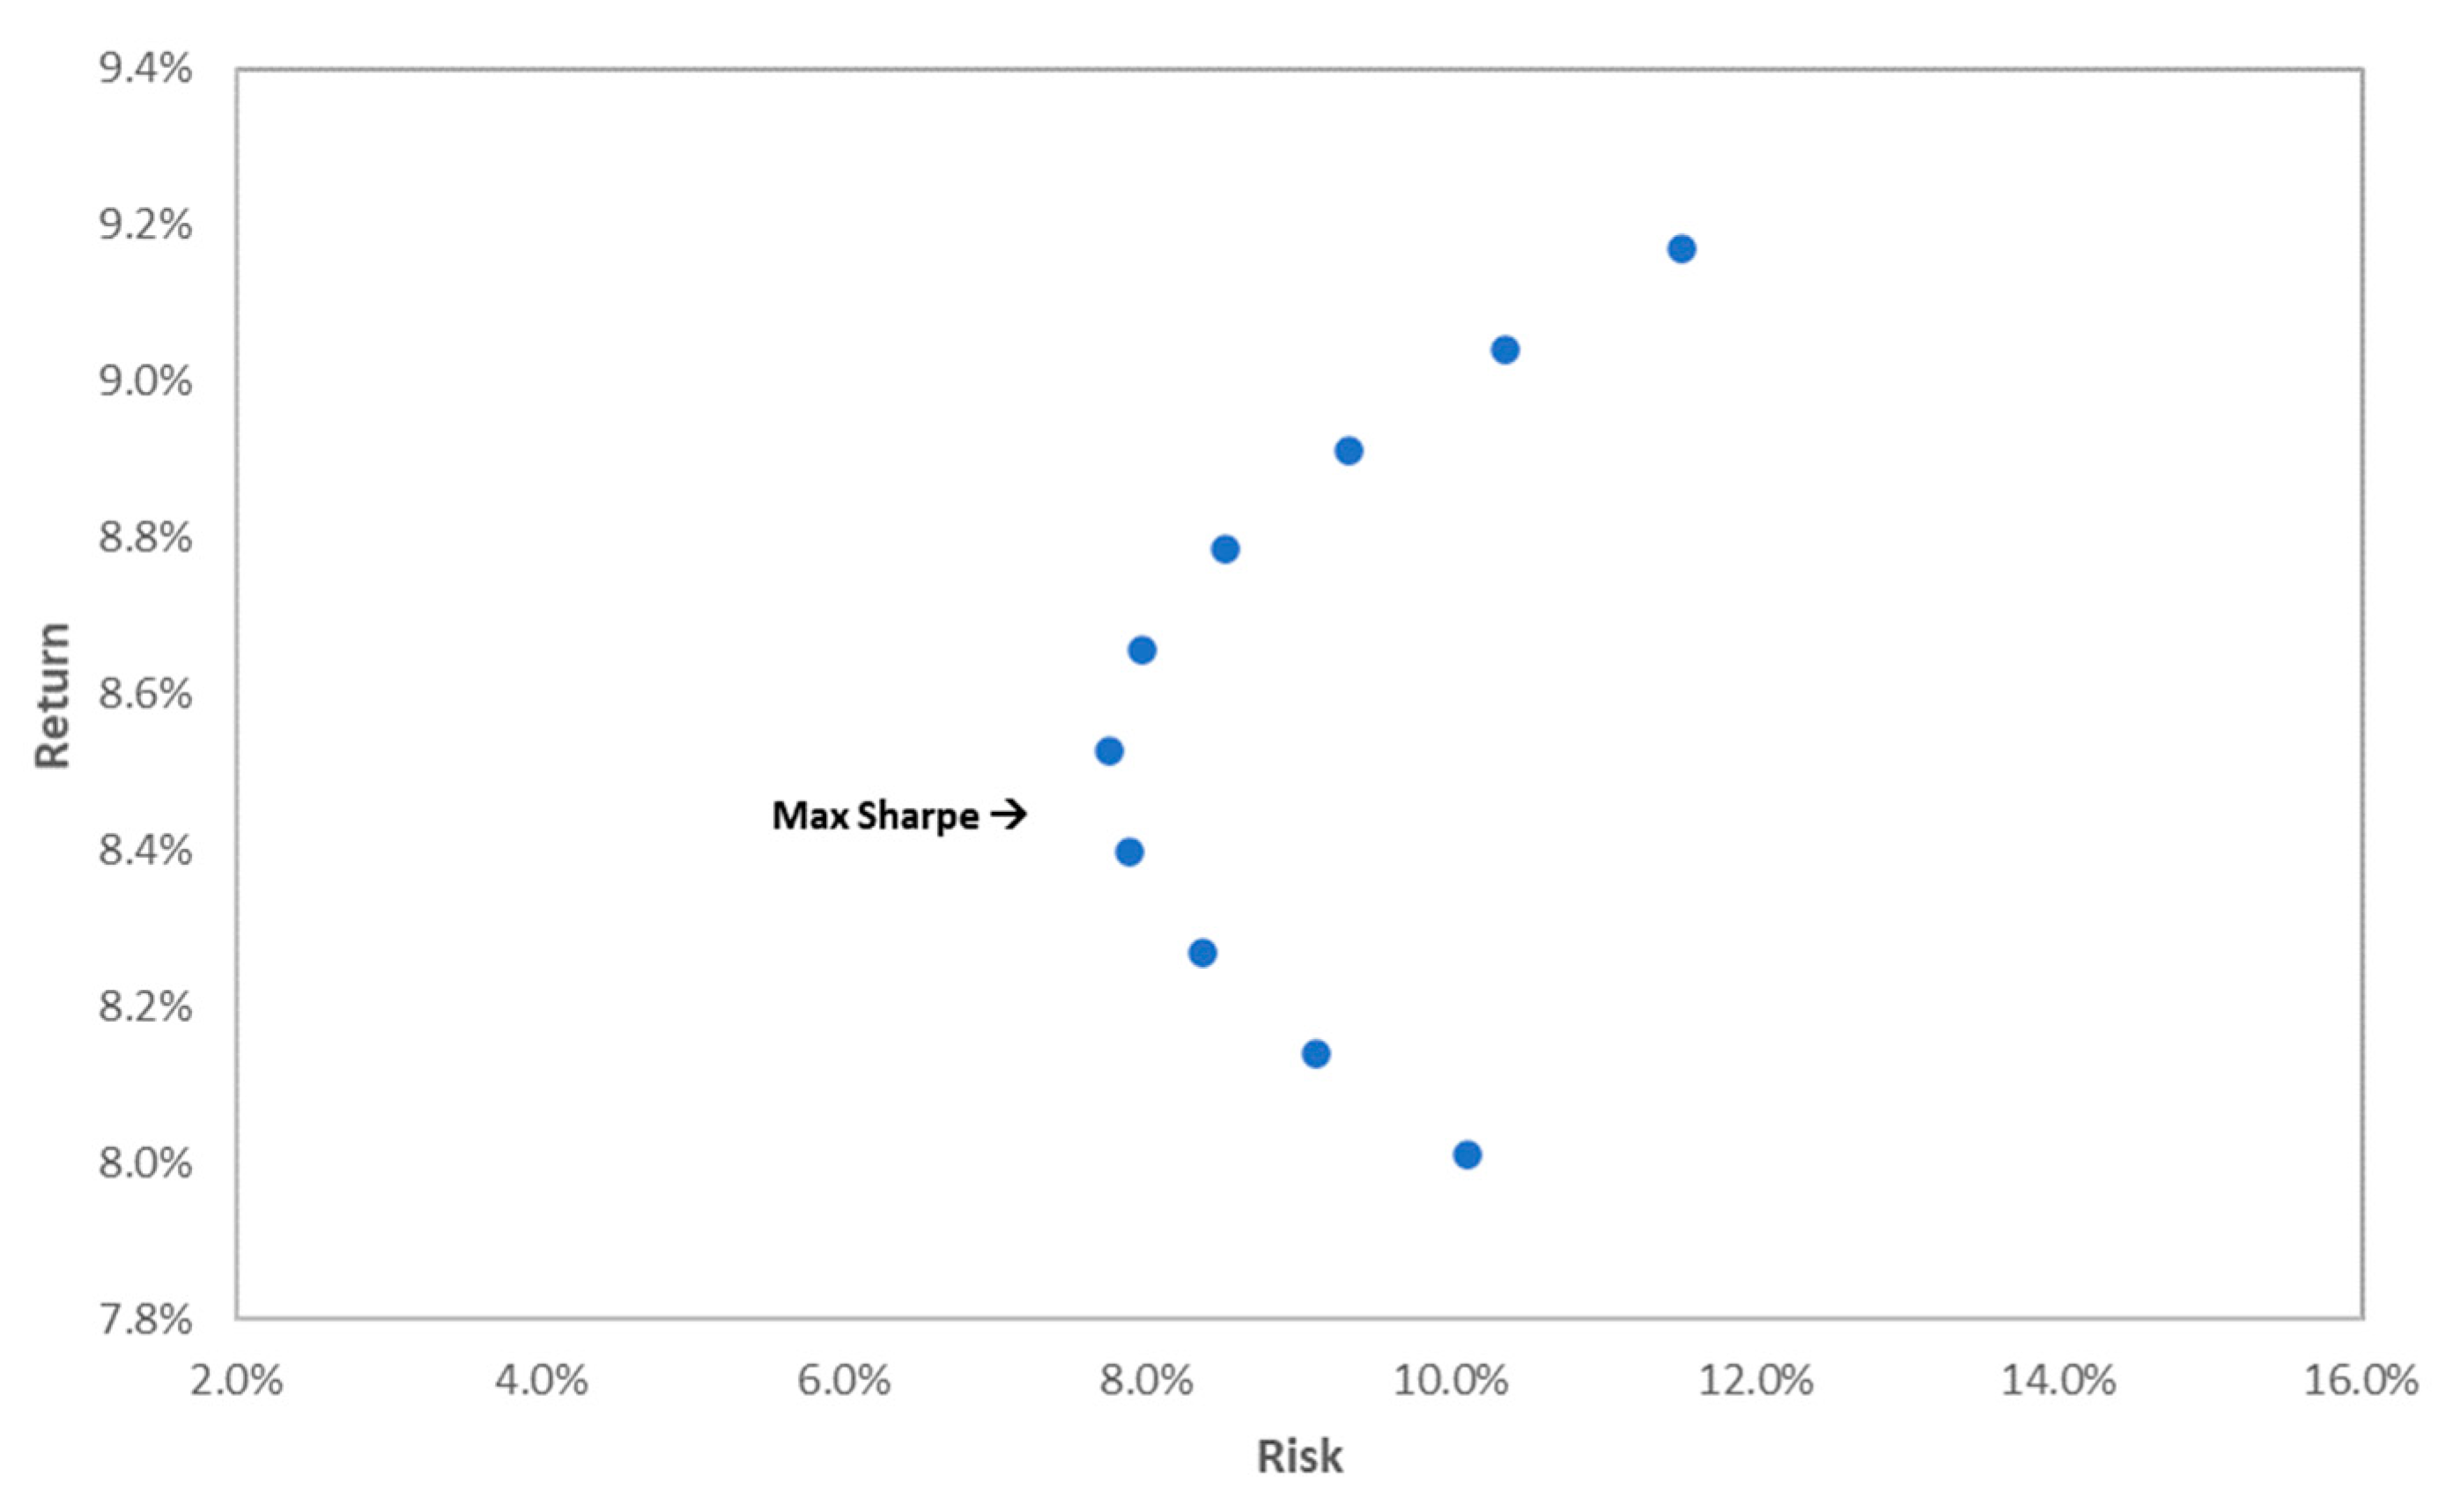
For the purpose of this analysis, we constructed some investment portfolios with 10% increasing allocations to a managed futures’ momentum exposure estimated based on the sample period ranging from January 2010 to December 2020. The analysis starts with the “traditional” portfolio as a benchmark case and adds 10% increments and a long-managed futures’ momentum exposure to the portfolio. The results for the constructed portfolios are presented in Figure 7 in an efficient frontier format. It shows that gradually increasing the allocations to momentum exposure has a positive effect on overall portfolio performance initially—it both increases total portfolio returns and decreases its standard deviations of returns.
In our sample, the maximum Sharpe ratio (1.101) is achieved for the portfolio with an approximately 40% allocation to the managed futures’ momentum strategy and 60% allocation to the traditional equity/bond portfolio. Then, more allocation to managed futures’ exposure starts increasing the overall portfolio volatility after this point. However, a pure “traditional” portfolio is still inferior to other investment opportunities, considering the existence of a diversified portfolio on the efficient frontier that has the same standard deviation as a “traditional” portfolio but offers significantly higher returns. The portfolios’ summary statistics with different allocation levels to the managed futures’ exposure are presented in Table A3 (Appendix C) for further comparison.
Overall, we found the results strongly favoring the diversified portfolio with a managed futures’ exposure. We also confirm that managed futures may hedge for extreme events by improving overall portfolio performance during those difficult times.
5. Conclusions
In this paper, we analyze the performance of the managed futures strategy based on momentum signal across different economic regimes, with a particular focus on the COVID-19 pandemic period as a natural experiment of increased uncertainty in the market. We offer a new approach to the momentum strategies because we confirm that using the momentum signals based on different lookback periods can help manage portfolio returns. Moreover, the managed futures momentum strategy is highly dynamic and could be primarily improved if broader macroeconomic variables were added to the analysis. We think that macroeconomic indicators can improve the strategic decision-making process and achieve a higher level of diversification.
Firstly, we used the time-series based on the ATSMOM (“adaptive time-series momentum”) factor for managed futures strategy with momentum effect. We compared the created strategy with the benchmark SG Trend Index and found a substantial correlation. Because of the transaction costs, the performance of the ATSMOM factor was slightly worse. Then, we tried to identify different lookback periods: 1–3 months, 3–6 months, 6–9 months, and 9–12 months. The results indicated that the 1–3 month and 9–12 month series were often little or even negatively correlated. Ther economic reasoning for this might be that the “long-term” series is more sensitive to the overall market’s general trend.
In contrast, the “short-term” series represented a correcting reversal to mean effect. In scientific literature, it is described as a short-term reversal effect due to investors’ overreaction, liquidity issues, institutional behavior, trading frictions, and/or transaction costs. We found this effect present in the futures market was contrary to a long-term momentum; a short-term momentum was negatively correlated with the overall market trend. To evaluate the significance this effect had on the momentum strategy’s performance, we constructed an alternative portfolio where the positions with “long-term” momentum were bought (long position). The ones with “short-term” momentum were sold (short position). We revealed that the momentum portfolio with the “speed” factor presents a better investment opportunity as it outperforms the ATSMOM portfolio during the sample period. It should be noted that the “speed” factor also outperformed the SG Trend Index by offering increased returns and the reduced standard deviation of returns.
Secondly, we extended the analysis by comparing the performance of both the “short-term” and “long-term” momentum series across the economic regimes. We found that the correlation between “short-term” and “long term” momentum series increased during periods of financial distress, as “short-term” momentum also started capturing a robust and prominent trend in the market. Despite the fact that the COVID-19 pandemic had a strong impact on financial markets, looking back, we could point out that the negative effects were concise. It gave a valuable insight into momentum strategies’ performance during such critical moments as the COVID-19 pandemic. We used a Markov regime-switching model to distinguish between the periods of high and low volatility in the equity market. We used our portfolio with the “speed” factor to incorporate the economic regime’s effects into our momentum strategy. We revealed that the momentum portfolio, adjusted for the economic regimes, outperformed an initial “speed” factor portfolio. Both portfolios performed relatively similarly during periods of low volatility, and the “volume-adjusted” momentum portfolio always outperformed the “speed” factor portfolio during high volatility periods. The results provided strong evidence of the benefits of adding the market outlook and its volatility to the portfolio construction. It indicates that adjusting the momentum portfolio exposure based on economic regimes increased its return performance and improved its key risk characteristics. We conclude that managed futures strategy’s performance is highly correlated with the economy’s state. Therefore, adjusting the strategy based on economic factors and/or volatility can significantly improve managed futures’ portfolio performance.
Finally, we analyzed the benefits of adding a managed futures’ exposure to institutional investors’ portfolios. We used our estimated portfolios constructed on two “short-term” and “long-term” momentum factors and adjusted for the economic regimes to proxy for an efficient momentum strategy. The results showed that gradually increasing the allocations to momentum exposure had a positive effect on overall portfolio performance initially—it both increases total portfolio returns and decreases its standard deviations of returns. Overall, we found the results strongly favored the diversified portfolio with a managed futures’ exposure. We also confirm that managed futures may hedge for extreme events by improving overall portfolio performance during those difficult times.
In summary, we confirm that the construction of a portfolio based on academically/economically sound momentum signals and its allocation timing based on broader economic factors and market volatility can significantly improve managed futures strategies and add significant diversification benefits to the investors’ portfolios. Some suggested avenues for future research might include using alternative momentum estimates, portfolio construction methods, economic regime factors, or using a more extended sample period to see if this model can still be further developed.
Author Contributions
Conceptualization, R.G. and D.T.; methodology, R.G.; software, R.G.; validation, R.G. and D.T.; formal analysis, R.G. and D.T.; investigation, R.G. and D.T.; resources, R.G. and D.T.; data curation, R.G.; writing—original draft preparation, R.G. and D.T.; writing—review and editing, R.G. and D.T.; visualization, R.G. and D.T.; supervision, D.T. All authors have read and agreed to the published version of the manuscript.
Funding
This research received no external funding.
Data Availability Statement
The data across futures markets is available from Tick Data LLC (www.tickdata.com, accessed date: 3 December 2020).
Conflicts of Interest
The authors declare no conflict of interest.
Appendix A

Table A1.
Futures contracts.
| Foreign Exchange | Equities | Fixed Income | Commodities |
|---|---|---|---|
| USD/AUD | E-mini Russell 2000 | BOBL | Soybean oil |
| USD/GBP | E-mini S&P 500 | BUND | Cocoa |
| USD/CAD | FTSE 100 | BUXL | Crude Oil WTI |
| Dollar Index | E-mini MidCap 400 | SCHATZ | Corn |
| EUR/USD | Nikkei 225 | DAX | Cotton |
| USD/JPY | E-mini NASDAQ 100 | Eurodollar | Feeder cattle |
| USD/MXN | Swiss Market | US 5-year | Gold |
| USD/NZD | DJ Euro Stoxx | US 2-year | Copper |
| EUR/CHF | E-mini Dow | US 10-year | Heating oil |
| E-mini EUR/USD | US Bond | Frozen orange juice | |
| Coffee | |||
| Lumber | |||
| Live cattle | |||
| Lean hogs | |||
| Natural gas | |||
| Oat | |||
| Palladium | |||
| Platinum | |||
| E-mini Crude oil | |||
| Sugar | |||
| Soybean meal | |||
| Silver | |||
| Soybeans | |||
| Wheat | |||
| RBOB |
Appendix B
Table A2.
Summary statistics for portfolios with momentum factors.
| Ratio | SG Trend Index | ATSMOM | Market Regime |
|---|---|---|---|
| Annualized Return | 3.2% | 3.8% | 5.6% |
| Annualized Std Deviation | 10.9% | 12.3% | 14.7% |
| Sharpe Ratio | 0.293 | 0.312 | 0.378 |
| Skewness | −0.603 | −0.199 | 0.040 |
| Kurtosis | 3.377 | 3.495 | 8369 |
| Maximum Drawdown | −22.9% | −25.7% | −40.5% |
28 futures contracts: USD/AUD, USD/GBP, USD/CAD, E-mini EUR/USD, USD/JPY, USD/MXN, EUR/CHF, E-mini S&P 500, E-mini NASDAQ 100, E-mini Dow, Euro-dollar, US 2-year, US 5-year, US 10-year, US Bond, Soybean oil, Crude Oil WTI, Corn, Gold, Copper, Heating oil, Natural gas, Palladium, E-mini Crude oil, Soybean meal, Silver, Soybeans, Wheat.
Sample period: from July 2003 to December 2020.
Appendix C
Table A3.
Summary statistics for portfolios with 10% increasing allocation to managed futures momentum strategy.
Table A3.
Summary statistics for portfolios with 10% increasing allocation to managed futures momentum strategy.
| Ratio | 100% Bond/Equity | 90% Bond/Equity + 10% Managed Futures | 80% Bond/Equity + 20% Managed Futures | 70% Bond/Equity + 30% Managed Futures | 60% Bond/Equity + 40% Managed Futures |
|---|---|---|---|---|---|
| Annualized Return | 8.0% | 8.1% | 8.3% | 8.4% | 8.5% |
| Annualized Std Deviation | 10.1% | 9.1% | 8.4% | 7.9% | 7.7% |
| Sharpe Ratio | 0.793 | 0.892 | 0.989 | 1.065 | 1.101 |
| Skewness | −0.743 | −0.628 | −0.531 | −0.476 | −0.453 |
| Kurtosis | 19.461 | 14.572 | 10.139 | 7.474 | 6.801 |
| Maximum Drawdown | −22.3% | −18.5% | −14.6% | −10.6% | −9.7% |
| Annualized Return | 8.7% | 8.8% | 8.9% | 9.0% | 9.2% |
| Annualized Std Deviation | 8.0% | 8.5% | 9.3% | 10.4% | 11.5% |
| Sharpe Ratio | 1.087 | 1.032 | 0.956 | 0.874 | 0.796 |
| Skewness | −0.411 | −0.308 | −0.151 | 0.026 | 0.196 |
| Kurtosis | 6.801 | 6.487 | 6.131 | 6.266 | 6.996 |
| Maximum Drawdown | −9.4% | −10.4% | −15.5% | −20.6% | −25.4% |
References
- Asness, Clifford Scott, Tobias Jacob Moskowitz, and Lasse Heje Pedersen. 2013. Value and momentum everywhere. The Journal of Finance 68: 929–85. [Google Scholar] [CrossRef] [Green Version]
- Bakshi, Gurdip, Xiaohui Gao, and Alberto Rossi. 2019. Understanding the Sources of Risk Underlying the Cross-Section of Commodity Returns. Management Science 65: 619–41. [Google Scholar] [CrossRef] [Green Version]
- Baltas, Akindynos-Nikolaos, and Robert Kosowski. 2012. Improving Time-Series Momentum Strategies: The Role of Trading Signals and Volatility Estimators. Washington, DC: SSRN eLibrary. [Google Scholar]
- Barroso, Perdro, and Pedro Santa-Clara. 2012. Managing the Risk of Momentum. SSRN Electronic Journal, 1–26. [Google Scholar] [CrossRef]
- Baz, Jamil, Nicolas Granger, Campbell Russell Harvey, Nicolas Le Roux, and Sandy Rattray. 2015. Dissecting Investment Strategies in the Cross Section and Time Series. SSRN Electronic Journal, 1–31. [Google Scholar] [CrossRef]
- Bender, Jennifer, Remy Briand, Dmitris Melas, and Ramanathan Subramanian. 2013. Foundations of Factor Investing. MSCI Index Research, 1–33. [Google Scholar] [CrossRef] [Green Version]
- Campbell, John Young. 2004. Understanding momentum. Financial Analysts Journal 140: 726–43. [Google Scholar] [CrossRef]
- Chabot, Benjamin, Eric Ghysels, and Ravi Jagannathan. 2008. Price Momentum in Stocks: Insights from Victorian Age Data. NBER Working Paper Series, November (No. 14500). Cambridge: National Bureau of Economic Research, pp. 1–50. [Google Scholar]
- Chabot, Benjamin, Eric Ghysels, and Ravi Jagannathan. 2014. Momentum Trading, Return Chasing, and Predictable Crashes. NBER Working Paper Series, November 1–45. Cambridge: National Bureau of Economic Research. [Google Scholar]
- Elaut, Gert, and Péter Erdős. 2019. Trends’ signal strength and the performance of CTAs. Financial Analysts Journal 75: 64–83. [Google Scholar] [CrossRef]
- Elias, Siti Masita, Nur Nabilah Hanis Nur Azmi, and Karmila Hanim Kamil. 2014. Industry Momentum Strategy in Malaysian Stock Market. International Journal of Business and Social Science 5: 194–202. [Google Scholar]
- Erb, Claude, and Campbell Russell Harvey. 2006. The strategic and tactical value of commodity futures. Financial Analysts Journal 62: 69–97. [Google Scholar] [CrossRef]
- Feldman, Barry, and Hilary Till. 2006. Backwardation and Commodity Futures Performance: Evidence from Evolving Agricultural Markets. The Journal of Alternative Investments 9: 24–39. [Google Scholar] [CrossRef]
- Fernández-Pérez, Adrian, Bart Frijns, Ana-Maria Fuertes, and Joëlle Miffre. 2015. Commodities as Lotteries: Skewness and the Returns of Commodity Futures. Unpublished Working Paper. Nice: EDHEC Business School. [Google Scholar]
- Foltice, Bryan, and Thomas Langer. 2015. Profitable momentum trading strategies for individual investors. Scholarship and Professional Work—Business 29: 1–32. [Google Scholar] [CrossRef] [Green Version]
- Fong, Wai Mun, Wing-Keung Wong, and Hooi Hooi Lean. 2005. International momentum strategies: A stochastic dominance approach. Journal of Financial Markets 8: 89–109. [Google Scholar] [CrossRef] [Green Version]
- Frazzini, Andrea, and Lasse Heje Pedersen. 2014. Betting against beta. Journal of Financial Economics 111: 1–25. [Google Scholar] [CrossRef] [Green Version]
- Fuertes, Ana-Maria, Joëlle Miffre, and Georgios Rallis. 2010. Tactical allocation in commodity futures markets: Combining momentum and term structure signals. Journal of Banking & Finance 34: 2530–48. [Google Scholar]
- Gorton, Gary, and Geert Rouwenhorst. 2006. Facts and fantasies about commodity futures. Financial Analysts Journal 62: 47–68. [Google Scholar] [CrossRef] [Green Version]
- Gorton, Gary, Fumio Hayashi, and Geert Rouwenhorst. 2013. The Fundamentals of Commodity Futures Returns. Review of Finance, European Finance Association 17: 35–105. [Google Scholar] [CrossRef]
- Hong, Harrison, and Jeremy Stein. 1998. A Unified Theory of Underreaction, Momentum Trading and Overreaction in Asset Markets. The Journal of Finance 2: 1–65. [Google Scholar]
- Hong, Harrison, and Motohiro Yogo. 2012. What does futures market interest tell us about the macroeconomy and asset prices? Journal of Financial Economics 105: 473–90. [Google Scholar] [CrossRef] [Green Version]
- Hurst, Brian, Yao Hua Ooi, and Lasse Heje Pedersen. 2014. A century of evidence on trend-following investing. AQR Capital Management 44: 1–16. [Google Scholar] [CrossRef]
- Jensen, Gerald, Robert Johnson, and Jeffrey Mercer. 2000. Efficient use of commodity futures in diversified portfolios. Journal of Futures Markets: Futures, Options, and Other Derivative Products 20: 489–506. [Google Scholar] [CrossRef]
- Kaminski, Kathryn. 2016. In a Search of Crisis Alpha: A Short Guide Investing in Manages Futures. White Paper Series. Chicago: CME Group. [Google Scholar]
- Keynes, John Maynard. 1930. Treatise on Money: Pure Theory of Money. Whitefish: Kessinger Publishing, vol. I. [Google Scholar]
- Koijen, Ralph, Tobias Jacob Moskowitz, Lasse Heje Pedersen, and Evert Vrugt. 2018. Carry. Journal of Financial Economics 127: 197–225. [Google Scholar] [CrossRef] [Green Version]
- Krauss, Christopher, Daniel Beerstecher, and Tom Krüger. 2015. Feasible Earnings Momentum in the U.S. Stock Market: An Investor’s Perspective. IWQW Discussion Papers. Available online: https://www.econstor.eu/handle/10419/121237 (accessed on 28 May 2021).
- Lintner, John Virgil. 1996. The Potential Role of Managed Commodity-Financial Futures Accounts (and/or Funds) in Portfolios of Stocks and Bonds. In Handbook of Managed Futures: Performance, Evaluation & Analysis. New York: McGrawHill Professional, pp. 99–137. [Google Scholar]
- Martin, Richard. 2021. Design and aalysis of momentum trading strategies. arXiv arXiv:2101.01006. [Google Scholar]
- Martins, João, Vitorino Martins, and Elísio Brandao. 2016. Momentum: Strategies, Size, and Risk Factor. FEP Working Papers, 585. Porto: Universidade do Porto, pp. 1–40. [Google Scholar]
- Menkhoff, Lucas, Lucio Sarno, Maik Schmeling, and Andeas Schrimpf. 2012. Currency momentum strategies. Journal of Financial Economics 106: 1–87. [Google Scholar] [CrossRef] [Green Version]
- Miffre, Joëlle, Ana-Maria Fuertes, and Adrian Fernandez-Perez. 2015. Commodity futures returns and idiosyncratic volatility. The Journal of Futures Markets 35: 74–297. [Google Scholar]
- Miffre, Joëlle, and Georgios Rallis. 2007. Momentum strategies in commodity futures markets. Journal of Banking & Finance 31: 1863–86. [Google Scholar]
- Moskowitz, Tobias Jacob, Yao Hua Ooi, and Lasse Heje Pedersen. 2012. Time series momentum. Journal of Financial Economics 104: 228–50. [Google Scholar] [CrossRef] [Green Version]
- Perlin, Marcelo. 2015. MS_Regress-the MATLAB Package for Markov Regime Switching Models. Available online: https://papers.ssrn.com/sol3/papers.cfm?abstract_id=1714016 (accessed on 12 March 2020).
- Poh, Daniel, Bryan Lim, Stefan Zohren, and Stephen Roberts. 2020. Building Cross-Sectional Systematic Strategies By Learning to Rank. The Journal of Financial Data Science 3: 70–86. [Google Scholar] [CrossRef]
- Roncalli, Thierry. 2017. Keep up the momentum. Journal of Asset Management 19: 351–96. [Google Scholar] [CrossRef]
- Routledge, Bryan, Duane Seppi, and Chester Spatt. 2000. Equilibrium forward curves for commodities. Journal of Finance 55: 1297–338. [Google Scholar] [CrossRef] [Green Version]
- Sakkas, Athanasios, and Nikolaos Tessaromatis. 2020. Factor-based commodity investing. Journal of Banking & Finance 115: 105807. [Google Scholar]
- Sanders, Dwight, and Scott Irwin. 2012. A Reappraisal of Investing in Commodity Futures Markets. Applied Economic Perspectives and Policy 34: 515–30. [Google Scholar] [CrossRef]
- Shen, Qian, Andrew Szakmary, and Subhash Sharma. 2007. It An examination of momentum strategies in commodity futures markets. Journal of Futures Markets: Futures, Options, and Other Derivative Products 27: 227–56. [Google Scholar] [CrossRef]
- Szakmary, Andrew, Qian Shen, and Subhash Sharma. 2010. Trend-following trading strategies in commodity futures: A re-examination. Journal of Banking & Finance 34: 409–26. [Google Scholar]
- Szymanowska, Marta, Frans De Roon, Theo Nijman, and Rob Van Den Goorbergh. 2014. An anatomy of commodity futures risk premia. The Journal of Finance 69: 453–82. [Google Scholar] [CrossRef]
- Tauseef, Sana, and Mohammad Nishat. 2018. Can Investors Benefit from Momentum Trading? Evidence from an Emerging Market. Business Review 13: 21–36. [Google Scholar] [CrossRef]
- Till, Hilary. 2016. What Are the Sources of Return for CTAs and Commodity Indexes? A Brief Survey of Relevant Research. Journal of Wealth Management 18: 108–23. [Google Scholar] [CrossRef] [Green Version]
- Vogel, Jack, and Wesley Gray. 2015. Our Quantitative Momentum Philosophy: Buy Stocks with the Highest Quality Momentum. Hoboken: John Wiley & Sons. [Google Scholar]
- Yu, Hsin-Yi, and Li-Wen Chen. 2012. Momentum—Reversal Strategy. Available online: https://www.semanticscholar.org/paper/Momentum-%E2%80%93-Reversal-Strategy-Yu-Chen/eab31ddf144f32da15d68082a7d2329115d9ea89?p2df (accessed on 28 May 2021).
- Zaremba, Adam, Huaigang Long, and Andreas Karathanasopoulos. 2019. Short-term momentum (almost) everywhere. Journal of International Financial Markets, Institutions and Money 63: 101140. [Google Scholar] [CrossRef]
Figure 1.
The performance of SG Trend Index and ATSMOM factor daily time-series.

Figure 2.
The performance of ATSMOM factor with 1–3 month, 3–6 month, 6–9 month, 9–12 month lookback periods.
Figure 2.
The performance of ATSMOM factor with 1–3 month, 3–6 month, 6–9 month, 9–12 month lookback periods.

Figure 3.
The performance of portfolios with ATSMOM and “speed” factors.

Figure 4.
The performance of ATSMOM factor with 1–3 month, 3–6 month, 6–9 month, 9–12 month lookback periods during the COVID-19 crisis.
Figure 4.
The performance of ATSMOM factor with 1–3 month, 3–6 month, 6–9 month, 9–12 month lookback periods during the COVID-19 crisis.

Figure 5.
Time evolution of market regime indicators and recession periods.

Figure 6.
The performance of the portfolio with “speed” factor adjusted for economic regimes.

Figure 7.
Impact of adding managed futures’ momentum strategy exposure to an equity/bond portfolio in 10% increments.
Figure 7.
Impact of adding managed futures’ momentum strategy exposure to an equity/bond portfolio in 10% increments.

Table 1.
Summary statistics for portfolios with momentum factors.
| Ratio | SG Trend Index | ATSMOM | “Speed” Factor |
|---|---|---|---|
| Annualized Return | 1.4% | 0.3% | 4.3% |
| Annualized Std Deviation | 10.5% | 10.3% | 11.7% |
| Sharpe Ratio | 0.129 | 0.027 | 0.363 |
| Skewness | −0.674 | −0.432 | −0.285 |
| Kurtosis | 3.130 | 3.661 | 4.783 |
| Maximum Drawdown | −23.0% | −22.9% | −25.4% |
Table 2.
Summary statistics for momentum factor portfolios adjusted for economic regimes.
| Ratio | SG Trend Index | “Speed” Factor | Market Regime |
|---|---|---|---|
| Annualized Return | 1.4% | 4.3% | 11.1% |
| Annualized Std Deviation | 10.5% | 11.7% | 13.8% |
| Sharpe Ratio | 0.129 | 0.363 | 0.805 |
| Skewness | −0.674 | −0.285 | −0.072 |
| Kurtosis | 3.130 | 4.783 | 2.807 |
| Maximum Drawdown | −23.0% | −25.4% | −24.4% |
Publisher’s Note: MDPI stays neutral with regard to jurisdictional claims in published maps and institutional affiliations. |
© 2021 by the authors. Licensee MDPI, Basel, Switzerland. This article is an open access article distributed under the terms and conditions of the Creative Commons Attribution (CC BY) license (https://creativecommons.org/licenses/by/4.0/).
Share and Cite
MDPI and ACS Style
Guobužaitė, R.; Teresienė, D. Can Economic Factors Improve Momentum Trading Strategies? The Case of Managed Futures during the COVID-19 Pandemic. Economies 2021, 9, 86. https://doi.org/10.3390/economies9020086
AMA Style
Guobužaitė R, Teresienė D. Can Economic Factors Improve Momentum Trading Strategies? The Case of Managed Futures during the COVID-19 Pandemic. Economies. 2021; 9(2):86. https://doi.org/10.3390/economies9020086
Chicago/Turabian StyleGuobužaitė, Renata, and Deimantė Teresienė. 2021. "Can Economic Factors Improve Momentum Trading Strategies? The Case of Managed Futures during the COVID-19 Pandemic" Economies 9, no. 2: 86. https://doi.org/10.3390/economies9020086
Note that from the first issue of 2016, this journal uses article numbers instead of page numbers. See further details here.