


INTRODUCTION
Mental disorders are the leading cause of morbidity, affecting about a third of the European population (Wittchen et al., Reference Wittchen, Jacobi, Rehm, Gustavsson, Svensson, Jönsson and Steinhausen2011). Their associated costs were estimated at €800 billion in 2010 in Europe alone, by far exceeding the total costs of cancer and heart disease (Gustavsson et al., Reference Gustavsson, Svensson, Jacobi, Allgulander, Alonso, Beghi and Olesen2011). The two most burdensome of these disorders are depression, with 264 million sufferers globally (James et al., Reference James, Abate, Abate, Abay, Abbafati, Abbasi and Collaborators2018), and dementia which, due to the ageing of populations, grows by about 10 million people globally every year (WHO, 2019). Clearly, the management of these disorders should be the top priority to healthcare globally.
Cognitive impairment is a key element in most mental disorders, including neurodegenerative disorders (Aarsland et al., Reference Aarsland, Creese, Politis, Chaudhuri, Ffytche, Weintraub and Ballard2017; Carter et al., Reference Carter, Caine, Burns, Herholz and Ralph2012; Grzegorski & Losy, Reference Grzegorski and Losy2017), mood disorders (Grossi et al., Reference Grossi, Perski, Osika and Savic2015; Hammar & Årdal, Reference Hammar and Årdal2009) and psychiatric disorders (Menkes et al., Reference Menkes, Armstrong, Blackford, Heckers and Woodward2019; Yehuda et al., Reference Yehuda, Tischler, Golier, Grossman, Brand, Kaufman and Harvey2006). Comprehensive cognitive screenings are, however, uncommon with suspected mental disorders (Iracleous et al., Reference Iracleous, Nie, Tracy, Moineddin, Ismail, Shulman and Upshur2010; Socialstyrelsen, 2017, 2018) even though they can lead to a multitude of benefits. Cognitive testing can assist faster diagnosis (Woolley et al., Reference Woolley, Khan, Murthy, Miller and Rankin2011; Zucchella et al., Reference Zucchella, Federico, Martini, Tinazzi, Bartolo and Tamburin2018) and better-adjusted care (Withall et al., Reference Withall, Harris and Cumming2009; Zuckerman et al., Reference Zuckerman, Pan, Park, Brietzke, Musial, Shariq and McIntyre2018). In some cases, it can contribute to predicting progression to amnestic MCI (Gustavson et al., Reference Gustavson, Elman, Sanderson-Cimino, Franz, Panizzon, Jak and Kremen2020). Finally, repeated testing can support evaluation of treatment and recovery by providing an objective measurement (Levey et al., Reference Levey, Lah, Goldstein, Steenland and Bliwise2006; Schmid & Hammar, Reference Schmid and Hammar2013; Solé et al., Reference Solé, Jiménez, Torrent, Reinares, Bonnin, Torres and Vieta2017).
Primary care is the first point of contact for patients (WHO, 2018, p. 13). As such, it is advisable that one offers a first assessment of cognitive impairment already in this setting to identify patients for efficient management and referral and to relieve the burden on specialist care (Hlávka et al., Reference Hlávka, Mattke and Liu2018). According to primary care physicians, the cognitive screening instrument that could accomplish this should be quick and easy to administer but also be comprehensive and sensitive to detect subtle cognitive impairments (Iracleous et al., Reference Iracleous, Nie, Tracy, Moineddin, Ismail, Shulman and Upshur2010).
As such, digitised cognitive tests can offer great improvements in the detection of cognitive impairment in primary care (Sabbagh, Boada, Borson, Chilukuri, et al., Reference Sabbagh, Boada, Borson, Chilukuri, Doraiswamy, Dubois and Hampel2020). With patient self-administration and automated scoring of results, already validated tests can be used more efficiently, at a larger scale and relatively low cost (Bauer et al., Reference Bauer, Iverson, Cernich, Binder, Ruff and Naugle2012; Miller & Barr, Reference Miller and Barr2017; Sabbagh, Boada, Borson, Doraiswamy, et al., Reference Sabbagh, Boada, Borson, Doraiswamy, Dubois, Ingram and Hampel2020; Tierney & Lermer, Reference Tierney and Lermer2010). Furthermore, the recent COVID-19 pandemic has highlighted the importance of digital healthcare (Keesara et al., Reference Keesara, Jonas and Schulman2020), not least in mental care since COVID-19 has created a new group of patients with suspected cognitive impairment (Troyer et al., Reference Troyer, Kohn and Hong2020).
Mindmore is a comprehensive cognitive screening battery designed for primary care. The battery currently includes 14 traditional cognitive tests (Lezak et al., Reference Lezak, Howieson, Bigler and Tranel2012), digitised and adapted for self-administration. Together these tests cover five cognitive domains: attention and processing speed, memory, language, visuospatial functions and executive functions. The concordance of the digital and analogue versions has been demonstrated in a previous study with 81 Swedish adults aged 21 to 85 years (Björngrim et al., Reference Björngrim, Van den Hurk, Betancort, Machado and Lindau2019). The tests were administered in both versions, counterbalanced and with a 4-week interval. The test versions showed moderate to high correlations for all tests, statistical score equivalence for all but one of the tests (Lakens, Reference Lakens2017), and test results of both versions were similarly affected by age. However, when translating cognitive tests to a new medium some changes to the results are unavoidable (Bauer et al., Reference Bauer, Iverson, Cernich, Binder, Ruff and Naugle2012; Germine et al., Reference Germine, Reinecke and Chaytor2019). Thus, Mindmore-specific normative data were deemed necessary to aid clinicians in interpreting their patients’ test results.
The current study aims to provide regression-based normative data for the adult Swedish population for each of the tests included in Mindmore. Data were collected in a controlled laboratory environment. The method of regression-based normative data is much preferred over traditional discrete normative data because it solves the problems of arbitrary age bands, varying sample sizes per normative group (Knight et al., Reference Knight, McMahon, Green and Skeaff2006), and substantially decreases the amount of data required for accurate norms (Oosterhuis et al., Reference Oosterhuis, van der Ark and Sijtsma2016). The hypothesised influence on test results of the demographic variables age (Cohen et al., Reference Cohen, Marsiske, Smith, DeKosky and Asthana2019), educational attainment (Ritchie et al., Reference Ritchie, Bates and Deary2015) and sex (Miller & Halpern, Reference Miller and Halpern2014) were investigated.
METHODS
Study Design
A cross-sectional normative study was conducted, administering Mindmore to healthy volunteers. The study ran from June 2018 to February 2020. Testing took place in Stockholm and Uppsala, Sweden. All participants were previously unfamiliar with Mindmore and were unaware of the tasks that would be asked of them in the tests. Testing included an interview on current health status and medical history, a short cognitive screening test, and the Mindmore screening battery. Participants did not receive any financial remuneration for participating but were provided with a summary of their results at the end of the study. All participants received written information on the study prior to testing and signed informed consent. The study was approved by the Regional Ethics Review Board in Stockholm (issue number 2019-02030).
Participants
Individuals living in the community aged 17 years and above were invited to the study. The study was advertised on a specialized website for research participant recruitment (StudentKaninen.se, 2020), in targeted social media posts, with posters on public message boards, during pensioners’ association meetings and by word of mouth. Recruitment was monitored to represent the full adult Swedish population (Statistiska centralbyrån, 2018a, 2018b) in terms of age, education and sex.
Exclusion criteria for the present study consisted of (1) a non-fluent level of Swedish; (2) previous experience of any of the Mindmore tests and; (3) impaired cognitive functioning as assessed by one of two short cognitive screening tests: three or more errors on the Short Portable Mental State Questionnaire (SPMSQ; Pfeiffer, Reference Pfeiffer1975; Svedjebrant & Lindmark, Reference Svedjebrant and Lindmark2011) or a score of below 25 on the Mini-Mental State Examination (MMSE; Folstein, Folstein, & McHugh, Reference Folstein, Folstein and McHugh1975); (4) an active central nervous system disease or psychiatric condition and; (5) prior history of disorders that could potentially affect cognition (e.g., evident stroke, significant head trauma, recent or current substance abuse). Treated chronic medical problems (e.g., diabetes, hypertension, cardiac problems) were not an exclusion criterion. Each participant completed a medical interview (Supplementary Figure S1). The test leader went over the interview answers, requesting further details (e.g. duration, type and dose of medication).
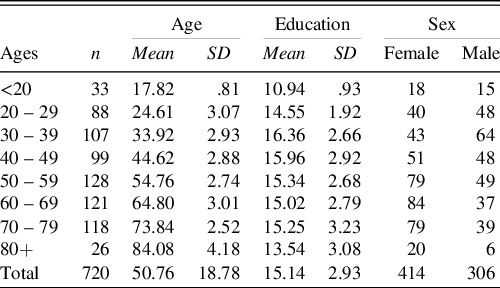
From the initial sample of 762 participants, 37 participants were excluded after the medical interview, three were excluded because they made too many errors on the SPMSQ screening test and two were excluded due to technical issues. The final sample included 720 participants (414 women and 306 men) and had an age range from 17 to 93 with a mean of 50.8 (SD 18.8). Their level of education ranged from 7 to 26 years of schooling with a mean of 15.1 (SD 2.9) years (Table 1). The results of the short cognitive screening tests, which were administered to 97% of the final sample, were as follows: the SPMSQ (n = 652) ranged from 0 to 2 with a mean of .6 (SD .7); and the results of MMSE (n = 47) ranged from 27 to 30 with a mean of 28.9 (SD .9). The remaining 21 participants, aged 17 or 18 years and full-time high school students, were exempt from the short cognitive screening tests. Participants were all from the Swedish population (93% were Swedish natives, the remainder was at least fluent in Swedish).
Table 1. Demographics of the final sample
Battery Design
The Mindmore screening battery was designed to provide a comprehensive measure of cognitive functioning for the assessment of any patient with suspected cognitive impairment. The available literature on cognitive testing varies in terms of considered domains and how they are grouped (Lezak et al., Reference Lezak, Howieson, Bigler and Tranel2012; Sachdev et al., Reference Sachdev, Blacker, Blazer, Ganguli, Jeste, Paulsen and Petersen2014). We identified five domains which in our experience are common in clinical neuropsychology practice and supported by renowned international institutions and expert groups (American Psychiatric Association, 1994; Grzegorski & Losy, Reference Grzegorski and Losy2017; Nasreddine et al., Reference Nasreddine, Phillips, Bédirian, Charbonneau, Whitehead, Collin, Cummings and Chertkow2005). These constitute attention and processing speed, memory, language, visuospatial functions and executive functions.
A total of 14 digitised traditional tests are included in the Mindmore application. These are tests clinically accepted in Europe (Maruta et al., Reference Maruta, Guerreiro, De Mendonça, Hort and Scheltens2011), with proven validity and reliability (Lezak et al., Reference Lezak, Howieson, Bigler and Tranel2012), and possible to digitise while retaining correspondence with the traditional test instructions and stimuli (Björngrim et al., Reference Björngrim, Van den Hurk, Betancort, Machado and Lindau2019).
Attention and processing speed were assessed using the Trail Making Test (TMT; Army Individual Test battery, 1944) part A to measure mental speed; the Symbol Digit Modalities Test (SDMT; Smith, Reference Smith1982) to measure visual scanning; and an in-house test of simple reaction time (Simple RT Test; Mindmore screening battery, 2020).
Memory was assessed using a 15-word auditory learning test (Rey Auditory Verbal Learning Test; RAVLT; Rey, Reference Rey1964; Schmidt, Reference Schmidt1996) with five learning trials, short-term recall of the 15 words after a distraction list, long-term recall of the 15 words after 20 minutes and finally recognition of the 15 words among 15 distractors; a 10-word auditory and visual learning test (CERAD Word List Learning Test; Morris et al., Reference Morris, Heyman, Mohs, Hughes, van Belle, Fillenbaum, Mellits and Clark1989) with three learning trials, recall of the 10 words after five minutes and finally recognition of the 10 words among 10 distractors; and a spatial memory test (Corsi, Reference Corsi1972; Milner, Reference Milner1971).
Language was assessed using the Token Test (Boller & Vignolo, Reference Boller and Vignolo1966; De Renzi & Vignolo, Reference De Renzi and Vignolo1962) to measure auditory comprehension; the Boston Naming Test (BNT) – 15 words (Jørgensen et al., Reference Jørgensen, Johannsen and Vogel2017; Kaplan et al., Reference Kaplan, Goodglass and Weintraub1983); and the FAS Word Fluency Test (Benton et al., Reference Benton, Hamsher and Sivan1989).
Visuospatial functions were assessed using the Cube Drawing Test (Necker, Reference Necker1832); and the Clock Drawing Test (Critchley, Reference Critchley1953; Shulman et al., Reference Shulman, Shedletsky and Silver1986).
Executive functions were assessed using the TMT part B to measure mental flexibility; an in-house test of complex reaction time (Complex RT Test; Mindmore screening battery, 2020), the Paced Auditory Serial Addition Test (PASAT; Gronwall, Reference Gronwall1977; Gronwall & Sampson, Reference Gronwall and Sampson1974) to measure information processing; a silent Stroop Test (Strauss, Sherman, & Spreen, Reference Strauss, Sherman and Spreen2006; Stroop, Reference Stroop1935) to measure concentration effectiveness; and the Tower of Hanoi Test (Lucas, Reference Lucas1883) to measure the ability to plan ahead.
Where possible, performance index scores were calculated taking both accuracy and speed into account, so called “throughput measures” (Thorne, Reference Thorne2006). Such index scores were calculated for the following tests: TMT part A and B [correct connections/time to completion], Simple RT Test [correct responses/reaction time], Complex RT Test [(correct responses – inhibition errors)/reaction time], Stroop Test impulse control [correct responses CW/reaction time CW], where CW stands for conflicting (and W for non-conflicting) colour of the ink and the word, and Tower of Hanoi [correct solution/time to completion]. In addition, index scores were calculated for RAVLT recognition [hits – false alarms], CERAD recognition [hits – false alarms] and for Stroop Test inhibition [reaction time CW − reaction time W]. The 14 tests in the Mindmore battery resulted in 42 test result measures, including the index scores and detailed scores on accuracy and speed.
Procedure
Participants were administered the Mindmore battery via a digital touch screen tablet of 12.3 inches. The battery consisted of a selection of the 14 tests. Participants who indicated they were colour blind were exempt from the Stroop Test, Simple and Complex RT Tests and the Token Test. The RAVLT, CERAD, BNT and FAS Test were only administered to native Swedish speakers. Participants over 75 years old were exempt from the Simple- and Complex RT Tests, PASAT and Tower of Hanoi. Not every test was available from the start of the study; RAVLT and CERAD cannot be included in the same assessment.
Scoring was fully automated except for CERAD, FAS Test, Cube Drawing Test and Clock Drawing Test. Speech data on RAVLT, CERAD, BNT and FAS Test were processed through Google speech recognition software (Google Cloud Speech-to-Text, 2020). The automated corrections were validated manually for CERAD and FAS Test by comparing the speech recordings to the automated results. The Cube and Clock Drawing Tests resulted in images that were manually scored similarly to common clinical practice (e.g. Nasreddine et al., Reference Nasreddine, Phillips, Bédirian, Charbonneau, Whitehead, Collin, Cummings and Chertkow2005). That is, as 0 = not correct and 1 = correct, where .5 points each were given for correct numbers and correct hands on the Clock.
Testing took place in a quiet room free of distractions. A trained test leader conducted the medical interview and short screening test (MMSE or SPMSQ) with the participant after which the participant was left alone in the room to complete the Mindmore screening battery (approx. 45 min). Participants who indicated that they were unfamiliar with the use of a touch screen were given the option of supervised testing in which the test leader stayed in the room and gave minimal advice on tablet use during instructions and practice trials. The test protocol ran automatically, allowing the participant to continue to the next test when the previous test was finished. Each test consisted of an introduction both in audio and visualized on-screen, when applicable an interactive practice trial, and the test trial. Instructions could be repeated on demand. The participant received feedback during practice trials and, with multiple unsuccessful practice attempts, the specific test was cancelled and the test protocol continued to the next test.
Data Analysis
Multiple linear regression models were fitted on the data. The forward–backward stepwise predictor selection was employed with the Bayesian information criterion (BIC) selection criterion, as proposed by Chowdhury and Turin (Reference Chowdhury and Turin2020). The initial models contained all candidate lower-order predictors to be primarily considered for exclusion, the candidate higher-order predictors were outside the model and primarily considered for inclusion.
The candidate lower-order predictors were age, years of education and sex. The candidate higher-order predictors were the quadratic term for age and two theory-driven interactions. The interaction age x years of education was included to capture potential effects of cognitive reserve (Stern, Reference Stern2002). The theoretical concept of cognitive reserve accounts for the discrepancy, correlated to the level of education, between detected brain deterioration and task performance observed in some individuals and not in others (Stern & Barulli, Reference Stern, Barulli, DeKosky and Asthanan2019). The second interaction, age x sex, was included to capture a potential specific younger male advantage previously observed in digital reaction time-based tests (Feenstra et al., Reference Feenstra, Vermeulen, Murre and Schagen2018). Lower-order predictors were forced back into the model when included in a higher-order predictor of the final model.
Furthermore, an alternative model was built replacing years of education with its inverse (1/years of education). The model with the inverse term was retained if it decreased the BIC value and if visual inspection of the model confirmed the improved curve fit. Otherwise, the model with years of education was selected as the final model (Bergman et al., Reference Bergman, Johansson, Almkvist and Lundberg2016).
The assumptions of regression analysis were tested for each model. The occurrence of multicollinearity between lower-order predictors was checked by calculating the Variance Inflation Factors (VIFs), which should not exceed 10 (Yoo et al., Reference Yoo, Mayberry, Bae, Singh, Peter He and Lillard2014). Possible outliers and unusual observations with high leverage were identified by calculating Cook’s distances, with the criterion of Di > .85 (McDonald, Reference McDonald2002). The normality of the residuals’ distribution was evaluated by visual inspection and by applying the Kolmogorov–Smirnov test. The homoscedasticity of the residuals’ distribution was evaluated by visual inspection and by applying the Levene’s test on the residuals divided into quartiles of predicted score (Testa et al., Reference Testa, Winicki, Pearlson, Gordon and Schretlen2009; Van der Elst et al., Reference Van der Elst, Van Boxtel, Van Breukelen and Jolles2006). When homoscedasticity could not be assumed, the SD of residuals was calculated for each quartile. An alpha level of 1% was applied due to the increased likeliness of obtaining statistical significance in a sample of this size. All analyses were performed in R version 3.6.0 (R Core Team, 2019).
Normative Model Application
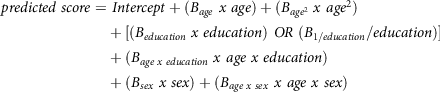
Normative regression models and variance of the model residuals can be used to calculate the standardised normative value for test takers. As such, clinicians receive a standardised measure of deviation for their patient’s observed test result compared to their expected normative test result (their predicted score). The two formulae needed to calculate the standardised normative value (z) are depicted below. First, the predicted score for each test result is calculated:
 \[\begin{gathered}
predicted\;score = \;Intercept + ({B_{age}}\;x\;age) + ({B_{ag{e^2}}}\;x\;ag{e^2}) \\
+ [({B_{education}}\;x\;education)\;OR\;({B_{1/education}}/education)] \\
+ ({B_{age\;x\;education}}\;x\;age\;x\;education) \\
+ ({B_{sex}}\;x\;sex) + ({B_{age\;x\;sex}}\;x\;age\;x\;sex) \\
\end{gathered} \]
\[\begin{gathered}
predicted\;score = \;Intercept + ({B_{age}}\;x\;age) + ({B_{ag{e^2}}}\;x\;ag{e^2}) \\
+ [({B_{education}}\;x\;education)\;OR\;({B_{1/education}}/education)] \\
+ ({B_{age\;x\;education}}\;x\;age\;x\;education) \\
+ ({B_{sex}}\;x\;sex) + ({B_{age\;x\;sex}}\;x\;age\;x\;sex) \\
\end{gathered} \]
Second, the difference between the observed and predicted scores of the test taker is standardised:
 \[z - score = (observed\;score - predicted\;score)/SD\;of\;residuals\]
For a more detailed explanation see Van der Elst et al. (Reference Van der Elst, Van Boxtel, Van Breukelen and Jolles2006). For the details necessary to employ an alternative method devised by Crawford and Howell (Reference Crawford and Howell1998) see the Supplementary Methods.
RESULTS
Data for 720 participants were entered into the analysis. The number of participants per test ranged from 164 for the Clock Drawing Test to 692 for the Corsi Span forward with a median of 427 participants per test. A descriptive summary of the results is presented in Table 2 with a more detailed description in Supplementary Table S2. There was no potentially harmful multicollinearity among the lower-order predictors (VIF ≤ 1.164). Some extreme results (>3 SD deviation in either direction from the estimated regression line) were present in the data (mean 5.88 per test result, range 0 to 16). No individual had extreme results in more than two tests. The extreme results did not significantly influence any of the models (Cook’s distance ≤ .294) and might very well be part of normal population performance (Binder et al., Reference Binder, Iverson and Brooks2009). Out of the 42 test residuals’ distributions, 20 were not considered to deviate too much from a normal distribution with an absolute skew mean of .58 (range .02 to 1.87) and a mean kurtosis of .99 (range −.33 to 4.91). Three test result measures (Cube Drawing Test, Clock Drawing Test and Tower of Hanoi correct solution) have only two or three possible outcomes, with a high percentage of participants receiving the maximum result. As such, the residuals’ distributions for these test result measures did not show enough continuous variance to be considered normally distributed. The residuals’ distributions of the 19 remaining test result were either somewhat skewed, somewhat leptokurtic or both (absolute mean skew 3.34, range 1.53 to 7.64; mean kurtosis 19.51, range 4.84 to 79.61). These 19 test results were the Token Test (skew = −2.0; kurtosis = 4.8), six time measures and 12 measures of correct or incorrect responses.
Table 2. Descriptive summary of results from the self-administered Mindmore cognitive tests
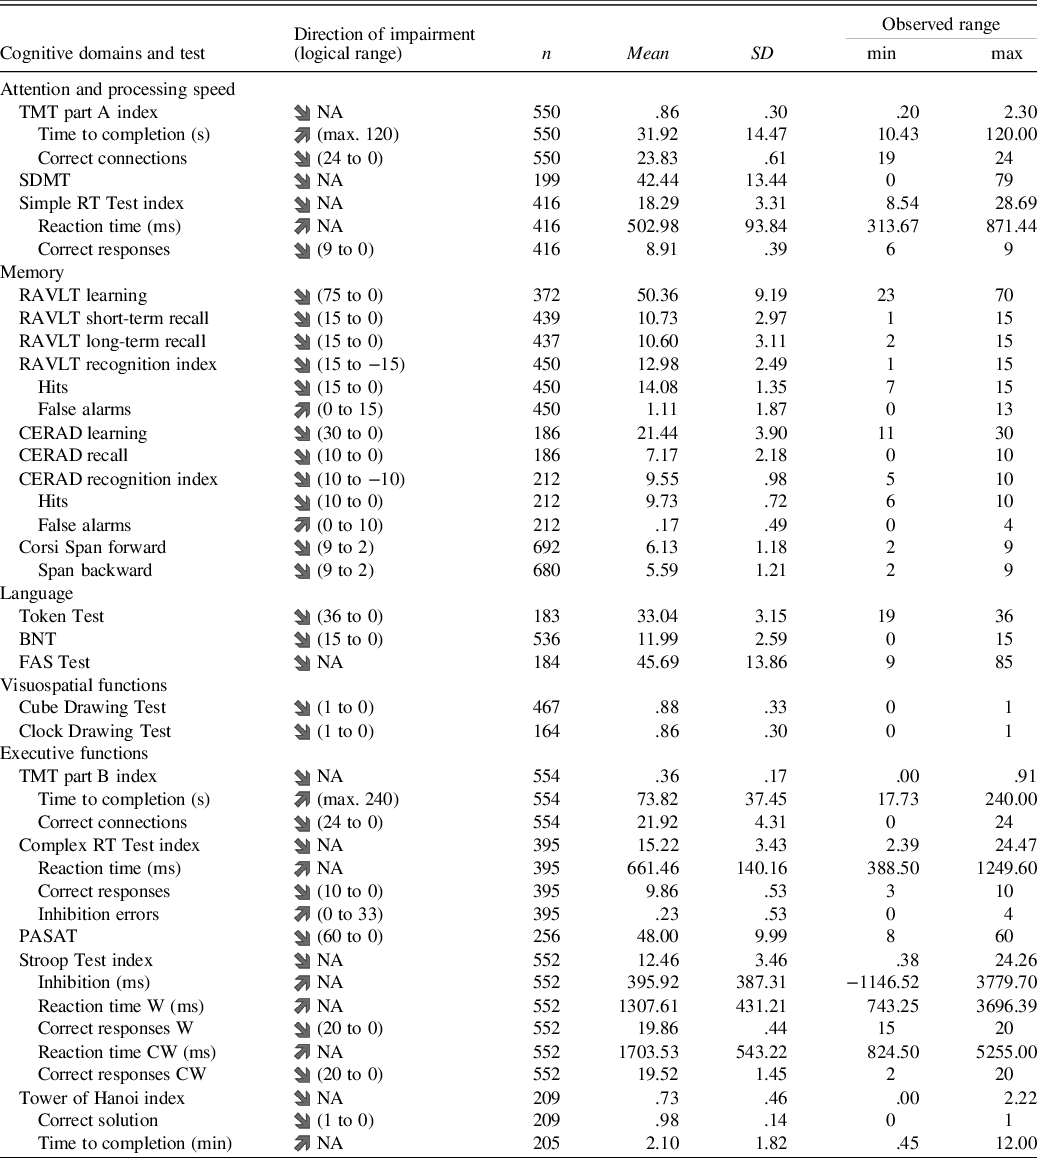
TMT = Trail Making Test; SDMT = Symbol Digit Modalities Test; RT = reaction time; RAVLT = Rey Auditory Verbal Learning Test; CERAD = Word List Learning Test; BNT = Boston Naming Test; FAS = Word Fluency Test; PASAT = Paced Auditory Serial Addition Test; Stroop Test W = congruent word trial; Stroop Test CW = incongruent colourword trial; Logical range = theoretical min. and max. obtainable test result.
Normative data were established for 42 test result measures (Table 3). The regression analyses yielded models for 33 of them including one or more demographic predictors. The remaining nine models which were unaffected by the demographic variables were all measures of accuracy of performance. Exemplary models illustrating the observed demographic effects are presented in Figures 1–3. Remaining models with corresponding effects are presented in Supplementary Figures S2 to S6.
Table 3. Final multiple linear regression models
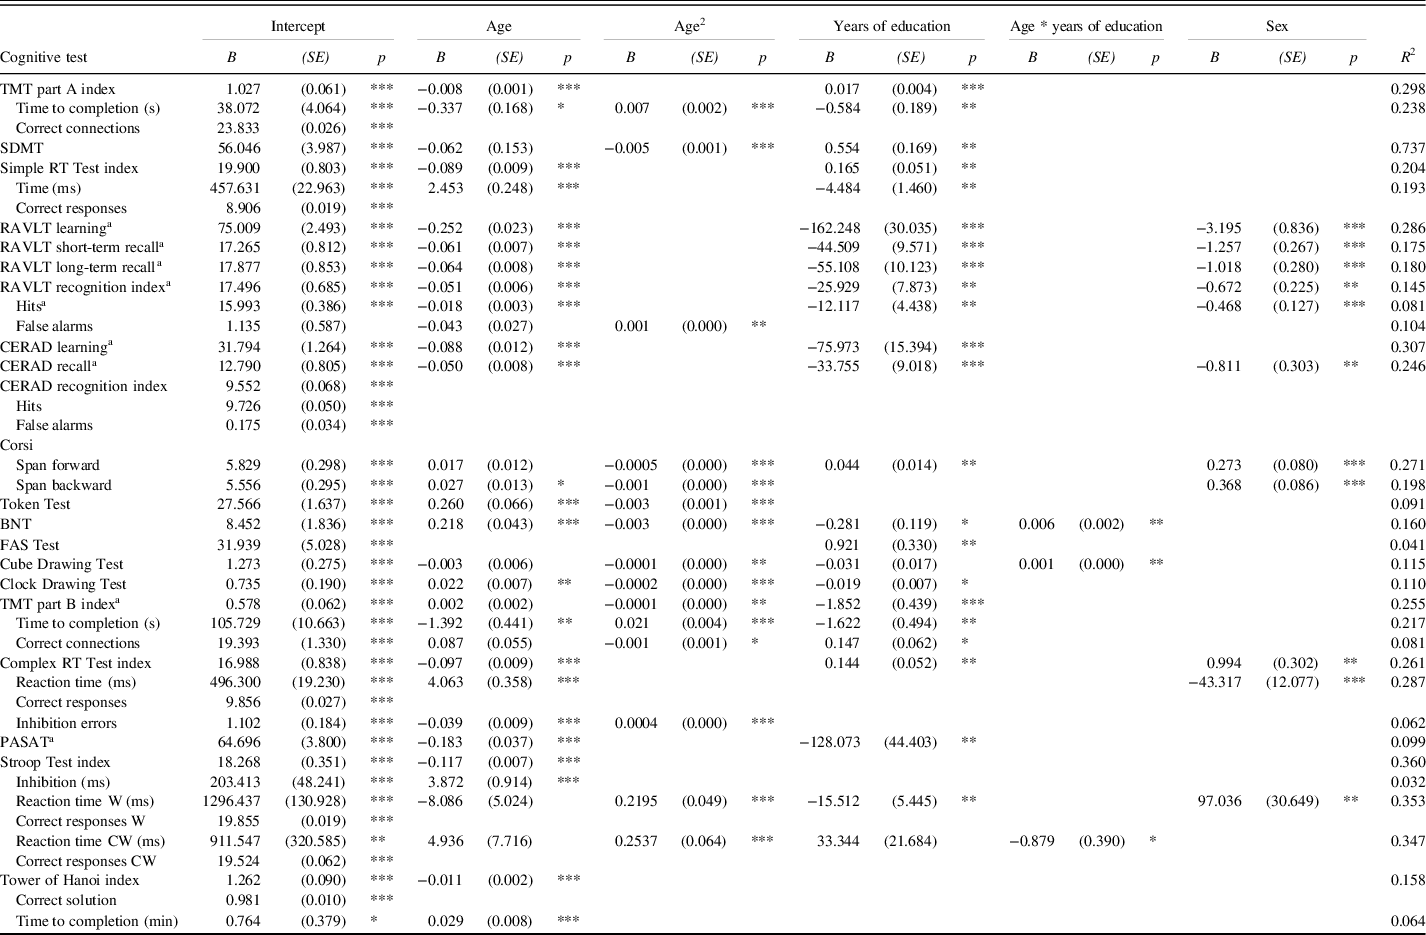
TMT = Trail Making Test; SDMT = Symbol Digit Modlities Test; RT = Reaction Time; RAVLT = Rey Auditory Verbal Learning Test; CERAD = Word List Learning Test; BNT = Boston Naming Test; FAS = Word Fluency Test; PASAT = Paced Auditory Serial Addition Test; Stroop Test W = congruent word trial; Stroop Test CW = incongruent colourword trial. Predicted score = Intercept + (Bage x age) + (Bage² x age²) + [(Beducation x education) OR (B1/education / education)] + (Bage x education x age x education) + (Bsex x sex). Where sex is 0 for women and 1 for men.
a predictor years of education has been replaced with 1/years of education.
* p < .05; ** p < .01; *** p < .001
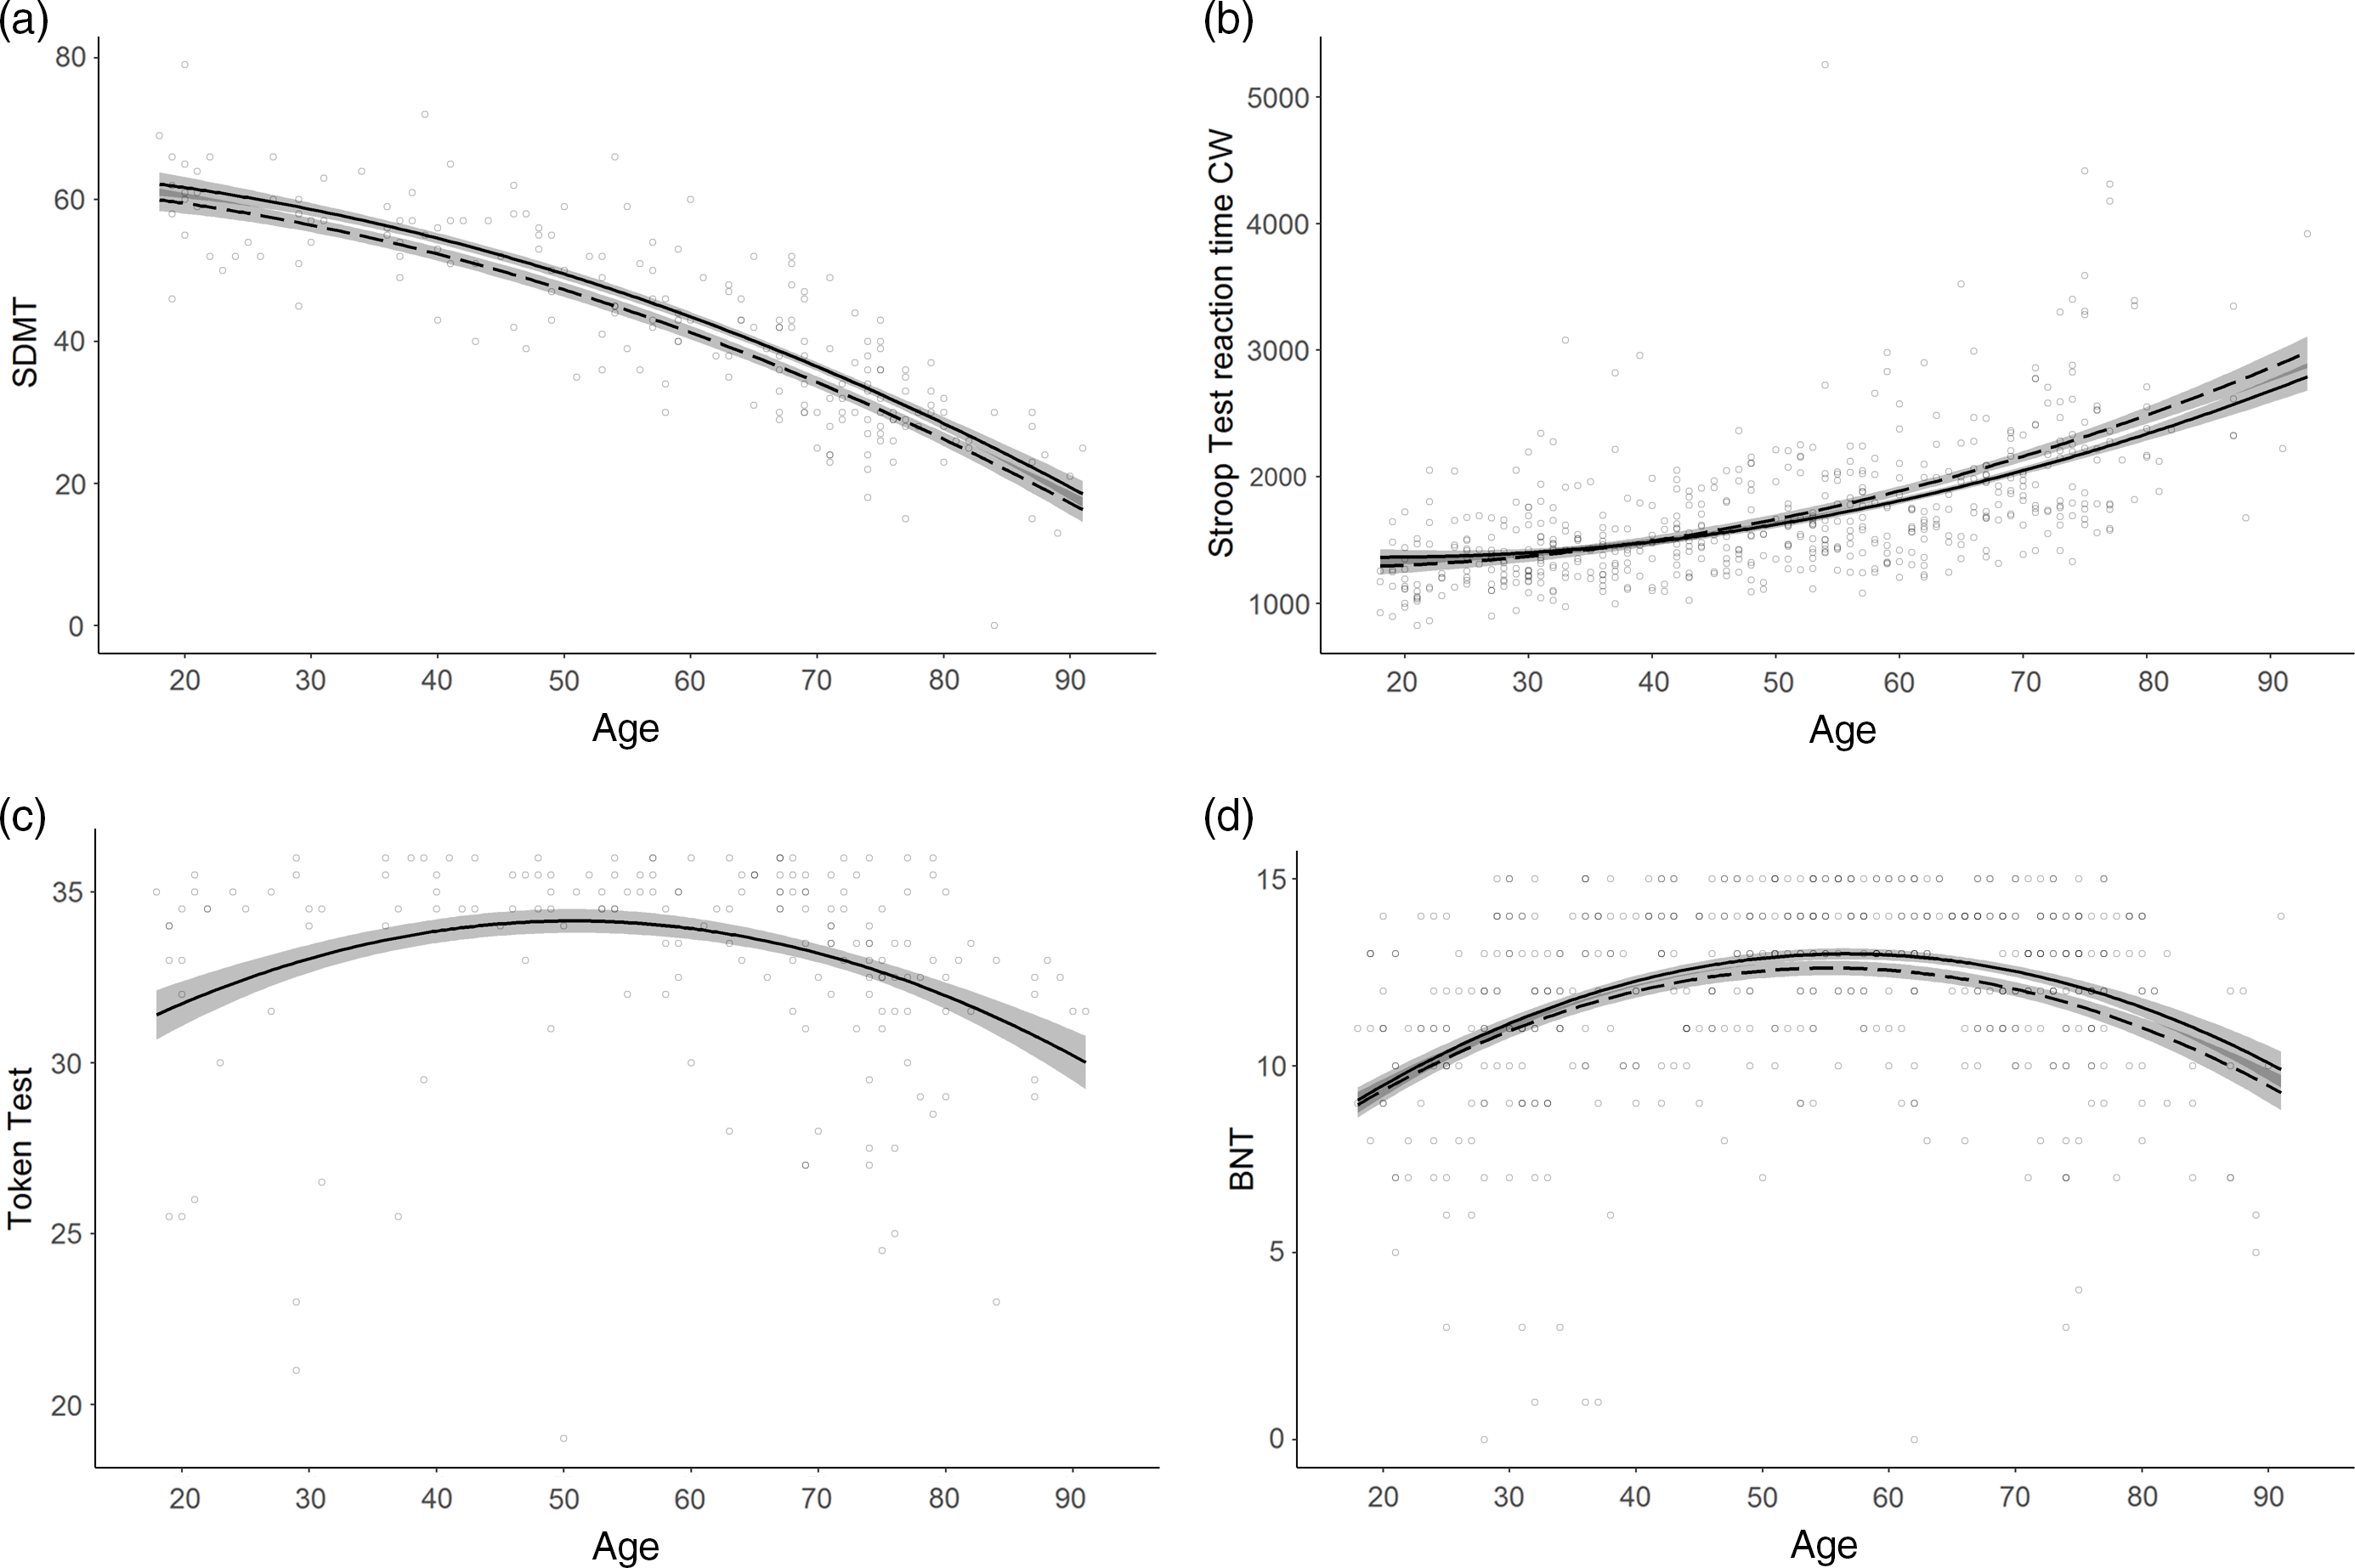
Fig. 1. Normative models with non-linear age effects.
a. SDMT correct matches (Attention and processing speed) displaying a curved age effect; b. Stroop Test reaction time CW (milliseconds; Executive functions) displaying a curved age effect and an interaction between age and education; c. Token Test (Language) displaying a U-shaped age effect; d. BNT (Language) displaying a U-shaped age effect and an interaction between age and education. Line solidity indicates years of education: dashed = 12 years; solid (when paired with dashed) = 16 years; shaded area = confidence interval.
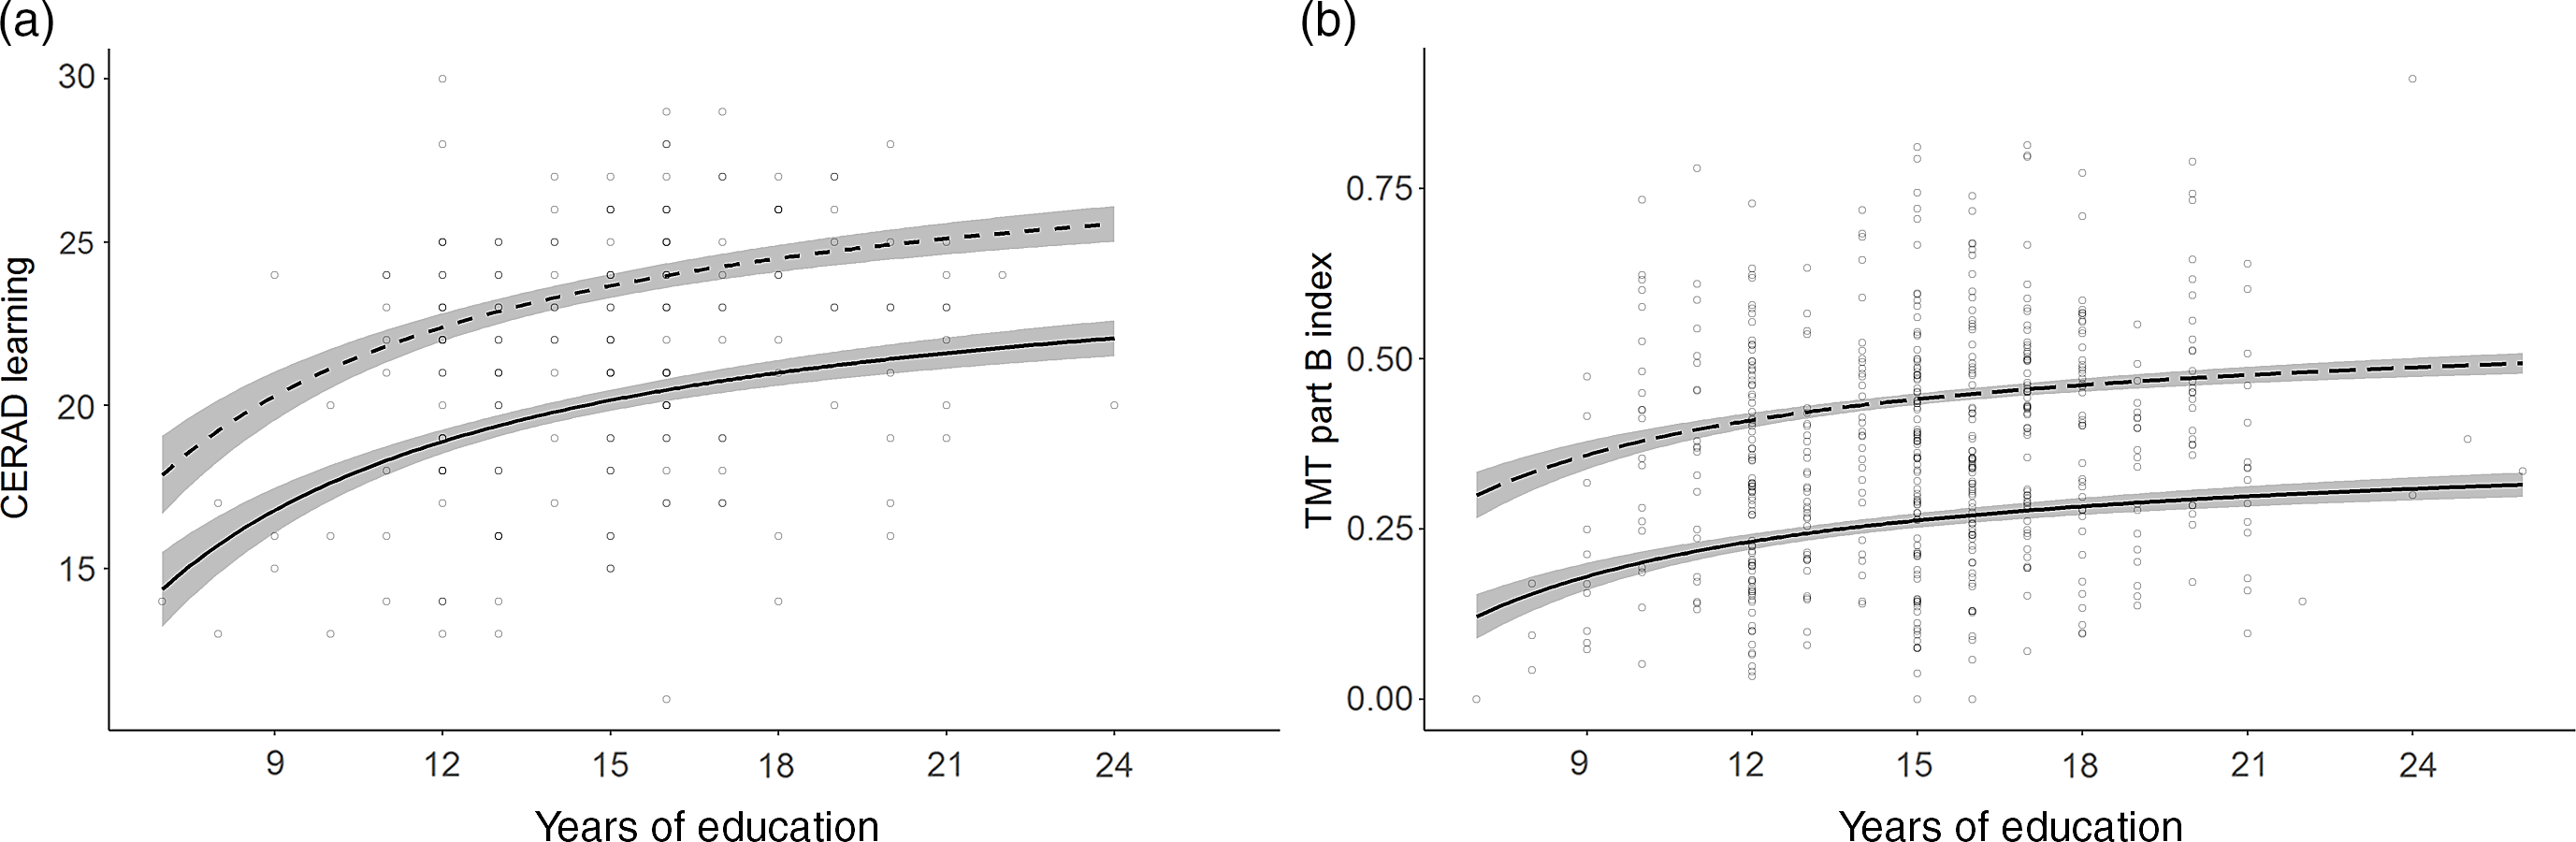
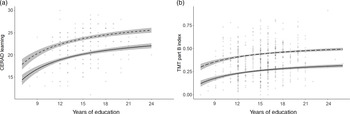
Fig. 2. Normative models with asymptotic education effects.
a. CERAD Learning (Memory); b. TMT part B index (Executive functions) calculated as [correct connections/time to completion (s)]. Line solidity indicates age: dashed = 35 years; solid = 75 years; shaded area = confidence interval.
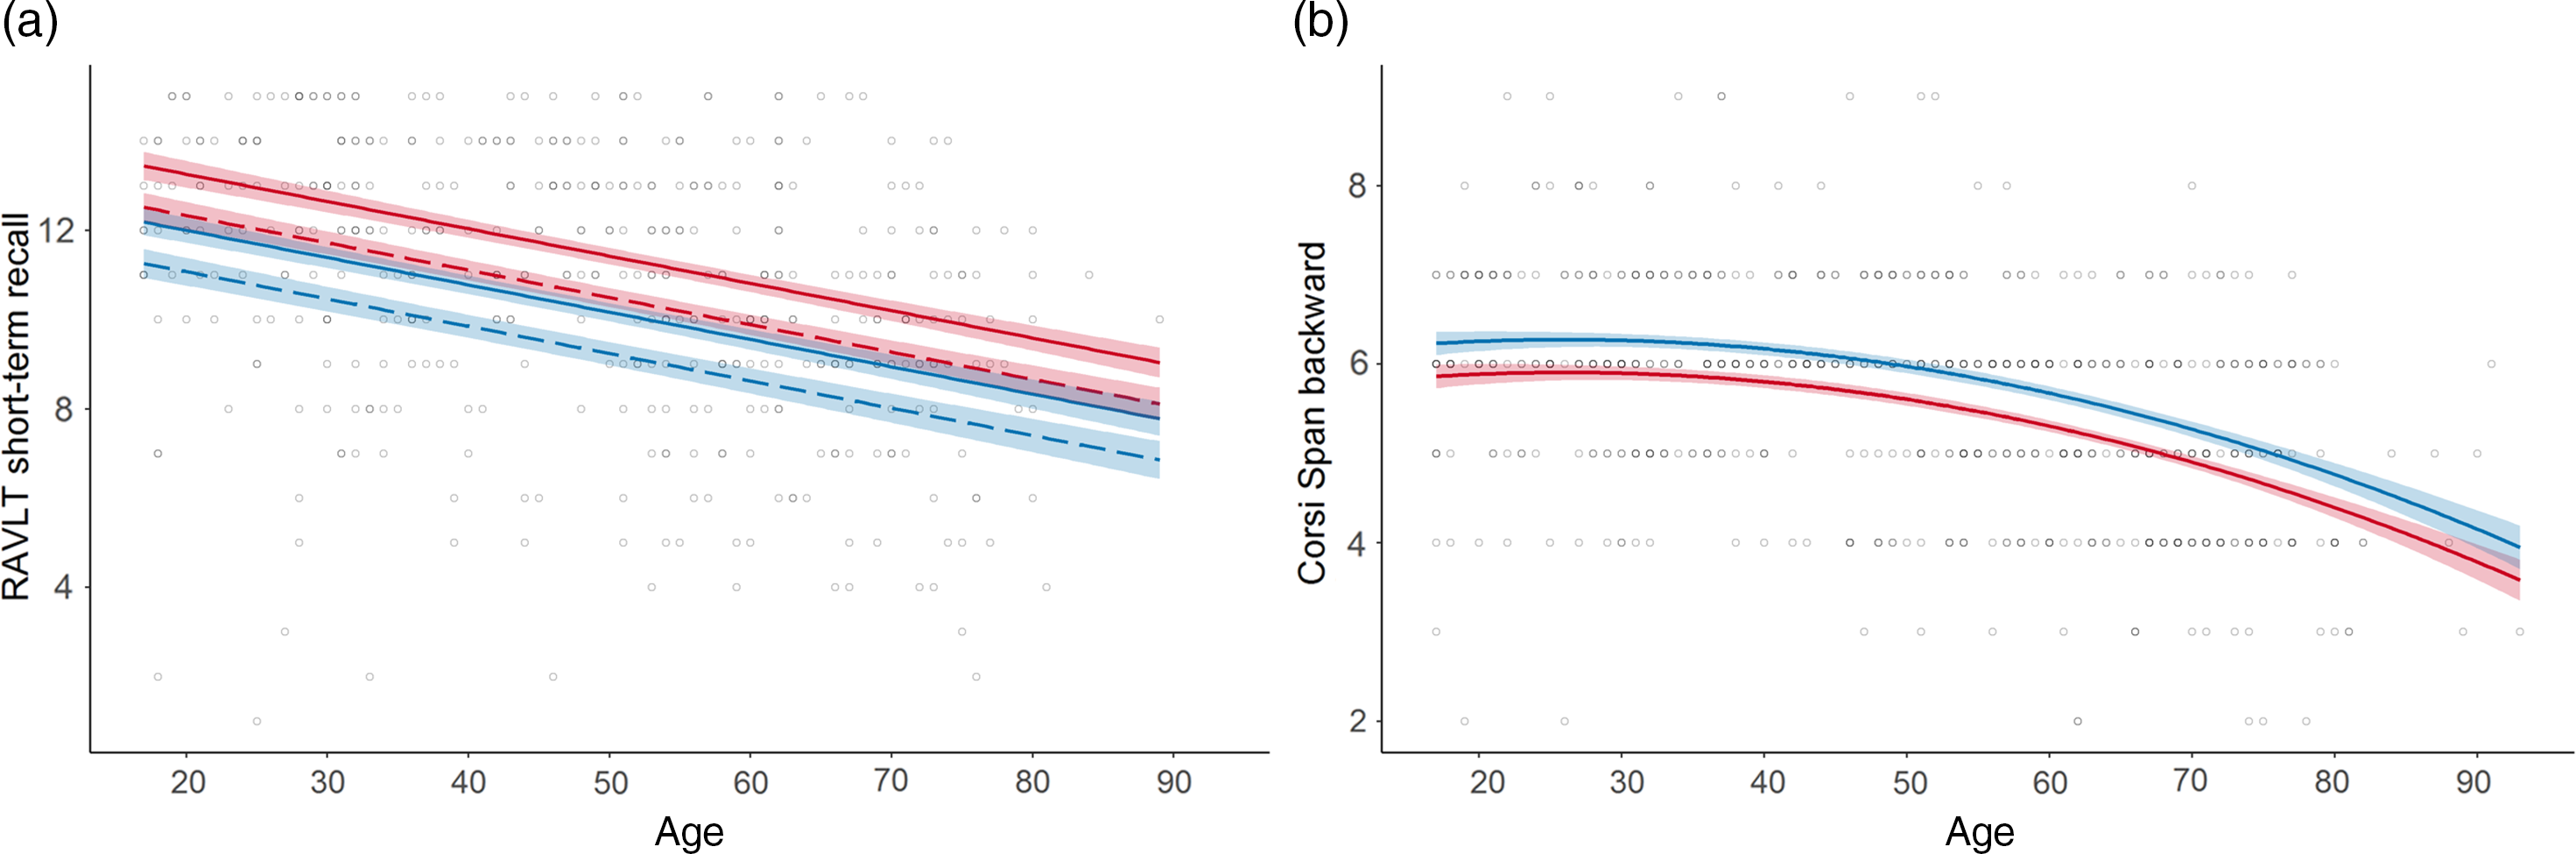
Fig. 3. Normative models with sex effects in the memory domain.
a. RAVLT short-term recall (Memory) displaying a female advantage; b. Corsi Span backwards (Memory) displaying a male advantage. Line colour indicates sex: red = female; blue = male; line solidity indicates years of education: dashed = 12 years; solid (when paired with dashed) = 16 years; shaded area = confidence interval.
Overall, age was the strongest predictor included in all models including predictors except for the FAS Test. A linear decrease in performance with increasing age was observed in 17 models. A curved age effect indicating accelerated decrement with age was seen in 15 models. TMT part A time to completion and SDMT showed accelerated slowing of performance from ages 30 and 20, respectively (Figure 1a). Accelerated performance decrement with older age was also seen for Corsi Span forward and backward from ages 25 and 40, respectively, and for the Cube Drawing Test. The latter also showed an interaction with education implying an accelerated performance decrement from age 30 for lower education but not before age 50 for higher education. In addition, slowly accelerating performance decline was seen for TMT part B index already from age 20 to 25, and for the Stroop Test reaction time W and CW already from age 30. Reaction time CW also showed an interaction with education with somewhat slower decline with age at higher education (Figure 1b).
Four models displayed a U-shaped age effect, in which performance increased up to age 50–60 after which an accelerated performance decrease took over. These were the Token Test and BNT in the language domain, the Clock Drawing Test and the Complex RT Test inhibition errors (Figure 1c). BNT also showed an interaction with education implying somewhat later onset of decline at higher education (Figure 1d).
Education was included in 24 models across every domain. An increase in number of years of education was consistently associated with higher performance. In 15 models, performance increased linearly with every additional year of education. In the other nine models, constituting the verbal memory tests, TMT part B and the PASAT Test, the effect was asymptotic (Figure 2). Here the most profound performance increase was associated with the first 12 years of education. Further years of education continued to add a small benefit, though the increments became smaller with every additional year.
Sex was included in 11 models. A female advantage was seen for RAVLT, CERAD recall and Stroop Test reaction time W (Figure 3a). A male advantage was observed for Corsi Span and Complex RT Test (Figure 3b). The interaction between age and sex was not included in any of the models.
In addition, Table 3 shows that the “throughput” index scores in most cases add to the variance explained as compared to the separate variables included in the indices. The only exception is Complex RT, where fewer inhibition errors seem to compensate for slower reaction times.
The variance in the test results, which remained after controlling for the demographic variables age, education and sex, was quantified through the residuals’ distribution of each model (Table 4). For 16 out of 33 test result measures homoscedasticity of the residuals’ distribution could not be assumed based on visual inspections and Levene’s test (p < .01). For these test result measures, the SD of residuals was calculated for each quartile of the predicted score.
Table 4. SD of residuals for all test results
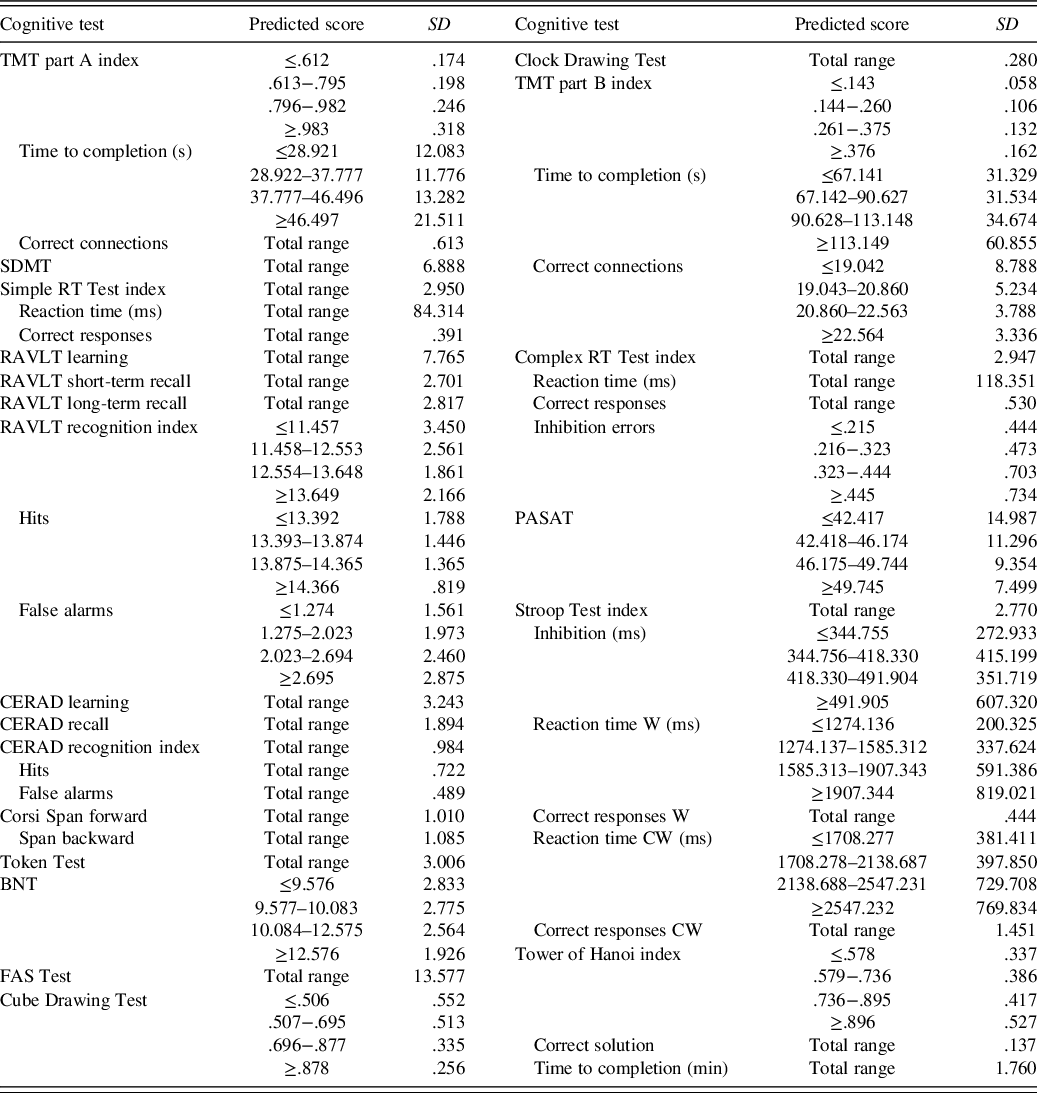
The predicted score is the test takers estimated normative score and can be calculated with Table 3. Total range = any predicted score (SD is not dependent on the predicted score for this test result); TMT = Trail Making Test; SDMT = Symbol Digit Modalities Test; RT = reaction time; RAVLT = Rey Auditory Verbal Learning Test; CERAD = Word List Learning Test; BNT = Boston Naming Test; FAS = Word Fluency Test; PASAT = Paced Auditory Serial Addition Test; Stroop Test W = congruent word trial; Stroop Test CW = incongruent colourword trial.
DISCUSSION
Mindmore is a screening battery of 14 cognitive tests, adapted for digital self-administration. Research over many decades has assessed the validity and reliability of the underlying traditional analogue tests (Lezak et al., Reference Lezak, Howieson, Bigler and Tranel2012). Digitalisation of traditional tests can increase their availability and ease of administration (Bauer et al., Reference Bauer, Iverson, Cernich, Binder, Ruff and Naugle2012; Miller & Barr, Reference Miller and Barr2017). Moreover, digitised tests potentially facilitate enhanced standardisation of assessment and result calculation (Newman et al., Reference Newman, Bevins, Zajicek, Hodges, Vuillermoz, Dickenson and Noad2018). An equivalence study between the digitised Mindmore tests and the underlying traditional analogue tests showed comparable results between the two (Björngrim et al., Reference Björngrim, Van den Hurk, Betancort, Machado and Lindau2019). However, complete correspondence of test results between analogue and digital test versions cannot be expected. Therefore, norms for the 14 Mindmore tests are provided in the present study. These norms are intended for the adult Swedish population and adjusted for age, education and sex.
The effects of the demographic variables on the test results collected with Mindmore largely resembled the effects previously reported for the traditional analogue tests (Lezak et al., Reference Lezak, Howieson, Bigler and Tranel2012; Mitrushina et al., Reference Mitrushina, Boone, Razani and D’Elia2005; Strauss et al., Reference Strauss, Sherman and Spreen2006). Age demonstrated the strongest impact on test performance. Irrespective of cognitive domain, all but one of the final models including predictors declined with increasing age. These findings support previous findings in that age-related decline is known to occur in every cognitive domain, even though the onset and severity of decline varies between domains (Cohen et al., Reference Cohen, Marsiske, Smith, DeKosky and Asthana2019). They also corroborate with previous findings maintaining that in general, a gradual and not necessarily linear decline in processing speed is observed from early middle age (Gautam et al., Reference Gautam, Cherbuin, Sachdev, Wen and Anstey2011; Zimprich & Mascherek, Reference Zimprich and Mascherek2010). While basic attentional functions such as warning systems are preserved in normal ageing, more complex processes are not (Andrés et al., Reference Andrés, Parmentier and Escera2006; McDowd & Shaw, Reference McDowd, Shaw, Craik and Salthouse2000). The marked decline in processing speed is by some considered to be the first symptom of age-related cognitive decline (Finkel et al., Reference Finkel, Reynolds, McArdle, Gatz and Pedersen2003; Meijer et al., Reference Meijer, De Groot, Van Gerven, Van Boxtel and Jolles2009; Soederberg Miller & Lachman, Reference Soederberg Miller and Lachman2000). On the other end of the spectrum, there is consensus that functions in the language domain are relatively well retained in healthy elderly (Wingfield, Reference Wingfield, Park and Schwarz2000). This is confirmed by the results on the language tests in this study. An age-related decline was not seen until age 50–60 for BNT and Token Test, and not at all for the FAS Test.
Higher educational attainment was associated with improved performance on two-thirds of the test result measures, across all five cognitive domains. This finding is supported by large cohort studies reporting a benefit of education across a wide range of cognitive functions (Ritchie et al., Reference Ritchie, Bates and Deary2015; Ritchie & Tucker-Drob, Reference Ritchie and Tucker-Drob2018). The benefit of education was either gradual or most profound for the early years of education. This latter pattern of a stronger effect of the earliest years of education was also found in a large study with older adults in the United States (Zahodne et al., Reference Zahodne, Stern and Manly2015). In this study, the strongest effect of education is seen for the first 12 years of education. It might be speculated that this finding is related to the design of the Swedish educational system in which pupils graduate from their secondary pre-university education (gymnasium) after year 12. This is generally seen as an educational milestone and a personal goal for most adolescents. It may therefore be that this achievement is primarily driven by factors related to cognitive capacity, whereas further education beyond 12 years is more determined by other factors including choice of career. These education effects did not diminish with increasing age, corresponding to previous findings (Ritchie et al., Reference Ritchie, Bates and Deary2015; Ritchie & Tucker-Drob, Reference Ritchie and Tucker-Drob2018). In contrast, BNT, Cube Drawing Test and one Stroop Test time measure demonstrated a more pronounced benefit of education later in life through interactions between age and education. These results indicate that higher educational attainment might counteract age-related decline. A finding that potentially reflects some form of cognitive reserve (Stern, Reference Stern2002; Stern & Barulli, Reference Stern, Barulli, DeKosky and Asthanan2019).
A differential effect of sex was identified in five tests. In the memory domain, women performed better on the verbal memory tests RAVLT and CERAD, while men exhibited enhanced performance in the Corsi Span visual memory test. In the executive domain, women outperformed men in one of the time measures of the Stroop Test and men outperformed women in the Complex RT Test. These findings concurred with the theories that women often display better language skills (Adani & Cepanec, Reference Adani and Cepanec2019) and that men have an advantage in visual-spatial working memory (Voyer et al., Reference Voyer, Voyer and Saint-Aubin2017). It should however be noted that these findings could be highly dependent on culture and situation since sex differences seldom remain undisputed in other populations (Miller & Halpern, Reference Miller and Halpern2014; Wallentin, Reference Wallentin2009).
The “throughput” index scores suggested by Thorne (Reference Thorne2006) and applied in this study, taking both accuracy and speed into account, in most cases were found to add to the variance explained as compared to the separate accuracy and speed variables included in the indices. The only exception was Complex RT, where fewer inhibition errors seemed to compensate for slower reaction times. These findings confirm that the throughput measure is a more sensitive index of performance than either speed or accuracy alone under conditions in which both speed and accuracy decline (or improve).
Only the residuals of slightly fewer than half of the test result measures were considered to be normally distributed. Transformation to normalized residuals was not considered as this may bias model estimates (Schmidt & Finan, Reference Schmidt and Finan2018). In smaller samples, violation of normality can lead to over or underestimation of the sample variance (Crawford et al., Reference Crawford, Garthwaite, Azzalini, Howell and Laws2006). However, as pointed out by Testa et al. (Reference Testa, Winicki, Pearlson, Gordon and Schretlen2009), violation of normality is not a serious violation in the large samples found in this study, and nonnormal residuals do not lead to biased regression coefficients. A more serious violation of the assumptions for regression-based norms is the presence of heteroskedasticity (i.e., when the variance of residuals differs over the continuum of test scores). To account for the presence of heteroskedasticity, we followed the suggested method to stratify the sample by level of predicted performance and compute the standard deviation of the residual for each stratification group (Van der Elst et al., Reference Van der Elst, Van Boxtel, Van Breukelen and Jolles2006). Even though this method creates somewhat arbitrary groups for different levels of variance, it is still considered the optimal solution to deal with heteroskedasticity (Testa et al., Reference Testa, Winicki, Pearlson, Gordon and Schretlen2009).
Some limitations of this study should be mentioned. First, the currently presented norms are not adjusted for potential learning effects which could occur with repeated testing. To do that, a test–retest study is warranted. However, to reduce learning effects, alternate lists are available for RAVLT, BNT and SDMT (alternate lists were not used in this study). Second, the regression coefficients and SD of residuals were calculated treating the normative sample statistics as population statistics. We suggested calculation of standardized values according to z-distributions. An alternative method would be to employ a t-distribution, as detailed in the Supplementary Methods. However, with sample sizes exceeding 100, as seen in this study, the outcomes of both methods are highly comparable (Crawford & Garthwaite, Reference Crawford and Garthwaite2006). Third, the RAVLT and BNT results are based directly on automated speech recognition, without manual result validation which was not available at the time. In the CERAD and the FAS Test, also dependent on speech, it was observed that a subset of participants was partly misunderstood by the automated speech recognition. Therefore, these individuals received a higher score after manual result validation. If this phenomenon also occurred for RAVLT and BNT, the norms for these tests could be slightly low in our sample compared to the true population. For RAVLT this was tested in a separate unpublished data set: an average of 96% of words were correctly recognised by the automated speech recognition procedure. Nevertheless, the norms for these tests should be used with certain caution. A fourth limitation is that the sample in this study is not selected on optimal health as common age-related diseases were not part of the exclusion criteria. Including non-optimally healthy elderly in the sample implies a risk for underestimating truly healthy functioning in old age (Bergman & Almkvist, Reference Bergman and Almkvist2015). On the other hand, this is common in normative studies (e.g. the studies from the Mayo clinic; Ivnik et al., Reference Ivnik, Malec, Tangalos, Petersen, Kokmen and Kurland1990, Reference Ivnik, Malec, Smith, Tangalos, Petersen, Kokmen and Kurland1992, Reference Ivnik, Malec, Smith, Tangalos and Petersen1996). It should further be mentioned that the present norms were derived from a population that, with few exceptions, were ethnically and culturally Swedish adults who live in economically stable urban regions in Sweden. Therefore, we cannot readily conclude that the findings of the present study will generalise to populations composed of other ethnic, cultural, social or economic backgrounds. There are, however, indications that at least some of the included tests are culture independent (Cores et al., Reference Cores, Vanotti, Eizaguirre, Fiorentini, Garcea, Benedict and Cáceres2015; Møller et al., Reference Møller, Cluitmans, Rasmussen, Houx, Rasmussen, Canet and Gravenstein1998; Shulman, Reference Shulman2000; Van der Elst et al., Reference Van der Elst, Van Boxtel, Van Breukelen and Jolles2005). While keeping these limitations in mind, the findings of this study can be applied for the Swedish Mindmore tests and potentially also in other countries.
Some strengths of the present norms are that they are based on a large data set, cover all adult ages, education and sex which are the most influential determinants of cognitive impairment (Lezak et al., Reference Lezak, Howieson, Bigler and Tranel2012). The wide range of included tests covers the key domains attention and processing speed, memory, language, visuospatial functions and executive functions. Therefore, the screening battery is able to assess cognitive impairment associated with a multitude of mental disorders, including common disorders such as MCI and incipient dementia (Levey et al., Reference Levey, Lah, Goldstein, Steenland and Bliwise2006; Winblad et al., Reference Winblad, Palmer, Kivipelto, Jelic, Fratiglioni, Wahlund and Petersen2004), depression (Hammar & Årdal, Reference Hammar and Årdal2009; Zaremba et al., Reference Zaremba, Schulze Kalthoff, Förster, Redlich, Grotegerd, Leehr and Dannlowski2019) and burnout (Ellbin et al., Reference Ellbin, Engen, Jonsdottir and Nordlund2018; Grossi et al., Reference Grossi, Perski, Osika and Savic2015). Finally, the presented normative models may be of more general interest to clinical neuropsychologists as computer-based cognitive assessment gains ground in primary and specialist care (Miller & Barr, Reference Miller and Barr2017; Sabbagh, Boada, Borson, Doraiswamy, et al., Reference Sabbagh, Boada, Borson, Doraiswamy, Dubois, Ingram and Hampel2020).
Comparing patients’ results to the norms will guide clinicians using the Mindmore tests in the clinical interpretation of their patients’ results. Comparison to normative data provides a measure of standardised deviation of a patient’s observed result to their expected result had they been part of the norm population. A common method is to consider negative deviation in performance as less-than-typical when below −1 SD, as suspected impairment when below −1.5 SD, and as atypical/pathological when below −2 SD (American Psychiatric Association, 2013). To determine the clinical validity of the tests included in the present study, we shall follow-up with separate studies on sensitivity in different clinical populations.
Under certain conditions, such as during an epidemic, it might be preferable to administer a cognitive screening remotely instead of in-person, even with the obvious disadvantages of reduced patient contact and control over the test setting. Other cognitive test batteries, such as the NIH Toolbox-Cognition, have adapted their test protocols for remote administration (Rebchuk et al., Reference Rebchuk, Deptuck, O’Neill, Fawcett, Silverberg and Field2019). Mindmore is fully self-administrative and as such requires little adaptation to be performed in a remote setting (Owens et al., Reference Owens, Ballard, Beigi, Kalafatis, Brooker, Lavelle and Aarsland2020). Future studies may support the validity of Mindmore in a remote setting.
In conclusion, we collected normative data for 14 traditional cognitive tests, digitised and adapted for self-administration through the Mindmore digital platform. With this normative database, the usability of the Mindmore screening battery is further improved as it will allow for more accurate interpretation of test results, hopefully leading to improved clinical decision making and better care for patients with cognitive impairment.
SUPPLEMENTARY MATERIAL
To view supplementary material for this article, please visit https://doi.org/10.1017/S135561772100045X
ACKNOWLEDGEMENTS
The authors thank the participants involved in the present study who made this work possible. The authors also acknowledge the great work of the research assistants Lina Lindrågen, Adrian Ringström and Ludwig Franke Föyen, the study staff and Jan J. Kuiper.
FINANCIAL SUPPORT
This work was supported by Vinnova (Innovative startups step 2, grant number 2018-02179).
CONFLICTS OF INTEREST
Wobbie van den Hurk, Ingvar Bergman and Alejandra Machado are or have been employees of Mindmore AB. Anders Gustavsson indirectly owns shares in Mindmore AB. Jonas Bjermo declared no conflicts of interest.


 Open access