The Physical Mechanisms Behind the Change in the Precipitation Recycling Rate in the Mid- and Lower Reaches of the Yangtze River
 Wen-Kang Guo1
  Xi-Yu Wang1
  Wang-Ze Gao1 Jia-Hua Yong1 Xin-Yue Bao2
  Yong-Ping Wu1*
  Guo-Lin Feng1,3,4* Wen-Jie Dong4,5
- 1College of Physical Science and Technology, Yangzhou University, Yangzhou, China
- 2Yangzhou Shuren School, Yangzhou, China
- 3Laboratory for Climate Studies, National Climate Center, China Meteorological Administration, Beijing, China
- 4Guangdong Provincial Laboratory of Marine Science and Engineering, Zhuhai, China
- 5School of Atmospheric Sciences and Guangdong Province Key Laboratory for Climate Change and Natural Disaster Studies, Sun Yat-sen University, Zhuhai, China
The precipitation recycling rate (PRR) is an important index when trying to understand the physical mechanisms behind the effects of different sources of water vapor on regional precipitation. We studied the change in the PRR in the mid- and lower reaches of the Yangtze River (MLRYR), the correlation between the PRR and the external source of water vapor and local evaporation, and the possible reasons for the interannual variation of the PRR. Our study was based on an evaluation model of the PRR and used precipitation data from meteorological stations in China and NCEP/NCAR reanalysis datasets. Our results show that the mean PRR in the MLRYR for the time period 1961–2017 was largest in autumn (about 0.3) and smallest in summer (about 0.23), with a clear upward trend (passed the 95% significance F-test), except in summer. The highest trend coefficient of the PRR was in autumn (0.38), indicating that the contribution of an external source of water vapor to local precipitation was reduced. The PRR of the MLRYR was strongly correlated with the input of water vapor through the western and southern boundaries. Water vapor was mainly sourced from the Northwest Pacific Ocean, the South China Sea and the Bay of Bengal. The anomalous Northwest Pacific cyclone induced by the Pacific sea surface temperature restrained the input of water vapor into the MLRYR from the Western Pacific, the South China Sea and the Bay of Bengal, contributing to the upward trend in the PRR. We suggest that increases in the sea surface temperature in the Pacific Ocean, South China Sea and especially the Indian Ocean will have an important impact on precipitation in East Asia.
Introduction
The mid- and lower reaches of the Yangtze River (MLRYR) are located in the East Asian monsoon region and have a higher annual precipitation than most other regions of China. The global climate has significantly warmed in recent decades [1]. Many studies have shown that the total rainfall in the MLRYR has not changed significantly, but the number of extreme precipitation events has significantly increased [2–5], which poses new challenges in the prediction of precipitation [6]. The source of water vapor for regional precipitation depends on the amount of water vapor produced by local evaporation and the amount of water vapor transported into the region by horizontal movement through the atmosphere [7–12]. Many researchers have used the precipitation recycling rate (PRR) to quantitatively evaluate the contribution of these two sources of water vapor to regional precipitation. The PRR is defined as the proportion of precipitation formed by the local evaporation of water vapor in the total precipitation [7, 13–17]. However, water vapor that forms precipitation through local evaporation cannot be observed, so numerous precipitation recycling models have been developed to assess the regional PRR [7, 8, 13–19].
Budyko [13, 14] developed a one-dimensional linear model to estimate the recycling of precipitation in large-scale regions and analyzed the PRR in the former Soviet Union, showing that the annual average PRR was about 10%. Brubaker et al. [7] extended the Budyko model to the two-dimensional plane and evaluated the PRR in some parts of the global continent. The highest PRR was seen in Africa (up to 48% in August) and the lowest in Eurasia (almost zero in February) and the PRR in dry areas was higher than that in humid areas. Guo et al. [20] adopted this two-dimensional model to study the trend of PRR over the Qinghai–Tibetan Plateau. They showed that, with increasing temperatures, the PRR in the arid region of the western Qinghai–Tibetan Plateau showed a downward trend (−2.5%/10a), whereas that in other regions presented an upward trend. The PRR in the northeastern Qinghai–Tibetan Plateau showed the strongest growth trend of 3.1%/10a.
Burde et al. expanded the Budyko model into a two-dimensional model [15] and refined and improved it [21], showing that the average annual PRR in the Amazon basin was 41% [22]. Eltahir et al. [16, 17] fundamentally improved the Budyko model by eliminating the influence of the non-uniformity of the regional spatial distribution and studied the precipitation recycling process in the Amazon region. Their results showed that the average annual PRR in the Amazon basin was about 35%.
Hai et al. [23] used the Eltahir model to study the characteristics of the hydrological cycle in the Tarim river basin. They showed that about 14% of the water vapor for the annual precipitation came from evaporation in the Tarim river basin and 86% from the surrounding area. Schär et al. [18] simplified the Brubaker model based on the whole-layer moisture balance model. Li et al. [24] then used this model to study the PRR in arid and semi-arid regions in the northern hemisphere and showed that the PRR in arid regions has a clear seasonal variation (from <1 to >25%) and that the PRR in arid regions showed a significant negative correlation with precipitation.
Dominguez et al. [8] considered the influence of the water vapor content of the atmosphere on the recirculation of precipitation and established a dynamic recirculation model to study the spatiotemporal distribution of the summer PRR in the United States. They concluded that the average summer PRR in the United States was between 11 and 28% and that the PRR in the southeastern United States was the highest in August, reaching 36%.
Amey Pathak et al. [25] used the Dominguez dynamic recirculation model to study the recirculation of precipitation in the Indian subcontinent during the monsoon period and showed that the PRR in India was high in the northeast and low in the southwest. The PRR in northern India was highest in August, with some areas >40%. Hua et al. [26] used this model to conduct a systematic study on precipitation recycling in China and concluded that the PRR in China was low in the southeast and high in the west (range 8–28%). Van der Ent et al. [19] proposed a complex numerical scheme to evaluate the PRR of the global continent. They showed that the PRR of the whole continent was about 40% and the regional PRR increased with an increase in the regional spatial scale.
Previous studies have shown that the PRR is helpful in understanding the causes of changes in precipitation in the MLRYR. It is therefore important to discuss the variation of the PRR in the MLRYR. Yi et al. [27] calculated and analyzed different sources of water vapor for precipitation in the MLRYR based on the Eltahir and Brubaker models and found that the average annual PRR in the Yangtze river basin was about 10% and the PRR was highest (about 19%) in late summer and early autumn and lowest (about 3%) in early spring.
Fu Xiang et al. [28] used the Eltahir model to study precipitation recycling in the MLRYR in the context of global climate change and found that, on average, about 30% of the precipitation in the MLRYR in the summer rainstorm period came from local evaporation. Kang et al. [29] used the Eltahir model to evaluate the PRR in central and southern China. They showed that 20% of the precipitation in the upper reaches of the Yangtze River was from the evaporation of water vapor in central and southern China, as was 40% of the precipitation in the MLRYR. The PRR was highest (about 40%) in August, September and October and was <25% in May, June and July. The PRR has shown an increasing trend over the last 20 years.
These studies on the PRR of the MLRYR reflect the contribution of the circulation of internal and external sources of atmospheric water, but the models are calculated based on the average value for the whole region and the results are approximate. Previous research on the PRR of the MLRYR has mostly been limited to annual changes and the interannual and trend analyses need to be supplemented. The mechanism for the changes in the PRR of the MLRYR requires further study.
We improved the evaluation model for the PRR based on gridded data and studied the characteristics of the annual and trend changes of the PRR in the MLRYR. We then analyzed the mechanism for the variation in the PRR in the MLRYR from the perspective of the sea surface temperature (SST) and atmospheric circulation.
Datasets and Methods
We used the specific humidity
The evaporation data were calculated using the method proposed by Su et al. [31], who integrated multiple datasets, including the NCEP-R1, NCEP-R2, MERRA (Modern-Era Retrospective analysis for Research and Applications), ERA-Interim and JRA-55 (Japanese 55-year Reanalysis) datasets. Su et al. [31] showed that evaporation data calculated by this method are more reliable because it avoids dependence on a single dataset.
The precipitation data were daily data from meteorological stations in China between 1961 and 2017, which were interpolated onto a (2.5° × 2.5°) grid for subsequent calculations. The Western Pacific subtropical high index was provided by the National Climate Center, China Meteorological Administration. The SST was from the monthly mean COBE-SST data provided by the National Oceanic and Atmospheric Administration (NOAA). The research area was the MLRYR (110–122.5° E, 25–35° N) (Figure 1).
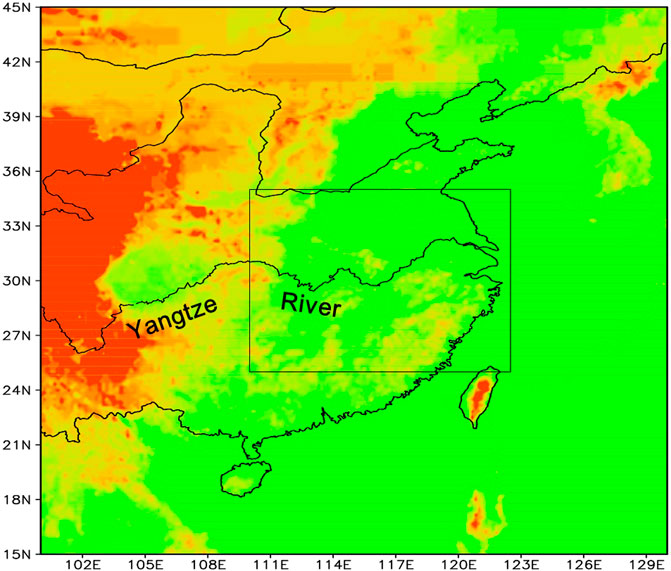
FIGURE 1. Location of the study area. The color shading indicates the altitude (units: m) and the black rectangle indicates the MLRYR.
We based the calculation of the PRR on the evaluation model proposed by Eltahir [16, 17]. The water vapor provided by region
where
The PRR
In this equation,
We used conventional meteorological statistical methods—such as regression and correlation analysis, the climatic trend coefficient and the climatic tendency rate (regression coefficient) [33]—to analyze the increase and decrease in the time series.
Results
Temporal Variation of the Precipitation Recycling Rate in the Mid- and Lower Reaches of the Yangtze River
Figure 2 shows the annual mean and seasonal PRR in the MLRYR. The average annual PRR in the MLRYR was about 0.26 and there were clear interannual variations. From 1961 to 2016, the linear trend was increasing with a trend coefficient of 0.51 (regression coefficient 0.48%/10a) that passed the 95% significance test. The PRR in spring, summer, autumn and winter were about 0.24, 0.23, 0.3 and 0.28, respectively, and all seasons showed an upward trend with trend coefficients of 0.36, 0.09, 0.38 and 0.35, respectively (regression coefficients 0.44, 0.09, 0.68 and 0.61%/10a, respectively). The 95% significance test was passed in spring, autumn and winter.
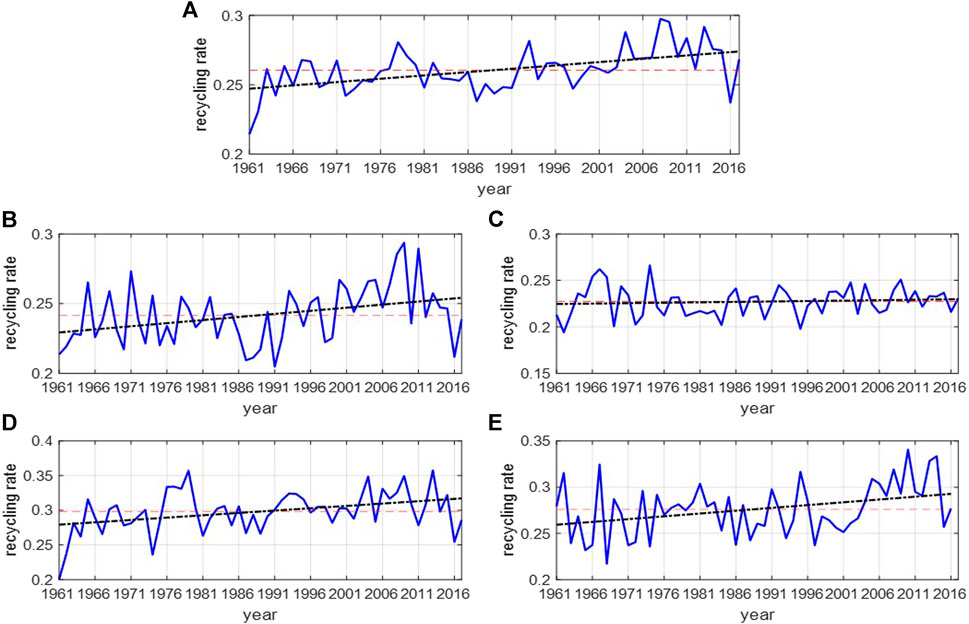
FIGURE 2. (A) Annual PRR and the PRR in (B) spring, (C) summer, (D) autumn and (E) winter in the MLRYR. The blue line is the time series of the PRR, the black line is the linear fit of the PRR and the red line is the mean of the PRR.
Correlation Between the Precipitation Recycling Rate and External Sources of Water Vapor and Local Evaporation
The PRR was affected by the input of external sources of water vapor and local evaporative water vapor: the greater the input of external sources of water vapor, the smaller the PRR and the larger the local evaporative water vapor, the larger the PRR.
The correlation between the PRR in each season along the MLRYR and the input of water vapor at each boundary and local evaporation (Table 1) shows that the PRR of the MLRYR was mainly related to the input of water vapor through the western and southern boundaries. This further suggests that the PRR of the MLRYR is mainly affected by the input of water vapor from the western and southern boundaries and local evaporation.
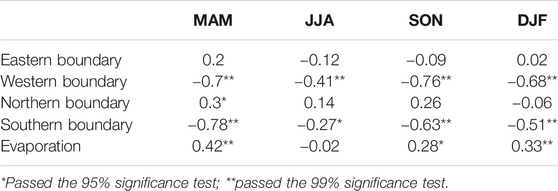
TABLE 1. Correlation coefficients between the seasonal PRR in the MLRYR and the input of water vapor through each boundary and local evaporation.
The water vapor transported into the MLRYR was mainly from the Northwest Pacific Ocean, the South China Sea and the Bay of Bengal (Figure 3), which is consistent with previous research [32, 34–37]. The input of water vapor into the MLRYR was mainly from the western and southern boundaries, with less water vapor from the northern and eastern boundaries (Figure 3).
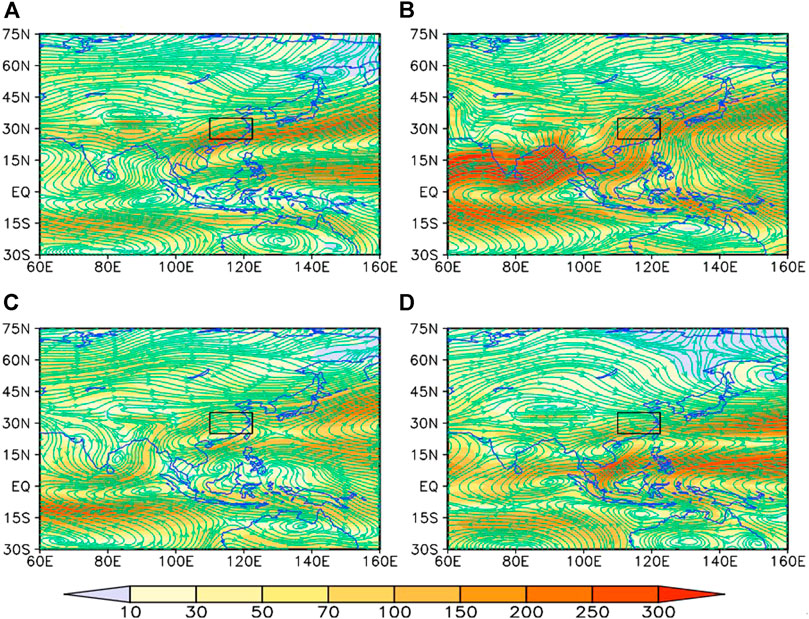
FIGURE 3. Water vapor flux of the whole layer in (A) spring, (B) summer, (C) autumn and (D) winter in the MLRYR (units: kg m−1 s−1). The vectors represent the direction of the water vapor flux in the whole layer and the color shading indicates its specific value. The black rectangular box represents the MLRYR.
Possible Reasons of the Interannual Variation of the Precipitation Recycling Rate
Anomalous Northwest Pacific anticyclones (cyclones) promote (inhibit) the transport of water vapor over the Northwest Pacific, the South China Sea and the Bay of Bengal [38, 39]. The Mongolian cyclonic (anticyclonic) anomaly promotes (inhibits) the transport of water vapor by westerly winds. The regression coefficients of the PRR and the 850 hPa wind field show that, in the lower troposphere, the PRR in the MLRYR is affected by the Northwest Pacific cyclone in every season. This means that the MLRYR is dominated by northerly winds, which inhibits the input of water vapor from the Western Pacific, the South China Sea and the Bay of Bengal. The anticyclone near Lake Baikal also weakens the input of water vapor in the zone of westerly winds. The PRR in the MLRYR is therefore higher under the combined action of the Northwest Pacific cyclone and the anticyclone near Lake Baikal. By contrast, the input of water vapor through the southern and western boundaries is promoted, which favors a lower PRR in the MLRYR (Figure 4).
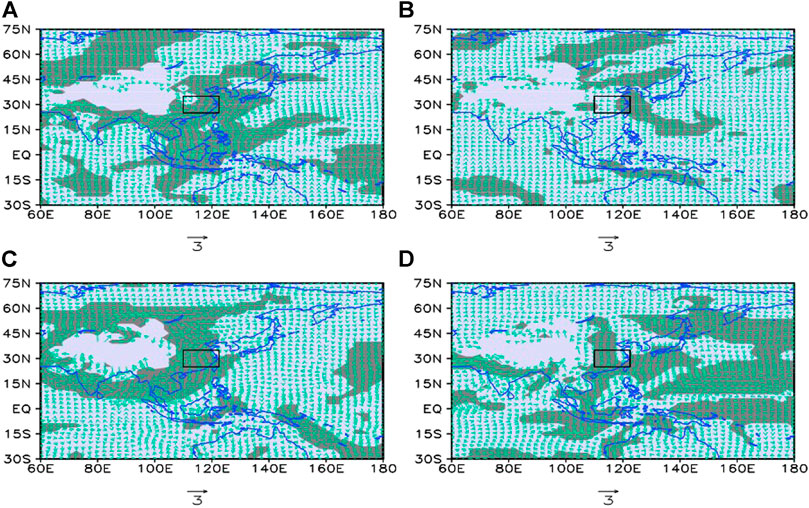
FIGURE 4. Regression coefficients of the PRR and the 850 hPa wind field in (A) spring, (B) summer, (C) autumn and (D) winter in the MLRYR [units: %/(m/s)]. The shaded area indicates that the results passed the 95% significance test and the black rectangle box represents the MLRYR.
Figure 5 shows the regression coefficient field of the PRR and the 500 hPa height field in the mid-troposphere in each season. The spatial distribution of the Northwest Pacific to East Asia continent mainly presents a “− +” pattern. Previous studies [40] have shown that when the mid- and high-latitude height field of Eurasia presents a “+ − +” distribution from west to east, then Eurasia has a “two ridges and one trough” distribution, which favors the frequent formation of a blocking high in Central Asia. The distribution of the regression field for spring and summer is similar.
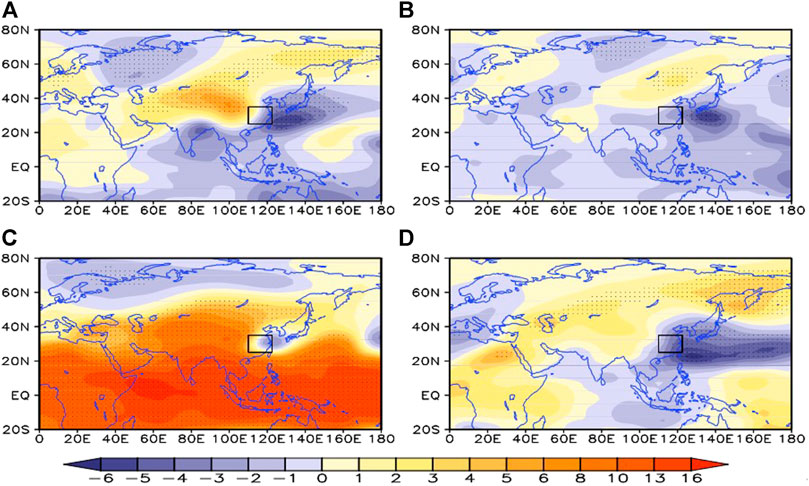
FIGURE 5. Regression coefficient field of the PRR in the MLRYR and the 500 hPa height field in (A) spring, (B) summer, (C) autumn and (D) winter in the MLRYR (units: 10–4/m). The color shading represents the regression coefficient, the dotted area represents the 95% significance test and black rectangular box represents the MLRYR.
There are significant negative anomalies in the Northwest Pacific, which weaken the Northwest Pacific subtropical high. When the Northwest Pacific subtropical high is strong, the southwesterly air flow in the west of the Northwest Pacific enhances the transport of water vapor, whereas a weak Northwest Pacific subtropical high weakens the transport of water vapor. Table 2 shows that the PRR in the MLRYR was mainly negatively correlated with the area index, intensity index and ridge index of the Western Pacific subtropical high (the correlation between the PRR and the ridge index was better). At the same time (except in autumn), East Asia showed a “+ −” dipole distribution from north to south, which suppressed the transport of water vapor to the north.
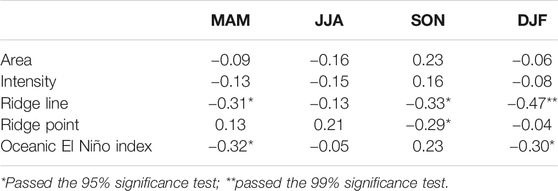
TABLE 2. Correlation coefficients of the seasonal PRR in the MLRYR with the Northwest Pacific subtropical high index (area index, intensity index, ridge line index, ridge point index) and oceanic El Niño index.
The SST is an important factor affecting the atmospheric circulation, regional precipitation and its recycling through atmospheric circulation. Previous studies have shown that the anomalous anticyclone in the Philippine Sea may be caused by the response of Rossby waves to restrained convective heating. It is induced by both in situ cooling of the ocean surface and the subsidence forced remotely by warming of the central Pacific. The development of the anticyclone almost coincides with the increased local cooling of the sea surface [41, 42].
Huang et al. [43] showed that the dynamic effect of the atmospheric circulation and zonal wind anomalies in the lower troposphere over the tropical Western Pacific on the El Niño Southern Oscillation cycle may be through the excitation of equatorial oceanic Kelvin waves and Rossby waves in the equatorial Pacific. Wu et al. [44] showed that the western North Pacific anticyclone is maintained by the combined effects of local forcing of the negative SST anomalies in the western North Pacific and remote forcing from the Indian Ocean basin mode. During the mature phase of El Niño, the convective cooling anomalies over the western tropical Pacific caused by weakened convection trigger an atmospheric Rossby wave response, resulting in the generation of the western North Pacific anticyclone [45]. The western North Pacific anticyclone can persist from the winter when El Niño is at its peak to the subsequent summer. It is maintained by a number of factors, including the sustained presence of convective cooling anomalies, the local air–sea interaction over the western tropical Pacific and the persistent SST anomalies in the tropical Indian and tropical North Atlantic oceans.
The western North Pacific anticyclone can influence atmospheric circulation over East Asia and rainfall in China, not only simultaneously, but also in the subsequent summer after an El Niño year, leading to more rainfall over southern China. The El Niño Southern Oscillation is an important system for transporting water vapor from the Northwest Pacific and the South China Sea to China. We therefore analyzed the regression coefficient field of the PRR in the MLRYR and the SST in the same time period (Figure 6). The regression field was similar to the La Niña distribution. This is shown in Table 2, where the PRR is negatively correlated with the oceanic El Niño index. The equatorial Central Eastern Pacific and the northern Indian Ocean present negative anomalies, whereas the Northwest Pacific presents positive anomalies. This suppresses the anomalous anticyclone near the Philippines and inhibits the northward transport of water vapor. The situation is the opposite in autumn and the specific reasons for this need further investigation.
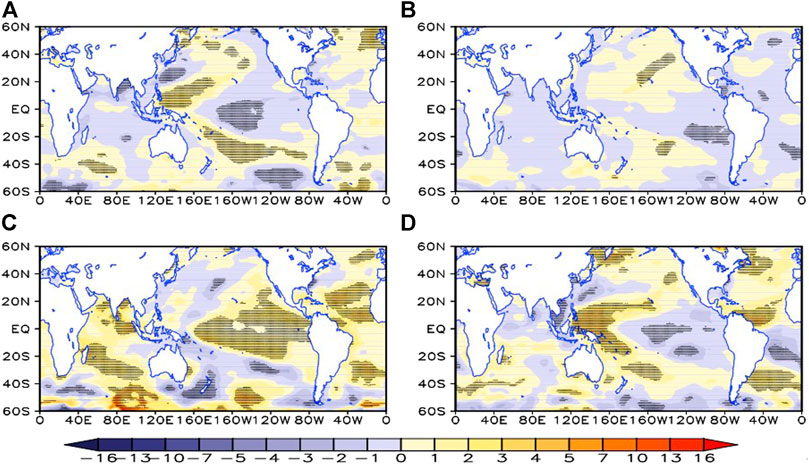
FIGURE 6. Regression coefficient field of the PRR in the MLRYR and the SST in (A) spring, (B) summer, (C) autumn and (D) winter (units: %/K). The dotted area indicates that it passed the 95% significance test.
Combined with the regression coefficient field of the PRR and the 500 hPa vertical velocity (Figure 7), the SST of the Northwest Pacific is abnormally warm, which favors ascending motion and inhibits the development of the anomalous anticyclone in the Northwest Pacific. The downdraft near Lake Baikal also favors the development of the anticyclone.
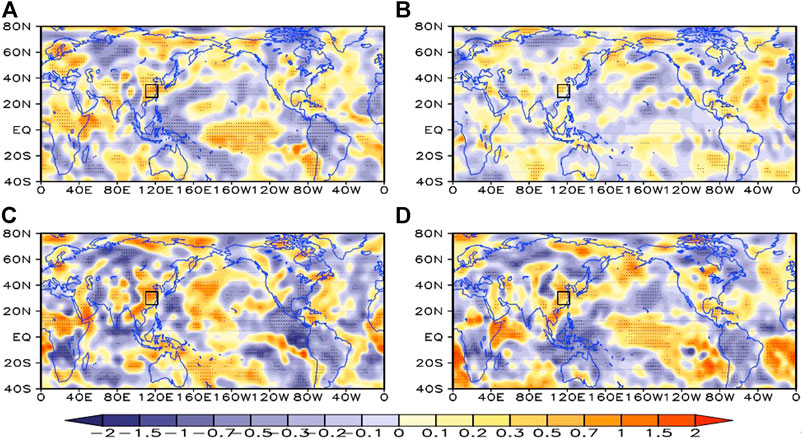
FIGURE 7. Regression coefficient field of the PRR in the MLRYR and the 500 hPa vertical velocity in (A) spring, (B) summer, (C) autumn and (D) winter [units: /(Pa/s)]. The dotted area indicates that it passed the 95% significance test and the black rectangular box represents the MLRYR.
Previous studies [46, 47] have shown that precipitation, temperature, cloud cover and wind speed are important factors affecting evaporation. In general, evaporation is higher when precipitation is abundant in arid areas, whereas there is an inverse correlation between precipitation and evaporation in humid regions such as the MLRYR [48]. Table 3 shows that the PRR of the MLRYR is inversely correlated with precipitation in all seasons, with more precipitation leading to less evaporation and a lower PRR, which also conforms to this relationship. There is a good inverse correlation between the PRR and cloud cover because more cloud cover means more precipitation in humid regions. The PRR is also related to both temperature and wind as a result of their influence on evaporation. Higher temperatures mean greater local evaporation and therefore a higher regional PRR. By contrast, a higher the wind speed leads to higher local evaporation and a higher regional PRR. There is an inverse correlation between the PRR and the surface wind speed in the MLRYR (Table 3), which may be because the influence of the monsoon on the external input of water vapor is greater than that on local evaporation.
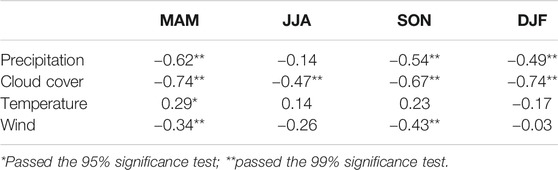
TABLE 3. Correlation coefficients of the PRR in different seasons with the local average precipitation, total cloud cover, surface temperature and surface wind speed in the MLRYR.
Discussion and Conclusion
We improved the calculation method in the previously proposed PRR evaluation model. We used precipitation data from stations in China from 1961 to 2017 and the corresponding NCEP/NCAR specific humidity and wind field reanalysis datasets to study the change in the PRR in the MLRYR. Our results showed that the PRR in the MLRYR was largest in autumn (0.3), followed by winter (0.28) and the smallest in summer (0.23). The PRR in the MLRYR showed an upward trend in all seasons (all, except summer, passed the 95% significance test). The trend coefficient of the PRR was largest (0.38) in autumn and smallest (0.09) in summer. The regression coefficient was highest in autumn (0.68%/10a), followed by winter (0.61%/10a) and the smallest in summer (0.09%/10a). The PRR showed a clear interannual variation.
We analyzed the physical factors influencing the change in the PRR in the MLRYR from the perspectives of the SST and atmospheric circulation using the reanalysis and SST datasets. We found that a high SST in the Northwest Pacific promotes local upward motion, which favors the development of cyclones and inhibits the input of water vapor from the Western Pacific, the South China Sea and the Bay of Bengal. The anomalous anticyclone near Lake Baikal inhibits the input of water vapor from westerly winds.
In the regression coefficient field of the PRR and the 500 hPa height field, the Northwest Pacific–Asian continent mainly presents a “+ −” spatial distribution, which weakens the Northwest Pacific subtropical high. By contrast, East Asia (except in autumn) presents a “+ −” dipole distribution from north to south, which inhibits the northward transport of water vapor and leads to a higher PRR in the MLRYR.
In terms of local factors, the PRR in the MLRYR is mainly affected by precipitation and cloud cover. When precipitation and cloud cover are small, evaporation is high, increasing the PRR in the MLRYR. By contrast, the PRR is low when precipitation and cloud cover are high and evaporation is low.
The anticyclonic circulation of the Northwest Pacific Ocean is the key system for the transport of water vapor from the Western Pacific, the South China Sea and the Bay of Bengal to the MLRYR. Previous studies have linked the anticyclonic circulation in the Northwest Pacific with the local wind–evaporation–SST feedback in the western North Pacific and the propagation of Kelvin waves caused by warming of the tropical Indian Ocean [41–45, 49]. However, the characteristics of the regression field of the PRR and SST in the MLRYR in autumn are almost the opposite of those in other seasons (Figure 7). Yoo [50] showed that climate change caused by global warming weakened the atmospheric response in the central Pacific during El Niño years and atmospheric feedback increased during La Niña years. Huang et al [51] showed that the response of the vertical circulation of the atmosphere to local SST anomalies may be weakened under global warming. These results may explain the abnormal situation of the regression field of the PRR and SST in autumn and require further research.
Previous studies have shown that the East Asian winter and summer monsoons have both weakened with global warming [52–55]. The MLRYR are located in the monsoon region and the weaker monsoon has led to a decrease in the input of water vapor to this region. Global warming has also increased evaporation, which favors an increase in the PRR. These factors may explain the increasing trend of the PRR in the MLRYR. The contribution and influence of different sources of water vapor on the regional precipitation were evaluated using the PRR, which provides a new perspective for analyzing the cause of precipitation and further improving our ability to predict precipitation [7]. Future work will analyze the respective roles of water vapor from external advection and local evaporation in the precipitation process and the contribution of external inputs of b water vapor and local evaporation to precipitation in different stages of the meiyu in the MLRYR on an hourly scale.
Data Availability Statement
The original contributions presented in the study are included in the article/supplementary material, further inquiries can be directed to the corresponding authors.
Author Contributions
Y-P W and G-L F were responsible for the improvement of the model of rainfall recycling rate assessment and the editing andrevision of the paper. G-L F and W-J D provided meteorological data, climate background and theoretical guidance for the middleand lower reaches of the Yangtze River. W-K G was responsible for drawing, analysis and writing of the paper. And X-Y W and W-Z G collected, sorted and analyzed the responsible data. J-H Y and X-Y B have recalculated and analyzed the data in our manuscript to demonstrate the correctness of the original results and helped to verify the language grammar and edit the references according to our editor’s commend.
Funding
This work was supported by National Key Research and Development Program of China (grant no. 2018YFE0109600, 2017YFC1502303), National Natural Science Foundation of China through grants 41875097, 41875096, High-level Talent Support Program funding of Yangzhou University and Six Talent Peaks of Jiangsu Province (Grant no. JNHB-071) and Selective Support for Scientific and Technological Activities of Overseas Scholars of Shanxi province, and Outstanding Young Talents Support Plan of Shanxi province, and College Students’ scientific innovation project (X20190247, 201911117030Z).
Conflict of Interest
The authors declare that the research was conducted in the absence of any commercial or financial relationships that could be construed as a potential conflict of interest.
Publisher’s Note
All claims expressed in this article are solely those of the authors and do not necessarily represent those of their affiliated organizations, or those of the publisher, the editors and the reviewers. Any product that may be evaluated in this article, or claim that may be made by its manufacturer, is not guaranteed or endorsed by the publisher.
References
1. Hansen J, Sato M, Ruedy R, Lo K, Lea DW, Medina-Elizade M. Global Temperature Change. Proc Natl Acad Sci (2006) 103:14288–93. doi:10.1073/pnas.0606291103
2. Su B, Xiao B, Zhu D, Jiang T. Trends in frequency of precipitation extremes in the Yangtze River basin, China: 1960-2003 / Tendances d'évolution de la fréquence des précipitations extrêmes entre 1960 et 2003 dans le bassin versant du Fleuve Yangtze (Chine). Hydrological Sci J (2005) 50:479–92. doi:10.1623/hysj.50.3.479.65022
3. Su BD, Jiang T, Jin WB. Recent Trends in Observed Temperature and Precipitation Extremes in the Yangtze River basin, China. Theor Appl Climatol (2006) 83:139–51. doi:10.1007/s00704-005-0139-y
4. Quan D, Chen X, Chen T. Characteristics and Changes of Extreme Precipitation in the Yellow-Huaihe and Yangtze-Huaihe Rivers Basins, China. J Clim (2011) 24:3781–95. doi:10.1175/2010JCLI3653.1
5. Chen H. Projected Change in Extreme Rainfall Events in China by the End of the 21st century Using CMIP5 Models. Chin Sci Bull (2013) 58:1462–72. doi:10.1007/s11434-012-5612-2
6. Feng GL, Yang J, Zhi R, Zhao J-H, Gong Z-Q, Zheng Z-H, et al. Improved Prediction Model for Flood-Season Rainfall Based on a Nonlinear Dynamics-Statistic Combined Method. Chaos, Solitons and Fractals (2020) 140:110–60. doi:10.1016/j.chaos.2020.110160
7. Brubaker KL, Entekhabi D, Eagleson PS. Estimation of continental Precipitation Recycling. J Clim (1993) 6:1077–89. doi:10.1175/1520-0442(1993)006<1077:EOCPR>2.0.CO;2
8. Dominguez F, Kumar P, Liang X-Z, Ting M. Impact of Atmospheric Moisture Storage on Precipitation Recycling. J Clim (2006) 19:1513–30. doi:10.1175/JCLI3691.1
9. Tiwari V, Tripathi JP, Upadhyay RK, Wu Y-P, Wang J-S, Sun G-Q. Predator-prey Interaction System with Mutually Interfering Predator: Role of Feedback Control, Predator–Prey Interaction System with Mutually Interfering Predator: Role of Feedback Control. Appl Math Model (2020) 87:222–44. doi:10.1016/j.apm.2020.04.024
10. Zou M, Qiao S, Feng T, Wu Y, Feng G. The Inter-decadal Change in Anomalous Summertime Water Vapor Transport Modes over the Tropical Indian Ocean-Western Pacific in the Mid-1980s. Int J Climatology (2018) 13:1–14. doi:10.1002/joc.5452
11. Wu Y-P, Feng G-L, Li B-L. Interactions of Multiple Atmospheric Circulation Drive the Drought in Tarim River Basin. Scientific Rep (2016) 6:26470. doi:10.1038/srep26470
12. Wu Y-P, Feng G-L. A New Algorithm for Seasonal Precipitation Forecast Based on Global Atmospheric Hydrological Water Budget. Appl Maths Comput (2015) 268:478–88. doi:10.1016/j.amc.2015.06.059
13. Budyko MI, Drozdov OA. Regularities of the Hydrologic Cycle in the Atmosphere. Izv Akad Nauk Sssr, Ser Geogr (1953) 4:5–14.
15. Burde GI, Zangvil A, Lamb PJ. Estimating the Role of Local Evaporation in Precipitation for a Two-Dimensional Region. J Clim (1996) 9:1328–38. doi:10.1175/1520-0442(1996)009<1328:etrole>2.0.co;2
16. Eltahir EAB, Bras RL. Precipitation Recycling in the Amazon Basin. Q.J R Met. Soc. (1994) 120:861–80. doi:10.1002/qj.49712051806
17. Eltahir EAB, Bras RL. Precipitation Recycling. Rev Geophys (1996) 34:367–78. doi:10.1029/96RG01927
18. Schär C, Lüthi D, Beyerle U. The Soil Precipitation Feedback: A Process Study with a Regional Climate Model. J Clim (1999) 12:722–41. doi:10.1175/1520-0442(1999)012<0722:TSPFAP>2.0.CO;2
19. Van der Ent RJ, Savenije HHG, Schaefli B, Steele-Dunne SC. Origin and Fate of Atmospheric Moisture over Continents. Water Resour Res (2010) 46:w09525. doi:10.1029/2010WR009127
20. Guo Y, Wang C. Trends in Precipitation Recycling over the Qinghai-Xizang Plateau in Last Decades. J Hydrol (2014) 517:826–35. doi:10.1016/j.jhydrol.2014.06.006
21. Burde GI, Zangvil A. The Estimation of Regional Precipitation Recycling. Part II: A New Recycling Model. J Clim (2001) 14:2509–27. doi:10.1175/1520-0442(2001)014<2509:TEORPR>2.0.CO;2
22. Burde GI, Gandush C, Bayarjargal Y. Bulk Recycling Models with Incomplete Vertical Mixing. Part II: Precipitation Recycling in the Amazon Basin. J Clim (2006) 19:1473–89. doi:10.1175/JCLI3688.1
23. Hai HE, Guihua LU. Precipitation Recycling in Tarim River Basin. J Hydrol Eng (2013) 18:1549–56. doi:10.1061/(ASCE)HE.1943-5584.0000503
24. Li R, Wang C, Wu D. Changes in Precipitation Recycling over Arid Regions in the Northern Hemisphere. Theor Appl Climatol (2018) 131:489–502. doi:10.1007/s00704-016-1978-4
25. Pathak A, Ghosh S, Kumar P. Precipitation Recycling in the Indian Subcontinent during Summer Monsoon. J Hydrometeorology (2014) 15:2050–66. doi:10.1175/JHM-D-13-0172.1
26. Hua L, Zhong L, Ke Z. Characteristics of the Precipitation Recycling Ratio and its Relationship with Regional Precipitation in China. Theor Appl Climatol (2017) 127:513–31. doi:10.1007/s00704-015-1645-1
27. Lan Y, Tao S. Construction and Analysis of a Precipitation Recycling Model. Adv Water Sci (1997) 8:205–11. [in Chinese]. doi:10.14042/j.cnki.32.13.9.1997.03.001
28. Fu X, Xu X, Kang H. Research on Precipitation Recycling during Meiyu Season over Middle-Lower Reaches of Changjiang River in 1998. Meteorol Sci Techn (2006) 34:394–9. [in Chinese]. doi:10.19517/j.1671-6345.2006.04.010
29. Kang H, Gu X, Zhu C, Paul W. Precipitation Recycling in Southern and Central China. Chin J Atmos Sci (2004) 28:892–900. [in Chinese]. doi:10.3878/j.issn.1006-9895.2004.06.08
30. Kalnay E, Kanamitsu M, Kistler R, Collins W, Deaven D, Gandin L, et al. The NCEP/NCAR 40-Year Reanalysis Project. Bull Am Meteorol Soc (1996) 77:437–70. doi:10.1175/1520-0477(1996)077<0437:TNYRP>2.0.CO;2
31. Su T, Feng T, Feng G. Evaporation Variability under Climate Warming in Five Reanalyses and its Association with pan Evaporation over Chinafive Reanalyses and its Association with pan Evaporation over China. J Geophys Res Atmos (2015) 120:8080–98. doi:10.1002/2014JD023040
32. Chu Q-c., Zhi R, Wang Q-g., Feng G-l. Roles of Moisture Sources and Transport in Precipitation Variabilities during Boreal Summer over East China. Clim Dyn (2019) 53:5437–57. doi:10.1007/s00382-019-04877-z
33. Shi N, Chen J, Tu Q. 4-phase Climate Change Features in the Last 100 Years over china. Acta Meteologica Sinica (1995) 53:431–9. [in Chinese].
34. Zhou T-J, Yu R-C. Atmospheric Water Vapor Transport Associated with Typical Anomalous Summer Rainfall Patterns in China. J Geophys Res (2005) 110:D08104. doi:10.1029/2004JD005413
35. Chen B, Xu X-D, Zhao T. Main Moisture Sources Affecting Lower Yangtze River Basin in Boreal Summers during 2004-2009. Int J Climatology (2013) 33:1035–46. doi:10.1002/joc.3495
36. Wang N, Zeng X-M, Guo W-D, Chen C, You W, Zheng Y, et al. Quantitative Diagnosis of Moisture Sources and Transport Pathways for Summer Precipitation over the Mid-lower Yangtze River Basin. J Hydrol (2018) 559:252–65. doi:10.1016/j.jhydrol.2018.02.003
37. Shi Y, Jiang Z, Liu Z, Li L. A Lagrangian Analysis of Water Vapor Sources and Pathways for Precipitation in East China in Different Stages of the East Asian Summer Monsoon. J Clim (2020) 33:977–92. doi:10.1175/JCLI-D-19-0089.1
38. Huang S, Huang F. Spatial-Temporal Variations of Dominant Drought/Flood Modes and the Associated Atmospheric Circulation and Ocean Events in Rainy Season over the East of China. J Ocean Univ China (2012) 11:137–46. doi:10.1007/s11802-012-1813-1
39. Yao H, Zhong Z, Zhang Y, Ding J, Yang X. Relationship between Interannual Changes of Summer Rainfall over Yangtze River Valley and South China Sea–Philippine Sea: Possible Impact of Tropical Zonal Sea Surface Temperature Gradient. Int J Climatology (2019) 39:5522–38. doi:10.1002/joc.6169
40. Sun LH, He M. The Relationship between Summer Precipitation in China and Circulation Anomaly in Eurasia and its Application in Precipitation Prediction. Acta Meteorologica Sinica (2004) 62:355–64. [in Chinese]. doi:10.3321/j.issn:0577-6619.2004.03.010
41. Wang B, Wu R, Fu X. Pacific–East Asian Teleconnection: How Does ENSO Affect East Asian Climate. J Clim (2000) 13:1517–36. doi:10.1175/1520-0442(2000)013<1517:PEATHD>2.0.CO;2
42. Wang B, Wu RG, Li T. Atmosphere-warm Ocean Interaction and its Impacts on Asian-Australian Monsoon Variation. J Clim (2003) 16:1195–211. doi:10.1175/1520-0442(2003)16<1195:AOIAII>2.0.CO;2
43. Huang R, Wen C, Yang B, Zhang R. Recent Advances in Studies of the Interaction between the East Asian Winter and Summer Monsoons and ENSO Cycle. Adv Atmos Sci (2004) 21:407–24. doi:10.1007/BF02915568
44. Wu B, Li T, Zhou T. Relative Contributions of the Indian Ocean and Local SST Anomalies to the Maintenance of the Western North Pacific Anomalous Anticyclone during the El Niño Decaying Summer*. J Clim (2010) 23:2974–86. doi:10.1175/2010JCLI3300.1
45. Zhang R, Min Q, Su J. Impact of El Niño on Atmospheric Circulations over East Asia and Rainfall in China: Role of the Anomalous Western North Pacific Anticyclone. Sci China Earth Sci (2017) 60:1124–32. doi:10.1007/s11430-016-9026-x
46. Davarzani H, Smits K, Tolene RM, Illangasekare T. Study of the Effect of Wind Speed on Evaporation from Soil through Integrated Modeling of the Atmospheric Boundary Layer and Shallow Subsurface. Water Resour Res (2014) 50:661–80. doi:10.1002/2013WR013952
47. Wang J, Wang Q, Zhao Y, Li H, Zhai J, Shang Y. Temporal and Spatial Characteristics of pan Evaporation Trends and Their Attribution to Meteorological Drivers in the Three-River Source Region, China. J Geophys Res Atmos (2015) 120:6391–408. doi:10.1002/2014JD022874
48. Li N, Li Y, Yao N. Bias Correction of the Observed Daily Precipitation and Re-division of Climatic Zones in China. Int J Climatol (2018) 38:3369–87. doi:10.1002/joc.5506
49. Xie S-P, Hu K, Hafner J, Tokinaga H, Du Y, Huang G, et al. Indian Ocean Capacitor Effect on Indo-Western Pacific Climate during the Summer Following El Niño. J Clim (2009) 22:730–47. doi:10.1175/2008JCLI2544.1
50. Ham Y-G. A Reduction in the Asymmetry of ENSO Amplitude Due to Global Warming: The Role of Atmospheric Feedback. Geophys Res Lett (2017) 44:8576–84. doi:10.1002/2017GL074842
51. Huang P, Chen D, Ying J. Weakening of the Tropical Atmospheric Circulation Response to Local Sea Surface Temperature Anomalies under Global Warming. J Clim (2017) 30:8149–58. doi:10.1175/JCLI-D-17-0171.1
52. Hori ME, Ueda H. Impact of Global Warming on the East Asian winter Monsoon as Revealed by Nine Coupled Atmosphere-Ocean GCMs. Geophys Res Lett (2006) 33:L03713. doi:10.1029/2005GL024961
53. Liu J, Xu H, Deng J. Projections of East Asian Summer Monsoon Change at Global Warming of 1.5 and 2 °C. Earth Syst Dynam (2018) 9:427–39. doi:10.5194/esd-9-427-2018
54. Gong H, Wang L, Zhou W, Chen W, Wu R, Liu L, et al. Revisiting the Northern Mode of East Asian Winter Monsoon Variation and its Response to Global Warming. J Clim (2018) 31:9001–14. doi:10.1175/JCLI-D-18-0136.1
Keywords: the middle and lower reaches of the Yangtze River, precipitation recycling rate, water vapor flux, regression analysis, influence mechanism
Citation: Guo W-K, Wang X-Y, Gao W-Z, Yong J-H, Bao X-Y, Wu Y-P, Feng G-L and Dong W-J (2021) The Physical Mechanisms Behind the Change in the Precipitation Recycling Rate in the Mid- and Lower Reaches of the Yangtze River. Front. Phys. 9:688801. doi: 10.3389/fphy.2021.688801
Received: 31 March 2021; Accepted: 21 May 2021;
Published: 23 July 2021.
Edited by:
Umberto Lucia, Politecnico di Torino, ItalyReviewed by:
Kaiming Hu, Institute of Atmospheric Physics (CAS), ChinaBo Sun, Nanjing University of Information Science and Technology, China
Copyright © 2021 Guo, Wang, Gao, Yong, Bao, Wu, Feng and Dong. This is an open-access article distributed under the terms of the Creative Commons Attribution License (CC BY). The use, distribution or reproduction in other forums is permitted, provided the original author(s) and the copyright owner(s) are credited and that the original publication in this journal is cited, in accordance with accepted academic practice. No use, distribution or reproduction is permitted which does not comply with these terms.
*Correspondence: Yong-Ping Wu, ypwu@yzu.edu.cn; Guo-Lin Feng, fenggl@cma.gov.cn