the Creative Commons Attribution 4.0 License.
the Creative Commons Attribution 4.0 License.
 | 18 May 2021
Attenuation of plasmaspheric hiss associated with the enhanced magnetospheric electric field
Qianli Ma
Yukitoshi Nishimura
Zhigang Yuan
Alex J. Boyd
Xiaochen Shen
Rongxin Tang
Xiaohua Deng
We report an attenuation of hiss wave intensity in the duskside of the outer plasmasphere in response to enhanced convection and a substorm based on Van Allen Probe observations. Using test particle codes, we simulate the dynamics of energetic electron fluxes based on a realistic magnetospheric electric field model driven by solar wind and subauroral polarization stream. We suggest that the enhanced magnetospheric electric field causes the outward and sunward motion of energetic electrons, corresponding to the decrease of energetic electron fluxes on the duskside, leading to the subsequent attenuation of hiss wave intensity. The results indicate that the enhanced electric field can significantly change the energetic electron distributions, which provide free energy for hiss wave amplification. This new finding is critical for understanding the generation of plasmaspheric hiss and its response to solar wind and substorm activity.


Plasmaspheric hiss is a structureless, extremely low-frequency (ELF) whistler-mode wave that is found primarily in the plasmasphere (Russell et al., 1969; Thorne et al., 1973) and plasmaspheric plumes (Chan and Holzer, 1976; Shi et al., 2019; Yuan et al., 2012; Hayakawa et al., 1986). Hiss waves are broadband emissions with frequencies typically between 100 Hz and 2 kHz (Meredith, 2004; Khazanov et al., 2004; Thorne et al., 1973). However, recent studies indicate that hiss wave frequencies can extend below 100 Hz during strong substorm activities (W. Li et al., 2013, 2015b, H. Li et al., 2015; Ni et al., 2014). Hiss waves can scatter energetic electrons into the loss cone, thereby playing an important role in energetic electron dynamics in the radiation belt (Ma et al., 2016; Meredith et al., 2006, 2007, 2009; Su et al., 2011; Thorne et al., 2013). The mechanism of hiss wave generation is still under active research. Two main generation mechanisms have been proposed: (1) external origination, propagation effects of the whistler-mode chorus from the plasmatrough (Bortnik et al., 2008, 2009; W. Li et al., 2015a; Su et al., 2015) or lightning generated whistler (Draganov et al., 1992; Green et al., 2005); and (2) internal generation, excitation due to local electron cyclotron resonance instability inside the plasmasphere or plasmaspheric plume (Chen et al., 2014; Su et al., 2018; Summers et al., 2014; Thorne et al., 1979). Shi et al. (2019) suggest that the hiss waves in the outer plasmasphere tend to be locally amplified, whereas the hiss waves at the lower L shells may propagate from higher L shells. The Poynting flux of hiss directed away from the Equator provides evidence of internal local generation of hiss waves (He et al., 2019; Kletzing et al., 2014; Laakso et al., 2015; Su et al., 2018). In contrast, the bidirectional Poynting flux of hiss waves implies that local electron instability is relatively weak, and the observed hiss waves mainly originate from chorus waves (Liu et al., 2017a, b).
A large-scale dawn–dusk convection electric field is produced in the inner magnetosphere due to the motional solar wind electric field ), where V is the solar wind velocity, and B is the interplanetary magnetic field (Lei et al., 1981). Since the ESW is mapped along the geomagnetic field lines and penetrates into the magnetosphere (Huang et al., 2007; Toffoletto and Hill, 1989), Goldstein et al. (2005a) suggest that the electric field at the plasmapause was approximately 13 % of ESW. Besides the global contribution of ESW, the ionospheric subauroral polarization stream (SAPS) is potentially an important contributor to the magnetospheric electric field near the duskside (Goldstein et al., 2003, 2005b, a). The SAPS is the westward flow located at ∼ 3–5∘ of magnetic latitude below the auroral oval near the duskside. The ionospheric SAPS electric field can be mapped to the magnetic equatorial plane as radial electric fields. In general, the SAPS is related to the substorm and intensifies within ∼ 10 min after the substorm onset (Mishin and Mishin, 2007). It has been known that the dawn–dusk convection electric field plays an important role in the motions of charged particles through the E×B drift, especially during strong geomagnetic activity (Burch, 1977; Ejiri, 1978; Frank, 1975). Using an improved electric field model driven by ESW and SAPS, Goldstein et al. (2003) simulated the evolution of the plasmapause location, which is found to be very similar to the plasmapause produced by the IMAGE extreme ultraviolet imager.
In this paper, we report an interesting event where plasmaspheric hiss intensity decreased, associated with the enhanced convection and substorm activity on 27 August 2013. Using test particle simulations based on the realistic electric field model, we provide direct evidence that the enhanced magnetospheric electric field can contribute to the attenuation of hiss wave intensity on the duskside.
The twin Van Allen Probes with perigee and apogee of about 1.1 and 5.8 RE measure both hiss waves and energetic electron fluxes (Mauk et al., 2012). In this study, data from the Electric and Magnetic Field Instrument Suite and Integrated Science (EMFISIS) instrument are utilized to measure hiss waves (Kletzing et al., 2013), and the data from the Electric Fields and Waves (EFW) instrument are utilized to measure electric fields (Walsh et al., 2013). Moreover, we use the data from the Magnetic Electron Ion Spectrometer (MagEIS) and the Helium Oxygen Proton Electron (HOPE) spectrometer to analyze in situ energetic electron distributions (Blake et al., 2013; Funsten et al., 2013; Spence et al., 2013).
The Defense Meteorological Satellite Program (DMSP) satellites orbit around the Earth at an altitude of about 850 km and measure the ion drift velocities in both horizontal and vertical directions perpendicular to the satellite orbit (Rich and Hairston, 1994). In this study, the data of DMSP F17 are used to identify the SAPS event. Furthermore, we use the 1 min resolution OMNI data to analyze the solar wind parameters, including the interplanetary magnetic field (IMF).
Figure 1 shows the overview of solar wind parameters and geomagnetic indices for the event which occurred from 14:30 to 17:40 UT on 27 August 2013. Following the enhanced southward IMF (Fig. 1a), ESW (Fig. 1e) evidently increased at ∼ 15:53 UT and reached >2 mV/m after 16:30 UT. As shown by AL and SYM-H indices (Fig. 1f and g), the strong southward IMF triggered a substorm, which occurred during the initial and main phases of a geomagnetic storm. Since the large-scale magnetospheric dawn–dusk convection electric field is produced mainly due to the penetration of ESW (Huang et al., 2007; Lei et al., 1981; Toffoletto and Hill, 1989), the magnetospheric electric field is also expected to be enhanced during this time interval.

Figure 1Solar wind and geomagnetic parameters from 14:30 to 17:40 UT on 27 August 2013. (a) Three components of IMF in GSM coordinates. (b) Solar wind dynamic pressure, (c) proton density, (d) solar wind velocity, and (e) convection electric field of solar wind. (f) AL index and (g) SYM-H index. The vertical line indicates the time when the solar wind convection electric field started to increase.
Figure 2a–g show the observation of Van Allen Probe A from 14:00 to 16:30 UT. The measurement of total electron density (Fig. 2a) with a high value (>60 cm−3) before 16:20 UT implies that the Van Allen Probe A was inside the duskside plasmasphere during this time interval. Strong plasmaspheric hiss waves (Fig. 2b–e) were observed over 14:00–16:30 UT, together with magnetosonic waves (MS) at low frequencies (below 90 Hz), whose ellipticity is close to zero and wave normal angle is close to 90∘. Figure 2e illustrates the angle between the Poynting flux and the ambient magnetic field. Here, 0∘ (180∘) indicates that the Poynting flux is parallel (antiparallel) to the magnetic field. Interestingly, the plasmaspheric hiss waves at different L shells reveal different characteristics. At lower L shells (L<4.67, prior to 15:00 UT), the Poynting flux of hiss waves is mainly bidirectional at most times, which implies that the observed hiss waves may have mainly originated from the chorus waves outside the plasmasphere and experienced multiple reflections inside the plasmasphere (Bortnik et al., 2008, 2009; Liu et al., 2017a, b). However, at higher L shells (L>4.67, after 15:00 UT), the Poynting flux is mostly directed away from the Equator, the ellipticity of hiss is extremely high (>0.9), and wave normal angles are very small (<15∘). All these features imply that the hiss waves at higher L shells are likely locally amplified near the equatorial region (He et al., 2019; Kletzing et al., 2014; Laakso et al., 2015; Su et al., 2018).

Figure 2Overview of observations from Van Allen Probes A (left) over 14:00–16:30 UT and B (right) over 16:00–18:20 UT on 27 August 2013. (a) Total electron density. (b) Magnetic spectral density, where the dashed black line represents 0.1 fce, and the solid black lines indicate the lower and upper cutoff frequencies of hiss waves. (c) Ellipticity, (d) wave normal angle, (e) the angle between Poynting flux and ambient magnetic field. (f) Omnidirectional electron fluxes from MagEIS and HOPE, where the solid black curve indicates the Emin corresponding to the lower cutoff frequency of the observed hiss. (g) Convective linear wave growth rates calculated for various frequencies, where the solid white lines represent lower and upper cutoff frequency of the observed hiss waves while L>4.67. (h–n) The same as (a–g) but for the Van Allen Probe B observation.
The energetic electron fluxes in different energies measured by MagEIS (>∼30 keV) and HOPE (11–30 keV) are merged and presented in Fig. 2f. The electron minimum cyclotron resonant energies (Emin) for the lower cutoff frequency of plasmaspheric hiss (marked by the solid black curves in Fig. 2b–e) are calculated and presented as the black curve in Fig. 2f. There is a clear characteristic separation between hiss waves at lower L shells (L<4.67) and those at higher L shells (L>4.67). The calculated Emin is higher than the measured electron energies before 15:00 UT (L>4.67), which suggests that the hiss waves are hardly locally generated. By contrast, the Emin agrees well with the measured electron energies at higher L shells (L>4.67). It supports the suggestion that the hiss waves at higher L shells may be locally amplified. Using measured electron pitch angle distribution and plasma parameters, we calculate the convective linear growth rates for parallel-propagating whistler-mode waves with various frequencies (Kennel and Petschek, 1966; Summers et al., 2009). The linear wave growth rate (Fig. 2g) shows positive values at higher L shells (>4.67), and the frequency range of high positive growth rate agrees fairly well with the hiss waves observed at higher L shells. At lower L shells (<∼4.67), only the high-frequency portion shows the positive growth rates, indicating local amplification. This feature is roughly consistent with the Poynting flux direction (Fig. 2e), where only the high-frequency portion (> several hundred hertz, Hz) exhibits the Poynting flux directed away from the Equator.
Figure 2h–n show the observation of Van Allen Probe B from 16:00 to 18:20 UT. Van Allen Probe B passed through the same region at ∼ 2 h later than the observation by Probe A (Fig. 2a–g). At the same L shell, the change in total electron density was very small. Interestingly, compared to the observation of Probe A (Fig. 2f), there was a very clear decrease in energetic electron fluxes at >∼10 keV at higher L shells (Fig. 2m). Furthermore, the electron flux at >∼25 keV decreased earlier and more significantly than that at <∼25 keV. At higher L shells, in association with the decrease in energetic electron fluxes, the corresponding linear growth rate became much lower, especially at frequencies <0.1 fce. Except for the waves at higher frequencies (>0.1 fce), which propagate away from the Equator (Fig. 2l), the Poynting flux of the plasmaspheric hiss was bidirectional. Interestingly, linear growth rates (Fig. 2n) show positive values for these high-frequency hiss waves (>0.1 fce), suggesting local amplification, which is consistent with their Poynting flux direction (Fig. 2l). It is important to note that the intensity of plasmaspheric hiss became very weak over the L shells of ∼ 4.5–5.5. This suggests that the local amplification of plasmaspheric hiss was reduced, owing to the decreased electron flux, which provides a source of free energy for hiss amplification.
Previous studies have reported that the plasmaspheric hiss on the dayside could become weaker or disappear following the interplanetary shock arrival due to enhanced Landau damping, which prevented chorus waves from entering the plasmasphere (Su et al., 2015; Yue et al., 2017). In this study, the plasmaspheric hiss event on 27 August 2013 was observed on the duskside. Although there were some variations in solar wind dynamic pressure, the attenuation of duskside plasmaspheric hiss wave intensity at higher L shells is likely caused by the decrease of energetic electron fluxes, which provide free energy for cyclotron resonance. Since the timescale of energetic electron loss due to hiss-induced pitch angle scattering is 1 to 100 d (Ni et al., 2013), the rapid loss in electron flux cannot be caused by the hiss wave scattering. After 15:53 UT, the enhanced southward interplanetary magnetic field resulted in intense ESW and triggered a substorm, which further enhanced the magnetospheric electric field. The intense magnetospheric electric field can drive charged particles to move sunward and outward (Khazanov et al., 2004) and lead to the significant decrease of energetic electron flux along the Van Allen Probes' orbit within a short time.
Following Goldstein et al. (2003) and Goldstein et al. (2005a), we built a magnetospheric model for the electric potential. In the model, except for the co-rotating electric potential Φrot,
the major parts are the convection electric potential and SAPS potential. The convection electric potential ΦVS is determined by ESW,
where A is equal to 0.13, R is the geocentric distance, φ is the azimuthal angle, and RE is the radius of the Earth. Following Goldstein et al. (2003), we consider a time delay between the detected ESW and its effect on magnetospheric electric field. In this study, ESW data from OMNI are delayed by ∼ 5 min, which is shown in Fig. 3a.
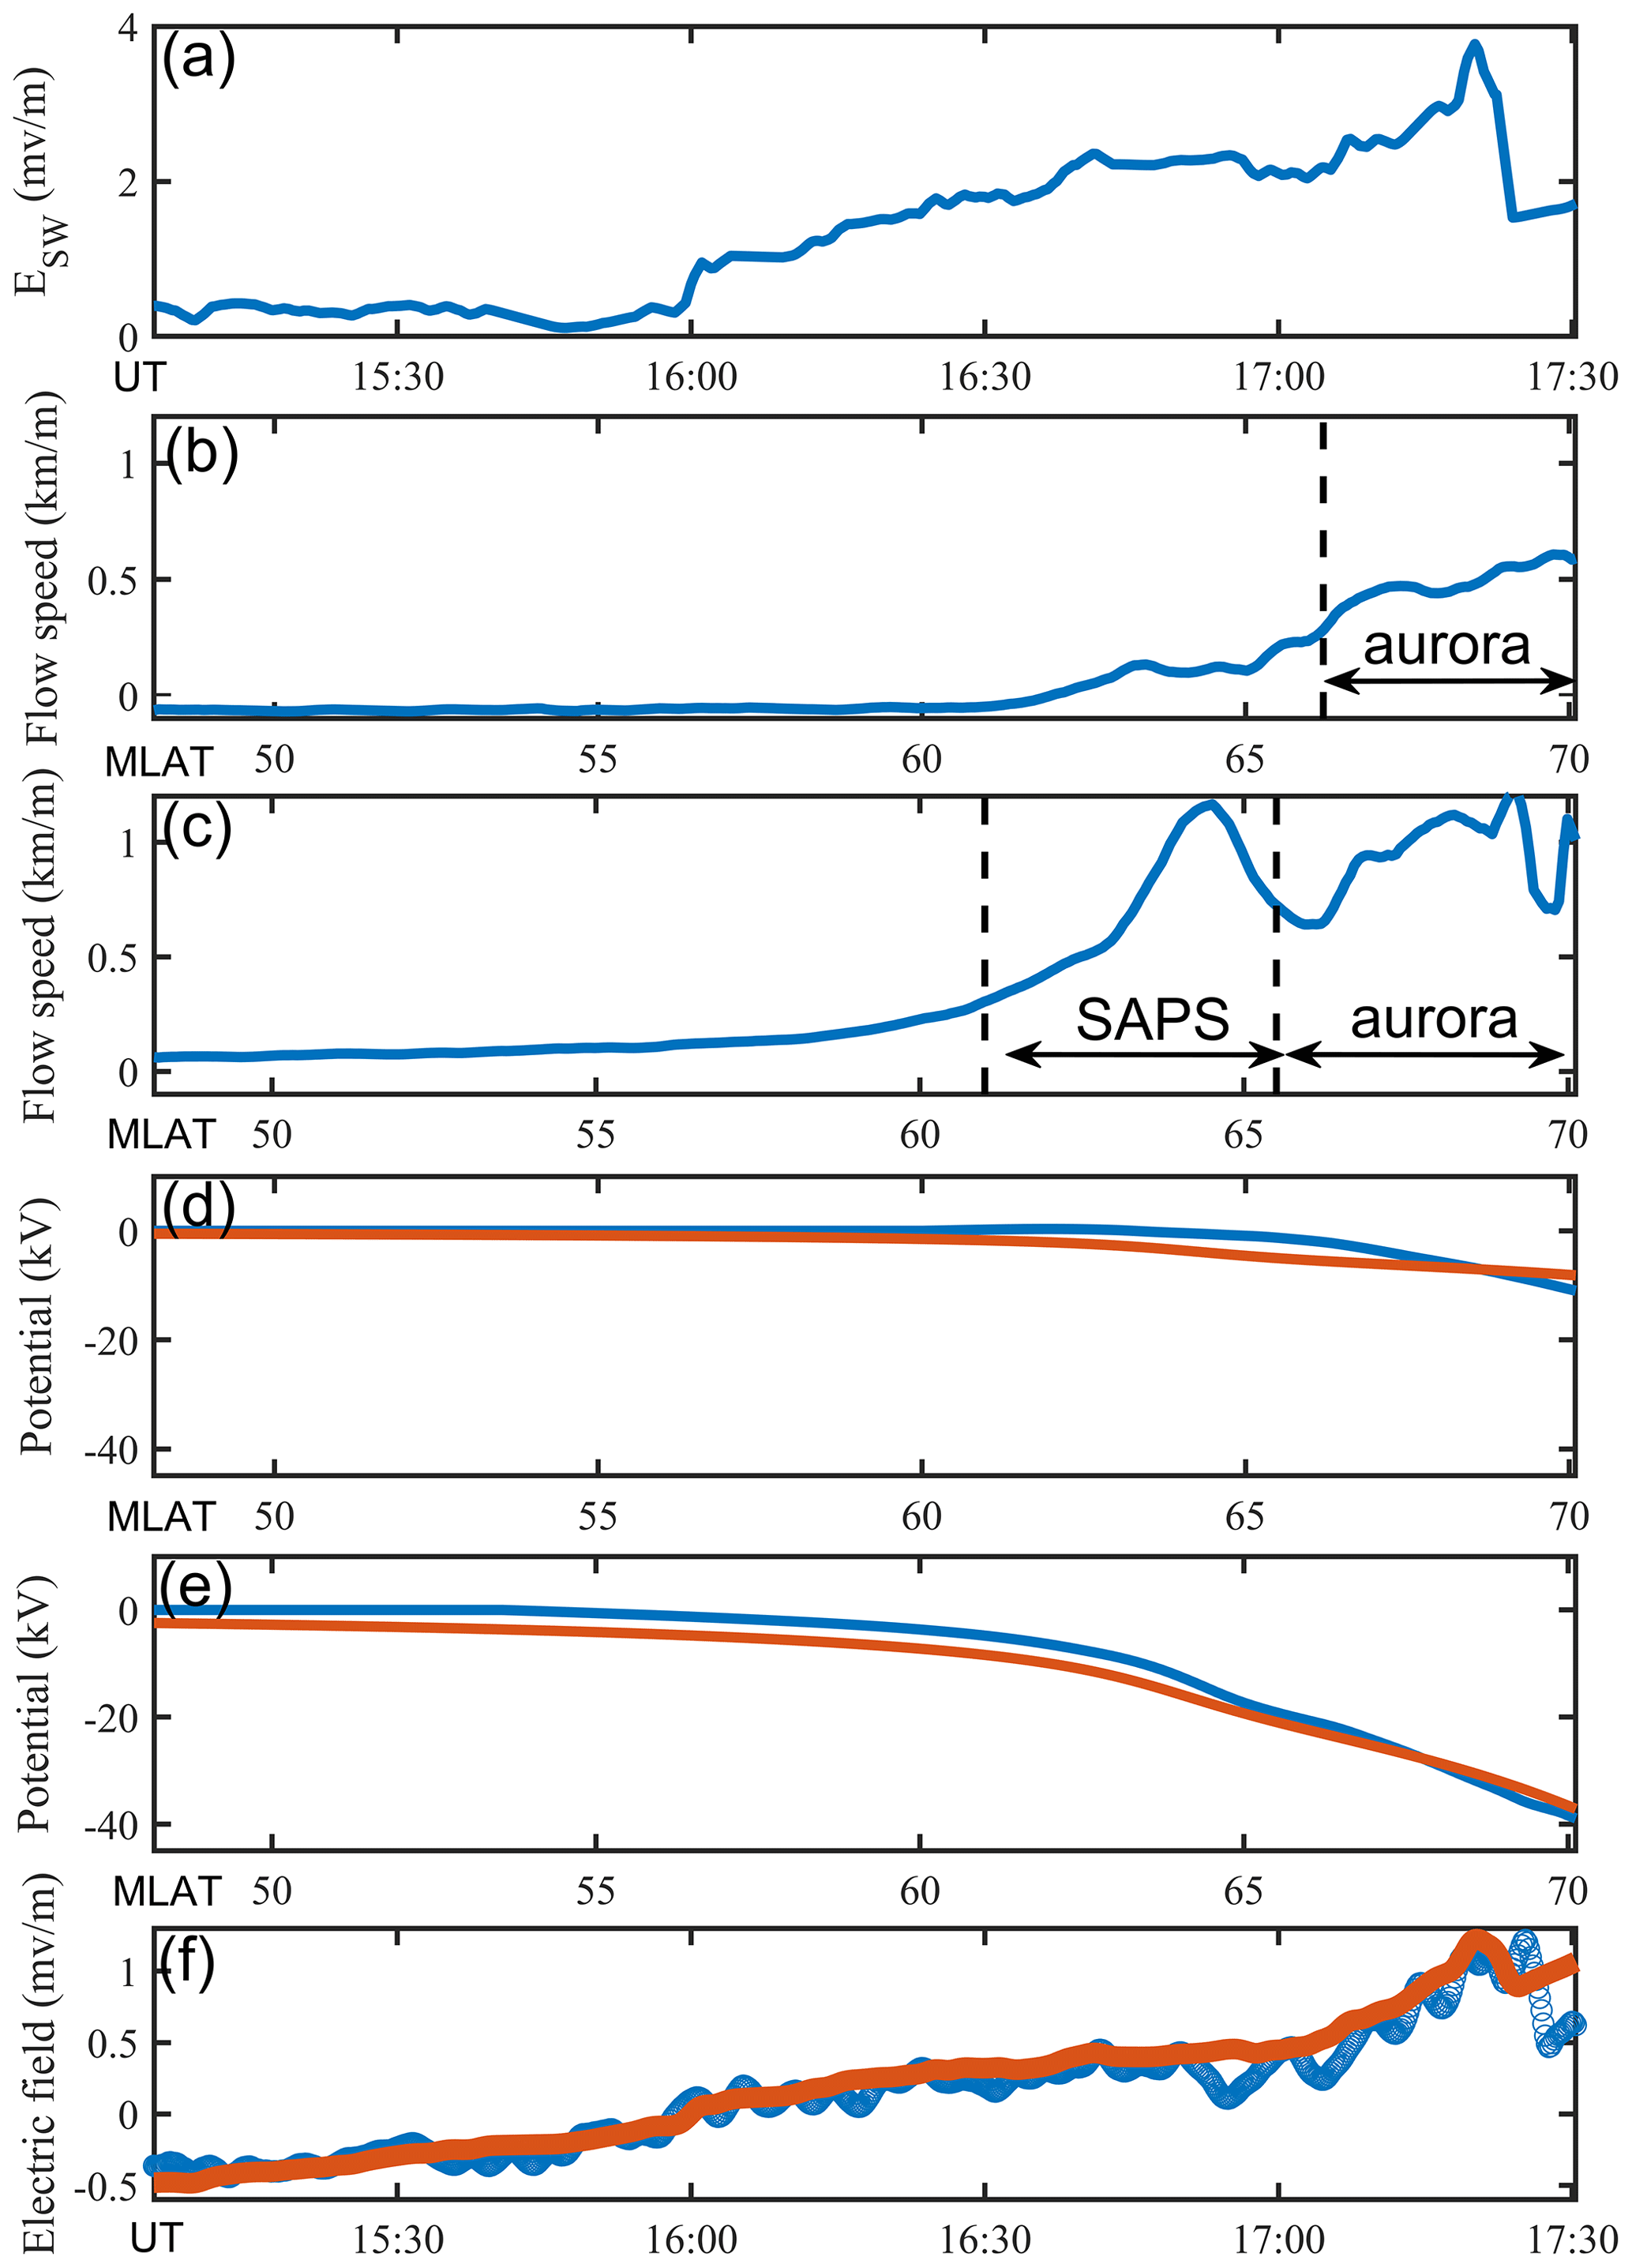
Figure 3(a) The ESW data from OMNI but delayed by 5 min. (b) The flow speed detected by DMSP F17 from 15:16 to 15:22 UT at MLT ∼ 17.2 h. (c) The flow speed detected by DMSP F17 from 16:58 to 17:03 UT at MLT ∼ 17.5. The SAPS region is indicated by the two vertical dashed lines. (d) The DMSP-measured electric potential (blue curve) and the modeled electric potential (red curve) from 15:16 to 15:22 UT. (e) The same as (d) but from 16:58 to 17:03 UT. (f) The measured electric field in the dawn–dusk direction by Van Allen Probe A (blue curve) and the modeled electric field along the trajectory of Van Allen Probe A (red curve).
The SAPS associated with substorm can also evidently enhance the electric field near the duskside. From 15:16 to 15:22 UT, the horizontal flow speed V (and minimal convection) recorded by DMSP F17 at the magnetic local time (MLT) of ∼ 17.2 (before the enhancement of southward IMF and onset of substorm) was small (Fig. 3b). The SAPS on the equatorward side of the auroral oval was not evident. Subsequently, the horizontal V recorded by DMSP F17 from 16:58 to 17:03 UT at ∼ 17.5 MLT (during the enhancement of southward of IMF and substorm) increased significantly with the peak flow speed >1 km/m, indicating a strong SAPS event (marked by two vertical dashed lines in Fig. 3c).
In this study, the effect of SAPS on the magnetospheric equatorial electric potential ΦS is calculated by
where F(R,φ) is a function to describe the radial dependence.
where RS indicates the radial distance where the peak radial electric field occurs.
where α indicates the width of the peak,
G(φ) is used to model the azimuthal dependence of the potential drop:
We consider the SAPS potential with parameters [β, κ, , RE, ].
VS(t) describes the time dependence of magnetospheric equatorial SAPS potential, which is
where t is the UT in hours.
In order to compare the modeled and the actual electric fields, the modeled electric potential along the F17's orbits during the intervals both from 15:16 to 15:22 UT and from 16:58 to 17:03 UT are calculated using a dipolar magnetic field, as indicated by the red curves in Fig. 3d and e, respectively. In addition, the actual F17 electric potentials relative to the electric potential at MLT ∼ 50∘ (assumed as 0 at ∼ 50∘) are indicated by the blue curves in Fig. 3d and e, respectively. The actual electric potentials are calculated through the integration of V×B along the F17's orbit, where B is the downward component of geomagnetic field. Although there is a slight difference between the modeled and actual potentials, the potential drop is quite close. It suggests that the potential drop is small before the enhancement of southward IMF (as shown in Fig. 3d). However, the potential drop is large during the enhancement of southward IMF (as shown in Fig. 3e), which implies that the electric field dramatically strengthened. Furthermore, the modeled and detected magnetospheric electric fields in the dawn–dusk direction along the trajectory of Probe A are indicated by the red and blue curves in Fig. 3f, respectively. It suggests that the modeled magnetospheric electric field is very similar to the observed electric field, and there is a clear trend that the magnetospheric electric field varied following the enhancement of ESW.
Using the modeled time-varying electric field, we simulate the evolution of energetic electron distributions. Here the geomagnetic field is assumed as a dipolar field, and electron motion is assumed to be adiabatic. We calculate the drift velocity as a combination of the velocity due to E×B drift and the bounce-averaged velocity due to gradient and curvature drifts (Roederer, 1970; Ganushkina et al., 2005). In this study, the evolution of electron flux distributions at lower energies from 11 to 21 keV and higher energies from 51 to 61 keV (representing energy <∼25 keV and energy >∼25 keV) is simulated, respectively.
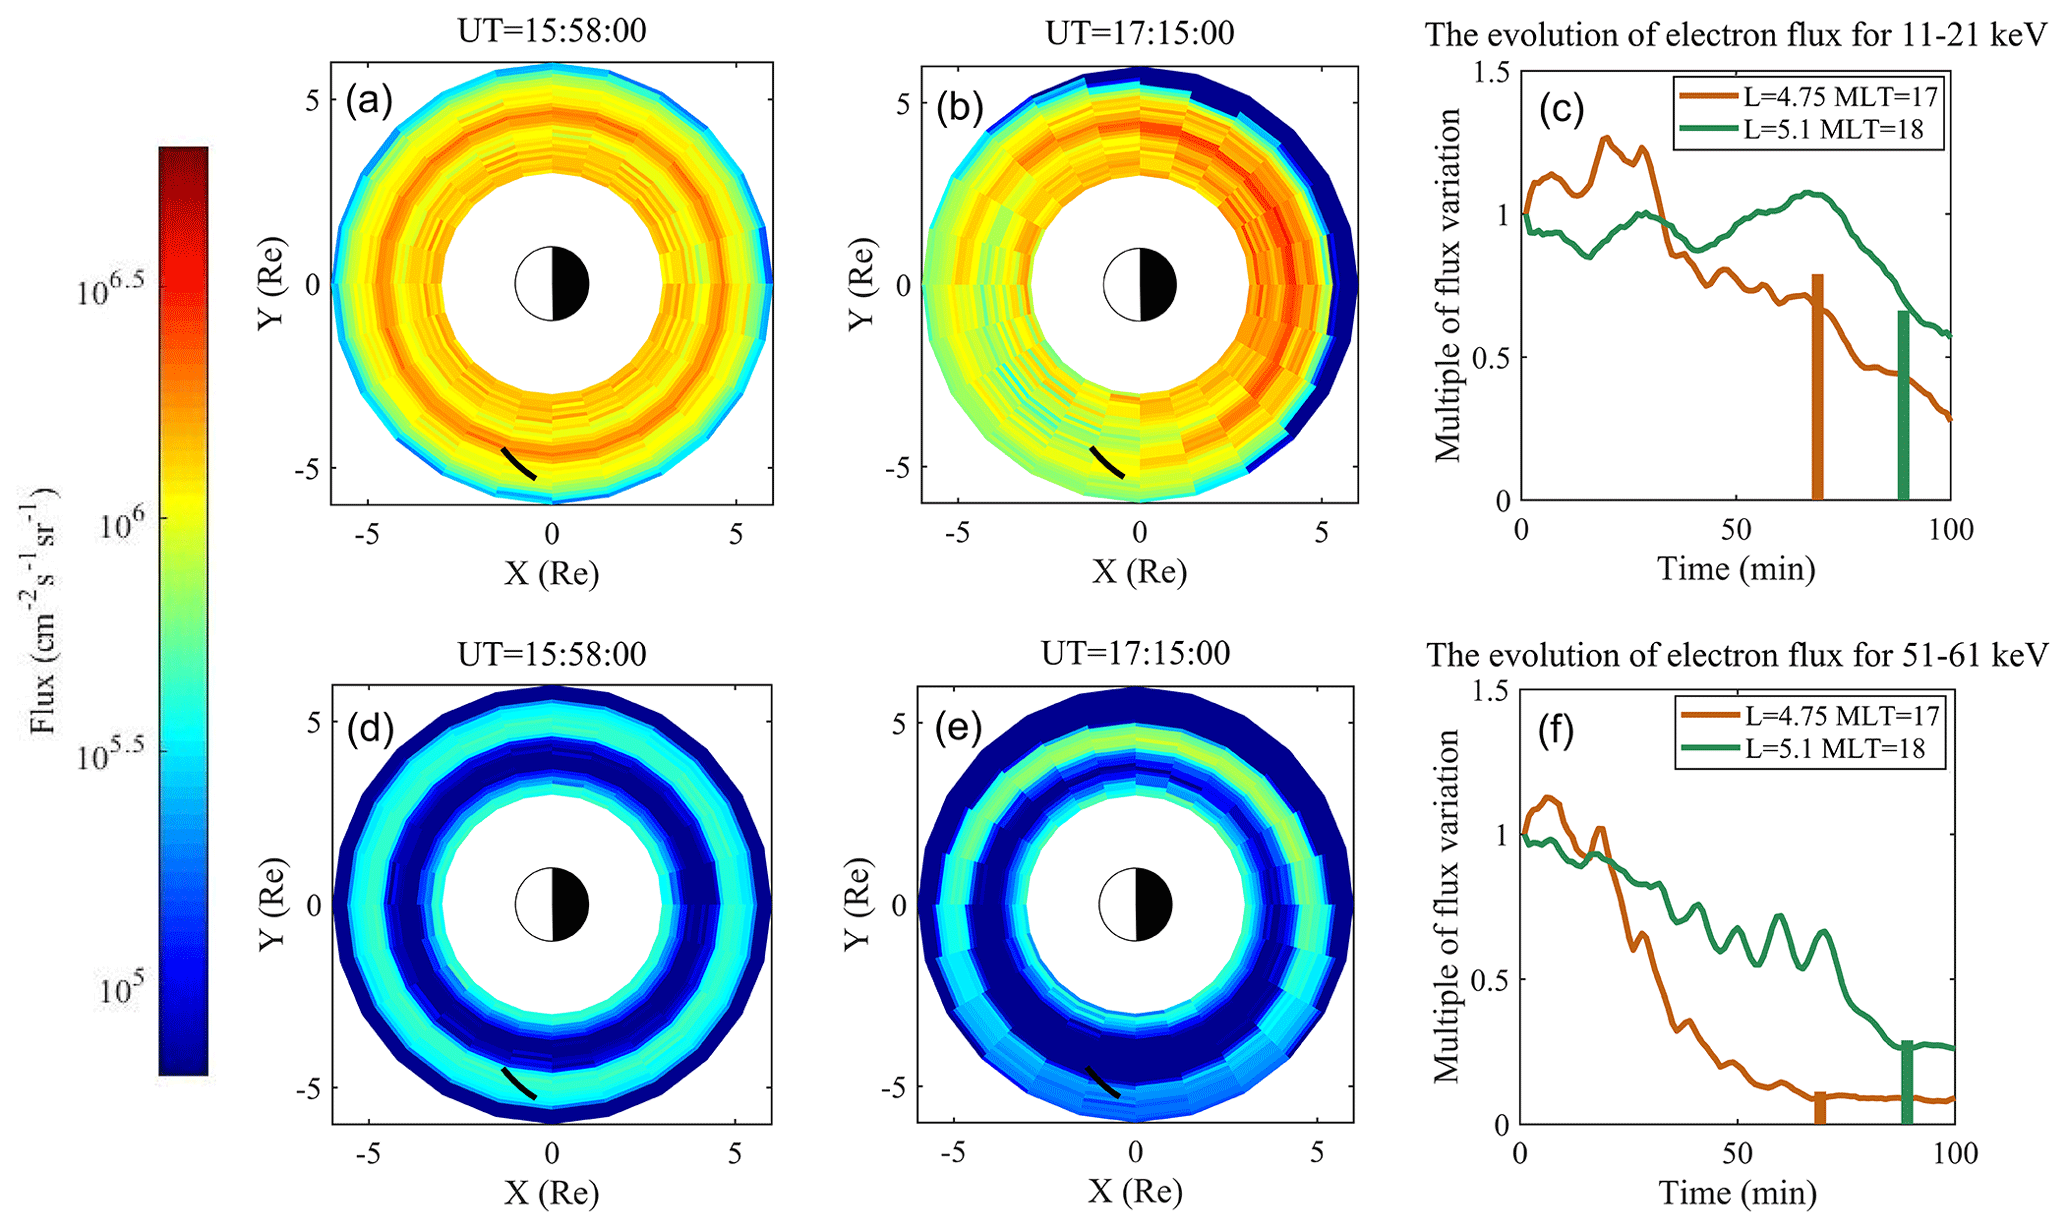
Figure 4The comparison between the observed and simulated electron flux. (a) The simulation of electron flux distribution with energies from 11 to 21 keV at 15:58 UT. The trajectory of the Van Allen Probes is indicated by the solid black curve. (b) The evolved electron distribution with initial energies from 11 to 21 keV at 17:15 UT. (c) The normalized variations of electron fluxes with the energies from 11 to 21 keV as a function of time after 15:58 UT at L ∼ 4.75 (L ∼ 5.1) are indicated by the brown (green) curves. The vertical bars indicate the detected normalized variation of electron fluxes at the corresponding times when Van Allen Probe B passed through L ∼ 4.75 (L ∼ 5.1). (d–f) The same as (a–d) but for the electrons with the initial energies from 51 to 61 keV.
In order to obtain the initial electron flux distribution function, the observed flux distribution of energetic electrons (at each energy channel measured by Probe A from ∼ 14:00 to 16:10 UT) as a function of L shell is fitted with the summation of several Maxwellian functions. And then, the fitted flux distribution is interpolated at 1 keV steps. The distribution achieved by the above method is considered as the initial energetic electron distribution. There may be a temporal evolution of energetic electrons within the time interval from 14:00 to 16:10 UT. However, we consider that the variation during this time interval is relatively small because the ESW is very low in most of this time interval. Moreover, the electron flux distribution is assumed to be the same at different MLTs. Since the results of simulation for different initial pitch angles are similar, the evolution of electrons with initial pitch angle at 45∘ is presented here. As shown in Fig. 4a, the electrons at energies from 11 to 21 keV are assumed to be evenly distributed across all MLTs and distributed along the L shells using a function presented in Fig. 2f. The simulation of energetic electron flux is initialized at 15:58 UT, when the delayed ESW started to increase (Fig. 3a). The trajectory of the Van Allen Probes is denoted by the black curve. The evolved distribution at 17:15 UT is shown in Fig. 4b. Although the sunward motions of electrons could be seen both on the dayside and nightside, this trend is more notable on the duskside. Furthermore, there is also an evident outward motion on the duskside. To explicitly display the evolution of electron flux along the satellite orbit, the normalized percentage changes in modeled electron fluxes (at L∼4.75, MLT ∼ 17 and L∼5.1, MLT ∼ 18) varying with time (staring at 15:58 UT) are shown in Figure 4c. The electron flux decreases at both L ∼ 4.75 and L ∼ 5.1. In Fig. 4c, the detected normalized variations of electron fluxes at the corresponding times when Van Allen Probe B passed through are indicated by the vertical bars (17:04 UT for L∼4.75 and 17:26 UT for L∼5.1).
The evolution of electron flux at energies from 51 to 61 keV is shown in Fig. 4d–f, which exhibit a distinct slot region at L∼4. After the evolution of 77 min, as presented in Fig. 4e, the inner belt remains stable and changes little. However, the outer belt on the duskside clearly moves farther away from the Earth and becomes apparently sparser. The slot region on the duskside becomes much broader, where the Van Allen Probes traveled through. As shown in Fig. 4f, the electron flux at energy from 51 to 61 keV rapidly decreases. At L∼4.75 (5.1), the modeled flux decreases by 91 % (83 %), similar to the observed electron flux decrease. The decreases of both the modeled and observed flux at the energies from 51 to 61 keV are more significant than those at energies from 11 to 21 keV.
These simulation results indicate that the enhanced electric field during the enhanced convection and substorm redistributes the energetic electron flux along the orbit of Van Allen Probes. Although there are stronger sunward and outward motions for the electrons at lower energies (from 11 to 21 keV), the decrease of the local electron flux along the orbit of the Van Allen Probes is slower than the decrease of the electron flux at higher energies (from 51 to 61 keV).
In this paper, we report a hiss attenuation event during an enhanced convection and substorm event on 27 August 2013. In the outer plasmasphere, with the decrease of energetic electron fluxes after the enhanced convection and substorm, the hiss wave intensity became much weaker. The Poynting flux of hiss waves observed at higher L shells (>∼4.67) before the enhanced convection and substorm was directed away from the Equator, and the trend of the calculated linear wave growth rates is consistent with the observed hiss wave intensification, both of which suggest that these hiss waves in the outer plasmasphere are mainly locally amplified. The reduction of hiss wave intensity in the outer plasmasphere after the enhanced convection and substorm may be mainly caused by the reduced fluxes of energetic electrons (tens of kiloelectron volt, keV), which provide a source of free energy for hiss amplification.
The evolution of electron fluxes during the time interval of the enhanced magnetospheric electric field at different L shells is modeled by test particle simulations based on the realistic electric field model, including both convection electric field and SAPS. The result of test particle simulation is consistent with the observed distribution of the electron flux from Van Allen Probes, showing the decreased electron flux along the orbit of the Van Allen Probes after the enhanced convection and substorm. The result of test particle simulation is consistent with the observed distribution of electron flux from Van Allen Probes, showing decreased electron flux along the orbit of the Van Allen Probes after the enhanced convection and substorm. Furthermore, the electron flux is highly energy-dependent; the decline of electron flux at the energies from 51 to 61 keV is more significant than that at energies from 11 to 21 keV. The electrons at energies from 11 to 21 keV have stronger sunward and outward motions because their velocities of gradient and curvature drift (rotation around the Earth) are lower. However, under the supplement of electrons from lower L shells, which are also owing to the convection, the electron fluxes around the orbit of the Van Allen Probes at these energies decrease slower. There is a distinct slot region of electrons at energies from 51 to 61 keV around L∼4. The inner belt remains stable and changes little during the interval of evolution because the motions of energetic electrons within L<3.5 are mainly controlled by the relatively stable co-rotating electric field and magnetic field in the substorm. By contrast, under the action of the enhanced convection electric field, the outer belt on the duskside clearly moves farther away from the Earth. The extended slot region for the electrons covers the orbit of the Van Allen Probes, which results in a significant decrease of the measured flux for the electrons at energies from 51 to 61 keV. The simulation results indicate that the enhanced electric field causes the outward and sunward motions of energetic electrons, which lead to the observed hiss attenuation on the duskside. This study reveals the important role of the magnetospheric electric field in the variation of the energetic electron flux and the resultant hiss wave intensity.
Our simulation implies that the attenuation of hiss wave intensity is mainly due to the decrease of energetic electron fluxes, especially electrons at higher energies, in association with the enhanced magnetospheric electric field in response to solar wind and substorm activity. This suggests that the enhanced magnetospheric electric field may also contribute to the attenuation of chorus waves outside the plasmasphere, since tens of kiloelectron volt (keV) electrons provide a source of free energy for chorus wave excitation. The potential chorus attenuation, although unavailable from other satellite measurements during this event, is left as a further investigation.
The data of EMFISIS aboard Van Allen Probes are publicly available at EMFISIS website (http://emfisis.physics.uiowa.edu/Flight/, last access: 28 April 2021). The data of EFW are publicly available at RBSP/EFW website (http://www.space.umn.edu/rbspefw-data/, last access: 28 April 2021) (Minnesota Institute for Astrophysics, 2021). The MagEIS-HOPE combined omni-dimensional data are from RBSP ECT website (https://www.rbsp-ect.lanl.gov/science/DataDirectories.php, last access: 28 April 2021) (RBSP-ECT, 2021). The MagEIS-HOPE combined differential flux data are obtained from (https://doi.org/10.6084/m9.figshare.9640760.v1, last access: 28 April 2021). The OMNI data are provided at SPDF website (http://cdaweb.gsfc.nasa.gov, last access: 28 April 2021) (NASA, 2021). The DMSP data are publicly available at CEDAR Madrigal Database website (http://cedar.openmadrigal.org/single/, last access: 28 April 2021).
The conceptional idea of this study was developed by HL and WL. HL wrote the paper, and WL revised it. QM, YN, and ZY substantially helped with the analysis. AJB and XS contributed to the Van Allen Probe data processing. All authors discussed the results.
The authors declare that they have no conflict of interest.
We acknowledge both the Van Allen Probe and DMSP instruments teams for providing access to the observation. We thank NASA GSFC's CDAWeb for providing OMNI data.
This research is supported by the National Natural Science Foundation of China (grant nos. 42064009 and 41604156). The works of Wen Li and Xiaochen Shen are supported by the NSF (grant no. AGS-1847818) and the Alfred P. Sloan Research Fellowship (no. FG-2018-10936).
This paper was edited by Johan De Keyser and reviewed by two anonymous referees.
Blake, J. B., Carranza, P. A., and Claudepierre, S. G.: The Magnetic Electron Ion Spectrometer (MagEIS) Instruments Aboard the Radiation Belt Storm Probes (RBSP) Spacecraft, Space Sci. Rev., 179, 383–421, https://doi.org/10.1007/s11214-013-9991-8, 2013.
Bortnik, J., Thorne, R. M., and Meredith, N. P.: The unexpected origin of plasmaspheric hiss from discrete chorus emissions, Nature, 452, 62–66, https://doi.org/10.1038/nature06741, 2008.
Bortnik, J., Li, W., Thorne, R. M., Angelopoulos, V., Bonnell, J., Contel, O. L., and Roux, A.: An observation linking the origin of plasmaspheric hiss to discrete chorus emissions, Science China Technological Sciences, 324, 775–778, https://doi.org/10.1126/science.1171273, 2009.
Burch, J. L.: The magnetosphere, in: Upper Atmosphere and Magnetosphere, National Academy of Sciences, Washington, D.C, 42–56, https://doi.org/10.17226/20335, 1977.
Chan, K.-W. and Holzer, R. E.: ELF hiss associated with plasma density enhancements in the outer magnetosphere, J. Geophys. Res., 81, 2267–2274, https://doi.org/10.1029/JA081i013p02267, 1976.
Chen, L., Thorne, R. M., Bortnik, J., Li, W., Horne, R. B., Reeves, G. D., Kletzing, C. A., Kurth, W. S., Hospodarsky, G. B., Spence, H. E., Blake, J. B., and Fennell, J. F.: Generation of unusually low frequency plasmaspheric hiss, Geophys. Res. Lett., 41, 5702–5709, https://doi.org/10.1002/2014gl060628, 2014.
Draganov, A. B., Inan, U. S., Sonwalkar, V. S., and Bell, T. F.: Magnetospherically reflected whistlers as a source of plasmaspheric hiss, Geophys. Res. Lett., 19, 233–236, 1992.
Ejiri, M.: Trajectory Traces of Charged Particles in the Magnetosphere, J. Geophys. Res., 83, 4798–4810, https://doi.org/10.1029/JA083iA10p04798, 1978.
Frank, L. A.: Magnetospheric and auroral plasmas. A short survey of progress, Rev. Geophys. Space Phys., 13, 974–989, https://doi.org/10.1029/RG013i003p00974, 1975.
Funsten, H. O., Skoug, R. M., Guthrie, A., MacDonald, E. A., and Baldonado, J. R.: Helium, Oxygen, Proton, and Electron (HOPE) Mass Spectrometer for the Radiation Belt Storm Probes Mission, Space Sci. Rev., 179, 423–484, https://doi.org/10.1007/s11214-013-9968-7, 2013.
Ganushkina, N. Yu., Pulkkinen, T. I., and Fritz, T.: Role of substorm-associated impulsive electric fields in the ring current development during storms, Ann. Geophys., 23, 579–591, https://doi.org/10.5194/angeo-23-579-2005, 2005.
Goldstein, J., Sandel, B. R., Hairston, M. R., and Reiff, P. H.: Control of plasmaspheric dynamics by both convection and sub-auroral polarization stream, Geophys. Res. Lett., 30, 2243, https://doi.org/10.1029/2003gl018390, 2003.
Goldstein, J., Burch, J. L., and Sandel, B. R.: Magnetospheric model of subauroral polarization stream, J. Geophys. Res.-Space Phys., 110, A09222, https://doi.org/10.1029/2005ja011135, 2005a.
Goldstein, J., Sandel, B. R., Forrester, W. T., Thomsen, M. F., and Hairston, M. R.: Global plasmasphere evolution 22–23 April 2001, J. Geophys. Res., 110, A12218, https://doi.org/10.1029/2005ja011282, 2005b.
Green, J. L., Boardsen, S., Garcia, L., Taylor, W. W. L., Fung, S. F., and Reinisch, B. W.: On the origin of whistler mode radiation in the plasmasphere, J. Geophys. Res., 110, A03201, https://doi.org/10.1029/2004JA010495, 2005.
Hayakawa, M., Parrot, M., and Lefeuvre, F.: The wave normals of ELF hiss emissions observed onboard GEOS 1 at the equatorial and off-equatorial regions of the plasmasphere, J. Geophys. Res., 91, 7989–7999, https://doi.org/10.1029/JA091iA07p07989, 1986.
He, Z., Chen, L., Liu, X., Zhu, H., Liu, S., Gao, Z., and Cao, Y.: Local Generation of High-Frequency Plasmaspheric Hiss Observed by Van Allen Probes, Geophys. Res. Lett., 46, 1141–1148, https://doi.org/10.1029/2018gl081578, 2019.
Huang, C.-S., Sazykin, S., Chau, J. L., Maruyama, N., and Kelley, M. C.: Penetration electric fields: Efficiency and characteristic time scale, J. Atmos. Sol.-Terr. Phys., 69, 1135–1146, https://doi.org/10.1016/j.jastp.2006.08.016, 2007.
Kennel, C. F. and Petschek, H. E.: Limit on stably trapped particle fluxes, J. Geophys. Res., 71, 1–28, https://doi.org/10.1029/JZ071i001p00001, 1966.
Khazanov, G. V., Liemohn, M. W., Newman, T. S., M.-C. Fok, and Ridley, A. J.: Magnetospheric convection electric field dynamics and stormtime particle energization: Case study of the magnetic storm of 4 May 1998, Ann. Geophys,, 22, 497–510, 2004.
Kletzing, C. A., Kurth, W. S., Acuna, M., MacDowall, R. J., Torbert, R. B., Averkamp, T., Bodet, D., Bounds, S. R., Chutter, M., Connerney, J., Crawford, D., Dolan, J. S., Dvorsky, R., Hospodarsky, G. B., Howard, J., Jordanova, V., Johnson, R. A., Kirchner, D. L., Mokrzycki, B., Needell, G., Odom, J., Mark, D., Pfaff, R., Phillips, J. R., Piker, C. W., Remington, S. L., Rowland, D., Santolik, O., Schnurr, R., Sheppard, D., Smith, C. W., Thorne, R. M., and Tyler, J.: The Electric and Magnetic Field Instrument Suite and Integrated Science (EMFISIS) on RBSP, Space Sci. Rev., 179, 127–181, https://doi.org/10.1007/s11214-013-9993-6, 2013.
Kletzing, C., Kurth, W. S., Bounds, S. R., Hospodarsky, G. B., and Santolik, O.: Evidence for significant local generation of plasmaspheric hiss, AGU Fall Meeting Abstracts, 2014, 15–19, 2014.
Laakso, H., Santolik, O., Horne, R., Kolmasová, I., Escoubet, P., Masson, A., and Taylor, M.: Identifying the source region of plasmaspheric hiss, Geophys. Res. Lett., 42, 3141–3149, https://doi.org/10.1002/2015gl063755, 2015.
Lei, W., Gendrin, R., Higel, B., and Berchem, J.: Relationships between the solar wind electric field and the magnetospheric convection electric field, Geophys. Res. Lett., 8, 1099–1102, https://doi.org/10.1029/GL008i010p01099, 1981.
Li, H., Yuan, Z., Yu, X., Huang, S., Wang, D., Wang, Z., Qiao, Z., and Wygant, J. R.: The enhancement of cosmic radio noise absorption due to hiss-driven energetic electron precipitation during substorms, J. Geophys. Res.-Space Phys., 120, 5393–5407, https://doi.org/10.1002/2015ja021113, 2015.
Li, W., Thorne, R. M., Bortnik, J., Reeves, G. D., Kletzing, C. A., Kurth, W. S., Hospodarsky, G. B., Spence, H. E., Blake, J. B., Fennell, J. F., Claudepierre, S. G., Wygant, J. R., and Thaller, S. A.: An unusual enhancement of low-frequency plasmaspheric hiss in the outer plasmasphere associated with substorm-injected electrons, Geophys. Res. Lett., 40, 3798–3803, https://doi.org/10.1002/grl.50787, 2013.
Li, W., Chen, L., Bortnik, J., Thorne, R. M., Angelopoulos, V., Kletzing, C. A., Kurth, W. S., and Hospodarsky, G. B.: First evidence for chorus at a large geocentric distance as a source of plasmaspheric hiss: Coordinated THEMIS and Van Allen Probes observation, Geophys. Res. Lett., 42, 241–248, https://doi.org/10.1002/2014gl062832, 2015a.
Li, W., Ma, Q., Thorne, R. M., Bortnik, J., Kletzing, C. A., Kurth, W. S., Hospodarsky, G. B., and Nishimura, Y.: Statistical properties of plasmaspheric hiss derived from Van Allen Probes data and their effects on radiation belt electron dynamics, J. Geophys. Res.-Space Phys., 120, 3393–3405, https://doi.org/10.1002/2015ja021048, 2015b.
Liu, N., Su, Z., Gao, Z., Reeves, G. D., Zheng, H., Wang, Y., and Wang, S.: Shock-Induced Disappearance and Subsequent Recovery of Plasmaspheric Hiss: Coordinated Observations of RBSP, THEMIS, and POES Satellites, J. Geophys. Res.-Space Phys., 122, 10421–10435, https://doi.org/10.1002/2017ja024470, 2017a.
Liu, N., Su, Z., Gao, Z., Zheng, H., Wang, Y., Wang, S., Spence, H. E., Reeves, G. D., Baker, D. N., Blake, J. B., Funsten, H. O., and Wygant, J. R.: Simultaneous disappearances of plasmaspheric hiss, exohiss, and chorus waves triggered by a sudden decrease in solar wind dynamic pressure, Geophys. Res. Lett., 44, 52–61, https://doi.org/10.1002/2016gl071987, 2017b.
Ma, Q., Li, W., Thorne, R. M., Bortnik, J., Reeves, G. D., Kletzing, C. A., Kurth, W. S., Hospodarsky, G. B., Spence, H. E., Baker, D. N., Blake, J. B., Fennell, J. F., Claudepierre, S. G., and Angelopoulos, V.: Characteristic energy range of electron scattering due to plasmaspheric hiss, J. Geophys. Res.-Space Phys., 121, 11737–11749, https://doi.org/10.1002/2016ja023311, 2016.
Mauk, B. H., Fox, N. J., Kanekal, S. G., Kessel, R. L., Sibeck, D. G., and Ukhorskiy, A.: Science Objectives and Rationale for the Radiation Belt Storm Probes Mission, Space Sci. Rev., 179, 3–27, https://doi.org/10.1007/s11214-012-9908-y, 2012.
Meredith, N. P.: Substorm dependence of plasmaspheric hiss, J. Geophys. Res., 109, A06209, https://doi.org/10.1029/2004ja010387, 2004.
Meredith, N. P., Horne, R. B., Glauert, S. A., Thorne, R. M., Summers, D., Albert, J. M., and Anderson, R. R.: Energetic outer zone electron loss timescales during low geomagnetic activity, J. Geophys. Res., 111, A05212, https://doi.org/10.1029/2005ja011516, 2006.
Meredith, N. P., Horne, R. B., Glauert, S. A., and Anderson, R. R.: Slot region electron loss timescales due to plasmaspheric hiss and lightning-generated whistlers, J. Geophys. Res.-Space Phys., 112, A08214, https://doi.org/10.1029/2007ja012413, 2007.
Meredith, N. P., Horne, R. B., Glauert, S. A., Baker, D. N., Kanekal, S. G., and Albert, J. M.: Relativistic electron loss timescales in the slot region, J. Geophys. Res.-Space Phys., 114, A03222, https://doi.org/10.1029/2008ja013889, 2009.
Minnesota Institute for Astrophysics: RBSP/EFW Data, available at: http://www.space.umn.edu/rbspefw-data/, last access: 28 April 2021.
Mishin, E. V. and Mishin, V. M.: Prompt response of SAPS to stormtime substorms, J. Atmos. Sol.-Terr. Phys., 69, 1233–1240, https://doi.org/10.1016/j.jastp.2006.09.009, 2007.
NASA: Coordinated Data Analysis Web (CDAWeb), available at: (http://cdaweb.gsfc.nasa.gov, last access: 28 April 2021.
Ni, B., Bortnik, J., Thorne, R. M., Ma, Q., and Chen, L.: Resonant scattering and resultant pitch angle evolution of relativistic electrons by plasmaspheric hiss, J. Geophys. Res.-Space Phys., 118, 7740–7751, https://doi.org/10.1002/2013ja019260, 2013.
Ni, B., Li, W., Thorne, R. M., Bortnik, J., Ma, Q., Chen, L., Kletzing, C. A., Kurth, W. S., Hospodarsky, G. B., Reeves, G. D., Spence, H. E., Bernard Blake, J., Fennell, J. F., and Claudepierre, S. G.: Resonant scattering of energetic electrons by unusual low-frequency hiss, Geophys. Res. Lett., 41, 1854–1861, https://doi.org/10.1002/2014gl059389, 2014.
RBSP-ECT: RBSP-ECT Science Data Products, available at: https://www.rbsp-ect.lanl.gov/science/DataDirectories.php, last access: 28 April 2021.
Rich, F. J. and Hairston, M.: Large-scale convection patterns observed by DMSP, J. Geophys. Res., 99, 3827–3844, https://doi.org/10.1029/93ja03296, 1994.
Roederer, J. G.: Dynamics of geomagnetically trapped radiation, New York: Springer-Verlag, 166 pp., https://doi.org/10.1007/978-3-642-49300-3, 1970.
Russell, C. T., Holzer, R. E., and Smith, E. J.: OGO 3 observations of ELF noise in the magnetosphere: 1. Spatial extent and frequency of occurrence, J. Geophys. Res., 74, 755–777, https://doi.org/10.1029/JA074i003p00755, 1969.
Shi, R., Li, W., Ma, Q., Green, A., Kletzing, C. A., Kurth, W. S., Hospodarsky, G. B., Claudepierre, S. G., Spence, H. E., and Reeves, G. D.: Properties of Whistler Mode Waves in Earth's Plasmasphere and Plumes, J. Geophys. Res.-Space Phys., 124, 1035–1051, https://doi.org/10.1029/2018ja026041, 2019.
Spence, H. E., Reeves, G. D., Baker, D. N., Blake, J. B., Bolton, M., Bourdarie, S., Chan, A. A., Claudepierre, S. G., Clemmons, J. H., Cravens, J. P., Elkington, S. R., Fennell, J. F., Friedel, R. H. W., Funsten, H. O., Goldstein, J., Green, J. C., Guthrie, A., Henderson, M. G., Horne, R. B., Hudson, M. K., Jahn, J. M., Jordanova, V. K., Kanekal, S. G., Klatt, B. W., Larsen, B. A., Li, X., MacDonald, E. A., Mann, I. R., Niehof, J., O'Brien, T. P., Onsager, T. G., Salvaggio, D., Skoug, R. M., Smith, S. S., Suther, L. L., Thomsen, M. F., and Thorne, R. M.: Science Goals and Overview of the Radiation Belt Storm Probes (RBSP) Energetic Particle, Composition, and Thermal Plasma (ECT) Suite on NASA's Van Allen Probes Mission, Space Sci. Rev., 179, 311–336, https://doi.org/10.1007/s11214-013-0007-5, 2013.
Su, Z., Xiao, F., Zheng, H., and Wang, S.: CRRES observation and STEERB simulation of the 9 October 1990 electron radiation belt dropout event, Geophys. Res. Lett., 38, L06106, https://doi.org/10.1029/2011gl046873, 2011.
Su, Z., Zhu, H., Xiao, F., Zheng, H., Wang, Y., Shen, C., Zhang, M., Wang, S., Kletzing, C. A., Kurth, W. S., Hospodarsky, G. B., Spence, H. E., Reeves, G. D., Funsten, H. O., Blake, J. B., Baker, D. N., and Wygant, J. R.: Disappearance of plasmaspheric hiss following interplanetary shock, Geophys. Res. Lett., 42, 3129–3140, https://doi.org/10.1002/2015gl063906, 2015.
Su, Z., Liu, N., Zheng, H., Wang, Y., and Wang, S.: Large-Amplitude Extremely Low Frequency Hiss Waves in Plasmaspheric Plumes, Geophys. Res. Lett., 45, 565–577, https://doi.org/10.1002/2017gl076754, 2018.
Summers, D., Tang, R., and Thorne, R. M.: Limit on stably trapped particle fluxes in planetary magnetospheres, J. Geophys. Res.-Space Phys., 114, A10210, https://doi.org/10.1029/2009ja014428, 2009.
Summers, D., Omura, Y., Nakamura, S., and Kletzing, C. A.: Fine structure of plasmaspheric hiss, J. Geophys. Res.-Space Phys., 119, 9134–9149, https://doi.org/10.1002/2014ja020437, 2014.
Thorne, R. M., Smith, E. J., Burton, R. K., and Holzer, R. E.: Plasmaspheric hiss, J. Geophys. Res., 78, 1581–1596, https://doi.org/10.1029/JA078i010p01581, 1973.
Thorne, R. M., Church, S. R., and Gorney, D. J.: On the origin of plasmaspheric hiss: The importance of wave propagation and the plasmapause, J. Geophys. Res., 84, 5241–5247, https://doi.org/10.1029/JA084iA09p05241, 1979.
Thorne, R. M., Li, W., Ni, B., Ma, Q., Bortnik, J., Baker, D. N., Spence, H. E., Reeves, G. D., Henderson, M. G., Kletzing, C. A., Kurth, W. S., Hospodarsky, G. B., Turner, D., and Angelopoulos, V.: Evolution and slow decay of an unusual narrow ring of relativistic electrons near L ∼ 3.2 following the September 2012 magnetic storm, Geophys. Res. Lett., 40, 3507–3511, https://doi.org/10.1002/grl.50627, 2013.
Toffoletto, F. R. and Hill, T. W.: Mapping of the solar wind electric field to the Earth's polar caps, J. Geophys. Res., 94, 329–347, https://doi.org/10.1029/JA094iA01p00329, 1989.
Walsh, B. M., Sibeck, D. G., Nishimura, Y., and Angelopoulos, V.: Statistical analysis of the plasmaspheric plume at the magnetopause, J. Geophys. Res.-Space Phys., 118, 4844–4851, https://doi.org/10.1002/jgra.50458, 2013.
Yuan, Z., Xiong, Y., Pang, Y., Zhou, M., Deng, X., Trotignon, J. G., Lucek, E., and Wang, J.: Wave-particle interaction in a plasmaspheric plume observed by a Cluster satellite, J. Geophys. Res.-Space Phys., 117, A03205, https://doi.org/10.1029/2011ja017152, 2012.
Yue, C., Chen, L., Bortnik, J., Ma, Q., Thorne, R. M., Angelopoulos, V., Li, J., An, X., Zhou, C., Kletzing, C., Reeves, G. D., and Spence, H. E.: The Characteristic Response of Whistler Mode Waves to Interplanetary Shocks, J. Geophys. Res.-Space Phys., 122, 10047–10057, https://doi.org/10.1002/2017ja024574, 2017.