


Abstract
Salicylic acid (SA) is a vital hormone for adaptive responses to biotic and abiotic stresses, which facilitates growth-immunity trade-offs in plants. However, the genetic regulatory networks underlying the metabolic pathway of SA biosynthesis in perennial species remain unclear. Here, we integrated genome-wide association study (GWAS) with metabolite and expression profiling methodologies to dissect the genetic architecture of SA biosynthesis in Populus. First, we quantified nine intermediate metabolites of SA biosynthesis in 300 unrelated Populus tomentosa Carr. individuals. Then, we used a systematic genetic strategy to identify candidate genes for constructing the genetic regulatory network of SA biosynthesis. We focused on WRKY70, an efficient transcription factor, as the key causal gene in the regulatory network, and combined the novel genes coordinating the accumulation of SA. Finally, we identified eight GWAS signals and eight expression quantitative trait loci situated in a selective sweep, and showed the presence of large allele frequency differences among the three geographic populations, revealing that candidate genes subject to selection were involved in SA biosynthesis. This study provides an integrated strategy for dissecting the genetic architecture of the metabolic pathway of SA biosynthesis in Populus, thereby enhancing our understanding of genetic regulation of SA biosynthesis in trees, and accelerating marker-assisted breeding efforts toward high-resistance elite varieties of Populus.
Introduction
Salicylic acid (SA), referred to as the sixth phytohormone, is a vital hormone for adaptive responses to biotic and abiotic stresses, and also facilitates growth--immunity trade-offs in plants (Rodriguez-Lopez et al. 2020). According to Hippocrates, the father of modern medicine, SA was historically used for pain relief. Powder made from the leaves and bark of the Salicaceae tree was used to relieve pain and fever (Jack 1997). In 1829, Henri Leroux extracted salicin in crystalline form for the first time from willow bark, and Raphael Piria successfully obtained SA in its pure state 9 years later (Basnet 2012). An SA derivative, acetylsalicylic acid (aspirin), is extensively used as an analgesic (Roth et al. 1975). Thus, systematic recognition and investigation of SA biosynthesis are essential to plant science and the development of novel medicines. Biosynthesis of SA has been explored in the model plant Arabidopsis thaliana (Lefevere et al. 2020). Recently, the up-to-date metabolic biosynthesis pathway of plant SA has been clarified (Ding and Ding 2020). Salicylic acid can be produced via two distinct metabolic processes, the isochorismate (IC) and the phenylalanine ammonia-lyase (PAL) pathways. These pathways share the common precursor metabolite chorismite, which is the final product of the shikimate pathway. The IC pathway converts chorismate to IC via ISOCHORISMATE SYNTHASE1 (ICS1) in the plastid, and this process contributes about 90% of the total SA production (Rekhter et al. 2019). In the PAL pathway, chorismate is transformed into phenylalanine (Phe) through multiple steps, and then into trans-cinnamic acid (t-CA) via PALs. Then, t-CA can be converted into ortho-coumaric acid or benzoic acid, both of which can be used to produce SA. Although the pathway of SA biosynthesis has been described at the metabolic level and its catalytic enzymes have been characterized within a complex genetic regulatory network, the essential regulator remains unknown.
Recent studies have demonstrated several regulatory factors that modulate the biosynthesis of SA. For example, ETHYLENE INSENSITIVE3 (EIN3) represses the expression of ICS1 to negatively regulate the biosynthesis of SA, whereas SYSTEMIC ACQUIRED RESISTANCE DEFICIENT1 (SARD1) enhances the accumulation of SA by promoting the transcriptional level of ICS1 (Chen et al. 2009, Zhang et al. 2010). BENZOIC ACID HYPERSENSITIVE1 (BAH1), encoding a RING-type ubiquitin E3 ligase, regulates the accumulation of SA and controls cell death via the PAL pathway (Yaeno and Iba 2008). Although the regulatory network of SA biosynthesis has been illustrated in Arabidopsis, some key information about the pathway remains missing, especially for perennial tree species. Xue et al. (2013) revealed that the SA biosynthesis pathway differed in fundamental ways between Arabidopsis and Populus. In Arabidopsis, ~90% of SA is produced through the IC pathway, whereas in Populus, SA is derived primarily from the PAL pathway (Yuan et al. 2009, Rekhter et al. 2019). In addition, ICS is a single-copy gene in Populus, but it is represented by two highly orthologous genes derived from a segmental genome duplication event in Arabidopsis (Wildermuth et al. 2001, Garcion et al. 2008, Yuan et al. 2009, Tsai et al. 2011). The hyper-accumulation of SA exhibited a dwarfism phenotype in Arabidopsis (Rekhter et al. 2019), whereas overexpression of a bacterial SA synthase elevated SA levels in Populus without affecting growth (Xue et al. 2013), indicating different homeostasis mechanisms for SA in annual and perennial plants. To date, the role of SA in poplar defense has not been substantiated, and a comprehensive understanding of the genetic regulatory networks underlying the metabolic pathway of SA biosynthesis in Populus requires further investigation (Germain and Seguin 2011).
Genome-wide association studies (GWAS) have been effectively used to dissect the genetic architecture of complex traits (Fang and Luo 2019). Recently, GWAS have been conducted to identify the genetic determinants of plant metabolic diversity, and also widely employed to resolve the genetic architecture of important metabolic traits, such as cucurbitacin and flavone, in various species (Shang et al. 2014, Peng et al. 2017). Integrated strategies using metabolomics GWAS (mGWAS) with other omics tools have provided novel insights into the regulatory network underlying metabolite biosynthesis pathways in maize and potato (Chen et al. 2016, Fang and Luo 2019). Expression quantitative trait loci (eQTL) are DNA variants responsible for the gene expression levels in linkage or association studies, and have been increasingly used to explore the regulatory mechanisms of gene expression (Majewski and Pastinen 2011, Cubillos et al. 2012). Co-expression networks provide a framework for integrating different data platforms and extracting a set of candidate genes with functional coherence (Zinkgraf et al. 2017, Schaefer et al. 2018). Thus, incorporation of eQTL and co-expression analysis into GWAS has been performed to uncover the putative regulatory networks involving in metabolic pathways. Zhang et al. (2018) discovered that the WRKY binding site is a cis-eQTL of HCT2 (shikimate hydroxycinnamoyl transferase 2, which was responsible for caffeoylquinic acid content based on GWAS), which is involved in caffeoylquinic acid biosynthesis in Populus, and further verified the genetic interaction of WRKY and HCT2 via co-expression analysis. Systematic integration of GWAS, eQTL and co-expression approaches has led to rewiring of the complex regulatory network of the fruit metabolome in tomato (Zhu et al. 2018). Therefore, a multi-omics approach can effectively reveal the genetic basis of metabolic traits and support construction of regulatory networks for the biosynthesis pathways of secondary metabolites.
Here, we quantified the intermediate metabolites of SA biosynthesis in a natural population of Populus tomentosa via high-throughput liquid chromatography–tandem mass spectrometry (LC–MS/MS) analysis. Using an integrated multi-omics strategy (GWAS, eQTL and co-expression), we deciphered the genetic architecture of metabolite features and reconstructed the genetic regulatory network of SA biosynthesis in Populus. Additionally, we captured the locally adaptive signatures of selected genes within the SA biosynthesis pathway across three geographic populations (S, NW and NE), representing the origins of our P. tomentosa sample material. The data and results generated through this analysis enhance our understanding of the genetic regulation of SA biosynthesis in trees, thereby accelerating marker-assisted breeding efforts for selecting and producing high-resistance varieties.
Materials and methods
Plant materials
We assembled an association population consisting of 300 unrelated P. tomentosa individuals, which were randomly selected from a collection of 1047 natural growing P. tomentosa individuals, representing almost the entire natural distribution of this species in China (30--40°N, 105--125°E). The geographic distribution where these samples were collected was previously divided into three geographic regions, namely, southern (S: n = 84), northwestern (NW: n = 108) and northeastern (NE: n = 108) (Du et al. 2014). In 2009, the population was asexually propagated via root segments and planted in a randomized complete block design with three replications (blocks) in Guan Xian County, Shandong Province, China (36°23′N, 115°47′E). During the fast-growing season of 2016, on a sunny day between 9:00 and 11:00 a.m., fresh functional leaves (fully extended leaves, i.e., the fourth to sixth leaves from the top of the eastern stem) were collected in three replicates that were pooled at equal levels for each of 300 accessions; the sampled leaves were immediately placed in liquid nitrogen, and stored at −70 °C until vacuum freeze-drying. This material represented the association population used for both metabolite profiling and transcriptome analysis.
Single nucleotide polymorphism calling following resequencing of the association population
The 300 individuals of the association population were resequenced at a depth >15× (raw data) using the Illumina GA2 sequencing platform according to the manufacturer’s instructions (Xiao et al. 2020). Then, clean reads from each sample were aligned to P. tomentosa reference genome using the Burrows–Wheeler Aligner (v0.7.5a-r405) with default parameters (Li and Durbin 2009). Reads with low mapping quality (MQ < 20) were filtered using the SAMtools program (v1.1, http://github.com/samtools/). Then, we performed genome variant calling using Genome Analysis Toolkit 4.0 (GATK 4.0, https://gatk.broadinstitute.org/hc/en-us) with conservative parameters. Finally, we pruned single nucleotide polymorphisms (SNPs) with only two alleles using Vcftools_0.1.13 (Danecek et al. 2011). Those SNPs with a minor allele frequency (MAF) <0.05 and a missing genotype >0.2 were removed with VCFtools (Danecek et al. 2011), and in total 13,063,406 SNPs were obtained across all individuals. The detailed methods have described in Method S1 available as Supplementary data at Tree Physiology Online.
Metabolite profiling
Each freeze-dried leaf from the association population’s 300 individuals was crushed and 100 mg of the resulting powder was weighed and extracted overnight at 4 °C in with 1.0 ml 70% aqueous methanol. Following centrifugation at 10,000g for 10 min, the extracts were absorbed and filtrated prior to LC–MS/MS analysis. An LC-electrospray ionization (ESI)-MS/MS system [HPLC, Shim-pack UFLC SHIMADZU CBM30A system, www.shimadzu.com.cn/ (SHIMADZU China, Shanghai); MS, Applied Biosystems 6500 ESI-triple quadrupole-linear ion trap (Q TRAP), www.appliedbiosystems.com.cn/ (Applied Biosystems, California)] was used to analyze all sample extracts. The analytical conditions were as follows, HPLC: column, Waters ACQUITY UPLC HSS T3 C18 (1.8 μm, 2.1 mm × 100 mm); solvent system, water (0.04% acetic acid): acetonitrile (0.04% acetic acid); gradient program, 100: 0 V/V at 0 min, 5: 95 V/V at 11.0 min, 5: 95 V/V at 12.0 min, 95: 5 V/V at 12.1 min, 95: 5 V/V at 15.0 min; flow rate, 0.40 ml min-1; temperature, 40 °C; injection volume: 2 μl. The effluent was connected to an ESI-triple quadrupole-linear ion trap (Q TRAP)-MS system. Linear ion trap (LIT) and triple quadrupole (QQQ) scans were acquired on a triple quadrupole-linear ion trap mass spectrometer (Q TRAP), the API 6500 Q TRAP LC/MS/MS System, equipped with an ESI Turbo Ion-Spray interface, operated in positive ion mode and controlled by Analyst 1.6 software (AB Sciex). The ESI source operation parameters were as follows: ion source, turbo spray; source temperature 500 °C; ion spray voltage (IS), 5500 V; ion source gas I (GSI), gas II (GSII) and curtain gas (CUR) were set to 55, 60 and 25.0 p.s.i., respectively; the collision gas (CAD) level was high. Instrument tuning and mass calibration were performed with 10 and 100 μmol l-1 polypropylene glycol solutions for QQQ and LIT modes, respectively. QQQ scans were acquired as multiple reaction monitoring (MRM) experiments with the collision gas (nitrogen) set to 5 p.s.i. The declustering potential (DP) and collision energy (CE) of individual MRM transitions were determined through further DP and CE optimization. A specific set of MRM transitions was monitored for each period according to the metabolites eluted within that period.
RNA-seq
Total RNA was extracted from fresh leaf samples of the association population’s 300 individuals was extracted according to the methods described in our previous study (Xiao et al. 2020). Paired-end sequencing was performed on an Illumina Hiseq2005. Next, the clean data were uniquely mapped to the P. tomentosa reference genome using TopHat 2.1.1 with the default options (Trapnell et al. 2009). The isoform levels and gene level counts of the assembled transcripts were computed and normalized based on fragments per kilobase of transcript per million fragments (FPKM) units using Cufflinks v2.1.1 with default options (Trapnell et al. 2012). The processing of transcriptome data is described in Method S2 available as Supplementary data at Tree Physiology Online.
Population structure analyses
To conduct population genetics analysis, we generate a pruned SNP sets in three geographic region populations respectively (hwe >0.01, LD <0.2) according to the methods described by McKown et al. (2019) with the following parameters in PLINK software: -hwe 0.01 -indep-pairwise 50 5 0.2. This generated 352,615 SNPs in the S population, 421,622 SNPs in the NE population and 426,074 SNPs in the NW population. Then, the overlapped SNPs (210,333 SNPs) in these three sets were used for population structure analysis in Admixture v1.3.0 software (Alexander et al. 2009). K values were set from K = 1 to K = 10. The minimum cross-validation (CV) error value obtained at K = 3. The SNP set were also used to construct the neighbor-joining tree by TreeBest v1.9.2 with a bootstrap value of 1000 and visualized using Figtree (v1.4.3) software (Figure S1 available as Supplementary data at Tree Physiology Online).
Genome-wide association analysis
We removed the SNPs with MAF <0.05, missing genotypes >20% and heterozygous genotypes >95%, and kept 9,689,355 SNPs for GWAS. Metabolite traits were first log10 transformed, followed by Z-score normalization. We used EMMAX software to generate a kinship matrix and test for SNPs associated with each trait (Kang et al. 2010). The kinship matrix was used as the variance–covariance matrix for random effects and the population structure (K = 3) was included as a fixed effect. The genome-wide significance threshold for GWAS was P ≤ 3.67 × 10⁻⁷ (1/n, n = the effective number of independent SNPs, Bonferroni correction). By approximating the effective number of independent SNPs across the genome, we defined the independent SNPs were the LD at r2 < 0.7 and obtained 2,721,994 independent SNPs, which was accorded to the methods described by Duggal et al. (2008). Then, we defined 10-kb windows centered on each significant SNP. All gene models for P. tomentosa that overlapped with a window were selected as candidate genes. When a window overlapped within more than one gene, we annotated the SNPs for multiple genes.
eQTL analysis
The expression data for genes identified through GWAS were transformed by log10(1 + FPKM). We removed genes with missing rates >80% and median expression level <0, and retained 23 genes for downstream analysis. Additionally, to identify the hidden batch effects and other confounders in the expression matrix, we used the probabilistic estimation of expression residuals (PEER) method to detect the first five factors (Stegle et al. 2012), which maximized the sensitivity of the eQTL discovery process. Then, the population structure (K = 3) and the first five PEER factors were used as covariates to perform eQTL analysis using MatrixeQTL software (Shabalin 2012). The MatrixeQTL was 2–3 orders of magnitude faster than other tools for eQTL analysis, so it was widely used for eQTL analysis in large matrix operations, especially the large sets of expression data (Shabalin 2012). The eQTLs detected within 10 kb of the transcriptional start site or transcriptional termination site of a gene were regarded as cis-eQTLs, and otherwise as trans-eQTLs. We set the Bonferroni correction threshold for eQTL to P = 3.67 × 10⁻⁷ (1/n, n = effective number of independent SNPs).
Co-expression network construction and hub gene identification
To demonstrate the functional connections among genes identified through GWAS and eQTL analyses, we applied Weighted Correlation Network Analysis (WGCNA) to gene expression profiles of functional leaves in 300 unrelated individuals of the association populations (Langfelder and Horvath 2008). The candidate genes were defined from gene models that overlapped with the 10-kb windows centered on each significant SNP derived from GWAS and eQTL analyses. In total, 130 genes (shared among 80% of individuals) were used for co-expression network construction. Following tutorials for WGCNA, we selected a soft-thresholding power of 5. Then, we conducted one-step network construction and module detection (minModuleSize = 20, mergeCutHeight = 0.25). This process assigns genes to three modules, which contained 60, 39 and 31 genes, respectively. Module membership (MM) was used to estimate the intra-modular connectivity of the genes. Genes within the module with the highest MM were tightly connected within that module. We selected genes with absolute values of MM >0.8 as hub gene for the modules (Rodriguez-Lopez et al. 2020). To relate metabolite contents to the network, we calculated correlations between module eigengenes and the nine metabolites. To associate metabolite contents with individual genes in the network, we also calculated gene--trait correlations, as described in the WGCNA package.
Geographic population-specific selective sweeps
To identify genomic regions for selective sweeps across the three geographic populations, we used a 10 kb sliding-window with a step size of 5 kb to calculate π (genetic diversity) according to the approach described by Wang et al. (2018). If π for a window was <0.001 in a population, the window was excluded. Then, we calculated the π ratios between pairs of geographic populations (NW, NE and S). Population differentiation was evaluated by the fixation index FST. Pairwise FST values were quantified among the three populations through the sliding-window approach (10-kb windows sliding in 5-kb steps) by VCFtools. By scanning the π ratios and FST values between each population pair, we selected the windows that showed both significantly high π ratios (top 5%) and significantly high FST values (top 5%) with significant signals of selective sweep; and windows located 20 kb apart were merged into a single sweep region. If genes were situated within the sweeps, we considered them to be candidate sweep genes. In addition, the summary statistic, Tajima’s D (selection statistics, a measure of selection in the genome), was used to confirm the occurrence of selective sweeps in the identified regions. The Tajima’s D values were determined for three populations using the same sliding window approach.
Linkage disequilibrium decay analysis
For each population, linkage disequilibrium (LD) was calculated based on the correlation coefficient (r2) for all pairs of SNPs located within 100 kb using PopLDdecay software (Zhang et al. 2019a) with the following parameters: -MaxDist 100 -MAF 0.05 -Het 0.95 -Miss 0.2. Then, a Perl script (Plot_MutiPop.pl) in PopLDdecay software was used to plot the average r2 against physical distance.
Real-time quantitative PCR
Six leaves (the curled to expanded leaves at the top of the stem) were collected from a single P. tomentosa ‘LM50’ clone and immediately frozen in liquid nitrogen. Total RNA was extracted from each leaf and reverse transcribed into cDNA using the Reverse Transcription System (Promega Corporation, Madison, WI, USA) according to the manufacturer’s protocol. Real-time quantitative PCR (RT-qPCR) was performed on the 7500 Fast Real-Time PCR System using SYBR Premix Ex Taq (TaKaRa, Dalian, China) according to the manufacturer’s protocol. Primer Express 5.0 software (Applied Biosystems) was used to design specific primers for WRKY70, BON3 and SAMMtases. All reactions were performed in three technical and biological replicates, used Populus Actin as the internal control, and followed the PCR program described by Xiao et al. (2020).
Results
Metabolite variations related to SA biosynthesis in P. tomentosa association population
Based on the up-to-date schematic diagram of SA biosynthesis in plants (Ding and Ding 2020), we detected and quantified nine metabolite features found in mature leaves of all 300 individuals, including shikimate, chorismate, isochorismate, l-phenylalanine, trans-cinnamic acid, benzaldehyde, benzoic acid, ortho-coumaric acid and the final metabolic product SA (Figure 1). All nine metabolites exhibited high phenotypic diversity in natural population of P. tomentosa, with coefficients of variation (CV) values ranging from 26.99% (isochorismate) to 134.80% (trans-cinnamic acid) (Table S1 available as Supplementary data at Tree Physiology Online). The Pearson correlations among the metabolic contents implied that chorismate, as the shared substrate of both the IC and PAL pathways, had strong positive correlation (r = 0.781, P = 8.74 × 10−63) with the final product SA (Figure S2 and Table S2 available as Supplementary data at Tree Physiology Online). Additionally, the intermediate metabolite within the PAL pathway showed a strong positive correlation (r ranged from 0.338 to 0.654, P < 0.001; Figure S2 available as Supplementary data at Tree Physiology Online), thus validating the biological pathway at the metabolic level. Seven out of the nine metabolites of interest showed significant differentiation among the three geographic regions (P < 0.01, multiple test); in particular, hyper-accumulation of SA was detected in the S and NW populations (Figure 1), implying that the SA biosynthesis has been under selective pressure in those environments.
Schematic diagram of SA biosynthesis. Nine metabolite features were detected through high-throughput LC–MS/MS analysis to describe the steps of metabolic conversion in SA biosynthesis. Box-plot showed the phenotypic variation across three geographic regions. Abbreviations: ICSs (ISOCHORISMATE SYNTHASEs), PBS3/IGS (avrPphB susceptible 3/ISOCHORISMOYL-GLUTAMATE SYNTHASE), EPS1/IPGL (ENHANCED PSEUDOMONAS SUSCEPTIBILTY 1/IC-9-GLU PYRUVOYL-GLUTAMATE LYASE), PALs (PHENYLALANINE AMMONIA-LYASEs), AAO (ALDEHYDE OXIDASEs), BA2H (BENZOIC ACID 2-HYDROXYLASE).
GWAS dissected the genetic basis of metabolites in the SA biosynthesis pathway
To dissect the genetic architecture of SA biosynthesis in Populus, we used 9,689,355 SNPs (MAF >0.05; missing <0.2; heterozygous <0.95) for the nine metabolic traits using GWAS in the P. tomentosa association population. Under the threshold of P = 1.0 × 10⁻⁶, we detected 32 significant SNP-trait associations, representing nine traits and 27 SNPs, and corresponding to 22 independent loci (Table S3 available as Supplementary data at Tree Physiology Online). Each SNP explained 8.44–32.03% of the total metabolic variance, with a median of 20.93% (Table 1). A range of 2–7 loci was detected for each metabolic trait and only five SNPs were associated with more than one metabolite. Then, we defined 33 unique candidate genes corresponding to 25 significant SNPs (genes within a 10-kb flanking region of the SNPs), including some genes with previously reported roles in SA biosynthesis, such as Isochorismate synthase 1 (ICS1) and WRKY70 (Table S4 available as Supplementary data at Tree Physiology Online).
Summary of GWAS results for nine metabolites
| Metabolite traits | Heritability1 | No. SNPs | No. genes | Range of PEV2 (%) | Mean PEV (%) |
|---|---|---|---|---|---|
| Benzaldehyde | 0.433 | 2 | 2 | 19.30–20.06 | 19.68 |
| Benzoic acid | 0.161 | 3 | 2 | 19.19–25.04 | 21.55 |
| Chorismate | 0.326 | 12 | 12 | 13.07–25.84 | 22.20 |
| Isochorismate | 0.635 | 7 | 7 | 9.64–22.58 | 18.63 |
| l-Phenylalanine | 0.371 | 4 | 6 | 20.98–26.42 | 23.34 |
| Ortho-coumaric acid | 0.395 | 6 | 5 | 18.23–28.80 | 21.52 |
| Salicylic acid | 0.264 | 3 | 6 | 10.14–24.21 | 17.65 |
| Shikimate | 0.364 | 3 | 5 | 14.74–21.03 | 18.00 |
| Trans-cinnamic acid | 0.166 | 5 | 10 | 21.60–32.03 | 27.10 |
1Pseudo-heritability estimates from EMMAX software.
2Percentage of explained variance.
eQTLs expanded the regulatory network of SA biosynthesis at the transcriptional level
Here, three cis-eQTLs and 93 trans-eQTLs were identified for the expression levels of candidate gene using GWAS with a threshold of P = 3.67 × 10⁻⁷ (Figure S3 and Table S5 available as Supplementary data at Tree Physiology Online). Then, we defined 134 unique candidate genes corresponding to 78 significant SNPs (genes within a 10-kb flanking region of the SNPs; Table S6 available as Supplementary data at Tree Physiology Online). Among these eQTL signals, 13 were identified in the promoter and down-stream region (within 2000 bp of the transcript start site or transcript end site) or 5′- and 3’-UTR, only one SNP was from exon sequence, causing missense variants, and 14 from intron sequences.
Additionally, we identified three trans-eQTL hotspots that affected the transcription levels of more than one gene, implying that master genetic regulators mediate SA biosynthesis (Yao et al. 2017). For example, SNP 10_1104592, located 218 bp upstream of Ptom.010G.00203 (encoding domain unknown function 455, DUF455), was a hub variant that regulated the expression of three candidate genes, which were associated with four metabolites, including chorismate, benzaldehyde, ortho-coumaric acid and SA (Figure 2), suggesting that DUF455 serves as a master regulator indirectly or cryptically mediating SA accumulation.
Genetic regulation network mediated by DUF455 involving in SA biosynthesis. (A) DUF455 mediated the expression of genes and the accumulation of metabolites. The dotted lines represent the regulatory network obtained through eQTL and GWAS analysis; the orange circles represent metabolites, including chorismate, l-phenylalanine (Phe), benzaldehyde, trans-cinnamic acid (CMA) and salicylic acid (SA); (B) box plots of the eQTL (10_1104592) for DUF455 associated with the expression levels of three genes. The center line indicates the median; box limits are the upper and lower quartiles, respectively; the pink box represent the predominant allele. (C--E) box plots of the SNPs in Ptom.013G.01081 (DCD), Ptom.003G.01650 (PCPP) and Ptom.001G.02959 (UMAMIT21) associated with the corresponding metabolic contents, respectively. *P < 0.05 (Student’s t-test).
Genome regions under selection among three geographic regions. (A–C) π ratio bar plot for groups S vs NE, S vs NW and NE vs NW. (D--K) SNPs associated with metabolic traits by GWAS merged with the selected region.
Co-expression network analysis identified hub genes via GWAS and eQTL integration
To locate relevant hub genes involved in the SA biosynthesis pathway, we conduct WGCNA to construct a co-expression network based on the population expression data in natural population. Global co-expression networks were constructed from all the 22,972 genes expressed in 80% samples of the population using a WGCNA. Overall, we identified the 15,291 genes assigned into 27 co-expression modules with an average size of 566 genes (min = 35, max = 2,243) at the soft-thresholding power of 14. Then, we search the candidate gene of our results in these 27 modules. We found that the candidate genes were uneven distributed in 16 modules (range from 1 to 17 genes each module), and the percentage of candidate genes in module was ranged from 0.27 to 1.67% (Table S7 available as Supplementary data at Tree Physiology Online). The candidate genes were diluted into numerous co-expression modules, and were not the hub genes in each module.
So, we performed the co-expression network analyses using the candidate genes identified by GWAS and eQTLs, which was according to the strategy described by Weighill et al. (2018). We first generated the co-expression network and examined the module eigengenes of the gene expression patterns for each module in the co-expression network. After exclusion of genes for which <80% of samples had FPKM >0, in total, 130 genes were included in the network. All 130 genes were assigned to three modules, with the blue module containing 60 genes, the brown module containing 39 genes and the turquoise module containing 31 genes, implying highly similar expression patterns among candidate genes (Figure S4 and Table S8 available as Supplementary data at Tree Physiology Online). Module membership (MM) is an indication of the intramodular connectivity of a gene, for which we considered 11 genes with MM >0.8 as hub genes of these three modules, which were linked 4–21 genes at the weighted value >0.05, such as Ptom.019G.00336 (encoding FAM135B), which was linked to 21 genes. The modules also clearly exhibited differing expression patterns, as represented by the hub genes at each module.
To relate the metabolites to the gene expression modules, we used WGCNA to calculate the correlations between module eigengenes and the contents of nine metabolites. We detected that brown module was significant correlated with ortho-coumaric-acid (r = −0.34, P = 6 × 10⁻⁴), trans-cinnamic-acid (r = −0.39, P = 6 × 10⁻⁶) and shikimate (r = −0.29, P = 3 × 10⁻³). This module contains WRKY70 and DUF55, suggesting that these genes play an important role in SA biosynthesis. Moreover, we also correlated the genes encoding known enzymes with the causal genes in the co-expression network. We found that AAO4 linked with six genes, and ICS and EPS1 shared the same module, implying the functionally interactions among genes, and sharing the regulatory pathways. The co-expression network based on the candidate genes facilitate us to identify the hub genes in the regulatory network, and identified the high-priority candidate genes involving in SA biosynthesis in Populus.
Selective sweep revealed signatures of selection underlying the SA biosynthesis network
Salicylic acid is an internal defense signal in plant immunity that protects plants from many pathogens and might be significantly differentiated across the widespread geographical ranges of P. tomentosa. First, we observed a different LD decay with distance in three populations, which intuitively depicted the selection within the three populations (Figure S1B available as Supplementary data at Tree Physiology Online). Then, to identify potential selective signals in the three populations, we estimated the genetic diversity via inter-population comparison. We identified 311, 721 and 400 potential selective sweep regions based on the empirical distribution of π ratios and FST for S/NE, S/NW and NE/NW comparisons, respectively. These candidate regions overlapped with 3709 candidate genes. The combination of selective sweep and GWAS analysis enabled elucidation of how SA biosynthesis was selected in response to local conditions. Mining the GWAS and selective sweep results, we identified seven GWAS signals located within the selective region (Figure 3 and Table S4 available as Supplementary data at Tree Physiology Online) that showed large allele frequency differences among the three geographic populations (≥20% allele frequency difference). We discovered SNP 5_3978460 (G/A) within the intron region of Ptom.005G.00522 (encoding ABC transporter I family member 10, ABCI10), which is associated with chorismate content alteration and is situated in the Chr5 sweep region (Figure 4A–D). Additionally, we found that the allele A for higher chorismate content was specifically appeared in the S geographic region (Figure 4E).
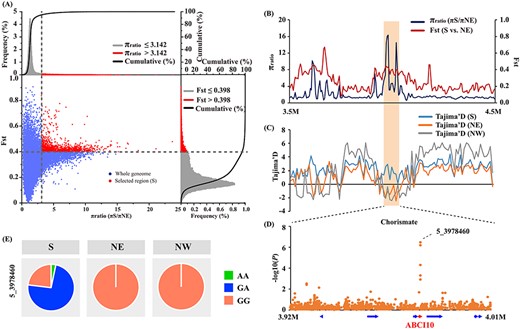
ABCI10 has been strongly selected by local environment in Populus tomentosa. (A) Distribution of π ratios (πS/πNE) and Fst values, which are calculated for a 10 kb sliding-window with a step size of 5 kb. Data points located to right of the vertical dashed lines (corresponding to the top 5% right tails of the empirical π ratio distribution, where the π ratio is 3.142), and above the horizontal dashed line (the top 5% right tail of the empirical Fst distribution, where Fst is 0.398) were identified as selected regions for the S geographic population (red points). (B) The genomic region of ABCI10 with strong selective sweep signals in S population. π ratios and Fst values are plotted using a 10 kb sliding-window with a step size of 5 kb. The orange background color represents the significant selective region. (C) The Tajima’s D values among three geographic population in genomic region of 3.5 M to 4.5 M in Chr5. (D) Manhattan plot showing regional associations of chorismate content obtained from the genome-wide association study merged with the selected region. Genome annotations are shown at the bottom, where the red arrow represents that the putative causal gene ABCI10, which is responsible for variations in chorismate content and adaption to local environment conditions in the S geographic regions. (E) Allele frequencies of the lead SNP, 5_3978460, of the putative causal gene associated with chorismate content in the three geographic regions.
Furthermore, we discovered three eQTLs situated in the sweep regions, all of which are putatively involved in SA biosynthesis (Table S5 available as Supplementary data at Tree Physiology Online). For instance, SNP 10_16173819, located in Ptom.010G.02153 (encoding DExH-box ATP-dependent RNA helicase, DExH15), was a trans-eQTL gene regulating the expression of Ptom.001G.03803 (encoding NAC72), which was associated with ortho-coumaric acid content. The expression of NAC72 showed significant differentiation across the three geographic regions, reflecting gene expression has been selected by the local climatic conditions, which affected SA accumulation.
Functional interpretation of causal genes in SA biosynthesis
Combining the results of GWAS, eQTL and co-expression analyses presented above, we were able to update the putative functions of the causal genes involved in SA biosynthesis pathway. To that end, we searched for allelic variations in candidate genes responsible for variations in SA biosynthesis metabolite levels, including putatively described genes and those newly identified in this study, and constructed the regulatory network of SA accumulation in Populus.
Isochorismate is the key intermediate metabolite in the IC pathway of SA biosynthesis. Through GWAS analysis, we found that a major haplotype with missense variants of Ptom.002G.01750 (encoding DEAD-box RNA helicase 8, DEAD8) was significantly associated with isochorismate content (Figure 5A). Previous studies have reported that the DEAD-box RNA helicase family regulates defense responses against pathogens and oxidative stress (Li et al. 2008). For this haplotype, SNP 2_12439328 (A/G) was the lead association signal, which resulted in an amino acid change from Thr to Ala. Accessions with homozygous AA genotype were associated with higher isochorismate content (Figure 5B–D). eQTL analysis also indicated that DEAD8 was responsible for plant stress resistance. We found that 9_7008178, located in the intron of Ptom.009G.00906 (encoding DOWNY MILDEW RESISTANT 6-LIKE OXYGENASE 1, DLO1), was the trans-eQTL of DEAD8 expression (Figure 5E). DLO1 is a negative regulator of plant immunity, whereas in the dlo1 mutant shows elevated pathogenesis-related gene expression and SA levels in Arabidopsis (Zeilmaker et al. 2015), indicating that DLO1 might affect the transcription of DEAD8 to regulate SA accumulation. Moreover, we discovered that Isochorismate synthase (ICS, Ptom.012G.00656), the key enzyme converting chorismate to isochorismate, is associated with the abundance of isochorismate (precursor of the IC pathway) (Wildermuth et al. 2001; Figure 5F). SNP 12_8084349, located downstream region of ICS, was the signal SNP (P = 2.71 × 10⁻⁷), which could explain 9.64% of the isochorismate content variations in the natural populations studied (Figure 5G and H). We found that the expression pattern of the ICS gene was uncorrelated with SA content in P. tomentosa (r = −0.05; Figure 5I), indicating that ICS might not be a major driver of SA accumulation in Populus.
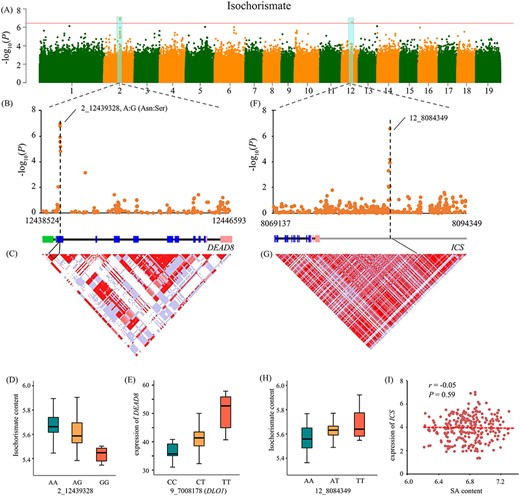
Candidate genes associated with isochorismate content. (A) Manhattan plots of isochorismate content across the full population. The horizontal red line represents the significance threshold (P ≤ 3.67 × 10⁻⁷). The cyan background color indicates the signal containing candidate genes. (B, C) Local Manhattan plot (top) and linkage disequilibrium heat map (bottom) for DEAD8 gene, which is associated with isochorismate content. The arrowhead indicates the lead nonsynonymous SNP located in the DEAD8. The gene structure are shown at the middle (green, 5′-UTR; blue, exon; pink, 3′-UTR; black, intron; gray, flanking sequence of gene). (D) Box plots showing genotype effects of the lead SNPs associated with isochorismate content. (E) Box plots showing the expression of DEAD8 regulated by its trans-eQTL 9_7008178 (located in the DLO1 gene). (F, G) Local Manhattan plot (top) and linkage disequilibrium heat map (bottom) for the ICS gene, associated with abundance of isochorismate. (H) Box plots showing genotype effects of the SNPs on isochorismate content. (I) Scatter plot for the correlation between expression level of ICS and SA content.
SNP 8_14091182 (A/G), the lead association signal of benzoic acid (P = 2.36 × 10⁻⁸), was assigned to Ptom.008G.01778 (encoding GATA transcription factor 15, GATA15) and is also a significant signal of benzaldehyde (P = 1.35 × 10⁻⁷), which is the precursor of benzoic acid (Figure 6A). We detected similar allelic effects of SNP 8_14091182 on the two metabolites, with allele A conferring a high content and allele G conferring a lower content in the natural population studies here (Figure 6B). Additionally, we found that expression levels of GATA15 were highly correlated with the contents of benzoic acid and benzaldehyde, in accordance with their strong phenotypic correlation (r = 0.654, P = 4.96 × 10−38) (Figure S2 available as Supplementary data at Tree Physiology Online). Additional eQTL analysis showed that the expression of GATA15 was controlled by a variant located in Ptom.004G.01577 (encoding Gibberellin 2-beta-dioxygenase, GA2OX1) (Figure 6C and D). Co-expression also showed that GATA15 and GA20OX1 were interacted in the same module (Figure S4 available as Supplementary data at Tree Physiology Online). Previous studies have reported that gibberellic acid (GA) is responsive to pathogen attack, which might depend on crosstalk with archetypal immunity hormones (De Vleesschauwer et al. 2016). The data presented above show that the interactions of GA20OX1 and GATA15 underlying the regulatory network of SA biosynthesis might provide evidence of GA involvement in plant immunity.
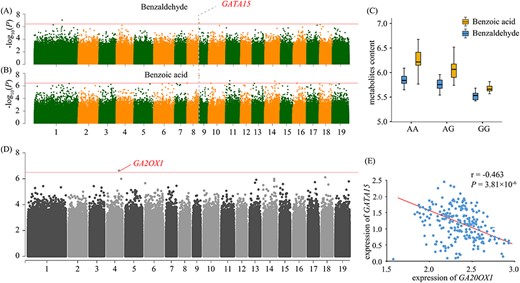
Identification of pleiotropic genes for benzaldehyde and benzoic acid content. (A,B) Manhattan plots of the GWAS results for benzaldehyde (A) and benzoic acid content (B). The arrowhead indicates the peak signal containing the candidate pleiotropic gene. The horizontal red line represents the significance threshold (P ≤ 3.67 × 10⁻⁷). (C) Box plot for the benzaldehyde (blue) and benzoic acid (yellow) plotted as an effect of genotype at signal of pleiotropic gene. (D) Manhattan plots of eQTL analysis results for the expression of candidate gene GATA15. The arrowhead indicates the peak signal containing the candidate gene GA20OX1. (E) Scatter plot of the correlation between the expression levels of GATA15 and GA20OX1.
Chorismate, the shared precursor of the IC and PAL pathways, exhibited a strong correlation with SA content (r = 0.781, P = 8.74 × 10−63). We identified three pleiotropic loci associated with these two metabolite traits (Figure 7A and B). SNP 6_8331234 caused a synonymous variation in the transcription factor WRKY70 (Figure 7C and D), which is involved in SA biosynthesis via regulation of ICS1 transcription (Zhang et al. 2017). SNP 13_12838091, located within 5 kb upstream of Ptom.013G.01082 (Figure 7E and F), encoded a copine-like protein (known as BONZAI 3, BON3) that regulates R-like genes involved in the defense response to biotic stresses (Li et al. 2009). SNP 17_6360088 was annotated to a novel gene, Ptom.017G.00569, encoding an S-adenosyl-l-methionine-dependent methyltransferases, SAMMtases (Figure 7G and H). We also found a strong correlation between the expression patterns of these pleiotropic genes by RT-qPCR in different aged leaves (Figure 7I). These results indicate that WRKY70 coordinated with two novel genes to affect the accumulation of chorismate and SA. A genotype investigation of the tested individuals revealed that they did not all possess the predominant genotypes for high SA content in these three coordinated genes, indicating that the pyramiding of predominant alleles in these accessions would allow for selection of Populus varieties with high SA contents and potentially increased resistance (Figure 7J). Moreover, we identified SAMMtases is a trans-eQTL associated with the transcript level of WRKY70, also as a candidate gene affecting the abundance of SA, which provides a novel regulatory way for eQTLs to participate in this complex metabolic pathway. Moreover, we detected Ptom.006G.01389 (encoding Mitogen-activated protein kinase kinase 2, MKK2) as a hub gene in the co-expression network with module membership was −0.81 (Figure S4 and Table S8 available as Supplementary data at Tree Physiology Online), which was also a trans-eQTL of SAMMtases (Figure 8). Previous studies have reported that MKK2 signaling occurs in the stress response via crosstalk of multi phytohormones (Teige et al. 2004). We found that the expression of WRKY70 was regulated by trans-eQTL 14_16075059, located in Ptom.014G.01533 (encoding leucine-rich repeat receptor-like protein kinase, LRR-RLK) and situated in selective sweep region (Figure 7K and L). The expression of WRKY70 showed significant differentiation across the three geographic regions, indicating that the WRKY70 was may be an adaptive gene and regulating SA accumulation.
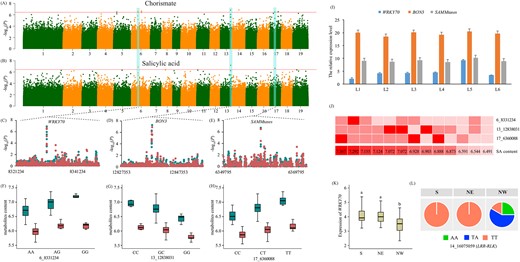
Coordinated regulation on accumulation of chorismate and salicylic acid. (A, B) Manhattan plots of genome-wide association study results for chorismate and salicylic acid content, respectively. The horizontal red line represents the significance threshold (P ≤ 3.67 × 10⁻⁷). The cyan background color indicates the signal containing the candidate genes. (C, D, E) Local Manhattan plot for genes associated with both chorismate and salicylic acid contents. The red and cyan dots indicate the chorismate and salicylic acid, respectively. (F, G, H) Box plot for the chorismate (red) and salicylic acid (cyan) plotted as an effect of genotype at signal of three pleiotropic genes. (I) Expression patterns of WRKY70, Bon3 and SAMMtases in six leaf samples of P. tomentosa. (J) The first three rows indicate the genotypic combinations for three pleiotropic SNPs in accessions (red, high SA content genotype; light red, moderate SA content genotype; very light red, low SA content genotype). The fourth row represents the heatmap of SA content in above accessions, the color from the very light red to red as the SA content increased (the SA content show in the block with number). (K) Differentiation of WRKY70 expression level across three geographic regions of the natural population. (L) Allele frequency of the trans-eQTL of WRKY70, 5_3978460 (located in LRR-RLK), in three geographic regions.
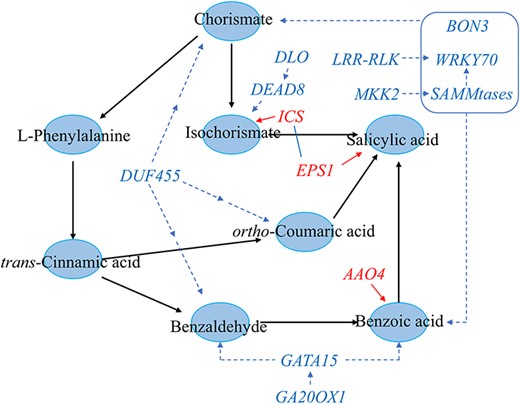
Genetic regulatory network of causal genes involving in the SA biosynthesis. The causal genes for functional interpretation were used to build the genetic regulatory network. The blue circles represent the metabolites; the red words represent the genes encoding known enzymes; the blue words represent the functional causal genes; the red lines represent the known regulatory relationship; the blue dotted lines represent the association obtained from multi-omics analysis; and the blue square represent WRKY70 intertwined with BON3 and SAMMtases to coordinate the accumulation of chorismate and SA.
Discussion
Salicylic acid is an indispensable plant hormone that controls numerous biological processes, including disease resistance, stress responses, photosynthesis and growth (van Butselaar and Van den Ackerveken 2020). In the present study, we investigated the genetic architecture of metabolites in the SA biosynthesis pathway using a systematic multi-omics approach in a natural Populus population. Our results allowed construction of the SA biosynthesis regulatory network, and identification of the potential regulatory genes and favorable alleles, providing a theoretical basis for molecular-marker assisted breeding of stress-tolerant varieties of Populus.
Multi-omics analysis of functionally relevant genes of in the SA biosynthesis pathway
Over the past decade, integration of genetic analyses with biochemical approaches has led to the discovery of the individual steps in the SA biosynthesis metabolic process (Ding and Ding 2020). Based on high-throughput metabolome analysis and the schematic diagram of SA biosynthesis in plants, we were able to identify nine metabolites, starting from shikimate and ending with the final product, SA, representing the entire pathway of SA biosynthesis (Figure 1). However, increasing evidence shows that the regulatory network of SA biosynthesis differs among species (Xue et al. 2013). Our analysis represents the first dissection of the natural variations in SA biosynthesis in a long-lived woody species, and these findings illuminate allelic variants and candidate genes that contribute to the observed metabolic variations. More importantly, the genes with known roles in SA biosynthesis were included in our results, such as ICS1 and WRKY70. We also identified several defense response genes, such as DLO1, DEAD8 and MKK2. Although these genes were not directly responsible for biosynthesis of SA, but they will respond to the stimulation of external environment factor to induce the accumulation of endogenous SA, highlighting the power of multi-omics analysis, which facilitated detection of candidate genes involved in secondary metabolite biosynthesis in this study.
Through systematic integration of metabolic GWAS and multi-omics analysis, we have constructed the metabolic network underlying SA biosynthesis. Furthermore, our investigation of eQTLs provided insights into the genetic variants modulating gene expression levels via indirect or cryptic regulation, which helped to identify the regulatory factors involved in the SA biosynthesis pathway at the transcriptional layer (Hormozdiari et al. 2016). In our investigation, we detected three trans-eQTL hotspots (SNPs that were trans-eQTLs associated with the expression of multiple genes), which are of particular interest, as they could serve putative hub roles in the regulation of SA biosynthesis, which sheds light on the putative regulatory roles of eQTLs in SA biosynthesis (Figure 2). The eQTL analysis also provided evidence for genetic interactions of genes among multiple pathways. Several studies have revealed that SA biosynthesis is tightly intertwined with other essential metabolic processes, and that manipulating SA biosynthesis can result in strong pleiotropic effects on plant homeostasis (van Butselaar and Van den Ackerveken 2020), indicating that SA biosynthesis is controlled by a complex regulatory network. For instance, De Vleesschauwer et al. (2016) have identified the differences between the hormone networks of Arabidopsis and rice, and demonstrated integration of GA with SA and jasmonic acid to resist pathogen attack and regulate plant growth. Here, the crosstalk between GA and SA was also detected in Populus, which presented by the interaction of GA2OX1 and GATA15 (Figure 6 and Figure S4 available as Supplementary data at Tree Physiology Online). Previous studies have reported that GA is also responsive to pathogen attack, and this response might depend on crosstalk with archetypal immunity hormones (De Vleesschauwer et al. 2016). Although the molecular mechanism of the interaction between GA2OX1 and GATA15 requires further verification, the crosstalk between hormones provides a possible clue to explore SA-dependent ‘trade-off’ between plant growth and immunity (van Butselaar and Van den Ackerveken 2020).
The co-expression analysis implemented in this study is a paradigmatic method for revealing functional connections among traits, candidate genes and shared pathways, which demonstrated the interactions among the genes underlying each metabolic step in SA biosynthesis. For example, Schaefer et al. (2018) developed a framework called ‘Camoco’ that integrated the GWAS and co-expression network to build a network of candidate genes and identify high-priority candidate genes underlying 17 ionomic elements in corn kernels. Thus, the development of accurate and comprehensive networks has allowed us to identify the master regulator and illustrate the interactions among metabolites in SA biosynthesis. Here, we constructed two modules of the co-expression network, and identified nine hub genes based on module membership in the two modules, which allowed us to prioritize identification of the master regulator in SA biosynthesis. Based on our genetic analysis, WRKY70 is a key gene in the genetic regulatory network of SA biosynthesis. Previous studies have reported that WRKY70 elevated transcript levels of ICS1 to control SA biosynthesis (Zhang et al. 2017). MKK2, as a pathogen-responsive gene (Teige et al. 2004), is a hub gene in the regulatory network and thereby regulates the accumulation of SA (Figure 8). Of note, we found that SAMMtases might directly control the accumulation of SA, or alternatively, it might indirectly modulate the chorismate and SA contents through trans-regulation of WRKY70 expression. Moreover, we found that WRKY70 was coordinated with its trans-eQTL gene SAMMtases and another novel gene, Bon3, to regulate the chorismate and SA traits (Figure 8), indicating a potential role of WRKY70 in the SA biosynthesis regulatory network. This observation provides new insights into the shared regulatory pathways of SA biosynthesis.
Selected gene affected SA accumulation variations within natural distribution of P. tomentosa
The sessile nature of plants makes them vulnerable to unpredictable environmental conditions, and SA is an important chemical signal that plays an important adaptive role in such scenarios (van Butselaar and Van den Ackerveken 2020). This vulnerability is compounded by the fact that plants cover wide ecological ranges and therefore local adaption is a major force shaping the genetic resources of long-lived woody species in natural populations. The differentiation of SA biosynthesis metabolites among the three geographic populations indicated that metabolic homeostasis of forest trees varied substantially along environmental gradients (Figure 1). For example, individuals in the NW geographic region, which were located at high elevations in arid and semiarid areas with low temperatures and limited annual rainfall, exhibited hyper-accumulation of SA, indicating that they might have evolved this high level of SA to withstand extreme abiotic stress. Thus, metabolites involved in SA biosynthesis may be associated with geographic distribution, leading to typical local adaptation or characteristics.
The differentiation of metabolic contents among the three geographic regions implies that the genes involved in SA biosynthesis have undergone natural selection. Local geographic adaptation of Arabidopsis to cold temperatures shaped the natural variation in its gene expression, leading to the development of ecotype-specific regulatory interactions of genes underlying freeze stress (Barah et al. 2013), implying that the transcriptional levels of genes are central to plant adaption in a changing climate. Accordingly, the differentiated expression patterns of causal genes across the three geographic regions (Figure 7K and L), implying that the transcriptional regulatory network of SA biosynthesis may have undergone selection creating P. tomentosa ecotypes.
The natural selective pressures shaping spatial patterns of genetic variation, which lead to genetic differentiation and local adaptation among populations, might explain plant trait diversity as an adaptive response to the varied environments across its geographic distribution. The selective sweep approach allowed us to scan for signals of local adaptation throughout the genome, thereby providing the genetic information about the adaptive mechanism. Recently, integration of selection sweep and GWAS has been widely employed to dissect the genetic mechanisms behind adaptive traits; one of the best examples is the FT2 locus, which controls the timing of bud set and contributes to rapid local adaption in Populus tremula (Wang et al. 2018). Similarly, the approach of ‘landscape genomics’ has been implemented for several perennial trees, including Populus trichocarpa, Pinus strobus and silver birch, and has provided insights into putative selective genes and the mechanisms of local adaptation (Evans et al. 2014, Salojarvi et al. 2017, Housset et al. 2018). Through mining of the multi-omics data, we identified seven GWAS signals and three eQTLs located in selective sweep regions (Figure 3), implying that these genes have important effects on the accumulation of SA and may play key roles in adaptation to local environments. More specifically, the allele frequencies of these SNPs were differentiated among the three geographic regions (Figure 4D, and Tables S3 and S5 available as Supplementary data at Tree Physiology Online). For instance, the ABCI10 allele associated with higher chorismate content was fixed in the S geographic region, which indicates that this region has higher levels of SA accumulation, and is supported by the strong positive phenotypic correlation between chorismate and SA (Figure 4). Collectively, these observations imply that the predominant alleles in different genomic regions have been subjected to different selective pressures and controlled by diverse differentiation patterns, revealing functional adaption of the SA biosynthesis regulatory pathway. These results provided valuable candidate allelic genes for regional breeding programs to improve climate resilience in Populus.
Understanding the regulatory network of SA biosynthesis in Populus
Previous studies have provided key clues about the regulatory pathway of SA biosynthesis in Arabidopsis, and several genes have been found to regulate each step of this metabolic process (Ding and Ding 2020). However, increasing evidence shows that the regulatory network of SA biosynthesis differs between Arabidopsis and Populus (Yuan et al. 2009). Increased SA accumulation exhibited a dwarfism phenotype via impairment of photosynthesis in Arabidopsis, whereas in Populus, constitutively elevated SA abundance only altered the photosynthesis and oxidative state, but did not affect growth (Xue et al. 2013, Rekhter et al. 2019). Despite the broad distribution of SA in plants, its ambient levels differ widely among species. Salicylic acid content is substantially higher in Populus than in Arabidopsis, reflecting the different levels of SA homeostasis between these two species (Raskin 1992). The soybean genome also encodes two ICS genes, but the IC and PAL pathways contribute equally to pathogen-induced SA (Shine et al. 2016), indicating that some plants have evolved species-specific regulatory pathways for SA biosynthesis. Populus, a widespread perennial tree species, is subjected to different patterns of pathogen, herbivore and abiotic stresses during its long lifespan, and therefore requires multiple modes of protection (Brunner et al. 2004, Eyles et al. 2010). Its long juvenile stage gives Populus fewer generations per pathogen generation, allowing it to evolve fewer new effectors (such as R gene alleles) to fight fast-evolving pathogens relative to other annual species (Germain and Seguin 2011). Salicylic acid is an indispensable component of the defense response to systemic-acquired resistance due to its crosstalk with other plant hormones and the trade-off between growth and immunity. Thus, Populus has developed a specific mechanism to accumulate a high SA content, which was adapted to the dynamic environmental stresses without affecting growth.
Plants have an exquisite ability to mediate the homeostasis of metabolites, which strongly affects metabolite accumulation in response to environmental conditions (Des Marais et al. 2013). In particular, SA is an important signaling phytohormone in plant responses to challenges from a diverse range of biotic and abiotic stress and is essential to the establishment of local resistance (Loake and Grant 2007). Previous studies have shown that SA contents differ significantly with cultivation conditions. Here, a limitation of our investigation is that we phenotyped metabolic contents at only one site, which cannot reflect phenotypic plasticity under differing conditions. Thus, we should plant and phenotype all of the accessions at field sites in the three geographic for future studies. Considering genotype-by-environment (G × E), which are observed when causal genes are investigated under different cultivation conditions, several master genes may be common to both conditions. Han et al. (2018) revealed different candidate genes controlling capsaicinoid content under two ecological conditions, although several common genes were also identified in both locations. In accordance with numerous studies on phenotypic plasticity, G × E was under genetic control, with genes controlling the phenotypic plastic response separately or in combination. This finding provides evidence to support dissection the G × E effects in the environmental response of SA biosynthesis in Populus.
In this study, we detected the metabolic process of SA biosynthesis in the leaf tissue, which is the best tissue for exploring the role of SA in Populus, as leaves have more exposure than other tissues to pathogens and osmotic stress (Warren et al. 2003) and also the most accessible tissue for extraction of SA. Traditionally, bark and leaves were the source of SA extracted for pain-relief treatments, implying potentially higher accumulation of SA in bark. The expression pattern of candidate genes varies among tissues (Drost et al. 2010), such as leaves and bark, indicating that the effects of genes may differ among tissues. Thus, repeating the analysis of the genetic basis of SA biosynthesis in different tissues would lead to identification of other key genes in the SA biosynthesis pathway rather than WRKY70. This possibility indicates a limitation of this study, and future research should focus on the roles of the relevant genes in different tissues.
Based on a multi-omics strategy, we identified candidate genes responsible for SA accumulation in Populus, including eight genes situated in selective sweep regions. But how to prove the causality between allele gene and phenotype remains a challenge for research into perennial trees. With the development of CRISPR (clustered regularly interspaced short palindromic repeats), which provides the ability to manipulate plant genomes precisely, a powerful tool for introducing gain-of-function mutations and proving the causal relationships among candidate genes is available (Zhu et al. 2020). Although CRISPR has been used only for knockout of candidate genes in Populus (Zhou et al. 2015), single-base-editing methods have been developed for A. thaliana, rice and wheat (Lu et al. 2018, Zong et al. 2018, Zhang et al. 2019b), implying the potential capacity for accurate genome manipulation via CRISPR to create genetic variants, and explore potential functions of causal genes responsible for desirable traits in perennial trees.
Data access
The raw data of genome resequencing of 300 P. tomentosa individuals have been submitted to the Genome Sequence Archive in the BIG Data Center, Beijing Institute of Genomics (BIG), Chinese Academy of Sciences (CAS) under accession number CRA000903, which is publicly accessible at http://bigd.big.ac.cn/gsa/.
Authors' contribution
D.Z. designed the experiments; L.X., Q.D. and M.Q. collected and analyzed the data; L.X., W.L., Y.F., D.W. and J.S. performed the experiments; L.X. and Q.D. wrote the manuscript; Y.A.E. revised the manuscript; D.Z. obtained funding and is responsible for this article. All authors read and approved the manuscript.
Conflict of interest
The authors declare that they have no competing interests.
Funding
This work was supported by the Graduate Training and Development Program of Beijing Municipal Commission of Education (No. BLCXY201807), the Project of the National Natural Science Foundation of China (No. 31670333, 31872671, and 31872707), the 111 Project (No. B20050) and Beijing Nova Program (No. Z181100006218024).
References
Han, K., H.Y. Lee, N.Y. Ro, et al. (
Stegle, O., L. Parts, M. Piipari, et al. (
Zhang, J, Y Yang, K Zheng, M, et al. (
Author notes
Liang Xiao and Qingzhang Du authors contributed equally to this work.
