
Which Reanalysis Dataset Should We Use for Renewable Energy Analysis in Ireland?
by
 , , and
Eadaoin Doddy Clarke
1,2,* ,
,
Seánie Griffin
1,2,
Frank McDermott
2,3,4,
João Monteiro Correia
2,3 and
Conor Sweeney
1,2,4 1
School of Mathematics and Statistics, University College Dublin, D04 V1W8 Dublin, Ireland
2
UCD Energy Institute, University College Dublin, D04 V1W8 Dublin, Ireland
3
School of Earth Sciences, University College Dublin, D04 V1W8 Dublin, Ireland
4
UCD Earth Institute, University College Dublin, D04 V1W8 Dublin, Ireland
*
Author to whom correspondence should be addressed.
Atmosphere 2021, 12(5), 624; https://doi.org/10.3390/atmos12050624
Submission received: 16 March 2021
/
Revised: 4 May 2021
/
Accepted: 8 May 2021
/
Published: 13 May 2021
(This article belongs to the Special Issue Climate Reanalysis)
Abstract
:Attention should always be given to which reanalysis dataset to use when preparing analysis for a project. The accuracies of three reanalysis datasets, two global (ERA5 and MERRA-2) and one high-resolution regional reanalysis (MÉRA), are assessed by comparison with observations at seven weather observing stations around Ireland. Skill scores are calculated for the weather variables at these stations that are most relevant to the renewable energy sector: 10 m wind for wind power; surface shortwave radiation (SW) and 2 m temperature for photovoltaic power generation. The choice of which reanalysis dataset to use is important when future planning depends on this data. The newer ERA5 generally outperforms the other two reanalyses. However, this is not always true, and the best performing reanalysis dataset often depends on the variable of interest and location. As errors are significant for these reanalysis datasets, consideration should also be given to datasets specifically tailored to renewable energy resource modelling.
1. Introduction
This paper examines a range of skill scores for two global reanalysis datasets, ERA5 [1] and MERRA-2 [2], and one high-resolution regional reanalysis dataset, MÉRA [3], compared to weather observing stations in Ireland. Reanalyses are useful datasets for monitoring and comparing past and present climate conditions, testing the accuracy of past forecasts, driving numerical weather prediction (NWP) models, and identifying climate variations and change. They are used to an increasing extent in various commercial sectors including energy [4,5], agriculture [6], water resources [7,8], and insurance [9,10]. This paper will focus on the subject of renewable energy. Past data can be used for future planning, particularly in terms of selecting the most suitable site locations, for example, for wind farms. However, long records of historical wind speed data at turbine hub-height are rare, especially in exact locations where potential wind farms may be developed. Therefore, using gridded reanalyses, especially in regions where observations are sparse, is necessary to investigate long-term trends along with extreme events. In order to ensure that reanalyses adequately represent reality, their accuracy must be validated. In this paper, we evaluate these three datasets, which have not been analysed together before, specifically for the variables that are relevant for wind and solar electricity generation: wind speed, temperature, and shortwave radiation (SW).
Results from previous studies that have examined ERA5, MERRA-2, or MÉRA have found that these reanalyses tend to overestimate surface SW compared to observations [11,12,13]. The bias varies with cloudiness, resulting in overestimates of SW under cloudy conditions and slight underestimates of SW under clear skies [12,14]. Often, errors in SW in the reanalysis products can be attributed to the misrepresentation of cloud properties and/or aerosols [12,13,14,15].
The accuracy of 10 m wind speed in reanalyses has been shown to vary depending on location and dataset. MERRA-2 overestimates wind capacity across 23 countries in Europe at a national aggregate scale [16]. MERRA-2 tends to overestimate wind speeds at inland locations, especially in Europe. This can often be attributed to mismatches in model elevation or topography [17,18]. Although MÉRA has a tendency to overpredict at lower wind speeds and underpredict at higher wind speeds, the standard deviation of wind speeds has been shown to match well with observations, which can be attributed to increased resolution and improved model physics [3,19].
Temperature fields have been shown to generally be in good agreement with station observations. MÉRA outperforms ERA-Interim for 2 m temperature, often as a result of increased model spatial resolution [19]. Daily minimum temperatures in MERRA-2 tend to be too high, whereas daily maximum temperatures tend to be too low, and this is largely due to corresponding errors in radiation in the model [20]. ERA5 shows improvements over its predecessor, ERA-Interim [21]. For solar energy installations, photovoltaic (PV) output depends on a number of factors, including SW and ambient air temperature. PV panel efficiencies generally decrease with increasing temperature and with decreasing SW. Therefore, biases in 2 m temperature could feed into errors in calculated power output for PV electricity generation.
Due to some large errors in reanalysis datasets, some renewable energy developers do not directly use reanalyses and instead use alternatives such as the high-resolution New European Wind Atlas (https://map.neweuropeanwindatlas.eu/ (accessed on 29 April 2021)) and the Global Solar Atlas (https://globalsolaratlas.info/map (accessed on 29 April 2021)). These products provide outputs tailored to the needs of energy resources modellers. However, researchers who want to study the behaviour of wind and solar PV together still use reanalysis products to do this. While this paper focuses on validation in terms of wind and solar resources, the analysis of these individual variables can also be useful for many applications.
The aim of this paper is to compare a recent global reanalysis dataset (ERA5) with an older global reanalysis dataset (MERRA-2) and to a high-resolution regional dataset (MÉRA). The layout of the paper is as follows: Section 2 gives an overview of the data and methodology used in this study. Results are presented and discussed in Section 3 in terms of systematic errors and reanalysis skill scores. Finally, Section 4 provides some conclusions.
2. Materials and Methods
Data from the two global reanalysis datasets, ERA5 and MERRA-2, and a high-resolution regional reanalysis, MÉRA, are compared to seven weather observing stations geographically dispersed around Ireland over a 26-year period of common data availability (1982–2007). Three weather variables are chosen: 2 metre (2 m) temperature, 10 metre (10 m) wind, and surface shortwave radiation (SW). SW and temperature are the primary variables influencing PV. Wind speed is the primary variable influencing wind power generation. Ideally, this wind speed would be measured at a typical turbine hub-height. However, there are no long-term records of hub-height wind speed available at different locations around Ireland; therefore, we focus this study on the 10 m wind speed records from synoptic stations.
It should be noted that all three reanalyses use conventional observations in the form of surface land observations (including the temperature and wind variables) from synoptic weather stations as a source of input to the model’s data assimilation process [3,19,21,22]. Therefore, the validations performed on these datasets are not truly an independent comparison.
2.1. Ground Measurements
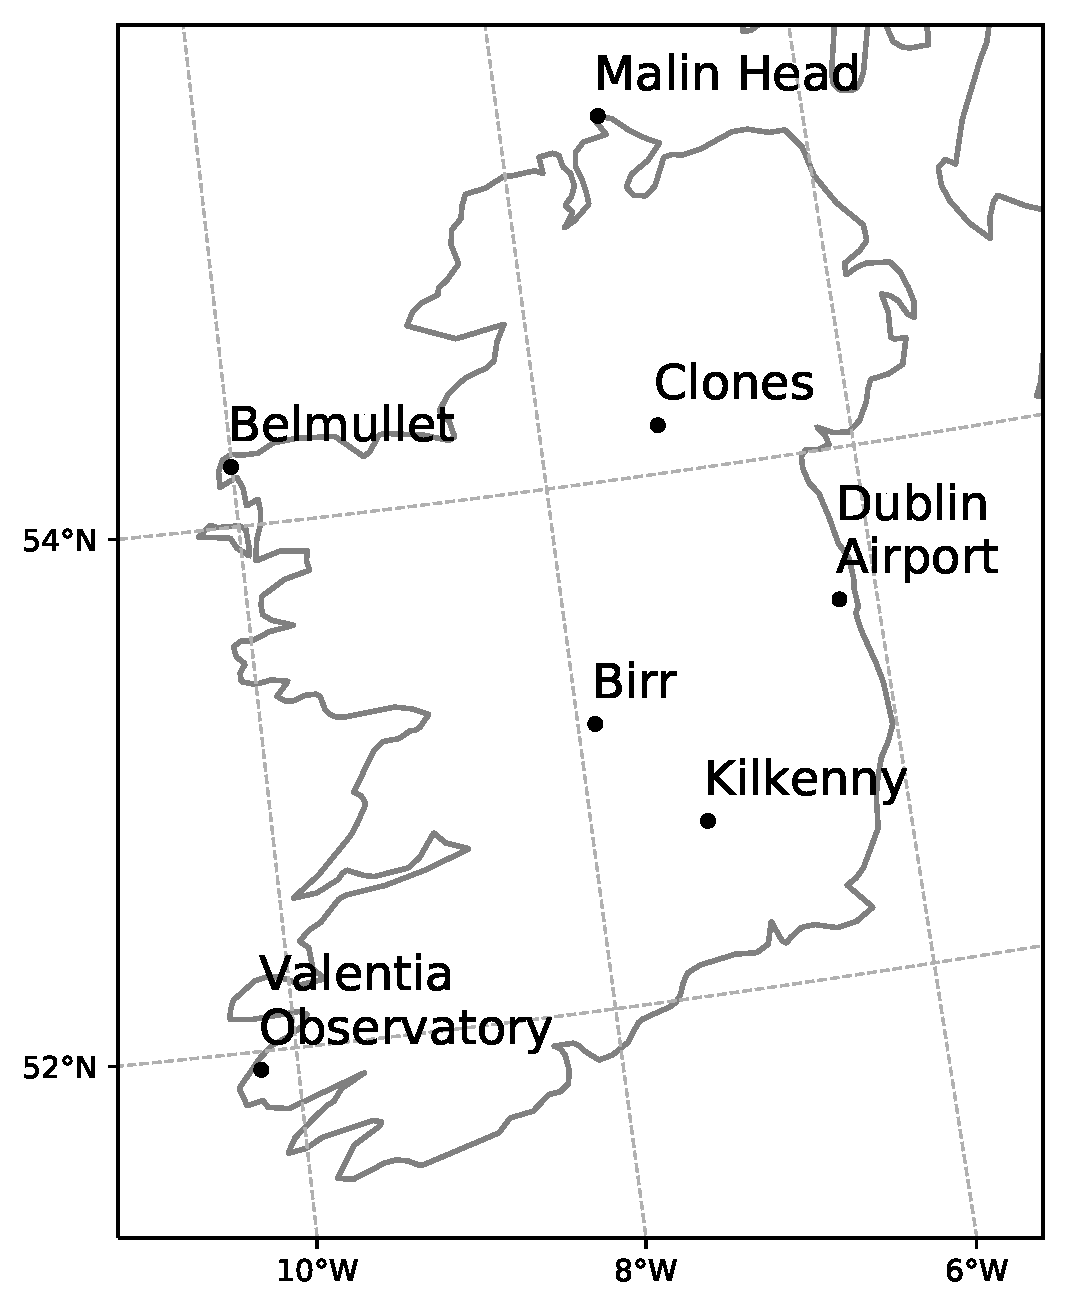
The Irish meteorological service, Met Éireann, runs a network of WMO standard weather observing stations around Ireland. In this study, we use seven stations that have a continuous record of hourly data for the three variables considered here for over 25 years, limited by the closure of some weather stations in 2008. These stations represent the longest available record of wind and SW covering different regions of Ireland (Figure 1). The locations include both coastal—Belmullet, Dublin Airport, Malin Head and Valentia Observatory, and inland stations—Birr, Clones and Kilkenny.
2.2. Reanalysis Datasets
Hourly output from a high-resolution regional reanalysis MÉRA [3] is utilised in this study. Its performance is compared to two global reanalyses, MERRA-2 [2] and ERA5 [1]. Information about the resolution and coverage of the datasets are summarised in Table 1. Bilinear interpolation is used to produce a colocated grid point for comparison with station observations.
2.3. Skill Scores
Standard skill scores are used to evaluate the skill of the reanalyses compared to the selected Met Éireann observation stations. The skill scores used are; mean error (ME), root mean square error (RMSE), anomaly correlation coefficient (ACC), and Spearman’s correlation (r). ME is defined as
where n is the number of observations, is the reanalysis value of the parameter in question, and is the corresponding observed value. RMSE is defined as
The ACC is the correlation between anomalies from the reanalysis and observations relative to climatology [23]. Therefore, this score compares errors considering seasonal variability.
where is the climatology of the parameter in question. Climatology is calculated by using a 30-day rolling mean and then averaging over the common validation period (1982–2007). ACC values greater than 0.6 imply that the data capture the observed large-scale weather patterns well.
Normalised Taylor diagrams [24] are used in this study to summarise how closely the model data matches observations. They are graphical representations of three skill scores: normalised standard deviation, correlation coefficients, and normalised centred root mean square error (CRMSE). In this paper, the results are normalised relative to the observations for ease of comparison. Therefore, model standard deviation and CRMSE are divided by the standard deviation of the observations. Normalised CRMSE is calculated as
where the overall mean of a field is indicated by an overbar and is the standard deviation of observations. Modelled estimations that agree well with observations will lie nearest to the point marked 1 on the x-axis.
3. Results
This section investigates systematic errors in the reanalyses and the general behaviour of the models. Each variable is analysed separately.
3.1. Temperature
Table 2 shows the ACC, Spearman correlation, ME, and RMSE of hourly temperature averaged over all stations for the entire period. All ACC results are above 0.85, indicating that these reanalyses capture the seasonal variability well. ME and RMSE are best for ERA5. MERRA-2 has the poorest results for all three of these skill scores.
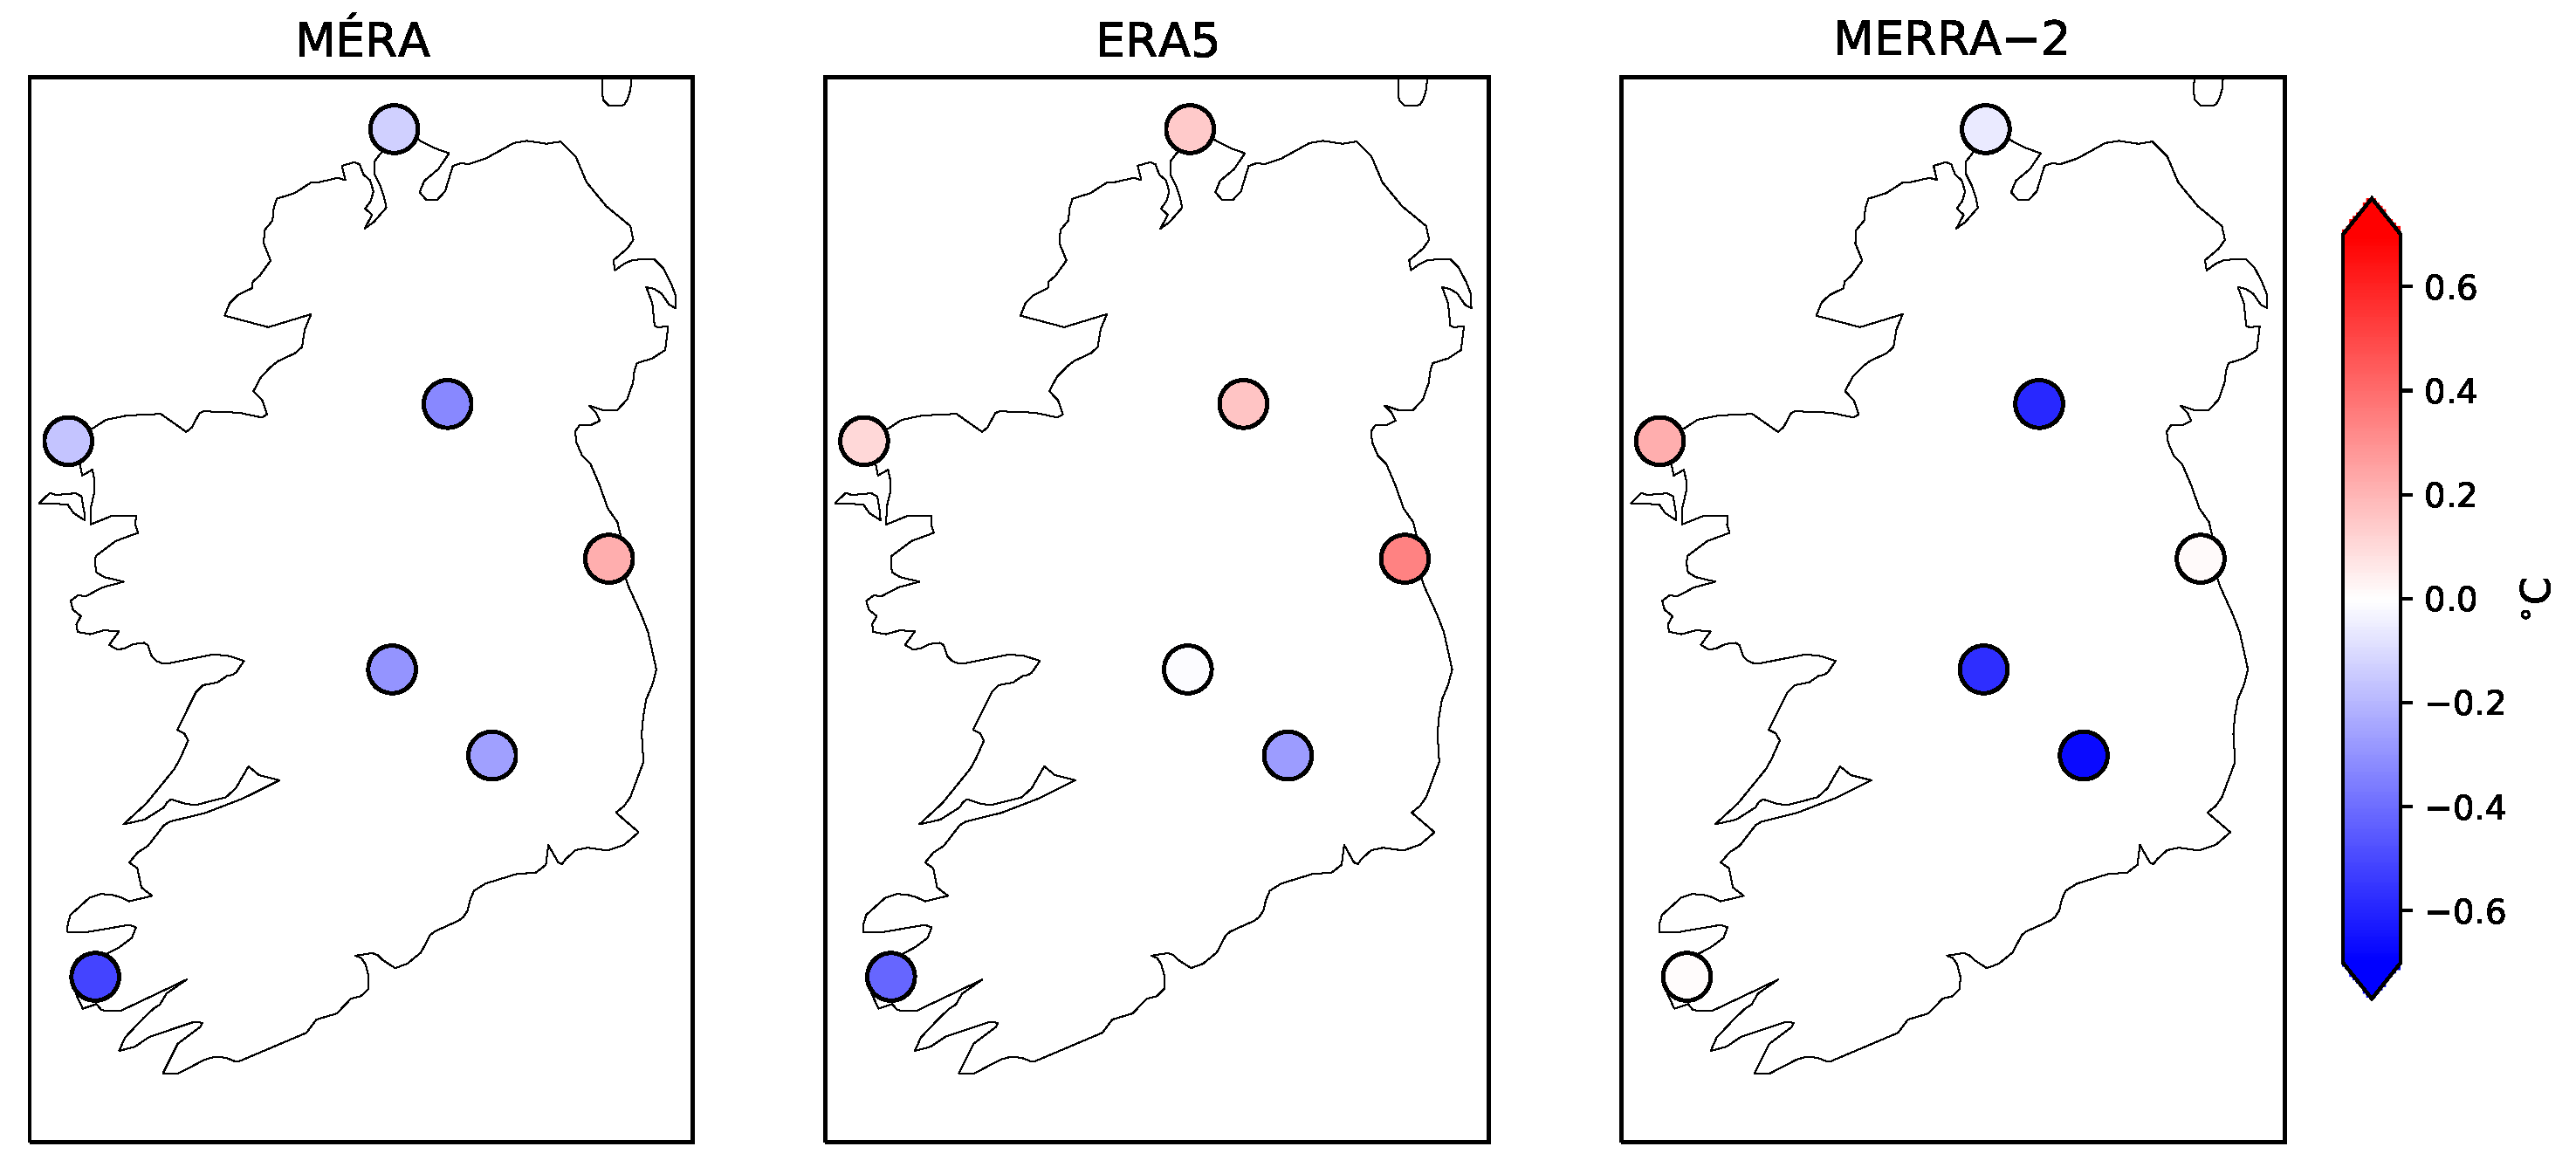
The ability of a reanalysis model to match observed temperature varies from location to location, as well as varying between reanalysis models. Generally, inland stations show different behaviours compared with coastal stations (the spatial distribution of temperature is shown in Figure S1 of the supplementary material). The global reanalysis MERRA-2 often overestimates temperature at coastal stations but underestimates temperature at inland stations (Figure 2). At inland stations, the elevation of grid-points in MERRA-2 are higher than actual station elevations. The global reanalyses’ interpolated grid-points are between 14 m and 56 m higher than actual elevations at selected inland Met Éireann stations. As temperature decreases with height, this results in the MERRA-2 inland locations having colder temperatures than observed. However, ERA5 grid-point elevations are also higher than the weather observing stations, particularly for inland locations; therefore, due to the contrasting error signals at Clones and Kilkenny (Figure 2), elevation mismatch between reality and model alone cannot account for temperature error in ERA5 and similarly for MÉRA. The magnitude of temperature error is relatively small compared with other weather variables, suggesting that temperature is one of the variables better captured by the models.
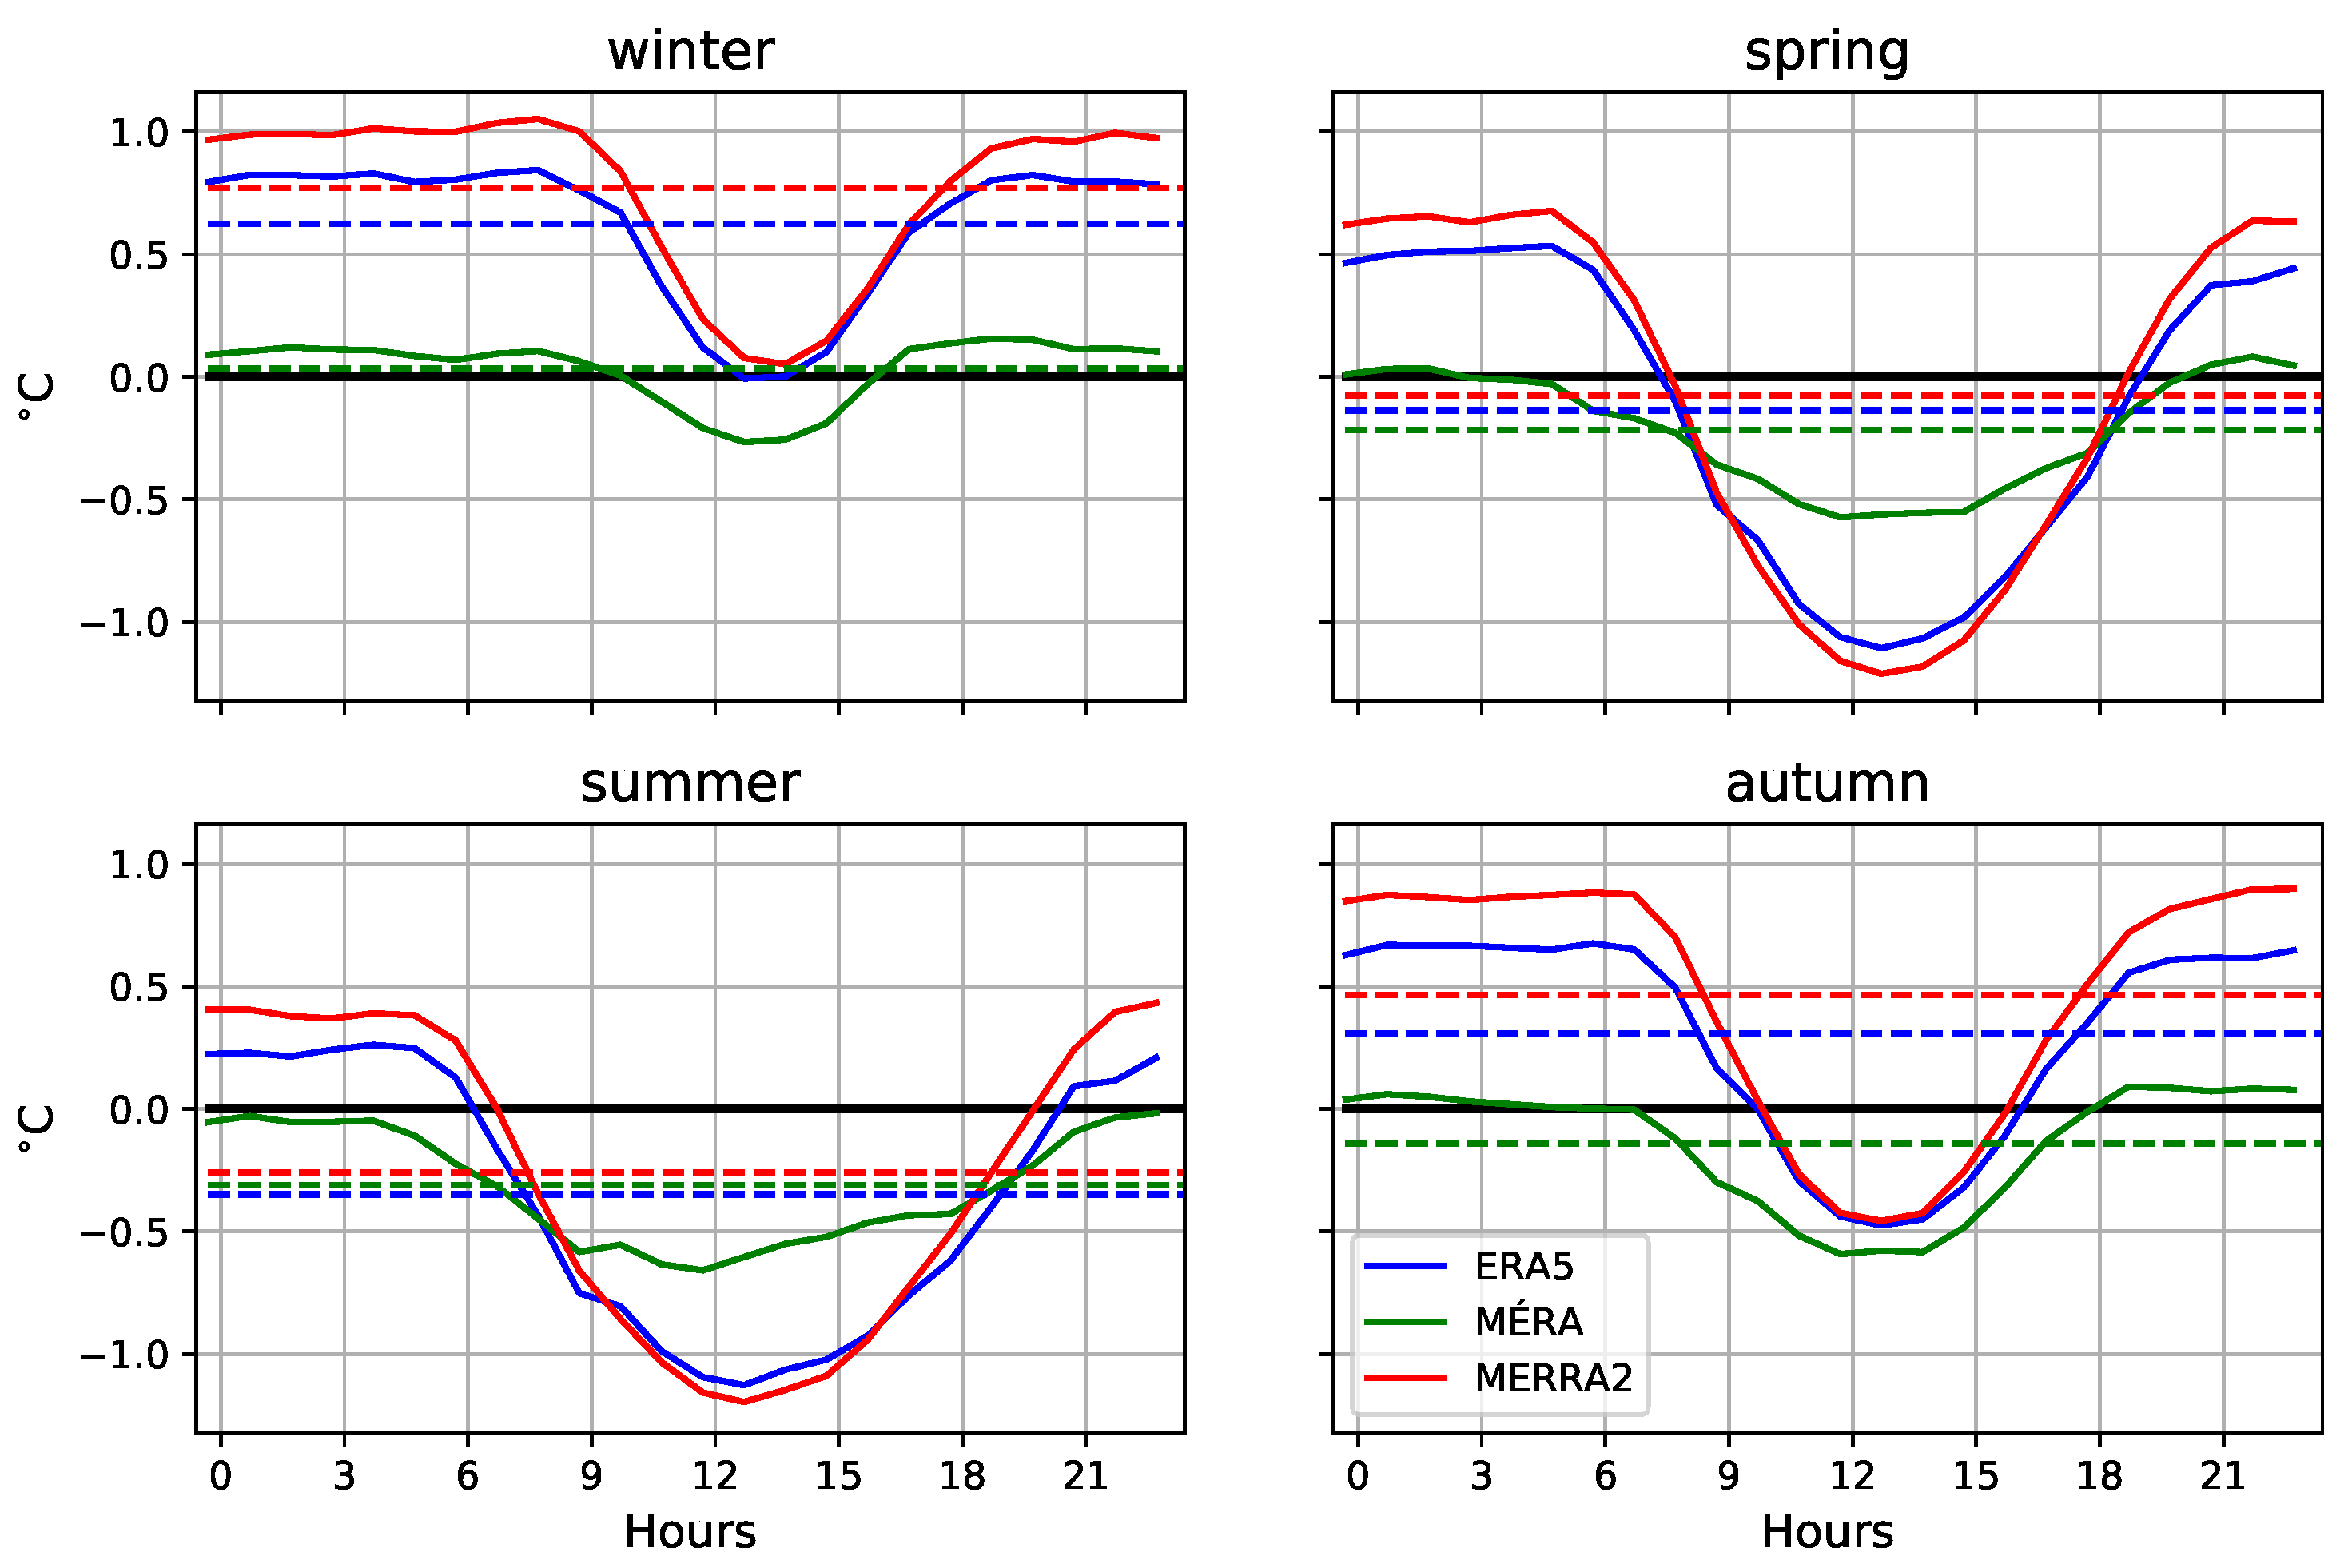
Figure 3 shows the seasonal mean and the diurnal pattern of temperature error at Belmullet, a coastal station in northwest Ireland (other stations are shown in Figures S4–S9 of the Supplementary Material). The climate at coastal locations such as Belmullet is strongly influenced by the adjacent sea surface temperatures. As the sea has a higher specific heat capacity than the land, the sea heats and cools more slowly than the land. However, if the influence of the sea is too strong in the reanalysis model, the air temperature at a coastal station will vary less during the year than it should. This seems to be the case in ERA5 and MERRA-2 at this coastal station as they have a positive bias in autumn (September, October, November: SON) and winter (December, January, February: DJF), but a negative bias in spring (March, April, May: MAM) and summer (June, July, August: JJA). This is particularly evident for all coastal stations in MERRA-2, when the cancellation of positive and negative seasonal errors lead to the small overall errors observed in Figure 3. The ME of MÉRA’s temperatures exhibits smaller changes from season to season, showing that it is better at capturing these seasonal changes in temperature both at coastal and inland stations. ME also changes less throughout the day for MÉRA compared with the other reanalyses, probably due to MÉRA’s better representation of elevation and land-use. Errors also show a diurnal variability, in which nighttime temperatures overestimate and daytime temperatures underestimate. A similar diurnal pattern is observed at all coastal stations, suggesting that land–sea interactions play a large role in the underdispersion of the variability in diurnal temperature, whereas inland stations generally display a reversed diurnal pattern, particularly in spring and summer.
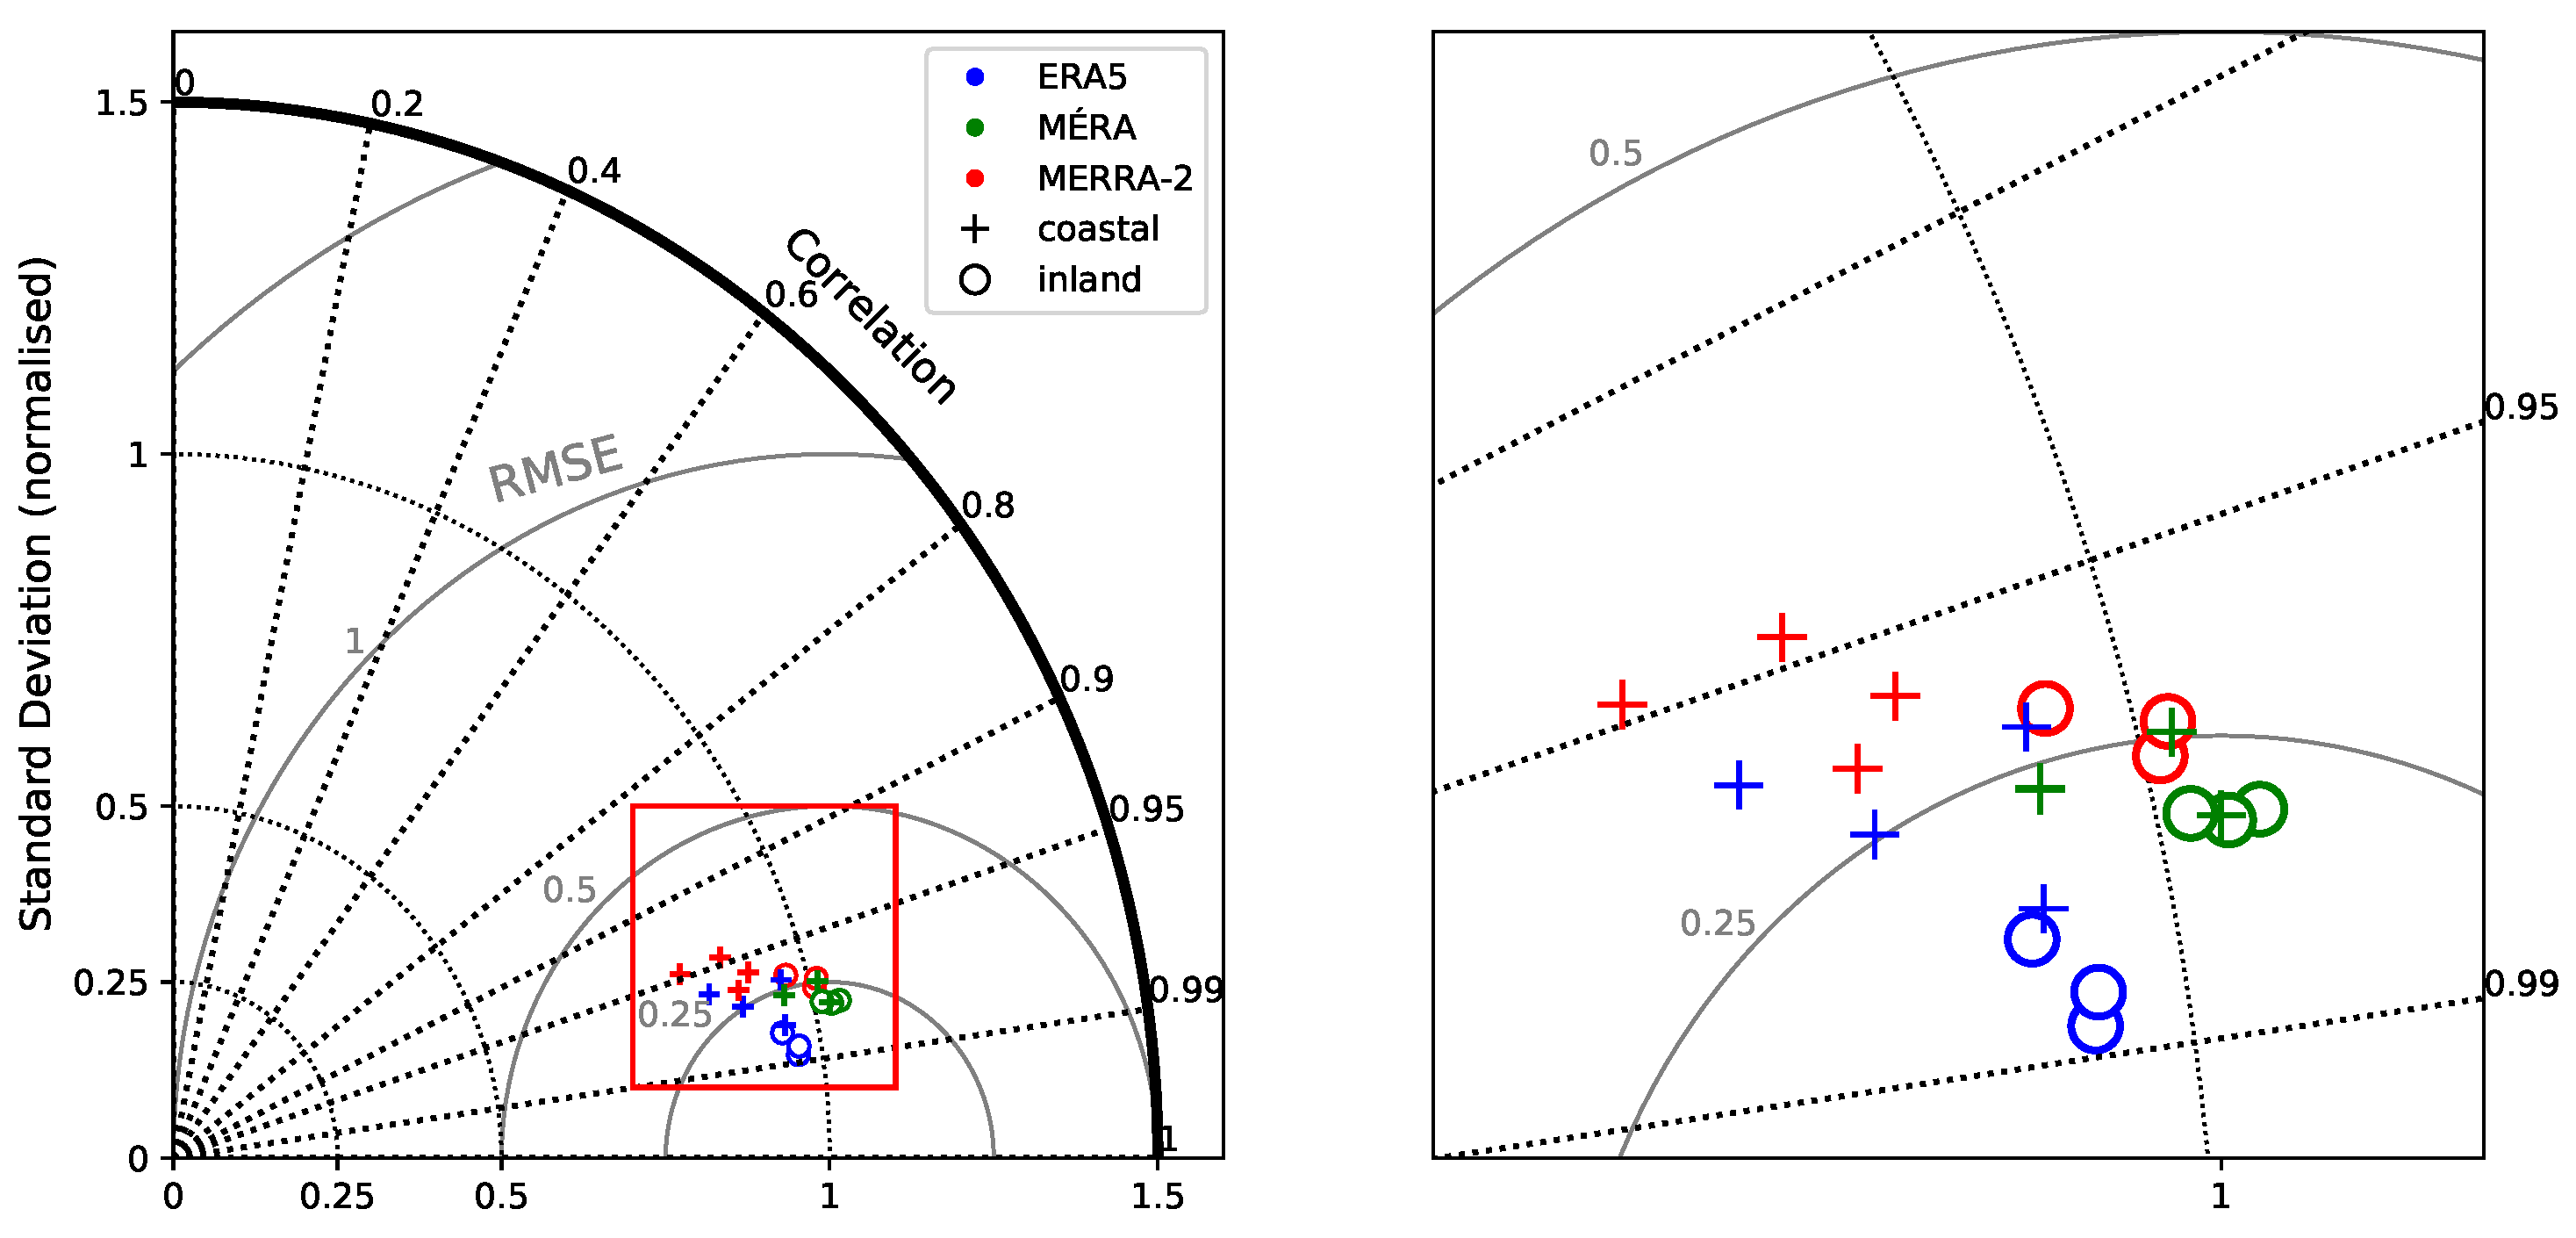
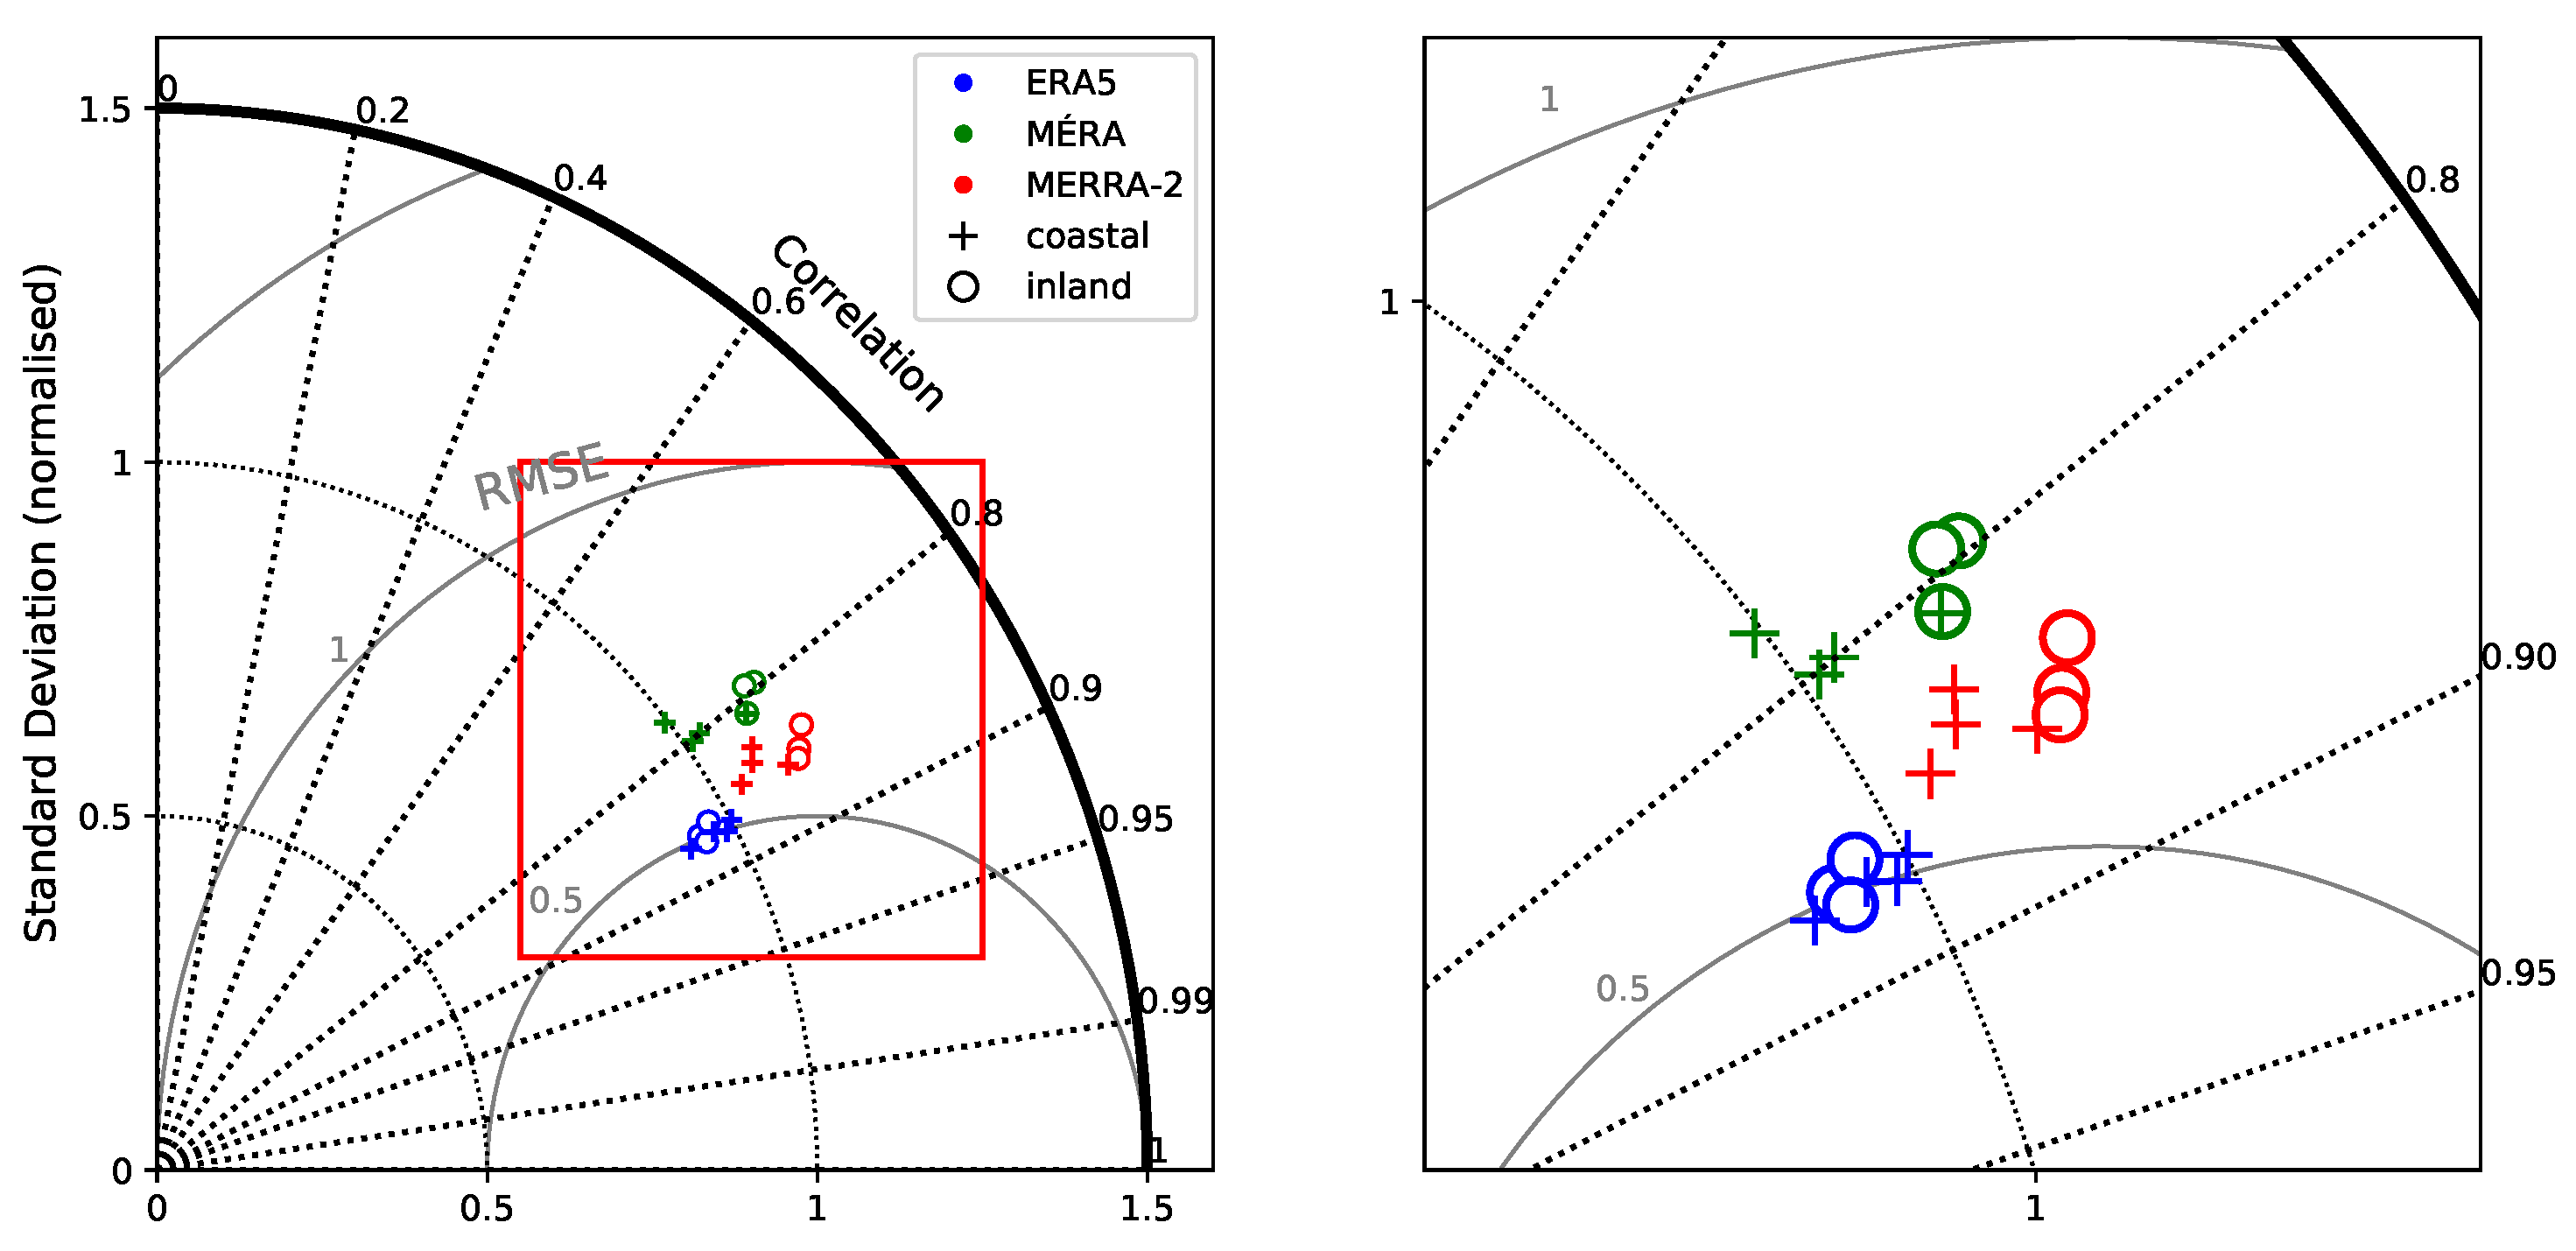
A Taylor diagram is a useful tool to compare the skill of all three reanalyses (Figure 4). Correlation coefficients are high (≥0.94) for all models, showing that all three reanalyses perform well in capturing the variability of temperature. The variability of temperature is best captured by MÉRA, as seen by all stations clustering near the normalised standard deviation of 1.0, while ERA5 and MERRA-2 are often underdispersive, particularly for coastal locations. MERRA-2 generally has the poorest CRMSE skill while ERA5 generally has the best. Figure 4 shows how temperature’s accuracy varies between location and model. There is a grouping of coastal stations versus inland stations in which each model’s performance is better at inland locations where inland stations generally have a better CRMSE along with a normalised standard deviation that better matches that of observations.
3.2. Wind Speed
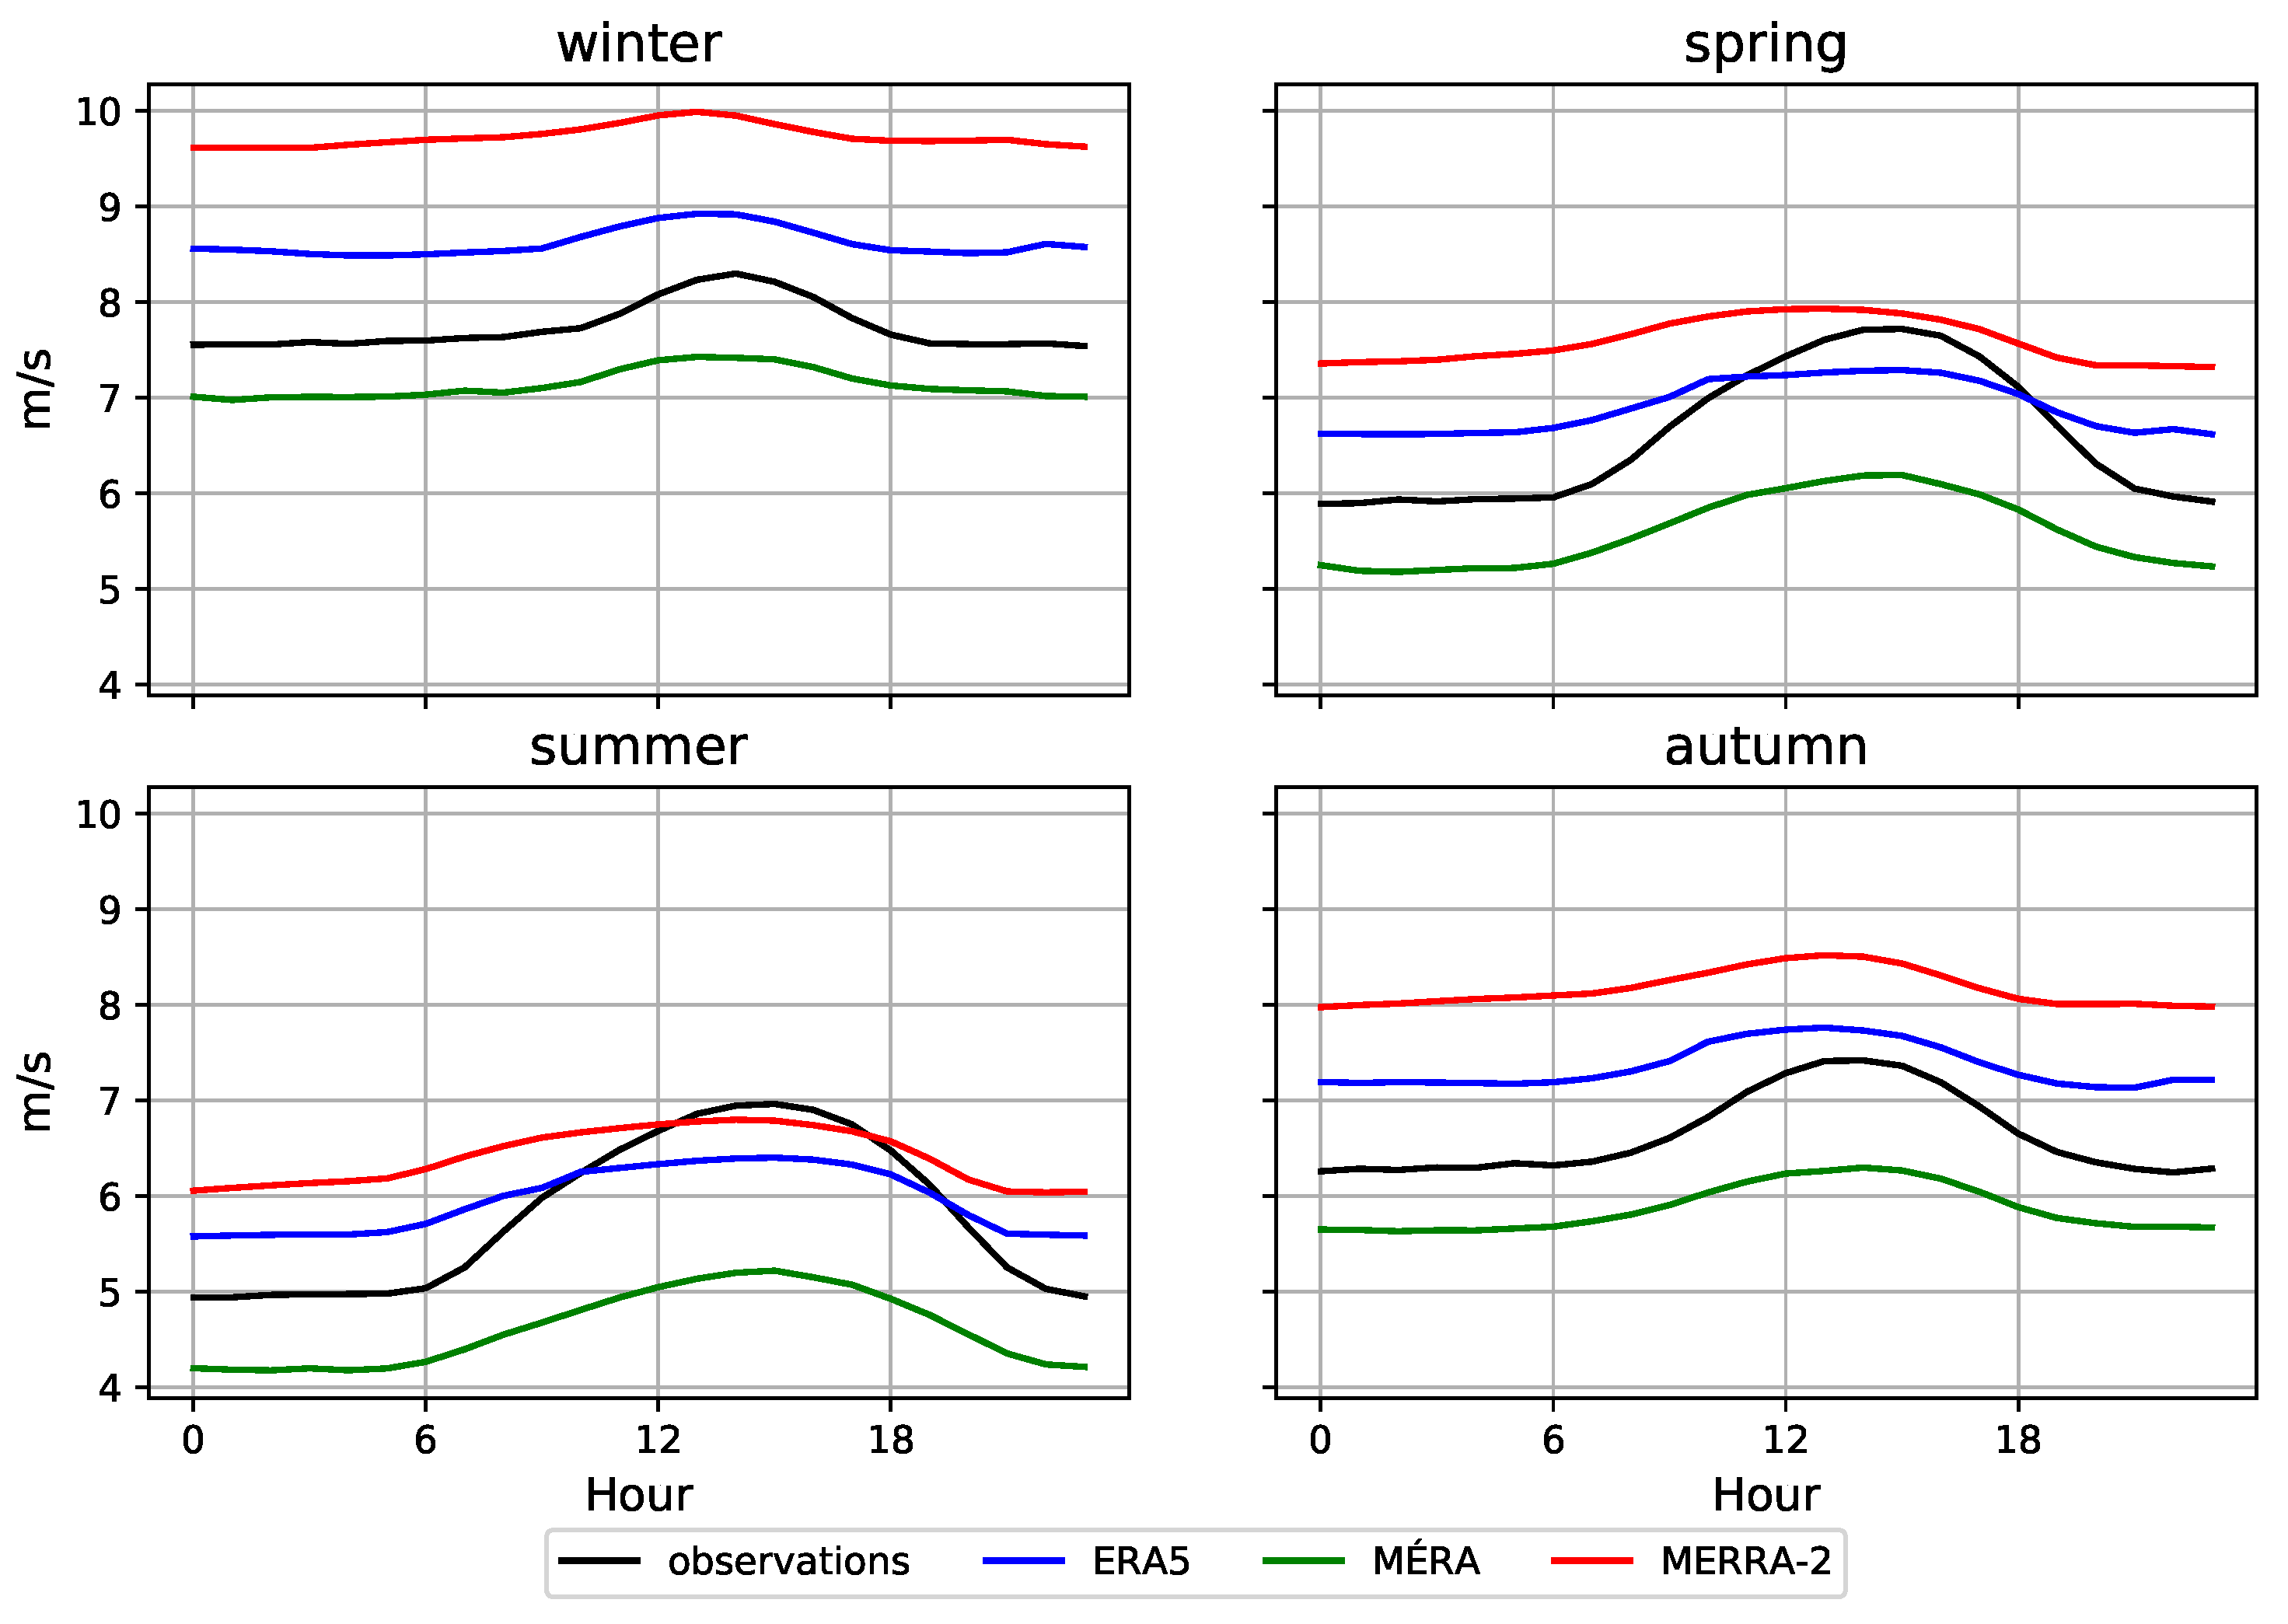
The average ACC values for 10 m wind speed are ≥0.76 for all reanalyses (Table 3), indicating that the seasonal variability of wind speed is captured reasonably well. ERA5 exhibits the lowest overall ME and RMSE. ERA5 may perform better at 10 m wind speeds because it has a vertical level located at approximately 10 m above the surface. MÉRA and MERRA-2 need to use model level data from approximately 12 m and 90 m, respectively, when calculating their 10 m winds.
Wind speed in MERRA-2 is higher than observations at all stations, except at the northern coastal station of Malin Head, possibly due to the low spatial resolution in MERRA-2, which fails to capture the land–sea differences at coastal stations. The other near-coastal stations (Belmullet, Dublin Airport, and Valentia Observatory) are windier in the global reanalyses than in observations, attributed largely with the proximity of the low-resolution grid-points to the sea and possible misrepresentation of surface friction, where the on-land point is treated as a smoother sea surface location resulting in less friction to reduce the high offshore wind. Again, the elevation difference between the model and observations leads to a generally windier estimation by the reanalyses, especially at inland stations. At coastal stations, MÉRA underestimates wind speeds, while it overestimates wind speeds at inland stations in all seasons, probably due to the misrepresentation of local effects of surface friction where near-coastal stations are classified as on-land grid-points by the model but in reality, the station has more offshore characteristics.
There is little variability in seasonal bias, except at Valentia Observatory, where MÉRA overestimates wind speeds in Autumn and Winter and underestimates in Spring and Summer, possibly due to the misrepresentation of the grid-box as part of the nearby sea. Along with the general bias in the reanalyses, at each station, there is a diurnal pattern in the wind speed error. An overestimation in wind speed during the night often changes to an underestimation in wind speed during daytime hours. This may be due to the reanalyses not capturing the vertical mixing in the lower part of the atmosphere. At sunrise, observed wind speeds increase faster than all reanalyses (Figure 5 and Figures S10–S15 in the Supplementary Material) due to turbulent mixing between different vertical levels, where higher wind speeds are entrained from faster wind speed layers higher up in the planetary boundary layer, causing the wind speed at the surface to become faster. MÉRA captures this effect best, possibly due to the higher resolution in the model.
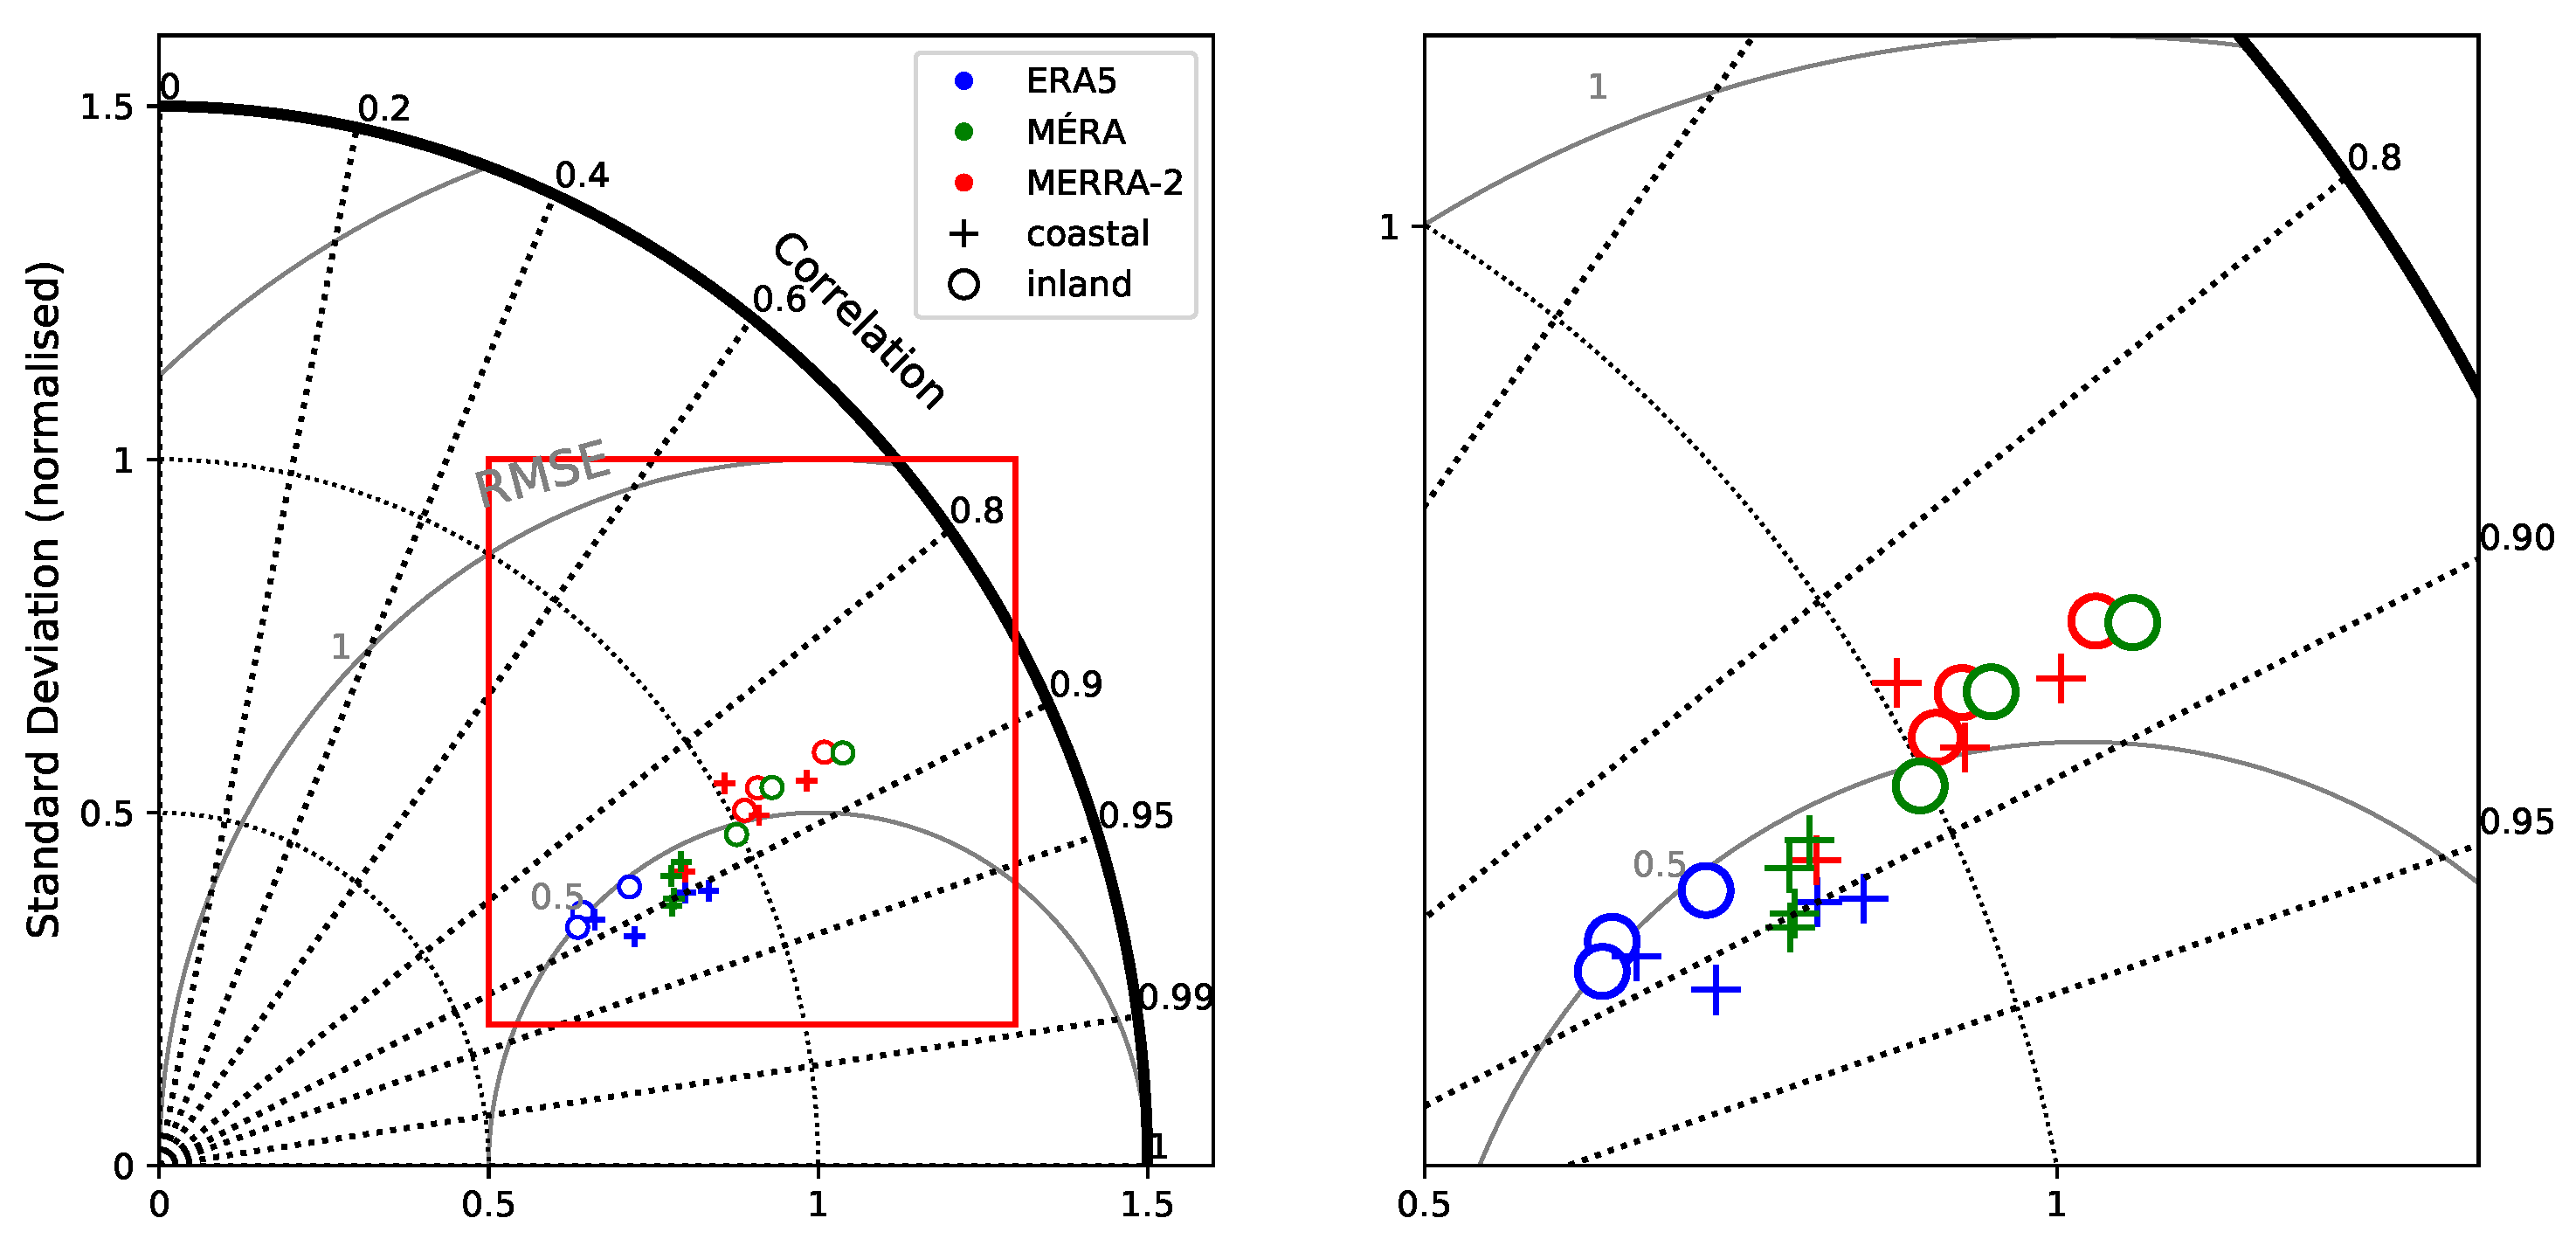
A Taylor diagram (Figure 6) shows that ERA5 is consistently underdispersive at all stations, MERRA-2 is overdispersive at all stations except Malin Head, while MÉRA changes depending on the station, where inland stations have a tendency to be overdispersive and coastal stations are underdispersive. Wind speed is less variable over the sea where there is little change in the sea surface, while inland locations are more variable due to changes in surface heating and, consequently, the wind speed. CRMSE is better for ERA5 and in MÉRA for most stations compared with MERRA-2. The average r values are ≥0.84 for all three reanalyses, indicating that day-to-day variability of wind speed is generally well captured by the reanalysis datasets. Importantly, Figure 6 indicates that there is no clear best model for overall accuracy.
3.3. Shortwave Radiation
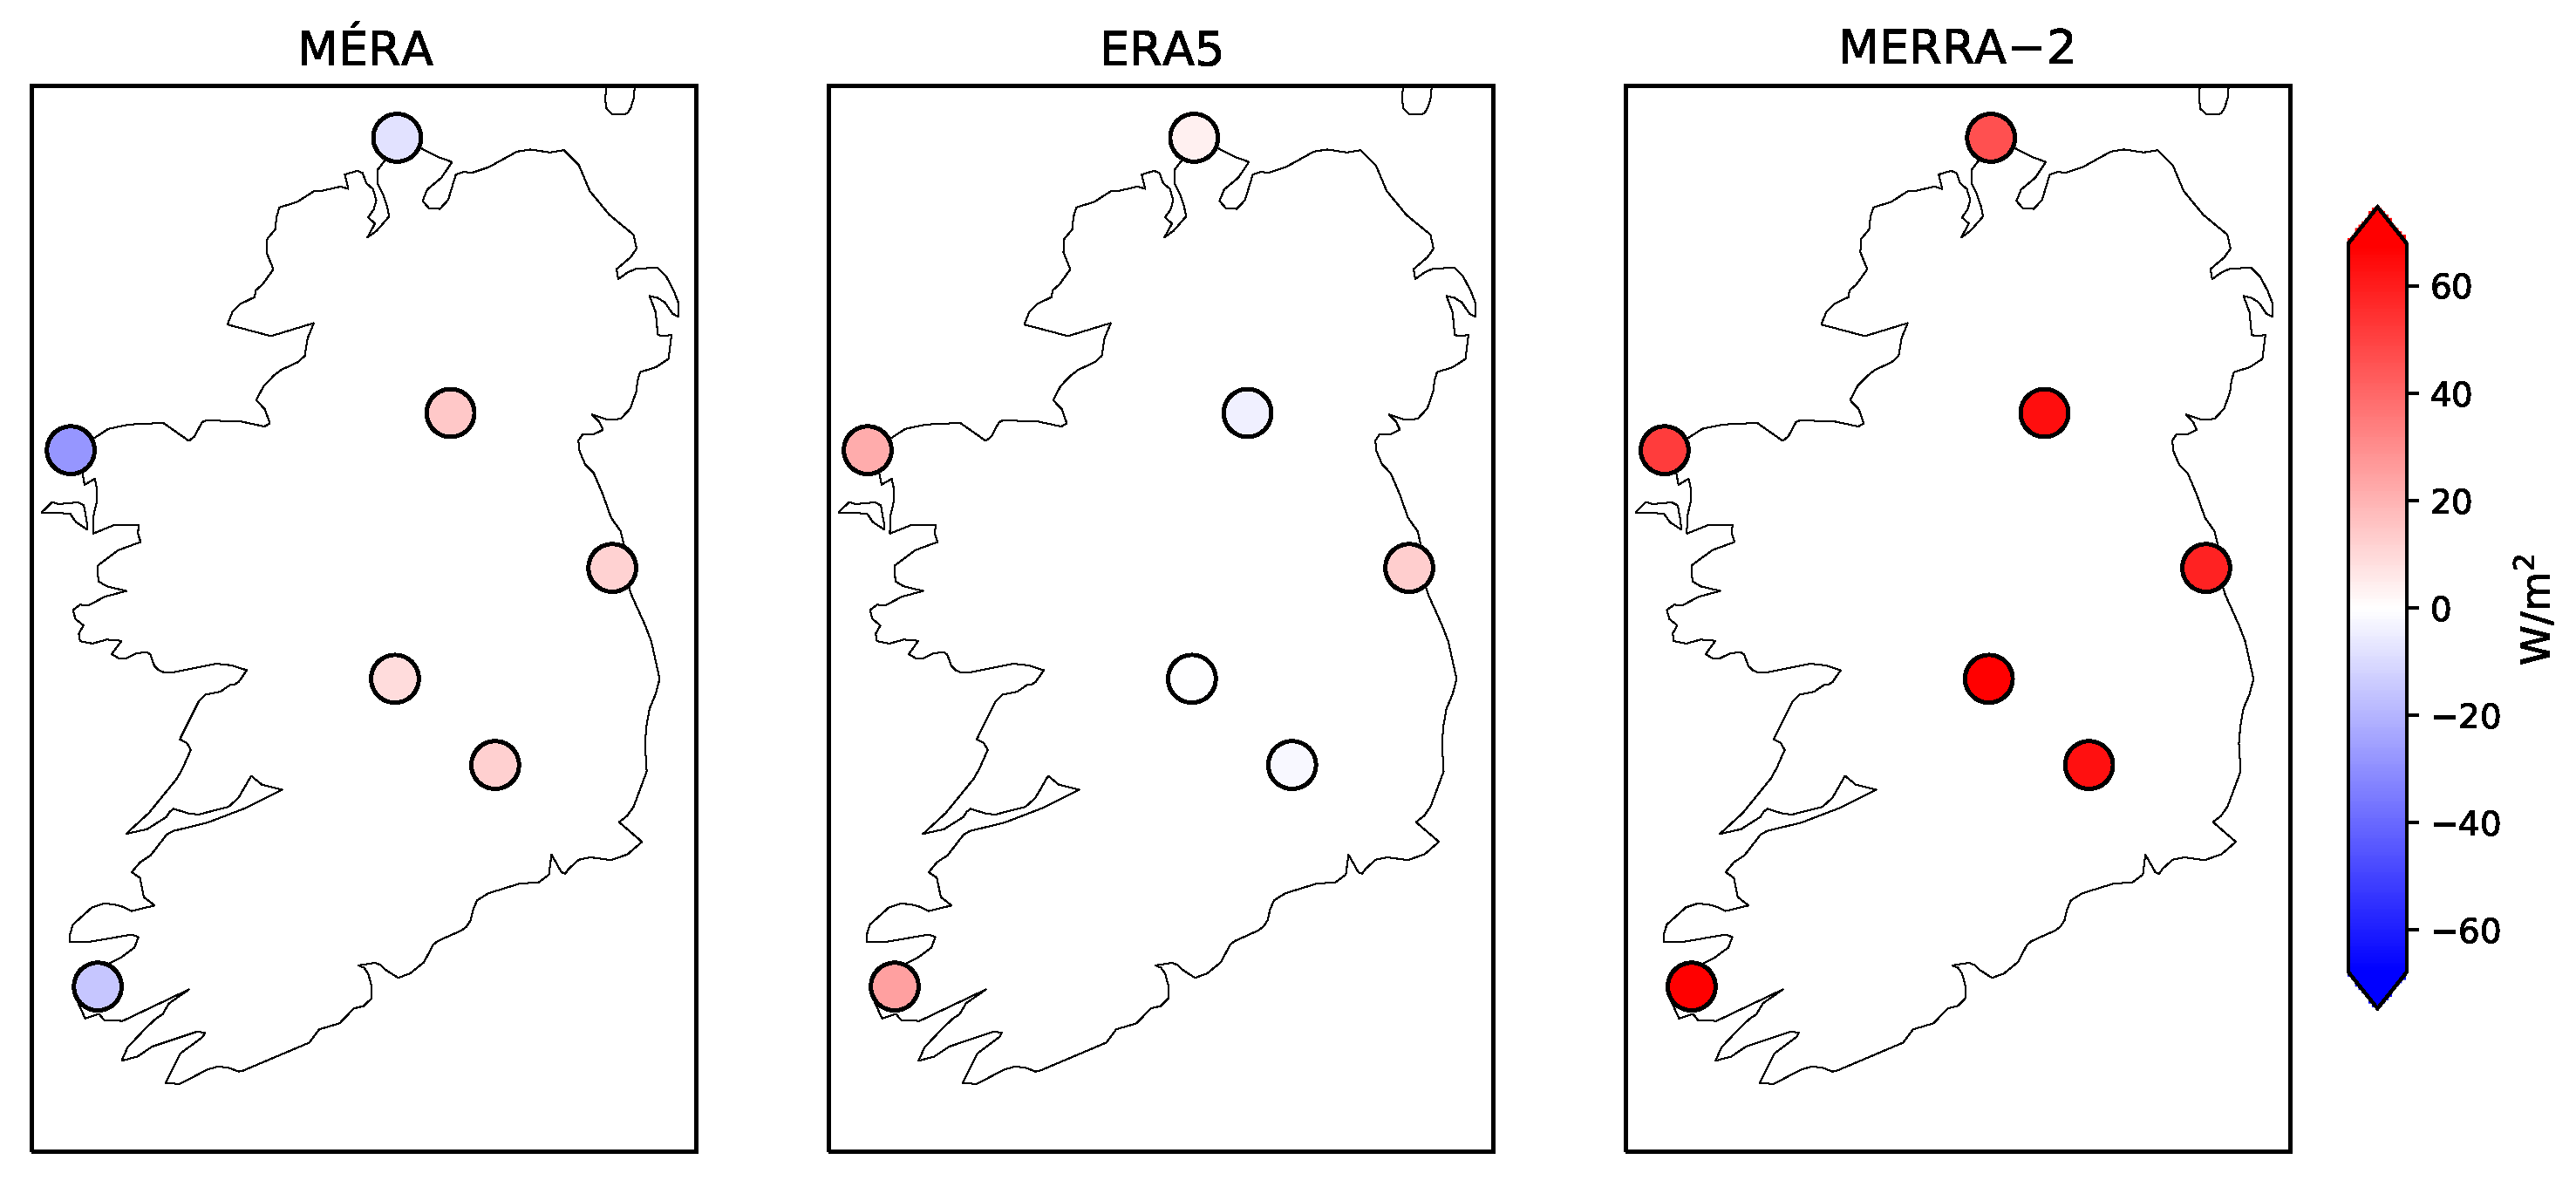
In Ireland, typical winter values of hourly SW are less than 50 W/m2 and summer values reach approximately 500 W/m2 on average, but can reach values of up to 1000 W/m2 within individual hours. As the focus of this paper is on renewable energy, only the summer period (JJA) is examined here, as this is most relevant to the production of photovoltaic (PV) in Ireland. Although MÉRA has the smallest ME, ERA5 has the best overall RMSE score and is the only reanalysis to achieve an ACC value marginally greater than 0.6 (the implied measure of skill) (Table 4). MERRA-2 has the largest ME, with all stations having a large positive bias (Figure 7). The small ME for MÉRA is due to the strong coastal versus inland effect, which leads to errors cancelling (Figure 7).
Stations located on the Atlantic facing coast (Malin Head, Belmullet, and Valentia Observatory) display a negative ME in MÉRA, whereas all other locations have a positive ME in MÉRA (Figure 7). This underestimation along the west coast of Ireland may be due to the presence of more thick clouds, which tend to have too much cloud water causing an underestimation of SW, as seen in other studies [13]. MERRA-2 and ERA5 have a positive bias in SW at all stations, mainly due to a poor prediction of cloud patterns, as seen in other studies such as [11,12].
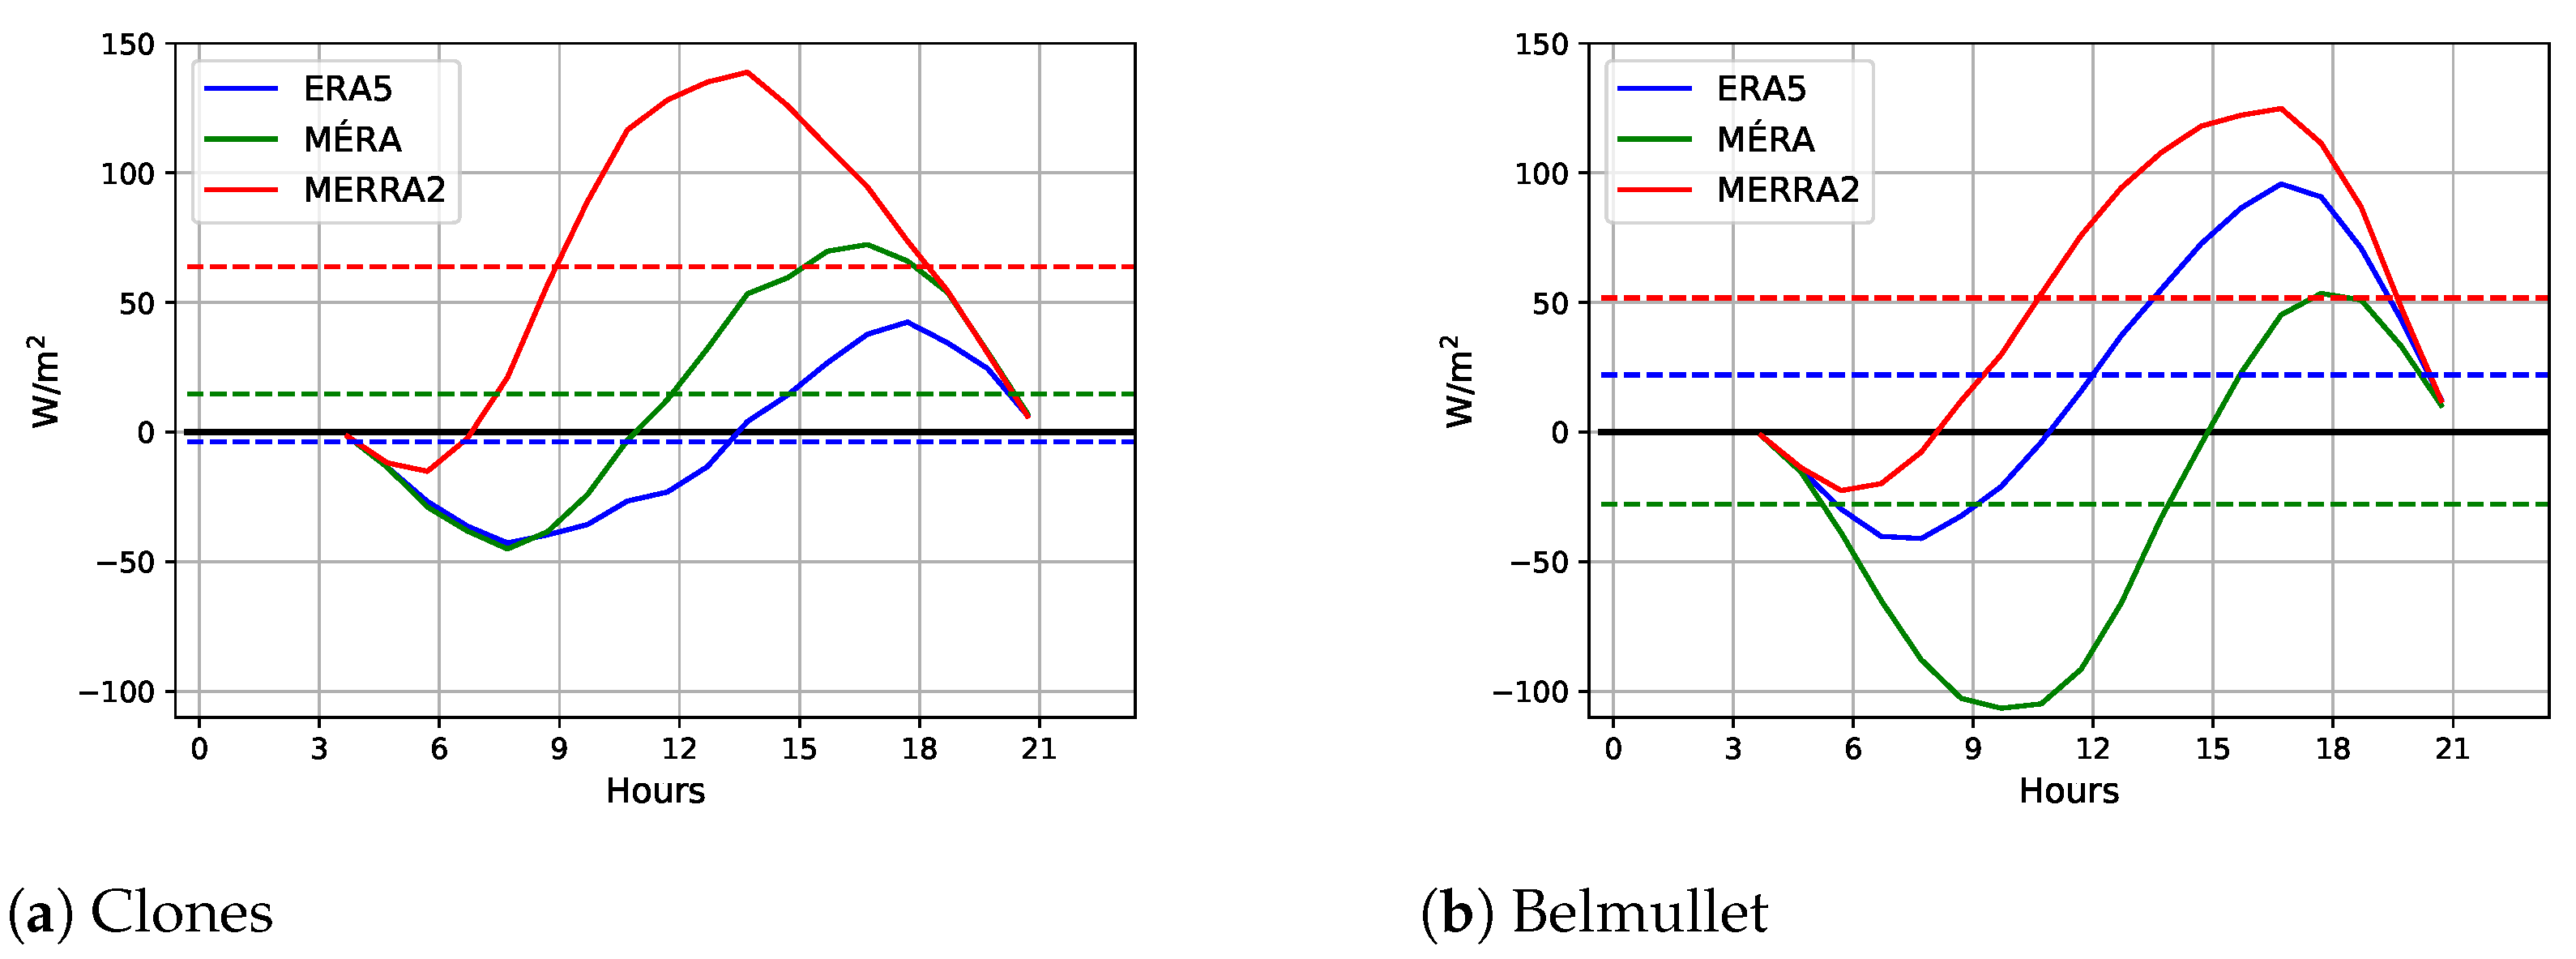
There is a obvious diurnal cycle in SW. However, this diurnal pattern is not accurately captured by the reanalyses. All reanalyses underestimate SW values in the morning (Figure 8 and Figures S16–S20 in Supplementary Material), possibly due to a poor estimation of aerosols in the models. By contrast, in the afternoons, all reanalyses overestimate SW, possibly attributable to shortcomings in the model physics, which may fail to capture the common development of cumulus clouds in the afternoon. The contrast between inland and coastal stations is particularly pronounced for MÉRA in the morning (Figure 8), when the coastal stations have a stronger underestimation.
The Taylor diagram in Figure 9 suggests that ERA5 best captures the observed SW, although it is slightly underdispersive at five of the seven stations. The correlation coefficients are 0.79 to 0.87 for each reanalysis, suggesting that part of the variability in hourly SW is captured by the reanalyses. Overall, ERA5 appears to perform better for SW during JJA, as seen in Figure 9 and Table 4. This may reflect the inclusion of satellite data in the data assimilation process, which is not included in MÉRA but is part of MERRA-2. ERA5’s performance may also be attributed to the higher spatial resolution compared with MERRA-2.
4. Conclusions
The accuracy of three reanalyses are assessed here in terms of hourly weather parameters relevant to the renewable energy sector in Ireland: 2 m temperature, 10 m wind speed, and incident shortwave radiation (SW). Two global datasets, MERRA-2 and ERA5, and one high-resolution regional dataset, MÉRA, are considered for a common validation period (1982–2007). Skill scores including ME, RMSE, ACC, and Spearmans correlation are calculated. The results presented here highlight the importance of carefully selecting the optimum reanalysis for specific applications, and comparing the reanalysis to site observations where possible. In terms of renewable energy, reanalysis data can be useful in the planning of viable locations for renewable energy generation, especially where observations are sparse. It is important to study as long a time period as possible as, for example, one or even a few years of data may not be representative of climatology. The results presented here highlight the limitations of reanalyses due to significant errors in all of the reanalyses studied in this paper. Therefore, alternative sources of data may be more suitable for use in standalone studies of wind and solar resources, such as the New European Wind Atlas [25] and the Global Solar Atlas [26]. These custom-made datasets with a reduced bias are tailored to renewable energy developers and specifically to the modelling of energy resources. However, as other research studies on renewable energy may require the use of reanalysis datasets, this paper aims to raise awareness of the importance of selecting the most suitable reanalysis dataset from those available.
All three reanalyses do well in replicating the observed 2 m temperature at the seven selected locations in Ireland, although ERA5 generally outperforms the others. SW is generally overestimated by the reanalyses and has a poorer skill than either wind speed or temperature. These results show that the highest resolution dataset may not necessarily be the most accurate. Results also highlight the variability in skill for different locations and variables in Ireland. Temperature and SW have a strong grouping of coastal versus inland stations; however, inland stations generally perform better for temperature, whereas coastal stations perform better for SW. There is generally a systematic error for all variables at all stations on a diurnal time scale. There is a connection between the diurnal error patterns at each station, such as the underestimation of SW in the morning, leading to lower temperature estimates during the day. There is also a systematic bias observed at most stations, often attributed to the mismatch in surface elevation and the land–sea component of grid-points or local land-use and surface friction. This suggests that a postprocessed dataset should be considered in the decision-making process, as this can reduce systematic errors for reanalysis datasets. Although ERA5 is never the worst, and is often the best, no reanalysis consistently outperforms the others for all weather parameters and locations. Therefore, the best dataset to use for renewable energy in Ireland will vary on a case-by-case basis, depending on factors such as location, timescale, and the meteorological variable of interest.
The good performance of ERA5 may be due to the newer method of data assimilation (4D-var) in the model compared with the other reanalyses, which still employ the older 3D-var version [12]. ERA5 also has a greater number of vertical levels, with the first vertical level closest to the observations at 10 m. MÉRA does not assimilate satellite data, which could be important for SW or cloud properties. The skill of regional reanalyses depends on the quality of the driving reanalysis; previous studies found that MÉRA performs better than its driving reanalysis ERA-interim [19], and studies have also found that ERA5 performs better than ERA-interim [5,12,27]. Therefore, the proposed development of a new MÉRA model with ERA5 as the driving global reanalysis should lead to an improved regional scale reanalysis for Ireland.
Supplementary Materials
The following is available online https://www.mdpi.com/article/10.3390/atmos12050624/s1: Figures S1–S3: The spatial pattern for each reanalysis and weather stations for temperature, wind speed, and SW. Figures S4–S9: diurnal mean error for temperature at each individual station. Figures S10–S15: diurnal mean wind speed at each station. Figures S16–S20: diurnal mean error for SW during summer at each station.
Author Contributions
Conceptualization, E.D.C., C.S., and S.G.; methodology, E.D.C.; validation, E.D.C.; formal analysis, E.D.C.; investigation, E.D.C.; data curation, S.G.; writing—original draft preparation, E.D.C.; writing—review and editing, E.D.C., C.S., F.M., S.G., and J.M.C.; visualization, E.D.C.; supervision, C.S. and F.M. All authors have read and agreed to the published version of the manuscript.
Funding
This research was funded (in part) by Science Foundation Ireland (SFI) under the SFI Strategic Partnership Programme Grant Number SFI/15/SPP/E3125.
Institutional Review Board Statement
Not applicable.
Informed Consent Statement
Not applicable.
Data Availability Statement
MÉRA reanalysis data is available on request from the Irish Meteorological Service, Met Éireann. ERA5 reanalysis data can be found here: https://cds.climate.copernicus.eu/cdsapp#!/dataset/reanalysis-era5-single-levels?tab=overview (accessed on 5 May 2019). MERRA-2 reanalysis data can be found here: https://disc.gsfc.nasa.gov/datasets?project=MERRA-2 (accessed on 5 May 2019). The publicly available Met Éireann weather observation station wind speed and temperature data can be found here: https://www.met.ie/climate/available-data/historical-data (accessed on 5 May 2019), while the SW data is available on request from Met Éireann.
Acknowledgments
This publication has emanated from research supported (in part) by Science Foundation Ireland (SFI) under the SFI Strategic Partnership Programme Grant Number SFI/15/SPP/E3125. The opinions, findings, and conclusions or recommendations expressed in this material are those of the author(s) and do not necessarily reflect the views of the Science Foundation Ireland. In addition, the authors would also like to acknowledge Met Éireann for the provision of SW observational data and MÉRA data.
Conflicts of Interest
The authors declare no conflict of interest.
Abbreviations
The following abbreviations are used in this manuscript:
| ACC | Anomaly Correlation Coefficient |
| CRMSE | Centred Root Mean Square Error |
| DJF | December, January, February |
| ERA5 | ECMWF Reanalysis 5th Generation |
| JJA | June, July, August |
| MAM | March, April, May |
| ME | Mean Error |
| MÉRA | Met Éireann Reanalysis |
| MERRA-2 | Modern-Era Retrospective analysis for Research and Applications, Version 2 |
| NWP | Numerical Weather Prediction |
| PV | Photovoltaic |
| r | Spearman’s correlation |
| RMSE | Root Mean Square Error |
| SON | September, October, November |
| SW | Shortwave Radiation |
References
- Copernicus Climate Change Service (C3S). ERA5: Fifth Generation of ECMWF Atmospheric Reanalyses of the Global Climate. Copernicus Climate Change Service Climate Data Store (CDS). 2017. Available online: https://cds.climate.copernicus.eu/cdsapp#!/home (accessed on 2 May 2019).
- Gelaro, R.; McCarty, W.; Suárez, M.J.; Todling, R.; Molod, A.; Takacs, L.; Randles, C.A.; Darmenov, A.; Bosilovich, M.G.; Reichle, R.; et al. The Modern-Era Retrospective Analysis for research and applications, version 2 (MERRA-2). J. Clim. 2017, 30, 5419–5454. [Google Scholar] [CrossRef] [PubMed]
- Gleeson, E.; Whelan, E.; Hanley, J. Met Éireann high resolution reanalysis for Ireland. Adv. Sci. Res. 2017, 14, 49–61. [Google Scholar] [CrossRef] [Green Version]
- Monforti, F.; Gonzalez-Aparicio, I. Comparing the impact of uncertainties on technical and meteorological parameters in wind power time series modelling in the European Union. Appl. Energy 2017, 206, 439–450. [Google Scholar] [CrossRef]
- Ramon, J.; Lledó, L.; Torralba, V.; Soret, A.; Doblas-Reyes, F.J. What global reanalysis best represents near-surface winds? Q. J. R. Meteorol. Soc. 2019, 145, 3236–3251. [Google Scholar] [CrossRef] [Green Version]
- Almendra-Martín, L.; Martínez-Fernández, J.; González-Zamora, Á.; Benito-Verdugo, P.; Herrero-Jiménez, C.M. Agricultural drought trends on the Iberian Peninsula: An analysis using modeled and reanalysis soil moisture products. Atmosphere 2021, 12, 236. [Google Scholar] [CrossRef]
- Xu, L.; Chen, N.; Moradkhani, H.; Zhang, X.; Hu, C. Improving global monthly and daily precipitation estimation by fusing gauge observations, remote sensing, and reanalysis data sets. Water Resour. Res. 2020, 56, e2019WR026444. [Google Scholar] [CrossRef]
- Do, H.X.; Westra, S.; Leonard, M.; Gudmundsson, L. Global-scale prediction of flood timing using atmospheric reanalysis. Water Resour. Res. 2020, 56, e2019WR024945. [Google Scholar] [CrossRef]
- Mohanty, M.P.; Simonovic, S.P. Fidelity of reanalysis datasets in floodplain mapping: Investigating performance at inundation level over large regions. J. Hydrol. 2020, 125757. [Google Scholar] [CrossRef]
- Hu, G.; Franzke, C.L. Evaluation of daily precipitation extremes in reanalysis and gridded observation-based data sets over Germany. Geophys. Res. Lett. 2020, 47, e2020GL089624. [Google Scholar] [CrossRef]
- Yang, D.; Bright, J.M. Worldwide validation of 8 satellite-derived and reanalysis solar radiation products: A preliminary evaluation and overall metrics for hourly data over 27 years. Sol. Energy 2020, 210, 3–19. [Google Scholar] [CrossRef]
- Urraca, R.; Huld, T.; Gracia-Amillo, A.; Martinez-de Pison, F.J.; Kaspar, F.; Sanz-Garcia, A. Evaluation of global horizontal irradiance estimates from ERA5 and COSMO-REA6 reanalyses using ground and satellite-based data. Sol. Energy 2018, 164, 339–354. [Google Scholar] [CrossRef]
- Nielsen, K.; Gleeson, E. Using shortwave radiation to evaluate the HARMONIE-AROME weather model. Atmosphere 2018, 9, 163. [Google Scholar] [CrossRef] [Green Version]
- Babar, B.; Graversen, R.; Boström, T. Solar radiation estimation at high latitudes: Assessment of the CMSAF databases, ASR and ERA5. Sol. Energy 2019, 182, 397–411. [Google Scholar] [CrossRef]
- Bender, F.M.; Frey, L.; McCoy, D.T.; Grosvenor, D.P.; Mohrmann, J.K. Assessment of aerosol–cloud–radiation correlations in satellite observations, climate models and reanalysis. Clim. Dyn. 2019, 52, 4371–4392. [Google Scholar] [CrossRef] [Green Version]
- Staffell, I.; Pfenninger, S. Using bias-corrected reanalysis to simulate current and future wind power output. Energy 2016, 114, 1224–1239. [Google Scholar] [CrossRef] [Green Version]
- Carvalho, D. An Assessment of NASA’s GMAO MERRA-2 Reanalysis Surface Winds. J. Clim. 2019, 32, 8261–8281. [Google Scholar] [CrossRef]
- Miao, H.; Dong, D.; Huang, G.; Hu, K.; Tian, Q.; Gong, Y. Evaluation of Northern Hemisphere surface wind speed and wind power density in multiple reanalysis datasets. Energy 2020, 200, 117382. [Google Scholar] [CrossRef]
- Whelan, E.; Gleeson, E.; Hanley, J. An Evaluation of MÉRA, a High-Resolution Mesoscale Regional Reanalysis. J. Appl. Meteorol. Climatol. 2018, 57, 2179–2196. [Google Scholar] [CrossRef]
- Draper, C.S.; Reichle, R.H.; Koster, R.D. Assessment of MERRA-2 land surface energy flux estimates. J. Clim. 2018, 31, 671–691. [Google Scholar] [CrossRef]
- Hersbach, H.; Bell, B.; Berrisford, P.; Hirahara, S.; Horányi, A.; Muñoz-Sabater, J.; Nicolas, J.; Peubey, C.; Radu, R.; Schepers, D.; et al. The ERA5 global reanalysis. Q. J. R. Meteorol. Soc. 2020, 146, 1999–2049. [Google Scholar] [CrossRef]
- McCarty, W.; Coy, L.; Gelaro, R.; Huang, A.; Merkova, D.; Smith, E.; Sienkiewicz, M.; Wargan, K. MERRA-2 Input Observations: Summary and Assessment. Technical Report Series on Global Modeling and Data Assimilation, Volume 46. 2016. Available online: https://gmao.gsfc.nasa.gov/pubs/docs/McCarty885.pdf (accessed on 29 April 2021).
- WMO. Manual on the Global Data-Processing and Forecasting System. Volume 1—Global Aspects. 2015. Available online: https://www.wmo.int/pages/prog/www/DPFS/documents/485_Vol_I_en.pdf (accessed on 25 April 2017).
- Taylor, K.E. Summarizing multiple aspects of model performance in a single diagram. J. Geophys. Res. Atmos. 2001, 106, 7183–7192. [Google Scholar] [CrossRef]
- Dörenkämper, M.; Olsen, B.T.; Witha, B.; Hahmann, A.N.; Davis, N.N.; Barcons, J.; Ezber, Y.; García-Bustamante, E.; González-Rouco, J.F.; Navarro, J.; et al. The making of the new european wind atlas–part 2: Production and evaluation. Geosci. Model Dev. 2020, 13, 5079–5102. [Google Scholar] [CrossRef]
- Energy Sector Management Assistance Program Washington, D.C.: World Bank Group. Global Solar Atlas 2.0: Technical Report. 2019. Available online: http://documents.worldbank.org/curated/en/529431592893043403/Global-Solar-Atlas-2-0-Technical-Report (accessed on 29 April 2021).
- He, Y.; Wang, K.; Feng, F. Improvement of ERA5 over ERA-Interim in Simulating Surface Incident Solar Radiation throughout China. J. Clim. 2021, 34, 3853–3867. [Google Scholar] [CrossRef]
Figure 1.
Irish weather observing stations used in this study.

Figure 2.
Mean Error (ME) for 2 m temperature at each station for each reanalysis.

Figure 3.
Diurnal mean error (ME) for 2 m temperature at the coastal station Belmullet in winter (DJF), spring (MAM), summer (JJA), and autumn (SON) for ERA5 (blue), MÉRA (green), and MERRA-2 (red). The horizontal dashed lines represent the overall average seasonal ME.
Figure 3.
Diurnal mean error (ME) for 2 m temperature at the coastal station Belmullet in winter (DJF), spring (MAM), summer (JJA), and autumn (SON) for ERA5 (blue), MÉRA (green), and MERRA-2 (red). The horizontal dashed lines represent the overall average seasonal ME.

Figure 4.
Left: Taylor diagram of 2 m temperature at all stations (coastal (+) and inland (o)) for ERA5 (blue), MÉRA (green), and MERRA-2 (red). The radial dimension represents the model normalised standard deviations, correlation coefficients are represented in angular coordinates and the arcs show the normalised centred RMSE (CRMSE). Right: close-up view of the red box in left plot.

Figure 5.
Mean 10 m wind speed at each hour at the coastal station Belmullet for winter (DJF), spring (MAM), summer (JJA), and autumn (SON) for ERA5 (blue), MÉRA (green), and MERRA-2 (red) compared with observations (black).
Figure 5.
Mean 10 m wind speed at each hour at the coastal station Belmullet for winter (DJF), spring (MAM), summer (JJA), and autumn (SON) for ERA5 (blue), MÉRA (green), and MERRA-2 (red) compared with observations (black).

Figure 6.
Left: Taylor diagram of 10 m wind speed at all stations (coastal (+) and inland (o)) for ERA5 (blue), MÉRA (green), and MERRA-2 (red). The radial dimension represents the model normalised standard deviations, correlation coefficients are represented in angular coordinates, and the arcs show the normalised centred RMSE (CRMSE). Right: close-up view of the red box in left plot.

Figure 7.
Mean error for summer (JJA) SW at each station for each reanalysis.

Figure 8.
Diurnal mean SW error (ME) in summer (JJA) at (a) the inland station Clones and (b) the coastal station Belmullet for ERA5 (blue), MÉRA (green), and MERRA-2 (red). The horizontal dashed line represents the overall average seasonal ME.
Figure 8.
Diurnal mean SW error (ME) in summer (JJA) at (a) the inland station Clones and (b) the coastal station Belmullet for ERA5 (blue), MÉRA (green), and MERRA-2 (red). The horizontal dashed line represents the overall average seasonal ME.

Figure 9.
Left: Taylor diagram of SW in summer (JJA) for ERA5 (blue), MÉRA (green), and MERRA-2 (red). The radial dimension represents the model normalised standard deviations, correlation coefficients are represented in angular coordinates, and the arcs show the normalised centred RMSE (CRMSE). Right: close-up view of the red box in left plot.


Table 1.
Reanalysis Datasets.
| Dataset | Provider | Horizontal Resolution | Spatial Coverage | Temporal Coverage |
|---|---|---|---|---|
| MÉRA | Met Éireann | 2.5 km | Ireland and UK | 1981–2019 |
| ERA5 | ECMWF | Approx. 31 km | Global | 1979–present |
| MERRA-2 | NASA | Approx. 50 km | Global | 1979–present |
Table 2.
Skill scores of each reanalysis compared to observations: anomaly correlation coefficient (ACC), Spearman’s correlation (r), mean error (ME), and root mean square error (RMSE) for hourly 2 m temperature averaged over all stations.
Table 2.
Skill scores of each reanalysis compared to observations: anomaly correlation coefficient (ACC), Spearman’s correlation (r), mean error (ME), and root mean square error (RMSE) for hourly 2 m temperature averaged over all stations.
| Reanalysis | ACC | r | ME (°C) | RMSE (°C) |
|---|---|---|---|---|
| MÉRA | 0.92 | 0.97 | −0.21 | 1.10 |
| ERA5 | 0.92 | 0.98 | 0.01 | 1.01 |
| MERRA-2 | 0.86 | 0.96 | −0.24 | 1.37 |
Table 3.
Skill scores of each reanalysis compared to observations: anomaly correlation coefficient (ACC), Spearman’s correlation (r), mean error (ME), and root mean square error (RMSE) for hourly 10 m wind speed averaged over all stations.
Table 3.
Skill scores of each reanalysis compared to observations: anomaly correlation coefficient (ACC), Spearman’s correlation (r), mean error (ME), and root mean square error (RMSE) for hourly 10 m wind speed averaged over all stations.
| Reanalysis | ACC | r | ME (m/s) | RMSE (m/s) |
|---|---|---|---|---|
| MÉRA | 0.82 | 0.88 | 0.13 | 1.76 |
| ERA5 | 0.85 | 0.89 | 0.06 | 1.52 |
| MERRA-2 | 0.76 | 0.87 | 1.29 | 2.21 |
Table 4.
Skill scores of each reanalysis compared to observations: anomaly correlation coefficient (ACC), Spearman’s correlation (r), mean error (ME), and root mean square error (RMSE) for hourly SW averaged over all stations for summer (June, July, and August).
Table 4.
Skill scores of each reanalysis compared to observations: anomaly correlation coefficient (ACC), Spearman’s correlation (r), mean error (ME), and root mean square error (RMSE) for hourly SW averaged over all stations for summer (June, July, and August).
| Reanalysis | ACC | r | ME (W/m2) | RMSE (W/m2) |
|---|---|---|---|---|
| MÉRA | 0.55 | 0.79 | −0.32 | 152.57 |
| ERA5 | 0.64 | 0.87 | 8.33 | 115.98 |
| MERRA-2 | 0.46 | 0.85 | 60.03 | 147.88 |
Publisher’s Note: MDPI stays neutral with regard to jurisdictional claims in published maps and institutional affiliations. |
© 2021 by the authors. Licensee MDPI, Basel, Switzerland. This article is an open access article distributed under the terms and conditions of the Creative Commons Attribution (CC BY) license (https://creativecommons.org/licenses/by/4.0/).
Share and Cite
MDPI and ACS Style
Doddy Clarke, E.; Griffin, S.; McDermott, F.; Monteiro Correia, J.; Sweeney, C. Which Reanalysis Dataset Should We Use for Renewable Energy Analysis in Ireland? Atmosphere 2021, 12, 624. https://doi.org/10.3390/atmos12050624
AMA Style
Doddy Clarke E, Griffin S, McDermott F, Monteiro Correia J, Sweeney C. Which Reanalysis Dataset Should We Use for Renewable Energy Analysis in Ireland? Atmosphere. 2021; 12(5):624. https://doi.org/10.3390/atmos12050624
Chicago/Turabian StyleDoddy Clarke, Eadaoin, Seánie Griffin, Frank McDermott, João Monteiro Correia, and Conor Sweeney. 2021. "Which Reanalysis Dataset Should We Use for Renewable Energy Analysis in Ireland?" Atmosphere 12, no. 5: 624. https://doi.org/10.3390/atmos12050624
Note that from the first issue of 2016, this journal uses article numbers instead of page numbers. See further details here.