
Morphometric Evaluation of Detailed Asymmetry for the Proximal Humerus in Korean Population


1
Department of Biomedicine & Health Science, College of Medicine, The Catholic University of Korea, Seoul 06591, Korea
2
Department of Anatomy/Catholic Institute for Applied Anatomy, College of Medicine, The Catholic University of Korea, 222 Banpo-daero, Seocho-gu, Seoul 06591, Korea
*
Authors to whom correspondence should be addressed.
Symmetry 2021, 13(5), 862; https://doi.org/10.3390/sym13050862
Submission received: 30 March 2021
/
Revised: 11 May 2021
/
Accepted: 11 May 2021
/
Published: 12 May 2021
(This article belongs to the Special Issue Symmetry in Medicine and Biomechanics)
Abstract
:Computer-assisted orthopedic surgery and patient-specific instruments are widely used in orthopedic fields that utilize contralateral side bone data as a template to restore the affected side bone. The essential precondition for these techniques is that the left and right bone features are similar. Although proximal humerus fracture accounts for 4% to 8% of all fractures, the bilateral asymmetry of the proximal humerus is not fully understood. The aim of this study is to investigate anthropometric differences of the bilateral proximal humerus. One hundred one pairs of Korean humerus CT data from 51 females and 50 males were selected for this research. To investigate bilateral shape differences, we divided the proximal humerus into three regions and the proximal humerus further into five sections in each region. The distance from the centroid to the cortical outline at every 10 degrees was measured in each section. Differences were detected in all regions of the left and right proximal humerus; however, males had a larger number of significant differences than females. Large bilateral differences were measured in the greater tubercle. Nevertheless, using contralateral data as a template for repairing an affected proximal humerus might be possible.
1. Introduction
Bilateral asymmetry of the human body, which is regarded as a primitive curiosity, has been investigated by many anthropologists, archeologists, and scientists. Rhodes et al. reported activity-related skeletal changes in medieval humeri [1]. Kubika et al. reported bilateral asymmetry of the humerus in Neandertals [2]. These studies revealed how habitual behaviors during growth affected paleoanthropic bone features. Auerbach et al. reported a greater right bias in the upper limb bones of pre-modern humans than modern humans and that people who use their right hand dominantly have left-biased lower limb bones [3].
Bilateral skeletal asymmetry has recently been discussed among orthopedists and medical scientists. Anatomical landmarks that are utilized for traditional surgical methods can be hard to identify in some severe fractures. Various intraoperative and postoperative complications such as mismatch, malunion, nonunion, and bone loss can occur in this condition. Contralateral bone often is defined as the template for restoration of complex fractures [4]. Using unaffected contralateral side data as a template for affected side repairment can have advantages. Computer-assisted orthopedic surgery (CAOS) that utilizes contralateral data for the affected side not only allows more accurate preoperative diagnostic and surgical planning, but also provides much better visualization during operation [5,6,7,8,9]. Moreover, patient-specific implants and instruments (PSI), such as surgical implants and surgical guides, can have advantages for patients with more severe pathologic conditions [10,11]. The most important precondition when using contralateral unaffected side bone data to repair the affected bone is similar left and right bone features [12,13].
Bilateral skeletal bone asymmetry has been investigated by many researchers. Ten Berg et al. reported validity of using the contralateral side radius as a template for radial head arthroplasty [10]. Mopin et al. reported femoral asymmetry of the human as effective for distinguishing two populations [14]. Ferràs-Tarragó et al. also investigated femoral asymmetry and found symmetry between left and right healthy adult femurs [13].
The humerus, the biggest bone in the upper limb, has been investigated for applying CAOS and designing PSI. Fractures of the proximal humerus account for 4% to 8% of all fracture cases and are the third most common fracture in patients older than 65 years [15,16]. Eighty percent of proximal humeral fractures are slightly dislocated and possible to treat nonoperatively with good functional outcomes. However, surgical treatment might be needed if the patient has severe fractures or pathological conditions [15,16,17].
Preoperative planning with 3D simulation, CAOS, and PSI can have strengths in severe proximal humerus fractures. In particular, using personal information of the patient helps the surgeon to understand anatomical variation in the patient, reducing unnecessary damage during operation and postoperative complications. Furthermore, this can be helpful to patients who are aged and/or have pathological conditions.
There have been several studies concerning bilateral asymmetry of the humerus. The distal humerus, which is the proximal portion of the elbow, has a complicated anatomical structure and allows elaborate exercises. CAOS and/or PSI are commonly utilized for the distal humerus, so bilateral asymmetry of the distal humerus has been investigated by many researchers [8,9,18]. There are also several studies of bilateral asymmetry of the proximal humerus; however, measurements from these studies are of geometrical characteristics for designing arthroplasty prosthetics, such as head radius, head thickness, medial head center offsets, and so on [4,19,20]. Information regarding bilateral asymmetry of the proximal humerus surface shape is limited.
The aim of this study is to investigate anthropometric differences of the bilateral proximal humerus. Morphometric evaluation of the proximal humerus can have advantages not only for utilizing CAOS and designing PSI, but also for collecting anthropological data.
2. Materials and Methods
2.1. Ethics and Cadaver CT Data
This study was conducted in compliance with the Act on Dissection and Preservation of Corpses of the Republic of Korea (act number: 14,885) and was approved by the Institutional Review Board of College of Medicine, The Catholic University of Korea (No. MC20EAS10103). The computed tomography (CT) images used in our study were selected from the Catholic Digital Human Library, which stores CT scans of the cadaver with approval of the same committee (No. CUMC10U161). Written informed consent for use of the cadaver and consent for use of future research on the related materials were provided by all donors or authorized representatives.
We selected 101 bilateral humeri from 51 females and 50 males. We excluded CT data representing fractures or deformities of the humerus. The age of females was 38 years to 96 years, and the average was 61.1 years. The age of males was 22 years to 95 years, and the average was 57.8 years (Table 1). The average height of females was 156.3 cm, and that of males 164.9 cm. The CT images were less than 0.75 mm thick, and pixel dimensions were 0.33 mm to 0.42 mm.
2.2. Methods
2.2.1. 3D Modeling Process
CT data were imported into the 3D modeling software program Mimics (Version 22.0, Materialize NV, Leuven, Belgium) to assess the quality of CT images and 3D models. The same scanner was utilized to acquire CT images with the same scanning condition, and CT images were reconstructed using the same conditions to minimize these errors. To compare differences between bilateral humerus features, 3D models that contain only external shape, not internal structure information, were created and saved as stereolithography (STL) file format. CT images that were scanned with a calibration scale (plastic ball diameter = 2.25 inches) were adjusted to yield real size data. The 2.25-inch plastic ball has similar density to that of the cortical bone. We reconstructed the plastic ball with a 2.25-inch diameter and compared to the diameter of the 3D model and the real ball [21,22,23,24]. Each 3D model surface was formed with triangle mesh. Smaller triangles were used to represent more complex features and achieve more accurate analysis. The 3D reconstruction program that we used, one pixel of CT image is interpolated and used to create 3D model outlines. We selected the maximum edge length of the 3D model as 0.2 mm, which is less than the pixel dimensions in the CT images (0.33 mm). We determined that maximum edge length less than 0.2 mm cannot contribute to improved precision in 3D modeling. Therefore, we refined the maximum edge length of the 3D model’s triangle mesh to 0.2 mm.
2.2.2. 3D Model Alignment and Registration
The bilateral humerus 3D models were aligned manually to an anatomical coordination system. After humerus alignment, the left humerus was geometrically reflected. The reflected left humerus and non-reflected right humerus were overlapped and exported to measure length, volume, and surface area. The overlap registration method used was the iterative closest point (ICP) algorithm, which is considered an appropriate method to coordinate two free-form surfaces. We then cut the bilateral humeri in half to produce proximal 1/2 humerus models. To obtain a higher overlap ratio, bilateral 1/2 proximal humerus models were registered once more using the ICP algorithm (Figure 1).
2.2.3. Measurements
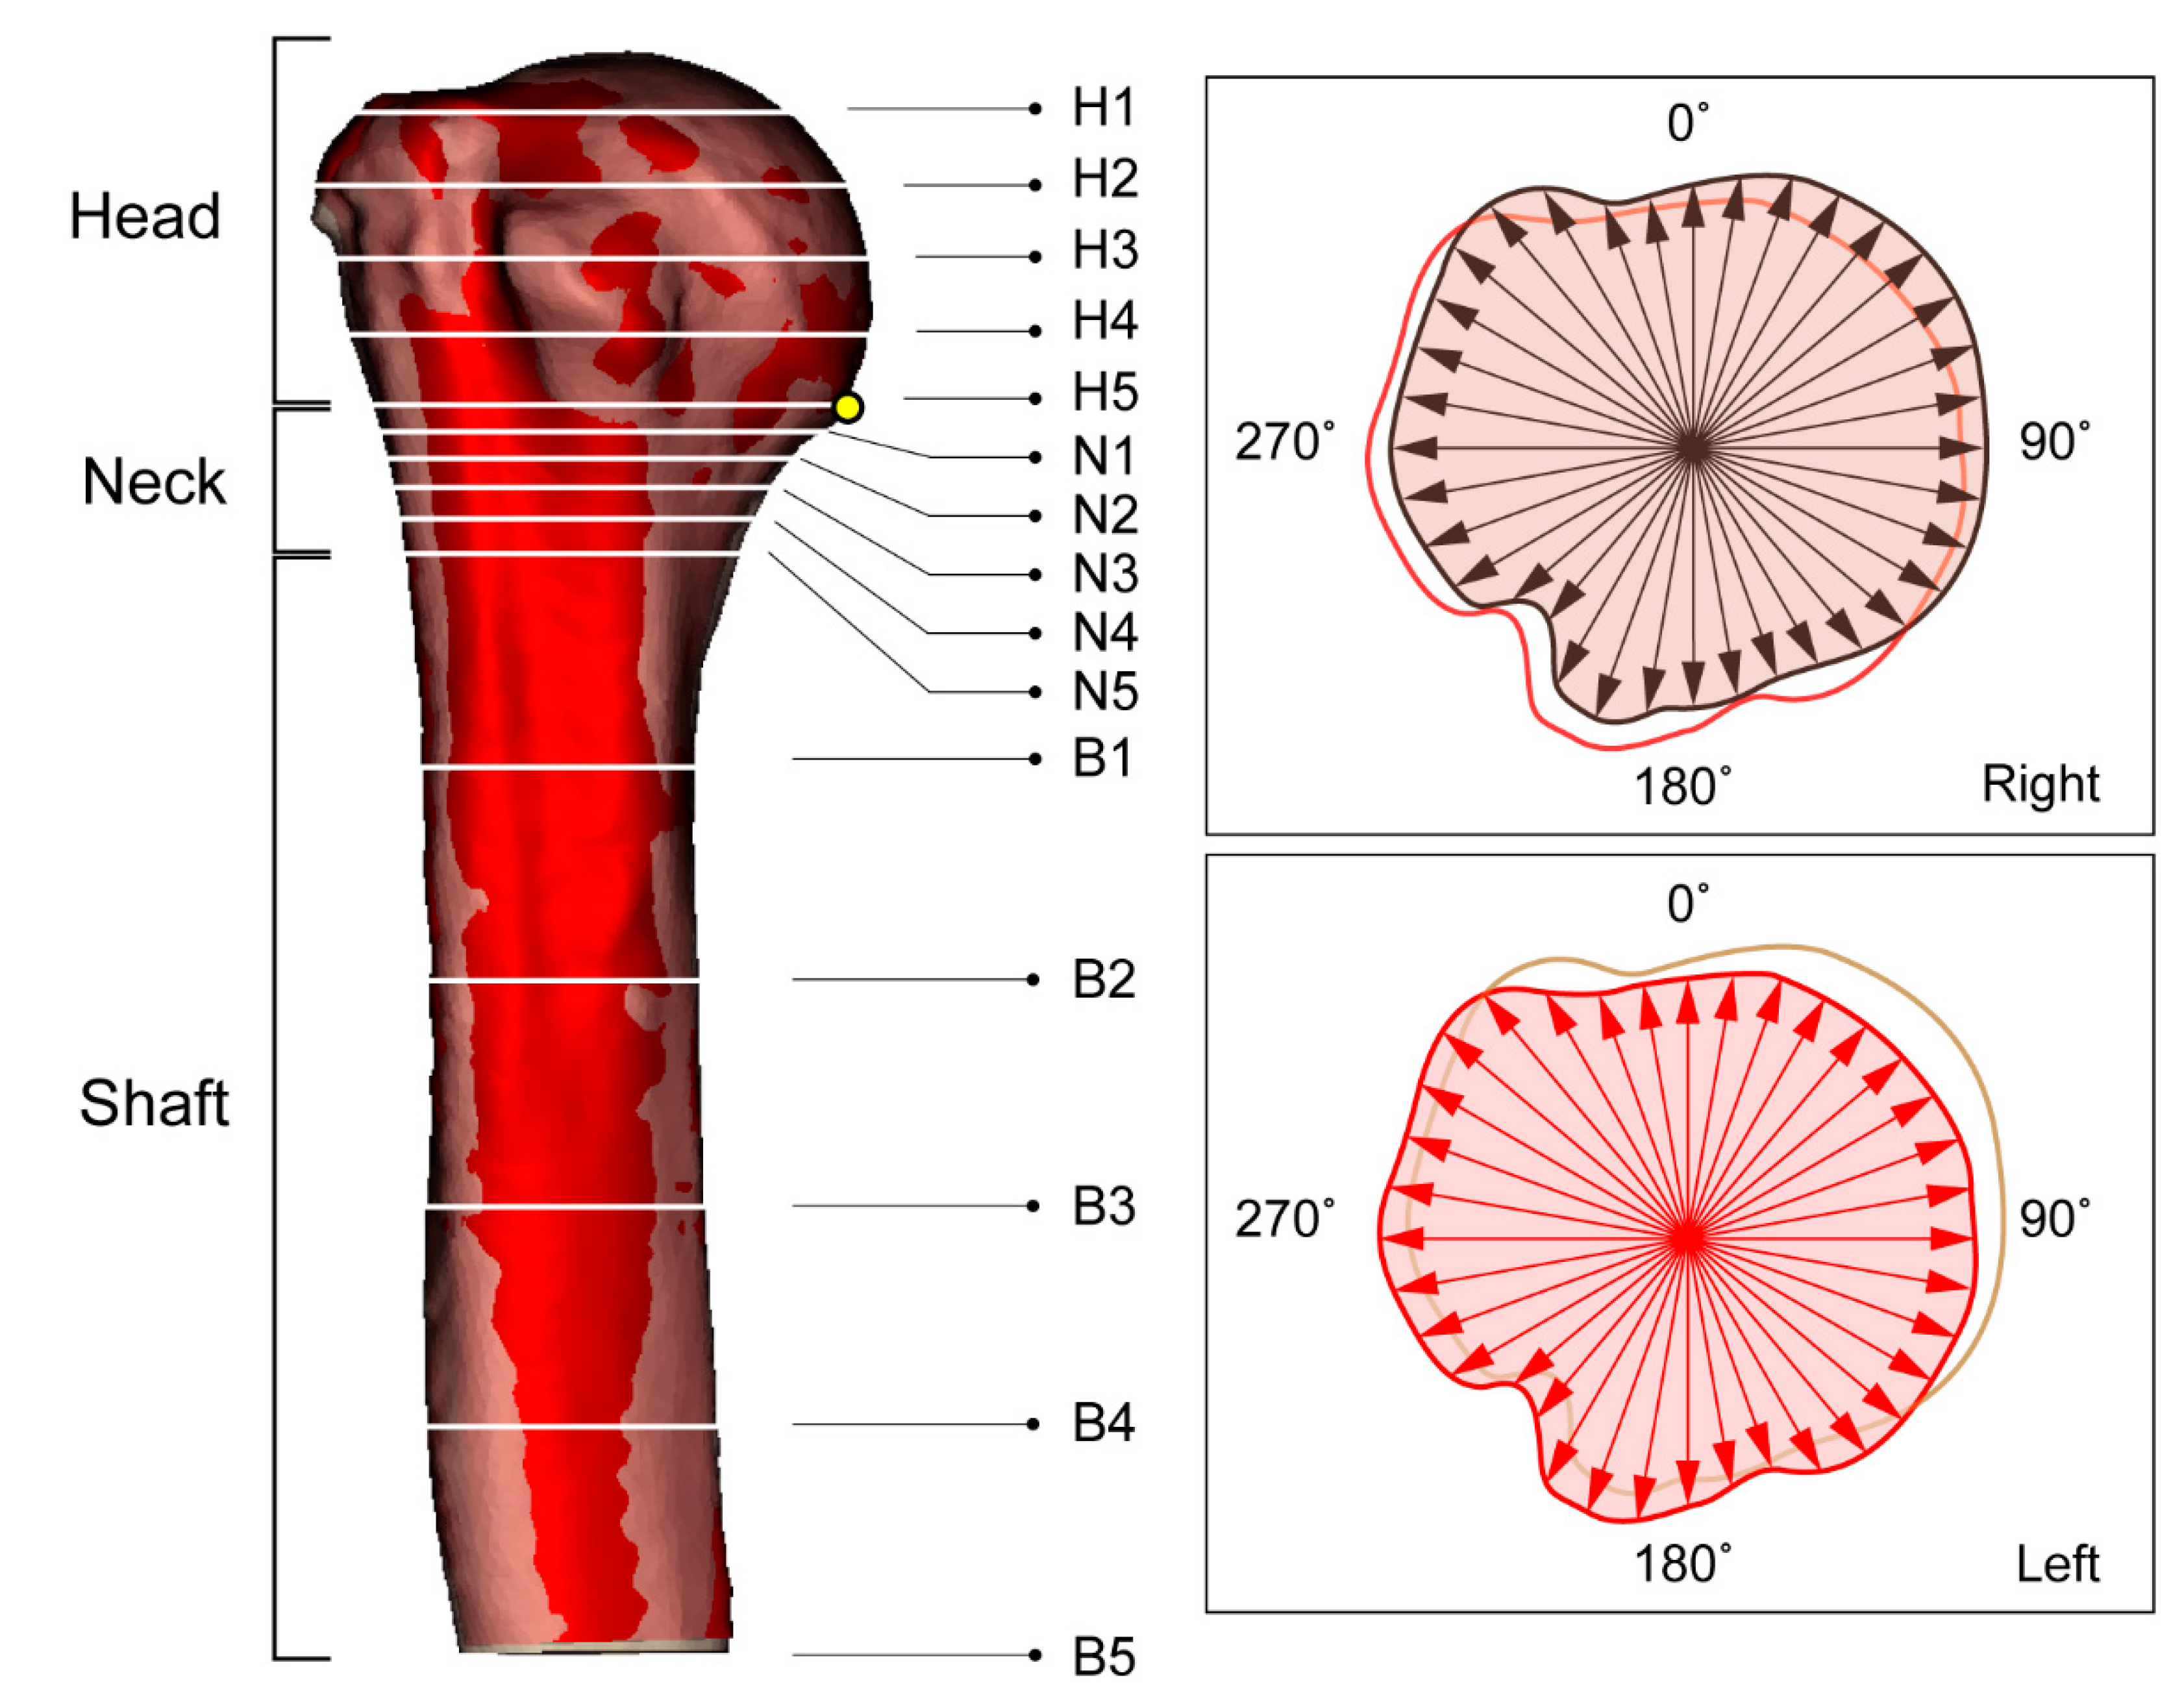
Aligned and registered bilateral humeri STL files were imported to the house code using a scientific programming language (Matlab, R2019a; Mathworks, Natick, MA, USA) to compare shape differences between left and right humeri. The programmed language was used to measure length, volume, surface area, and distance from the centroid to the cortical bone outline. Whole bilateral humeri were imported first to measure length, volume, and surface area. Then the proximal 1/2 of the right humerus model was imported into the programmed language as a 3D model and was divided into three regions of head, neck, and shaft, according to anatomical structure. We divided regions according to the anatomical structure of the humerus, which are the head, neck, and shaft regions [25]. However, the anatomical terminology ‘surgical neck’ is not a term that accurately dictates a single point of the humerus. For precise neck region division, we made a single point on the inferior margin of the humeral head, then we calculated 15% length of the proximal humerus length from the inferior margin of the humeral head. The inferior margin of the humeral head to 15% length of the proximal humerus length can include an anatomical textbook’s definition of ‘the surgical neck’. The proximal portion above the inferior margin of the humeral head was determined as the head region, and the inferior margin of the humeral head to 15% of 1/2 length as the neck region. The remaining portion located below the neck region was the shaft region. Each region was divided into five equal parts to produce five cross sections. In each cross section, the centroid was calculated, and the distance from the centroid to the outer surface along the radial direction were measured. Distances of centroid to cortical bone outline measurements were determined 36 times per 10° for every 15 cross sections of the 1/2 3D humerus model of the right side. The reflected left side was measured in the same way as the right side but with the left side bone distance from centroid to cortical bone outline measured using the original side centroid (Figure 2).
2.2.4. Statistical Analysis and Data Reproducibility
All length, volume, and surface area differences were compared between sexes, sides, and age (the younger and elder group) using independent t-tests. Shape differences of the humerus were compared between sides with independent t-tests. To evaluate the reliability of alignment and registration methods, we randomly selected 30 cases from the original data and randomly re-aligned the selected bones using the same registration method. Length and regional measurement data were compared with intercorrelation coefficient (ICC) tests.
3. Results
3.1. Realiability of Alighment and Registration
Section division and measurements can be affected during the alignment and registration procedure. To evaluate inter-rater reliability of our measures, we performed ICC tests. We compared all measurement values of all sections. ICCs ranged from 0.899 to 0.998, revealing that our alignment and registration procedure is reproducible and reliable.
3.2. Length, Volume, and Surface Area of the Humerus
Table 2 shows the results of independent t-tests comparing length, volume, and surface area of female and male humeri. Mean length of the humerus was 283.97 ± 14.14 mm for females and 305.69 ± 15.62 mm for males. The average length of the male humerus was 21.72 mm longer than that of the female (p < 0.01). The average volume of the humerus was 119,290.83 ± 16,445.40 mm3 for females and 170,174.38 ± 25,065.72 mm3 for males (p < 0.01). The average surface area of the humerus was 23,101.57 ± 2164.79 mm2 for females and 28,743.46 ± 2794.92 mm2 for males (p < 0.01). Independent t-test revealed significant differences in length, volume, and surface area of the humerus between females and males.
The samples used in the study were all adult, but there may be differences between older and younger aged people. The elder group contains samples who were aged above 60 years, and the younger group contains samples who were aged under 60 years. Age-related differences in length and surface area and independent t-tests were presented in Table 3. There were no significant differences in the younger and elder group in both sexes (p > 0.05).
Side differences in length, volume, and surface area and independent t-tests are presented in Table 4. There were no significant differences in right and left female humerus measurements. The average length of the right humerus was 2.75 mm longer than that of the left (p = 0.324) in females. In males, the average length of the right humerus was 2.21 mm longer than the left (p = 0.612). The average volume and surface area of the right humerus were much larger than the left in both sexes; however, there were no statistically significant differences between the bilateral humeri (0.433 ≤ p ≤ 0.550).
3.3. Shape Differences of the Humerus
Table 5 shows overall measurement values for females and males. Specific regional information of bilateral differences is presented in Figure 3.
3.3.1. Head
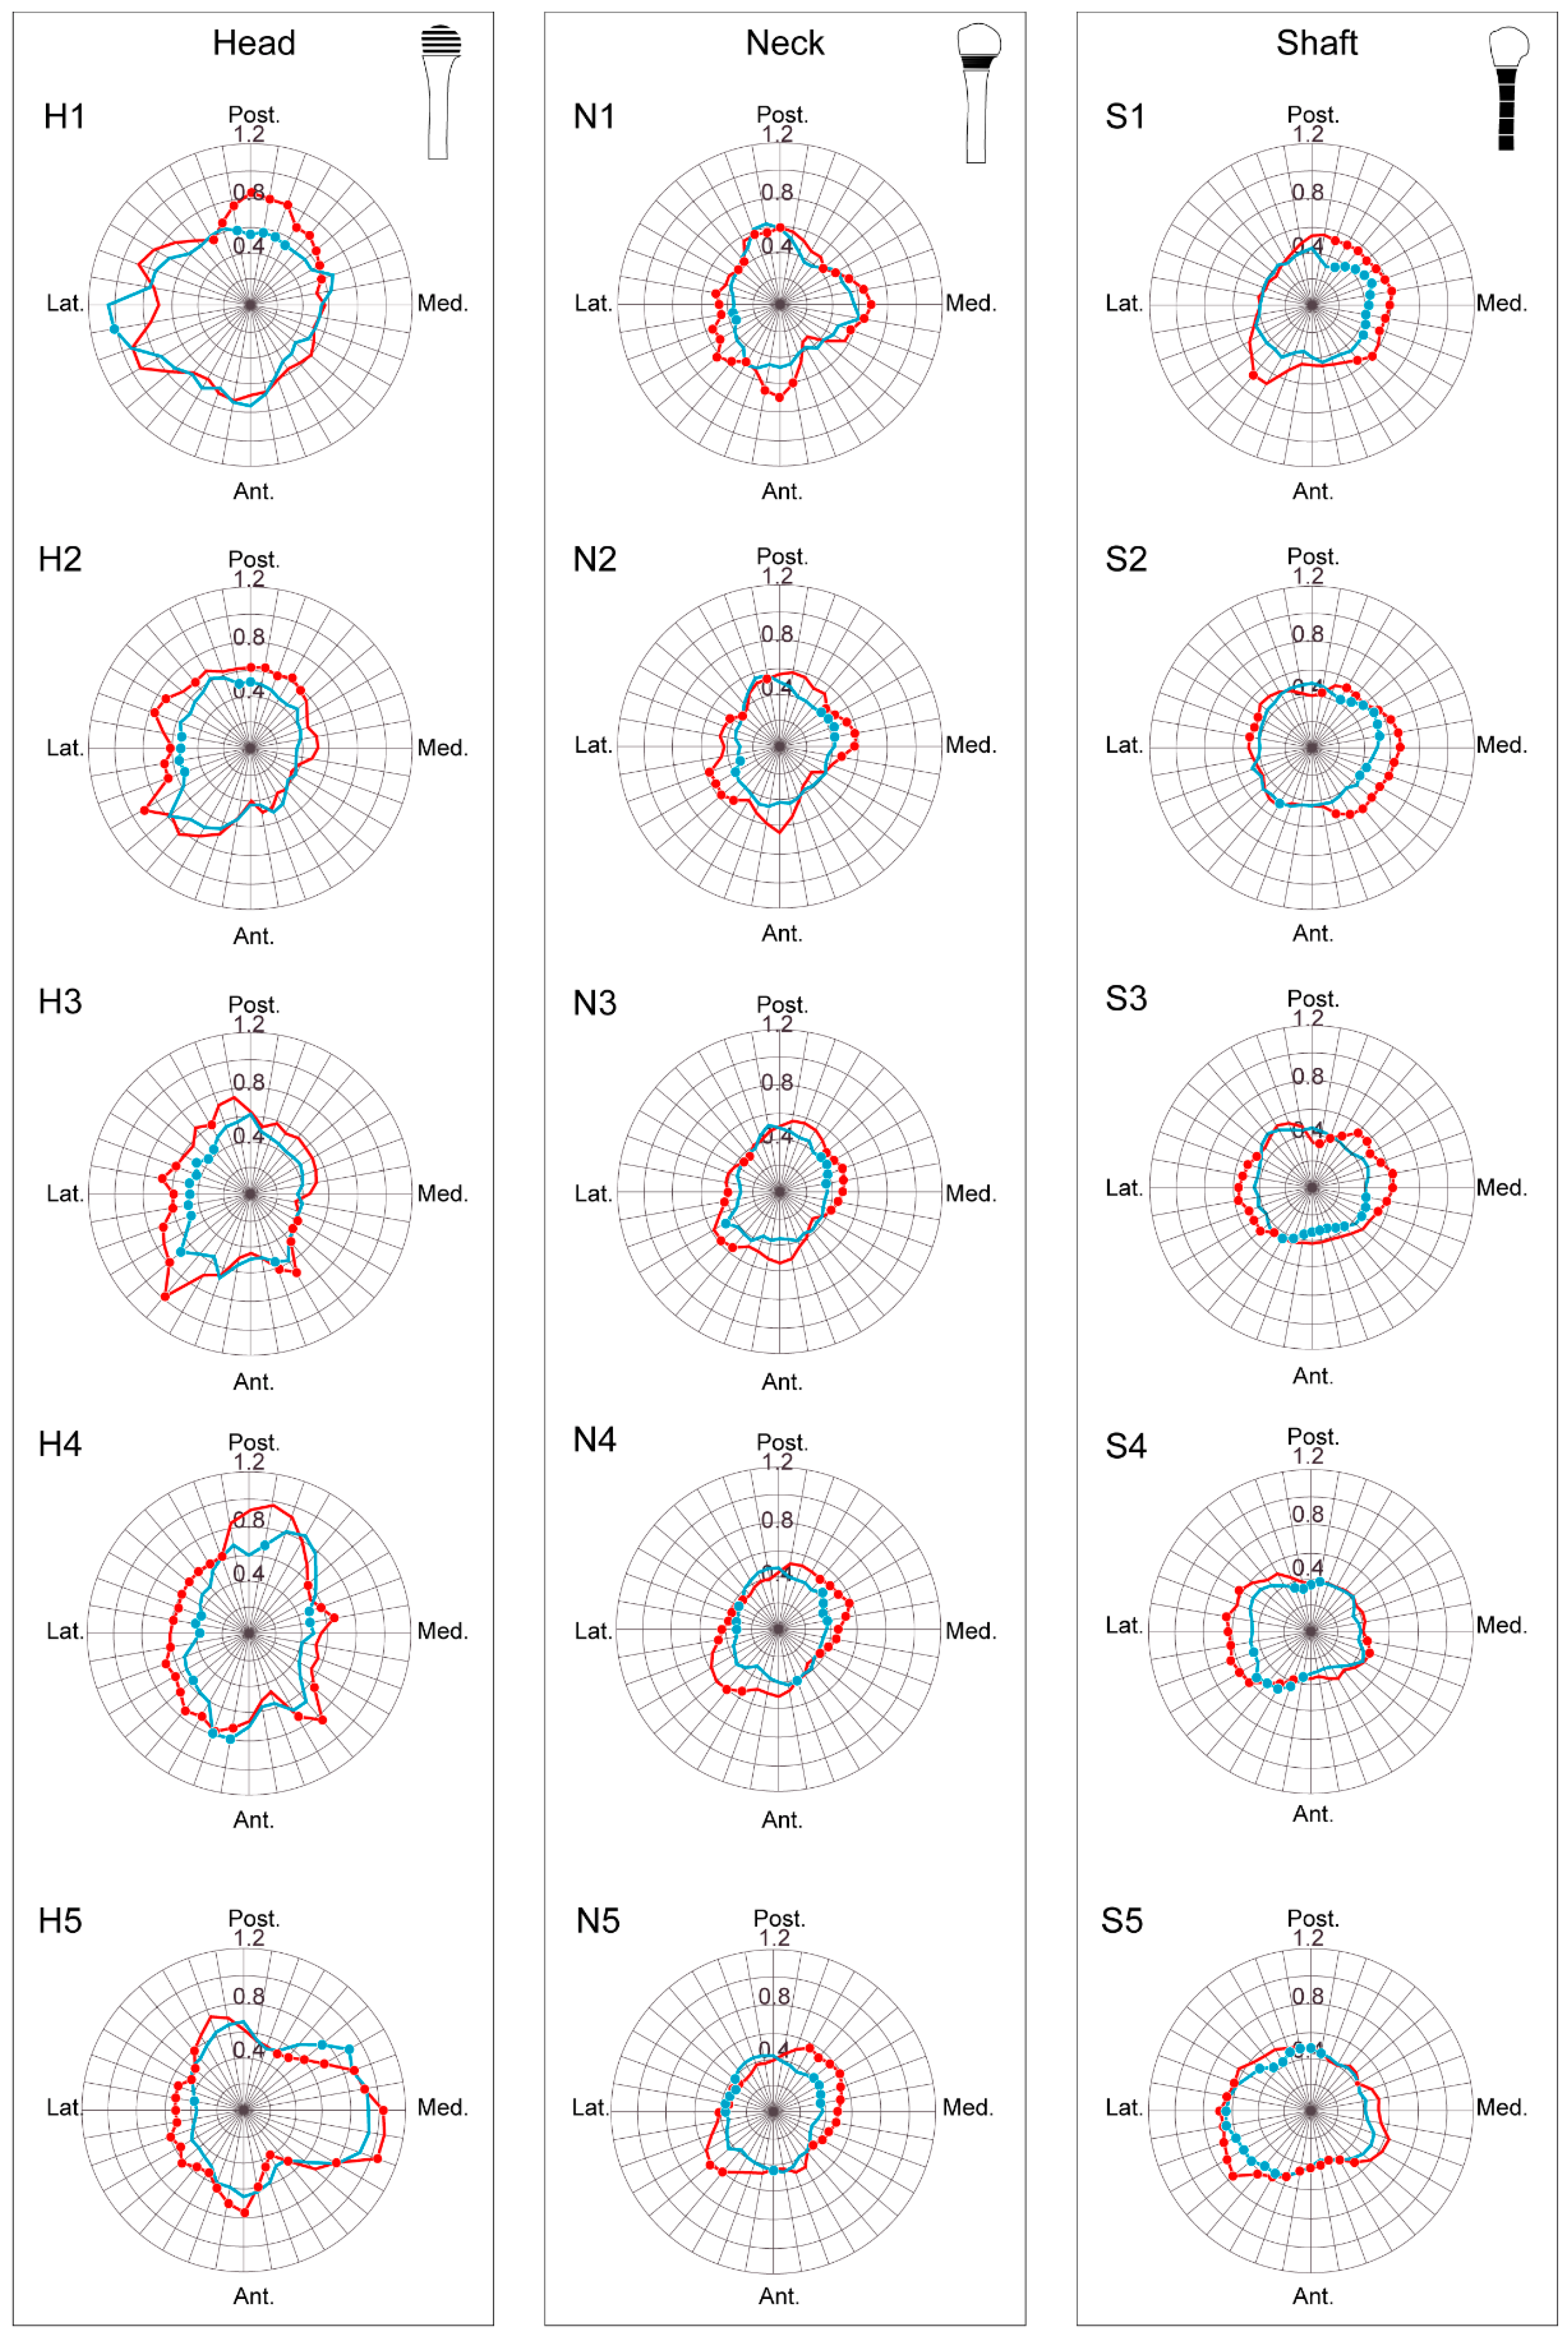
The average bilateral shape difference for the head region in females was 0.54 mm (ranged from 0.34 mm to 1.02 mm) and in males was 0.61 mm (ranged from 0.33 to 1.05 mm). Measurement values show that males generally have a much larger bilateral shape difference than females. The section with the largest bilateral difference was the H1 section in both females and males, and the smallest gap was found at the H3 section in both sexes. In the H1 section, statistically significant differences were located in the posterior direction in both sexes (p ≤ 0.049). Lateral and posterior directions showed statistically significant differences in the H2 section (p ≤ 0.047). In the H3 and H4 sections, differences were found in the lateral and anteromedial directions (p ≤ 0.029 for the H3, p ≤ 0.038 for the H4). In the H5 section, all directions revealed statistically significant differences except the posterior direction (p ≤ 0.048) (Figure 3).
3.3.2. Neck
Bilateral differences in the neck region had an average of 0.39 mm (ranged from 0.28 mm to 0.59 mm) in females and 0.46 mm (ranging from 0.29 mm to 0.67 mm) in males. Males also had larger differences than females. The biggest gap was at the N1 section and the smallest difference was at the N3 section in both sexes. In the N1 section, statistically significant differences were located only in the lateral direction in females (p ≤ 0.032), but males had differences in all directions (p ≤ 0.039). In the N2 section, females showed bilateral differences located in the medial and lateral directions (p ≤ 0.045), while males showed differences not only in medial and lateral, but also posterior directions (p ≤ 0.039). There were statistically significant differences in medial and lateral directions in the N3 section in both sexes (p ≤ 0.032). In the N4 and N5 sections, females had statistically significant differences in medial, lateral, and anterior directions (p ≤ 0.026), while males had differences in medial, lateral, and anterolateral directions (p ≤ 0.045) (Figure 3).
3.3.3. Shaft
The shaft region in females exhibited a difference of 0.42 mm (ranging from 0.28 mm to 0.64 mm), and that of males was 0.48 mm (ranging from 0.34 mm to 0.74 mm). The S5 section had the largest bilateral differences and the S4 section had the smallest differences in both sexes. Females showed statistically significant differences in the medial and posteromedial directions (p ≤ 0.043) and males in the posteromedial, medial, anteromedial, and anterolateral directions (p ≤ 0.023) in the S1 section. In the S2 section, statistically significant differences were located in the posteromedial, anteromedial, and anterolateral directions in females (p ≤ 0.031) and the posterior, posteromedial, medial, anteromedial, and posterolateral directions in males (p ≤ 0.029). In the S3 section, females showed statistically significant differences in the medial to anterior directions (p ≤ 0.022), while males showed differences in all directions except anterior and posterolateral (p ≤ 0.049). In the S4 section, statistically significant differences in females were found in the posterior and anterolateral directions and in males in the medial, anterolateral, and lateral. Females showed statistically significant differences in the posterior, lateral, and anterolateral directions (p ≤ 0.014) and males in the lateral, anterolateral, anterior, and anteromedial directions (p ≤ 0.028) in the S5 section (Figure 3).
4. Discussion
The humerus is the biggest bone of the upper limb and has a straight and monotonous anatomical structure relative to the other upper limb bones, the radius and ulna. Proximal humerus fractures are common fractures in elderly patients. Almost 80% of proximal humerus fractures can be managed with non-surgical methods because of anatomical structure and fracture severity [16]. However, surgical treatment is needed in some proximal humerus fractures, such as comminuted fractures. CAOS and PSI might be recommended in these conditions.
The most important precondition for using contralateral side data as a template for the affected side is that the right and left must be the same. Bilateral asymmetry of the proximal humerus for applying CAOS and PSI has been investigated by many researchers. However, most measurements from these studies are morphological parameters for arthroplasty surgery. Bilateral asymmetry of the bone surface shape can affect CAOS and/or design of PSI, and understanding the difference of bilateral shape can be important. We collected bilateral surface data of the proximal humerus and compared surface measurement values between sides. The distance from the centroid to cortical outline was measured at every 10 degrees from each of 15 sections. Several orthopedic surgeons have investigated whether the contralateral anatomy is a reliable template for the affected side, however, exact bilateral surface gaps were less introduced [26,27,28,29]. Our results show specific values of the bilateral shape differences of the proximal humerus.
In the head region, bilateral differences larger than 1.00 mm were found in both sexes. The head region generally showed larger differences than other regions. However, large measurement values do not necessarily indicate significant differences. In other words, if the shape is changed rapidly because of bony structures, measurement values can be high without statistically significant difference, as with the lateral portion of the H1 section. Large measurement values of the head region might be associated with bony landmarks, muscle origins, and muscle insertions. The greater tubercle is located in the lateral portion of the head region and shows significant differences.
Proximal humerus fractures mainly occur in the surgical neck of the humerus. The shape of the surgical neck is rapidly changed because it connects the head and shaft. For this reason, we divided the neck section in greater detail. Bilateral differences in the neck region were smaller than in the head region, though a larger number of significant differences was found in the neck. In particular, statistically significant differences were located in the deltoid tuberosity, the medial and lateral portions of the N4 to N5 sections, in both sexes. Right surgical neck breadth is usually larger than that of the left, likely from handedness.
We found an interesting phenomenon in the shaft region analysis. Males had larger differences between the right and left humeri than did females. Statistically significant differences were found in the lateral portion of the shaft region in males but not in females. In the anterior portion of the S5 section, significant differences were found in both sexes. We posit that asymmetry of the male bone is more affected by bony landmark development because of their bigger muscle size. The largest bilateral difference of the shaft region was less than 0.7 mm.
Fractures of the proximal humerus are more common among elderly than younger patients. As bone quality decline occurs with aging, various age ranges are required for age-related analysis. Bone loss in elder people has been investigated by many researchers. Power et al. reported extremely narrow cortical bone width less than 0.1 mm in the femoral neck of elder females [30]. Whitmarsh et al. investigated femoral head cortical and trabecular bone in old age (between 70 and 93 years) and found a significant decline in global trabecular bone mineral density and cortical thickness in those older than 90 years [31]. According to Wang et al., there were significant negative age-related trabecular bone changes in the female femur but were no significant difference in the cross-sectional area between younger and elder populations [32]. These results suggest that the age-related decrease in cortical bone thickness is related to increased trabecular bone area, not related to change of external cortical bone surface.
In our study, females older than 60 years numbered 31 of 51 (61%) total females, and elder males numbered 18 among 50 (36%). We analyzed length and surface area of the humerus to investigate differences between younger and elder groups. Results show no significant height/surface area differences between the younger and elder group (p > 0.05) (Table 3). The World Health Organization (WHO) standard of age for seniors is 65 years; however, only 13 of 51 females older than 65 years were included in our study, and only 11 of 50 males were in this elder group. There are limited data on the elderly, limiting analysis based on an age of 65 years. We also performed age-related shape difference analysis and noted only a few significant differences in females and that shape differences between younger and older groups of females and males might not be significant.
Our study has some limitations. The first is that we did not have handedness information for the cadavers examined. According to Blackburn el at., absolute asymmetry is very low among infants, but rapid increase of directional asymmetry in diaphyseal breadth is found after development of handedness [33]. A second limitation of our study is that we examined only Korean CT data. Differences in humeral morphology between specific populations have been investigated by many researchers [34,35,36,37]. Although there are many studies about Asian populations such as Japanese and Chinese, bilateral differences of Korean proximal humerus morphometric data are not known. The third is that our 3D reconstruction procedure would affect 3D model alignment and registration. We used the same conditions to minimize errors in the 3D reconstruction process. All CT scans were performed with the same CT scanner, and CT images were reconstructed using the same conditions verified by a calibration scale. Lastly, there are several methodologies to analyze differences between shapes, which are comparing parameters, divided sections, and surfaces. Comparing surface to surface may be a powerful method to analyze differences between several samples, however, statistical analysis can be hard to achieve in this methodology. To investigate statistical difference in the particular area, a discretization process such as dividing sections is needed. In our study, the proximal humerus was divided into three regions according to the anatomical structure, and each region was divided into five sections. Although there is a possibility that there may be differences in both sides in areas not included in the section, it is less likely that there may be significant differences in our results because the proximal humerus shape does not change so rapidly.
5. Conclusions
In conclusion, information on bilateral shape differences is essential when applying CAOS and patient-specific surgical devices. However, bilateral shape difference in the proximal humerus is not fully understood. In our study, maximum differences in the left and right proximal humeri were 1.05 for the head region, 0.67 mm for the neck region, and 0.64 mm for the shaft region, which might not be significant for CAOS and/or design of PSI. Our results indicate the possibility of use of contralateral data as a template for restoring the affected proximal humerus. More specific investigation for the elderly should be needed in future studies because the proximal humerus fracture occurs more often in elder patients, and there are also age-related changes of the bones.
Author Contributions
Conceptualization, E.H. and D.-S.K.; methodology, E.H. and D.-S.K.; validation, E.H. and I.-B.K.; formal analysis, E.H.; investigation, D.-S.K.; writing—original draft preparation, E.H. and D.-S.K.; writing—review and editing, I.-B.K. and D.-S.K.; visualization, E.H. and D.-S.K. All authors have read and agreed to the published version of the manuscript.
Funding
This research was supported by Basic Science Research Program through the National Research Foundation of Korea (NRF) funded by the Ministry of Education (NRF-2020R1A6A3A13075521).
Institutional Review Board Statement
The study was conducted according to the guidelines of the Declaration of Helsinki, and approved by the Institutional Review Board of College of Medicine, The Catholic University of Korea (No. MC20EAS10103).
Informed Consent Statement
Informed consent was obtained from all subjects involved in the study.
Data Availability Statement
Not appreciate.
Conflicts of Interest
The authors declare no conflict of interest. The funders had no role in the design of the study; in the collection, analyses, or interpretation of data; in the writing of the manuscript, or in the decision to publish the results.
References
- Rhodes, J.A.; Knüsel, C.J. Activity-related skeletal change in medieval humeri: Cross-sectional and architectural alterations. Am. J. Phys. Anthropol. 2005, 128, 536–546. [Google Scholar] [CrossRef] [PubMed] [Green Version]
- Kubicka, A.M.; Nowaczewska, W.; Balzeau, A.; Piontek, J. Bilateral asymmetry of the humerus in Neandertals, Australian aborigines and medieval humans. Am. J. Phys. Anthropol. 2018, 167, 46–60. [Google Scholar] [CrossRef]
- Auerbach, B.M.; Ruff, C.B. Limb bone bilateral asymmetry: Variability and commonality among modern humans. J. Hum. Evol. 2006, 50, 203–218. [Google Scholar] [CrossRef] [Green Version]
- Delude, J.A.; Bicknell, R.T.; MacKenzie, G.A.; Ferreira, L.M.; Dunning, C.E.; King, G.J.; Johnson, J.A.; Drosdowech, D.S. An anthropometric study of the bilateral anatomy of the humerus. J. Shoulder Elb. Surg. 2007, 16, 477–483. [Google Scholar] [CrossRef] [PubMed]
- Kubicek, J.; Tomanec, F.; Cerny, M.; Vilimek, D.; Kalova, M.; Oczka, D. Recent Trends, Technical Concepts and Components of Computer-Assisted Orthopedic Surgery Systems: A Comprehensive Review. Sensors 2019, 19, 5199. [Google Scholar] [CrossRef] [PubMed] [Green Version]
- Sugano, N. Computer-assisted orthopedic surgery. J. Orthop. Sci. 2003, 8, 442–448. [Google Scholar] [CrossRef] [PubMed]
- Amiot, L.-P.; Poulin, F. Computed Tomography-Based Navigation for Hip, Knee, and Spine Surgery. Clin. Orthop. Relat. Res. 2004, 421, 77–86. [Google Scholar] [CrossRef] [PubMed]
- McDonald, C.P.; Beaton, B.J.; King, G.J.; Peters, T.M.; Johnson, J.A. The effect of anatomic landmark selection of the distal humerus on registration accuracy in computer-assisted elbow surgery. J. Shoulder Elb. Surg. 2008, 17, 833–843. [Google Scholar] [CrossRef] [PubMed]
- McDonald, C.P.; Peters, T.M.; King, G.J.; Johnson, J.A. Computer assisted surgery of the distal humerus can employ contralateral images for pre-operative planning, registration, and surgical intervention. J. Shoulder Elb. Surg. 2009, 18, 469–477. [Google Scholar] [CrossRef]
- Berg, P.W.L.T.; Dobbe, J.G.G.; Van Wolfswinkel, G.; Strackee, S.D.; Streekstra, G.J. Validation of the contralateral side as reference for selecting radial head implant sizes. Surg. Radiol. Anat. 2016, 38, 801–807. [Google Scholar] [CrossRef] [PubMed] [Green Version]
- Luenam, S.; Kosiyatrakul, A.; Hansudewechakul, C.; Phakdeewisetkul, K.; Lohwongwatana, B.; Puncreobutr, C. The Patient-Specific Implant Created with 3D Printing Technology in Treatment of the Irreparable Radial Head in Chronic Persistent Elbow Instability. Case Rep. Orthop. 2018, 2018, 9272075. [Google Scholar] [CrossRef]
- Kurki, H.K. Bilateral Asymmetry in the Human Pelvis. Anat. Rec. 2017, 300, 653–665. [Google Scholar] [CrossRef] [PubMed] [Green Version]
- Ferràs-Tarragó, J.; Sanchis-Alfonso, V.; Ramírez-Fuentes, C.; Roselló-Añón, A.; Baixauli-García, F. A 3D-CT Analysis of Femoral Symmetry—Surgical Implications. J. Clin. Med. 2020, 9, 3546. [Google Scholar] [CrossRef]
- Mopin, C.; Chaumoître, K.; Signoli, M.; Adalian, P. Developmental stability and environmental stress: A geometric morphometrics analysis of asymmetry in the human femur. Am. J. Phys. Anthropol. 2018, 167, 144–160. [Google Scholar] [CrossRef]
- Canale, S.T.; Beaty, J.H. Campbell’s Operative Orthopaedics e-Book; Elsevier Health Sciences: Amsterdam, The Netherlands, 2012. [Google Scholar]
- Sanders, R. Core Knowledge in Orthopaedics: Trauma; Elsevier: Amsterdam, The Netherlands, 2008. [Google Scholar]
- Neer, C.S. Displaced proximal humeral fractures. I. Classification and evaluation. J. Bone Jt. Surg. Am. 1970, 52, 1077–1089. [Google Scholar] [CrossRef]
- Tallman, S.D.; Blanton, A.I. Distal Humerus Morphological Variation and Sex Estimation in Modern Thai Individuals. J. Forensic Sci. 2020, 65, 361–371. [Google Scholar] [CrossRef]
- Robertson, D.D.; Yuan, J.; Bigliani, L.U.; Flatow, E.L.; Yamaguchi, K. Three-Dimensional Analysis of the Proximal Part of the Humerus: Relevance to Arthroplasty. J. Bone Jt. Surg. Am. 2000, 82, 1594–1602. [Google Scholar] [CrossRef]
- Cho, S.W.; Jharia, T.K.; Moon, Y.L.; Sim, S.W.; Shin, D.S.; Bigliani, L.U. Three-dimensional templating arthroplasty of the humeral head. Surg. Radiol. Anat. 2013, 35, 685–688. [Google Scholar] [CrossRef] [PubMed]
- Kim, D.-I.; Kwak, D.-S.; Han, S.-H. Sex determination using discriminant analysis of the medial and lateral condyles of the femur in Koreans. Forensic Sci. Int. 2013, 233, 121–125. [Google Scholar] [CrossRef] [PubMed]
- Cho, H.-J.; Kwak, D.-S.; Kim, I.-B. Morphometric Evaluation of Korean Femurs by Geometric Computation: Comparisons of the Sex and the Population. BioMed Res. Int. 2015, 2015, 730538. [Google Scholar] [CrossRef] [Green Version]
- Cho, H.-J.; Kim, S.; Kwak, D.-S. Morphological Study of the Anterior Surface of the Distal Radius. BioMed Res. Int. 2017, 2017, 8963768. [Google Scholar] [CrossRef] [PubMed] [Green Version]
- Kim, S.; Kwak, D.-S.; Kim, I.-B. Morphometric Analysis and Classification of the Cross-Sectional Shape of the C2 Lamina. BioMed Res. Int. 2017, 2017, 7276946. [Google Scholar] [CrossRef] [Green Version]
- Gray, H. Gray’s Anatomy; Arcturus Publishing: London, UK, 2009. [Google Scholar]
- Hingsammer, A.M.; Vlachopoulos, L.; Meyer, D.C.; Fürnstahl, P. Three-dimensional corrective osteotomies of mal-united clavicles-is the contralateral anatomy a reliable template for reconstruction? Clin. Anat. 2015, 28, 865–871. [Google Scholar] [CrossRef]
- Byrne, A.-M.; Impelmans, B.; Bertrand, V.; Van Haver, A.; Verstreken, F. Corrective Osteotomy for Malunited Diaphyseal Forearm Fractures Using Preoperative 3-Dimensional Planning and Patient-Specific Surgical Guides and Implants. J. Hand Surg. 2017, 42, 836.e1–836.e12. [Google Scholar] [CrossRef] [PubMed]
- Lalone, E.A.; Deluce, S.R.; Shannon, H.; King, G.J.; Johnson, J.A. Design of Anatomical Population-Based and Patient-Specific Radial Head Implants. J. Hand Surg. 2017, 42, 924.e1–924.e11. [Google Scholar] [CrossRef] [PubMed]
- Roner, S.; Bersier, P.; Fürnstahl, P.; Vlachopoulos, L.; Schweizer, A.; Wieser, K. 3D planning and surgical navigation of clavicle osteosynthesis using adaptable patient-specific instruments. J. Orthop. Surg. Res. 2019, 14, 115. [Google Scholar] [CrossRef]
- Power, J.; Loveridge, N.; Kröger, H.; Parker, M.; Reeve, J. Femoral neck cortical bone in female and male hip fracture cases: Differential contrasts in cortical width and sub-periosteal porosity in 112 cases and controls. Bone 2018, 114, 81–89. [Google Scholar] [CrossRef]
- Whitmarsh, T.; Otake, Y.; Uemura, K.; Takao, M.; Sugano, N.; Sato, Y. A cross-sectional study on the age-related cortical and trabecular bone changes at the femoral head in elderly female hip fracture patients. Sci. Rep. 2019, 9, 305. [Google Scholar] [CrossRef] [Green Version]
- Wang, L.; Cheng, X.G.; Su, Y.B.; Brown, K.; Xu, L.; Li, K.; Zhang, C.X.; Duanmu, Y.Y.; Wu, X.B. Sex-related variations in cortical and trabecular bone of the femoral neck in an elderly Chinese population. Osteoporos. Int. 2017, 28, 2391–2399. [Google Scholar] [CrossRef]
- Blackburn, A. Bilateral asymmetry of the humerus during growth and development. Am. J. Phys. Anthropol. 2011, 145, 639–646. [Google Scholar] [CrossRef]
- Inyang, A.O.; Roche, S.; Sivarasu, S. An interpopulation comparison of 3-dimensional morphometric measurements of the proximal humerus. JSES Int. 2020, 4, 453–463. [Google Scholar] [CrossRef] [PubMed]
- Zhang, L.; Yuan, B.; Wang, C.; Liu, Z. Comparison of anatomical shoulder prostheses and the proximal humeri of Chinese people. Proc. Inst. Mech. Eng. Part H J. Eng. Med. 2007, 221, 921–927. [Google Scholar] [CrossRef] [PubMed]
- Milner, G.R.; Boldsen, J.L. Humeral and Femoral Head Diameters in Recent White American Skeletons. J. Forensic Sci. 2012, 57, 35–40. [Google Scholar] [CrossRef] [PubMed]
- Matsumura, N.; Oki, S.; Ogawa, K.; Iwamoto, T.; Ochi, K.; Sato, K.; Nagura, T. Three-dimensional anthropometric analysis of the glenohumeral joint in a normal Japanese population. J. Shoulder Elb. Surg. 2016, 25, 493–501. [Google Scholar] [CrossRef] [PubMed]
Figure 1.
Bilateral humeri reconstruction from CT images and 3D humeri model alignment and registration procedures. (A) Segmentation to produce 3D humerus models. (B) Bilateral humerus models. (C) The bilateral humerus was aligned in the anatomical coordination system. (D) The left side humerus (red bone) was reflected. (E) The humeri were overlapped. (F) The overlapped bilateral humeri were cut in half to investigate the bilateral asymmetry of the proximal humerus.

Figure 2.
Division of the humerus and measurement methods. The 1/2 proximal humerus was divided into three regions of head, neck, and shaft. Each region was divided into five equal parts to obtain five cross section images. The yellow dot shows the inferior margin of the humeral head. Distances from centroid to cortical bone outline measurements were determined 36 times per 10° for every 15 cross sections of the 1/2 3D humerus model of the right side (beige cross section and arrows), and the reflected left side (red cross section and arrows) was measured in the same way. However, with the left side bone, distance from centroid to cortical bone outline was measured using the original side centroid.

Figure 3.
Statistical analysis of bilateral differences. The blue lines show bilateral differences in females, and the blue dots show the portion that had statistically significant differences. The red lines show bilateral differences in males, and the red dots show the portion that had statistically significant differences. Males generally had larger bilateral gaps and a larger number of statistically significant differences than females.


Table 1.
Population sample in this study.
| Female | Male | Combined | |
|---|---|---|---|
| Number | 51 | 50 | 101 |
| Average age | 61.1 | 57.8 | 59.5 |
| Minimum age | 38 | 22 | 22 |
| Maximum age | 96 | 95 | 96 |
Table 2.
Length and volume of the humerus.
| Female | Male | Combined | p | ||||
|---|---|---|---|---|---|---|---|
| Mean | SD | Mean | SD | Mean | SD | ||
| Length (mm) | 283.97 | 14.14 | 305.69 | 15.62 | 294.72 | 18.42 | <0.01 |
| Volume (mm3) | 119,290.83 | 16,445.40 | 170,174.38 | 25,065.72 | 144,480.71 | 33,102.80 | <0.01 |
| Surface area (mm2) | 23,101.57 | 2164.79 | 28,743.46 | 2794.92 | 25,894.58 | 3768.14 | <0.01 |
Table 3.
Height and surface area differences between the younger and elder group.
| Female | Male | |||||
|---|---|---|---|---|---|---|
| Younger (n = 20) | Elder (n = 31) | p | Younger (n = 32) | Elder (n = 18) | p | |
| Length (mm) | 279.91 | 284.32 | 0.28 | 303.48 | 307.40 | 0.40 |
| Surface area (mm2) | 22,603.87 | 23,204.86 | 0.34 | 8,325,382.89 | 5,147,540.32 | 0.08 |
Table 4.
Differences in length and volume between sides.
| Female | Male | ||||||||||
|---|---|---|---|---|---|---|---|---|---|---|---|
| Right | Left | p | Right | Left | p | ||||||
| Mean | SD | Mean | SD | Mean | SD | Mean | SD | ||||
| Humerus | Length (mm) | 285.34 | 14.21 | 282.59 | 14.09 | 0.324 | 307.10 | 15.73 | 304.89 | 15.43 | 0.612 |
| Volume (mm3) | 117,981.70 | 20,744.26 | 117,117.84 | 18,799.50 | 0.550 | 171,242.23 | 25,012.86 | 168,751.88 | 24,031.55 | 0.433 | |
| Surface area (mm2) | 23,879.15 | 3843.24 | 23,312.96 | 3345.61 | 0.539 | 30,328.04 | 4729.69 | 29,310.09 | 3759.95 | 0.436 | |
Table 5.
Differences of bilateral humeri (mm).
| Female | Male | Combined | |||||||
|---|---|---|---|---|---|---|---|---|---|
| Mean | Minimum | Maximum | Mean | Minimum | Maximum | Mean | Minimum | Maximum | |
| H1 | 0.62 | 0.39 | 1.02 | 0.67 | 0.50 | 0.94 | 0.65 | 0.49 | 0.91 |
| H2 | 0.48 | 0.34 | 0.76 | 0.57 | 0.35 | 0.90 | 0.53 | 0.36 | 0.83 |
| H3 | 0.47 | 0.35 | 0.66 | 0.56 | 0.33 | 0.97 | 0.51 | 0.36 | 0.77 |
| H4 | 0.55 | 0.35 | 0.83 | 0.64 | 0.44 | 0.96 | 0.59 | 0.44 | 0.84 |
| H5 | 0.59 | 0.35 | 0.94 | 0.62 | 0.37 | 1.05 | 0.60 | 0.42 | 0.99 |
| N1 | 0.44 | 0.33 | 0.59 | 0.50 | 0.30 | 0.67 | 0.47 | 0.35 | 0.63 |
| N2 | 0.39 | 0.29 | 0.54 | 0.46 | 0.29 | 0.62 | 0.43 | 0.33 | 0.52 |
| N3 | 0.37 | 0.28 | 0.49 | 0.44 | 0.29 | 0.55 | 0.40 | 0.32 | 0.50 |
| N4 | 0.37 | 0.30 | 0.46 | 0.44 | 0.32 | 0.58 | 0.40 | 0.33 | 0.49 |
| N5 | 0.37 | 0.30 | 0.44 | 0.44 | 0.32 | 0.60 | 0.41 | 0.33 | 0.51 |
| S1 | 0.40 | 0.30 | 0.46 | 0.48 | 0.35 | 0.61 | 0.44 | 0.36 | 0.54 |
| S2 | 0.44 | 0.38 | 0.52 | 0.49 | 0.40 | 0.63 | 0.46 | 0.41 | 0.56 |
| S3 | 0.40 | 0.31 | 0.51 | 0.47 | 0.35 | 0.58 | 0.44 | 0.35 | 0.51 |
| S4 | 0.39 | 0.28 | 0.53 | 0.44 | 0.34 | 0.61 | 0.42 | 0.32 | 0.55 |
| S5 | 0.47 | 0.37 | 0.64 | 0.52 | 0.37 | 0.74 | 0.49 | 0.37 | 0.66 |
Publisher’s Note: MDPI stays neutral with regard to jurisdictional claims in published maps and institutional affiliations. |
© 2021 by the authors. Licensee MDPI, Basel, Switzerland. This article is an open access article distributed under the terms and conditions of the Creative Commons Attribution (CC BY) license (https://creativecommons.org/licenses/by/4.0/).
Share and Cite
MDPI and ACS Style
Hong, E.; Kwak, D.-S.; Kim, I.-B. Morphometric Evaluation of Detailed Asymmetry for the Proximal Humerus in Korean Population. Symmetry 2021, 13, 862. https://doi.org/10.3390/sym13050862
AMA Style
Hong E, Kwak D-S, Kim I-B. Morphometric Evaluation of Detailed Asymmetry for the Proximal Humerus in Korean Population. Symmetry. 2021; 13(5):862. https://doi.org/10.3390/sym13050862
Chicago/Turabian StyleHong, Eunah, Dai-Soon Kwak, and In-Beom Kim. 2021. "Morphometric Evaluation of Detailed Asymmetry for the Proximal Humerus in Korean Population" Symmetry 13, no. 5: 862. https://doi.org/10.3390/sym13050862
Note that from the first issue of 2016, this journal uses article numbers instead of page numbers. See further details here.