Article

Mean Radiant Temperature Measurements through Small Black Globes under Forced Convection Conditions

by
Francesca Romana d’Ambrosio Alfano
1,
Giorgio Ficco
2,
Andrea Frattolillo
3,
Boris Igor Palella
4,* and
Giuseppe Riccio
4
1
DIIn—Dipartimento di Ingegneria Industriale, Università degli Studi di Salerno, 84084 Fisciano, Italy
2
DICeM—Dipartimento di Ingegneria Civile e Meccanica, Università degli Studi di Cassino e del Lazio Meridionale, Via Di Biasio 43, 03043 Cassino, Italy
3
DICAAR—Department of Environmental Civil Engineering and Architecture, University of Cagliari, 09123 Cagliari, Italy
4
DII—Dipartimento di Ingegneria Industriale, Università degli Studi di Napoli Federico II, 80125 Naples, Italy
*
Author to whom correspondence should be addressed.
Atmosphere 2021, 12(5), 621; https://doi.org/10.3390/atmos12050621
Submission received: 26 March 2021 / Revised: 10 May 2021 / Accepted: 10 May 2021 / Published: 12 May 2021
(This article belongs to the Special Issue Field Measurement for Thermal Comfort and Indoor Air Quality)

Abstract

:
One of the most critical variables in the field of thermal comfort measurements is the mean radiant temperature which is typically measured with a standard 150 mm black globe thermometer. This is also the reference instrument required for the assessment of heat stress conditions by means of the well-known Wet Bulb Globe Temperature index (WBGT). However, one of the limitations of this method is represented by the relatively long response time. This is why in recent years there has been a more and more pressing need of smart sensors for controlling Heating Ventilation and Air Conditioning (HVAC) systems, and for pocket heat stress meters (e.g., WBGT meters provided with table tennis balls). Although it is widely agreed that there is a clear advantage of small probes in terms of response times, their accuracy is a still a debated matter and no systematic studies aimed at metrologically characterizing their performances are actually available, due to the difficulty of reproducing measuring conditions such as a black enclosure at uniform temperature. In this paper the results of a metrological analysis of two small globes (38 and 50 mm diameter) carried out by means of an experimental apparatus specifically designed to reproduce a black uniform enclosure are presented and discussed. Experimental results revealed a systematic underestimation of the mean radiant temperature predicted by small globes of more than 10 °C in forced convection and at high radiative loads.

1. Introduction

One of the most challenging issues at the beginning of this millennium is the novel way to conceive the equilibrium between humans and the environment [1,2] in a general framework of climatic changes [3,4].
This scenario has strongly affected building and construction sectors which are responsible for almost 40% of energy and process-related emissions [5] and has led to the implementation of specific policies, such as the Energy Performance of Buildings Directive (EPBD) [6,7], and regulations and international standards [8,9,10,11] aimed at achieving the reduction of building’s energy consumption and at the same time providing ever more comfort [12], safety, productivity [13], and sustainability [14]. In this context, the ISO TC/163 has approved in 2017 the ISO Standard 17772-1 [11] which has been reprised from EN 15251 [8]—replaced by EN 16798-1 [9]—as a part of the EPBD implementation. These standards specify design values for the indoor environmental quality [15,16] and values to be used in energy calculations. As far as thermal comfort in mechanically conditioned buildings is concerned, these values are expressed in terms of operative temperature [17], defined as the average of the mean radiant and air temperatures, weighted by their respective heat transfer coefficients. In addition, instead of using operative temperature as the design criterion, EN 16798-1 [9] recommends the well-known PMV and PPD indices [18] that also depend on the mean radiant temperature (as well as air temperature, air velocity, relative humidity, metabolic rate, and clothing insulation).
Among the variables to be measured, it is widely agreed mean radiant temperature is the most critical [17,18,19,20]. It is a physical quantity which allows the evaluation of the radiative heat transfer between the subject and the surrounding environment. This implies that its measurement is indirect [21] and is carried out with different techniques. Particularly, ISO Standard 7726 [20] reports three methods (based on the black globe temperature, the two-sphere radiometer, and the constant-air-temperature sensors) and two calculation procedures (based on the angle factors between the person and the surrounding surfaces and on the plane radiant temperatures). The most used instrument is undoubtedly the standard 150 mm globe thermometer (Vernon’s globe [22]), due to its low cost and simplicity of use. It is also the reference instrument for the assessment of heat stress by means of the WBGT index [23,24]. Unfortunately, it is affected by high response times (with the consequent impossibility to carry out continuous measurements) and, because of its spherical shape, it overestimates the radiative contribution related to horizontal surfaces (ceiling and floor) [25]. Moreover, the globes do not allow the assessment of the radiant temperature asymmetry, which is one of the four parameters responsible for local thermal discomfort [26,27].
As stressed in two recent investigations [25,28], over the past years many studies have been carried out on the mean radiant temperature and globe thermometers [25,29,30]. The most debated issues were the effect of materials on the accuracy [31,32,33,34,35,36], its response time which seems to be acceptable for continuous monitoring only for table tennis balls [20,25,28,32,36,37,38], and, finally, the correction factors of small globes in case of WBGT measurements [28,39,40,41,42]. On the contrary, few investigations have been focused on the metrological characterization of globes and their accuracy in the measurement of the mean radiant temperature [25,43,44,45,46]. In addition, due to the difficulty of reproducing a black enclosure with a close control of temperature, most relevant studies have been carried out under not-controlled conditions (e.g., outdoor) resulting in the impossibility of comparing results from the different investigations [25].
Particularly, in the case of outdoor measurements, small globes show different accuracy leading to overestimation [45] as well as underestimation [47] of the mean radiant temperature in respect to the six-direction radiation reference method [43,48,49,50]. The most common hypotheses for this behavior are: (i) ISO 7726 [20] and ASHRAE [17] equations do not account for high turbulence phenomena occurring outdoors [51]; (ii) black globes absorb higher short-wave radiation with respect to the clothed human body resulting in systematic errors [43,44,47,48,49,50]; (iii) the presence of mixed convection [46,52]. A significant underestimation of the mean radiant temperature by table tennis globes (up to 6 °C) has also been found under natural convection conditions (va = 0) [25]. This study has demonstrated that only standard globes (D = 150 mm) are effective for measuring the mean radiant temperature, while the higher uncertainties exhibited by table tennis globes can be reduced (within 0.5–1 °C) if different equations for convective heat transfer coefficient under natural conditions are applied.
The above-described issues highlight the need of systematic investigations focused on the metrological characterization of small globes when used for the indirect measurement of the mean radiant temperature. This is also because the effect of uncertainties in the measurement of the mean radiant temperature can result in uncertainties in the calculation of PMV (up to 3 decimal points with the highest uncertainties in the category attribution [9,16,21]), WBGT [23,41] and in the assessment of the duration limited exposure (DLE) in hot environments by means of the PHS model [21,53]. In addition, the mean radiant temperature is also an input value for the evaluation of outdoor thermal comfort conditions by means of well-established bioclimatic rational indices such as PET [54,55,56], UTCI [57], and mathematical thermo-physiological models [58,59,60]. This is also true for the growing spread of pocket devices for the measurement of WBGT (based on small globes) and the growing interest in smart sensors for the mean radiant temperature [61] and HVAC control systems based on the instantaneous values of the Predicted Mean Vote (PMV) index [62,63,64].
To provide a metrological analysis on small black globes as effective devices for the measurement of the mean radiant temperature, this investigation will be focused on two globes (38 and 50 mm in diameter) tested in an experimental apparatus which reproduces a black enclosure at a uniform temperature. The analysis here discussed, based on a new experimental campaign carried out under forced convection conditions, deals with three main issues: (i) the comparison between predicted values of mean radiant temperature and the enclosure temperature as reference value; (ii) the analysis of heat transfer by convection as a possible source of systematic measurement errors; (iii) how improvements in heat transfer modeling can reduce measurement errors leading to a reliable assessment of the thermal environment.

2. Materials and Methods

In the following section, the authors present the adopted methodology aimed at assessing the reliability of small black globes under forced convection conditions in terms of the theoretical background, the experimental apparatus used, and measurement protocol adopted.

2.1. Theoretical Background

The globe thermometer consists of a thin-walled black painted copper sphere, in which a temperature sensor is embedded at the center. The equilibrium temperature of the globe depends upon convective and radiative heat transfer mechanisms so that the final value can be considered as the weighted average of mean radiant and air temperatures [17,20]. The method is based upon the equation:
tr = [(tg + 273)4 + hc,g (tgta)/(εσ)]0.25 − 273
where the convective heat transfer coefficient hc,g is [20] the highest value between those under natural (Equation (2)) and forced convection (Equation (3)):
hc,g = 1.4 [|tgta|/D]0.25
hc,g = 6.3 (va)0.6/(D)0.4
Aiming at assessing the reliability of small black globes under forced convection conditions, the authors specifically designed an experimental campaign on two 3D-printed small black globes, which main characteristics are described in Table 1.
Tests were conducted through an experimental apparatus capable of reproducing a black enclosure around the globes being tested. The size of the enclosure allows a negligible reduction of the cross area for the two investigated globes (enclosure vs. globe diameter ratio greater than 5). This implies not significant air velocity gradients. This is also for the air temperature distribution in the enclosure. Particularly, on the basis of the measurements carried out at the inlet of the system (Point AI2 in Figure 1), in the worst-case (e.g., at ts = 60 °C) a mean logarithmic air temperature difference between the top and bottom of the globe of about 1 °C has been calculated for both investigated globes (see Table 2). Consequently, the effects due to the air temperature non-uniformity in the measurement area (i.e., the height of the globe) can be overlooked.
For the purposes of the present study, two runs of measurements for each investigated globe at low (va = 0.2 m/s) and high air velocity (va = 1.1 m/s) as well as different set point values of the thermostatic baths have been considered. Air temperature values are summarized in Table 3.

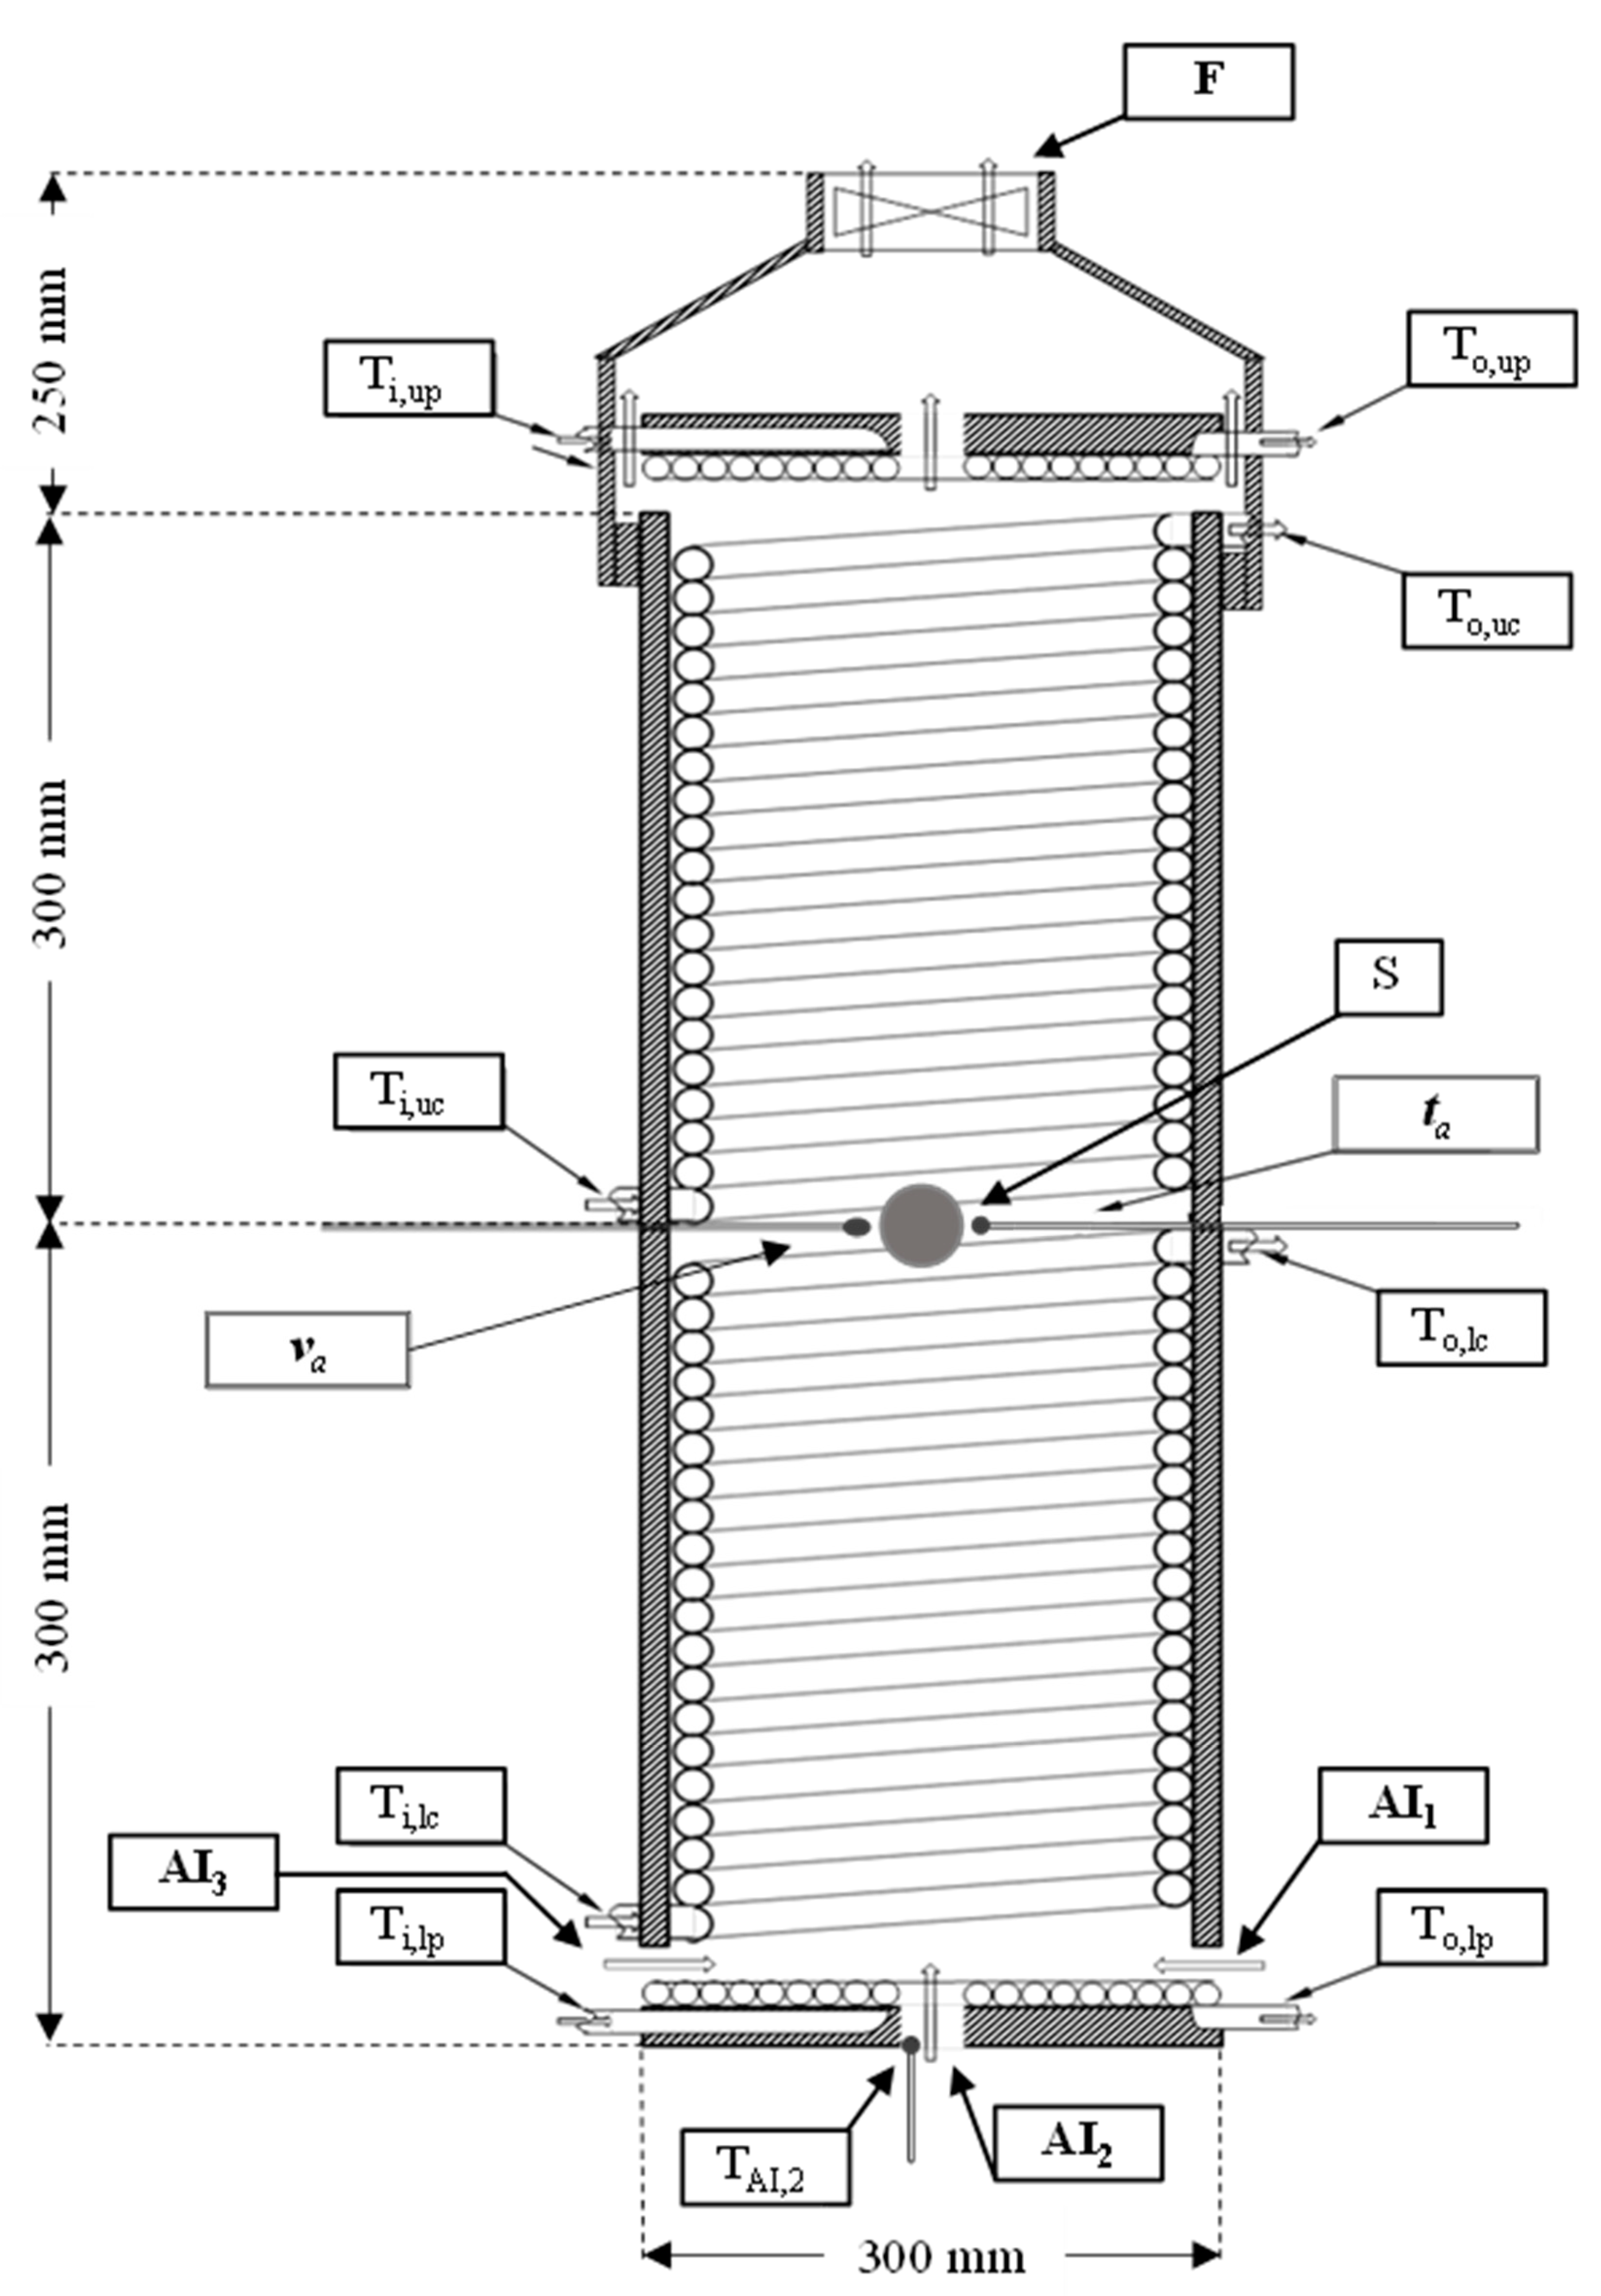
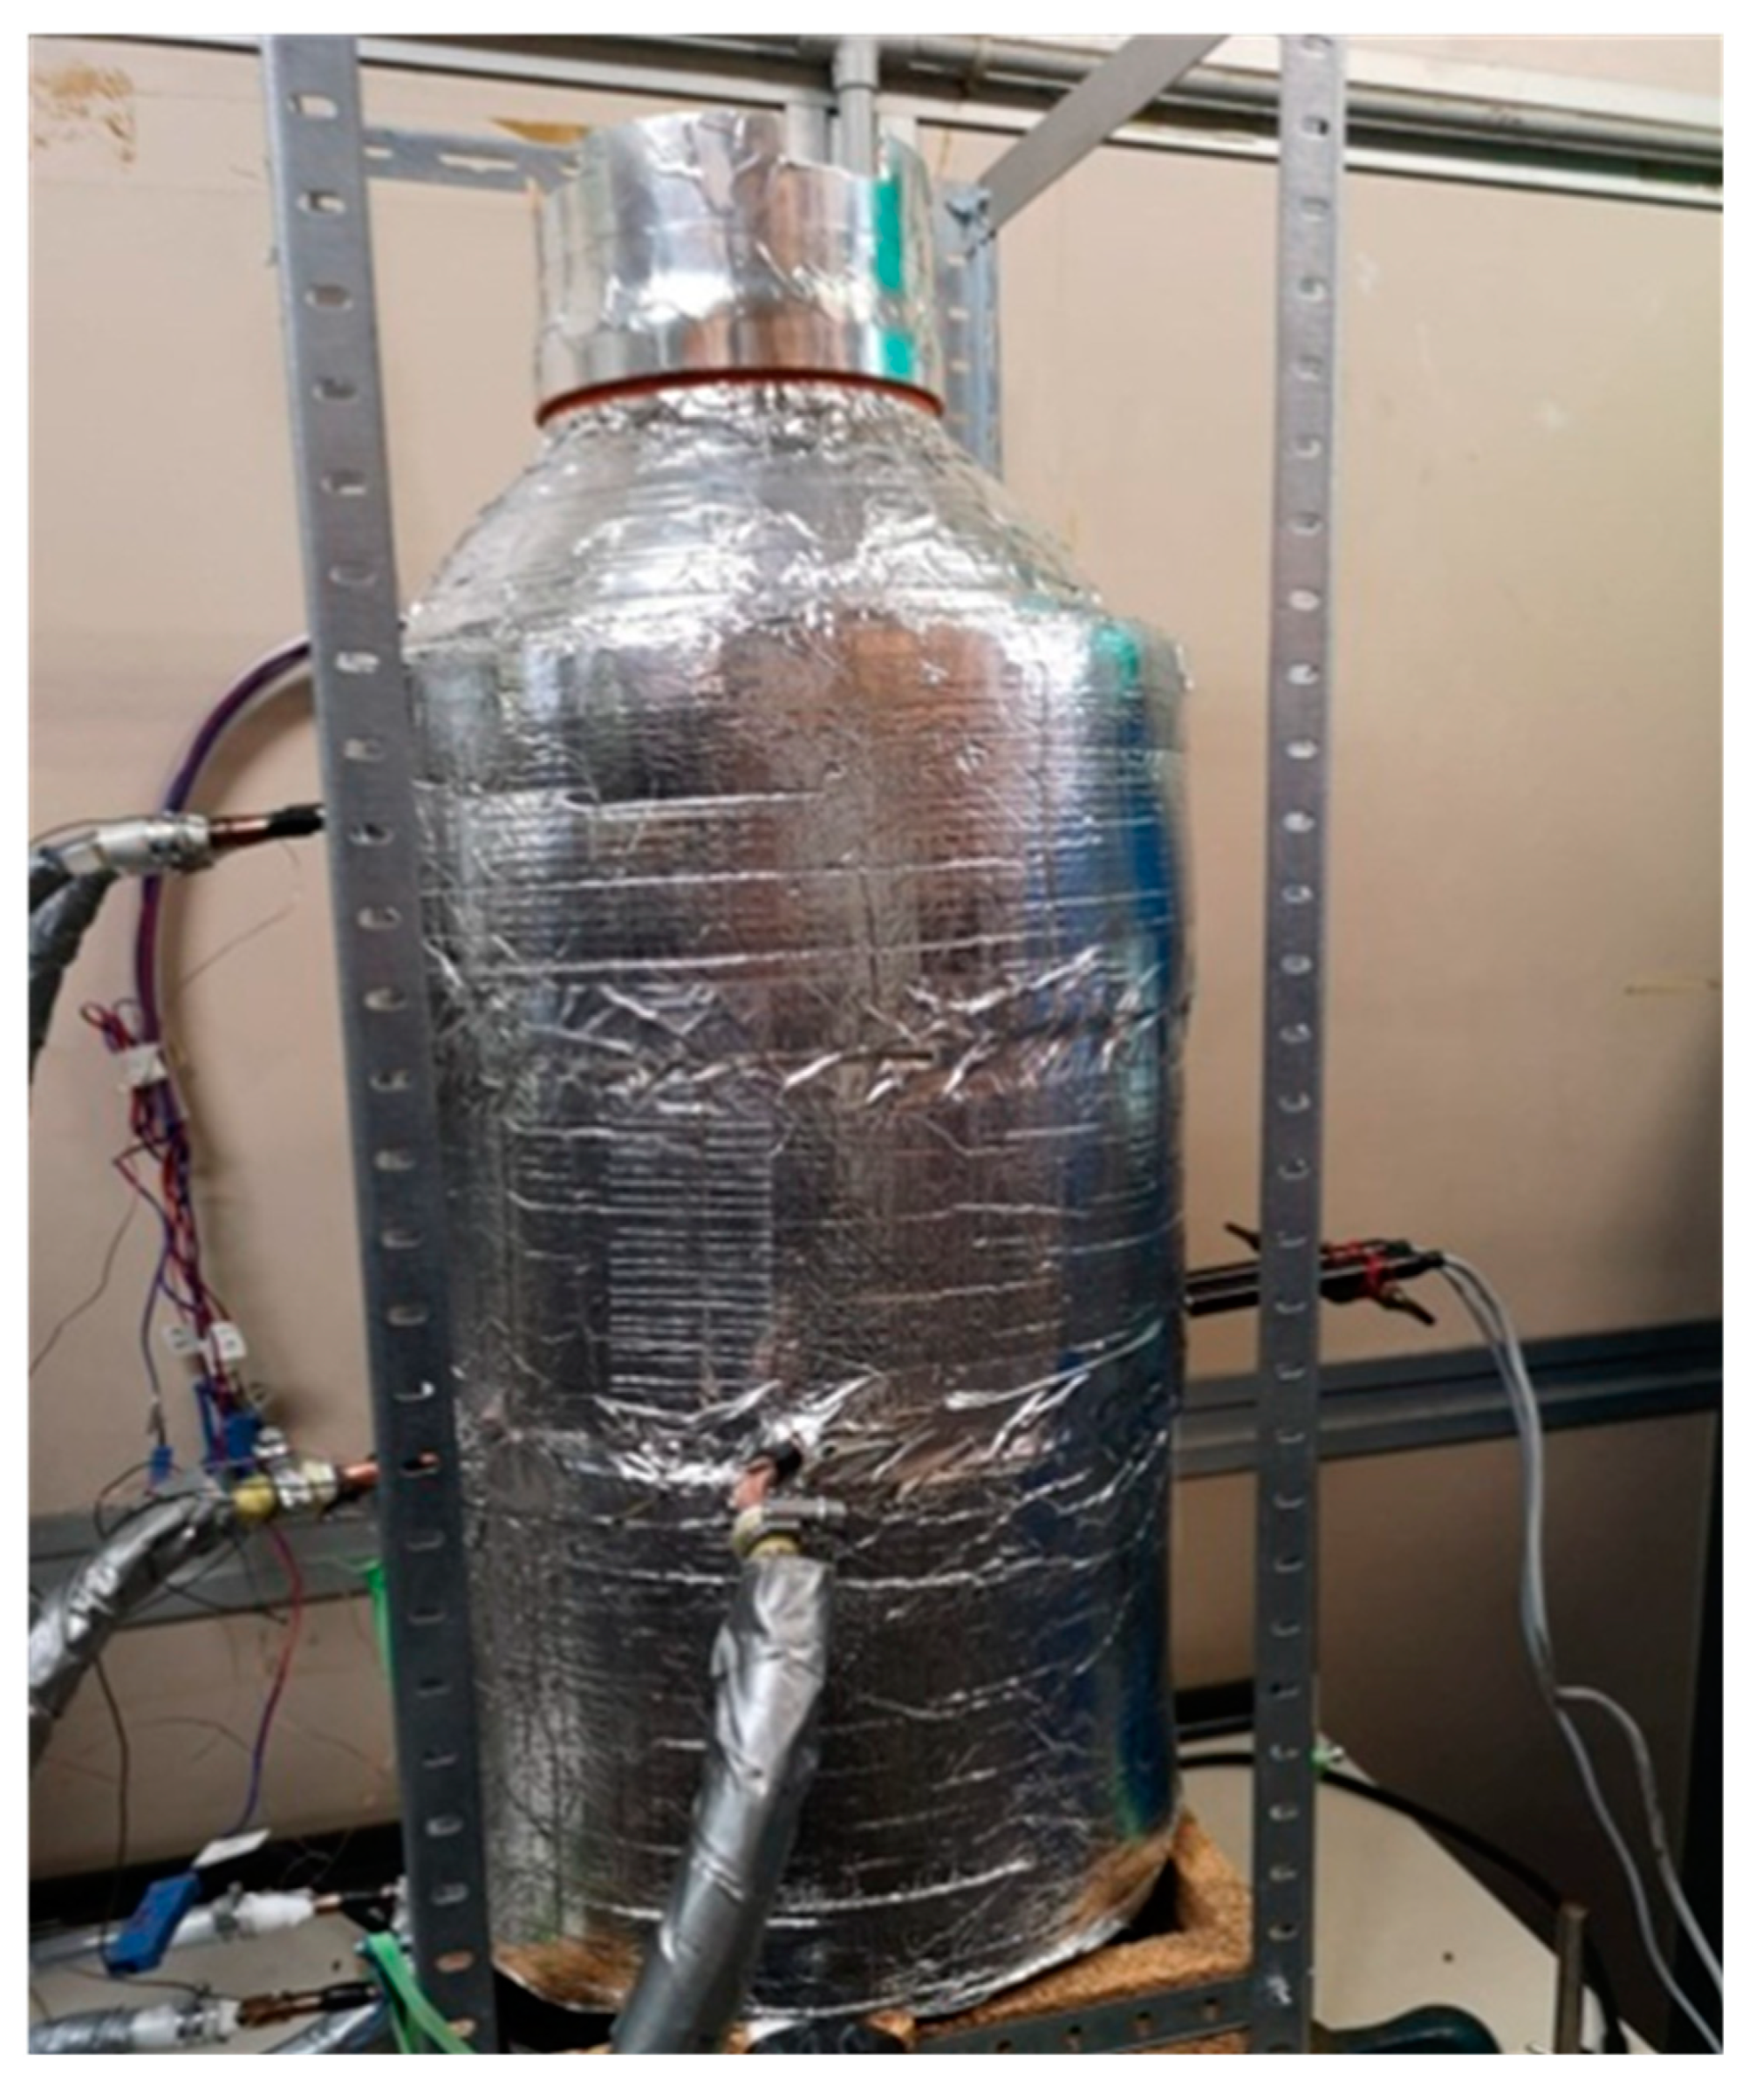
2.2. The Experimental Apparatus

The developed experimental apparatus is made up of (see Figure 1):
  • Two plates made by black painted spiral-wound copper tubes.
  • Two stacked cylinders made by black painted solenoid-wound copper tubes.
  • One hood provided with an air extraction system as shown in Figure 1.
The whole system (Figure 2) was insulated with neoprene panels and covered by aluminum sheets. The control of the temperature of internal surfaces is obtained by the circulation of a water-ethylene glycol solution (20% in volume) whose temperature is controlled by two thermostatic baths. The circulation system [25] of the heat transfer was designed to obtain turbulence conditions with negligible convective heat transfer resistances between the fluid and the enclosure surface (this is also for conductive resistances, due to the reduced thickness of copper tubes) [25].
The air circulation inside the enclosure is allowed by a variable voltage fan F placed at the top and specific air inlets at the bottom (Figure 1). The temperature measurement of the heat transfer fluid were carried out with eight different Type-T thermocouples placed at the inlet and the outlet of each component of the enclosure. All temperature signals were collected by a Fluke 2286A Data Logging System. Air temperature and air velocity measurements were recorded by an Innova 1221 data logger provided with Pt-100 based air temperature sensors and a hot sphere anemometer compliant with ISO 7726 specifications [20]. All measuring devices were calibrated at LAMI, the Industrial Measurements Laboratory of the University of Cassino and Lazio Meridionale, accredited by ACCREDIA, the Italian Accreditation Body.

2.3. The Measurement Protocol

The experimental campaign was carried out by following a special protocol consisting of two steps [25]:
(a)
Preparation
  • Installation of the globe at the center of the enclosure as depicted in Figure 1.
  • Setting thermostatic baths at a fixed temperature (in the range from 20 to 60 °C) to obtain the desired internal surface temperature.
  • Setting fan at a fixed voltage (in the range from +3 to +13 V) to obtain a fixed value of the air velocity.
(b)
Measurement
  • Reaching of steady state conditions for heat transfer fluid, air temperature and globe temperature. The mean value of the enclosure surface temperature ts has been used as a reference value for the mean radiant temperature of each single run. It was calculated from the mean heat transfer fluid temperatures recorded at the inlet and the outlet of the 4 main components of the apparatus. These values were finally averaged accounting for the angle factor between the globe and each component of the enclosure (the two plates and the two staked cylinders).
  • Sampling duration of 15 min with a sampling rate of 1 min.
  • Starting of a new single run as summarized above.
The proposed methodology has been validated based on the negligible difference (within 0.6–0.8 °C) between the predicted mean radiant temperature measured by the standard globe (D = 150 mm) and the mean surface temperature of the enclosure [25].

3. Results and Discussion

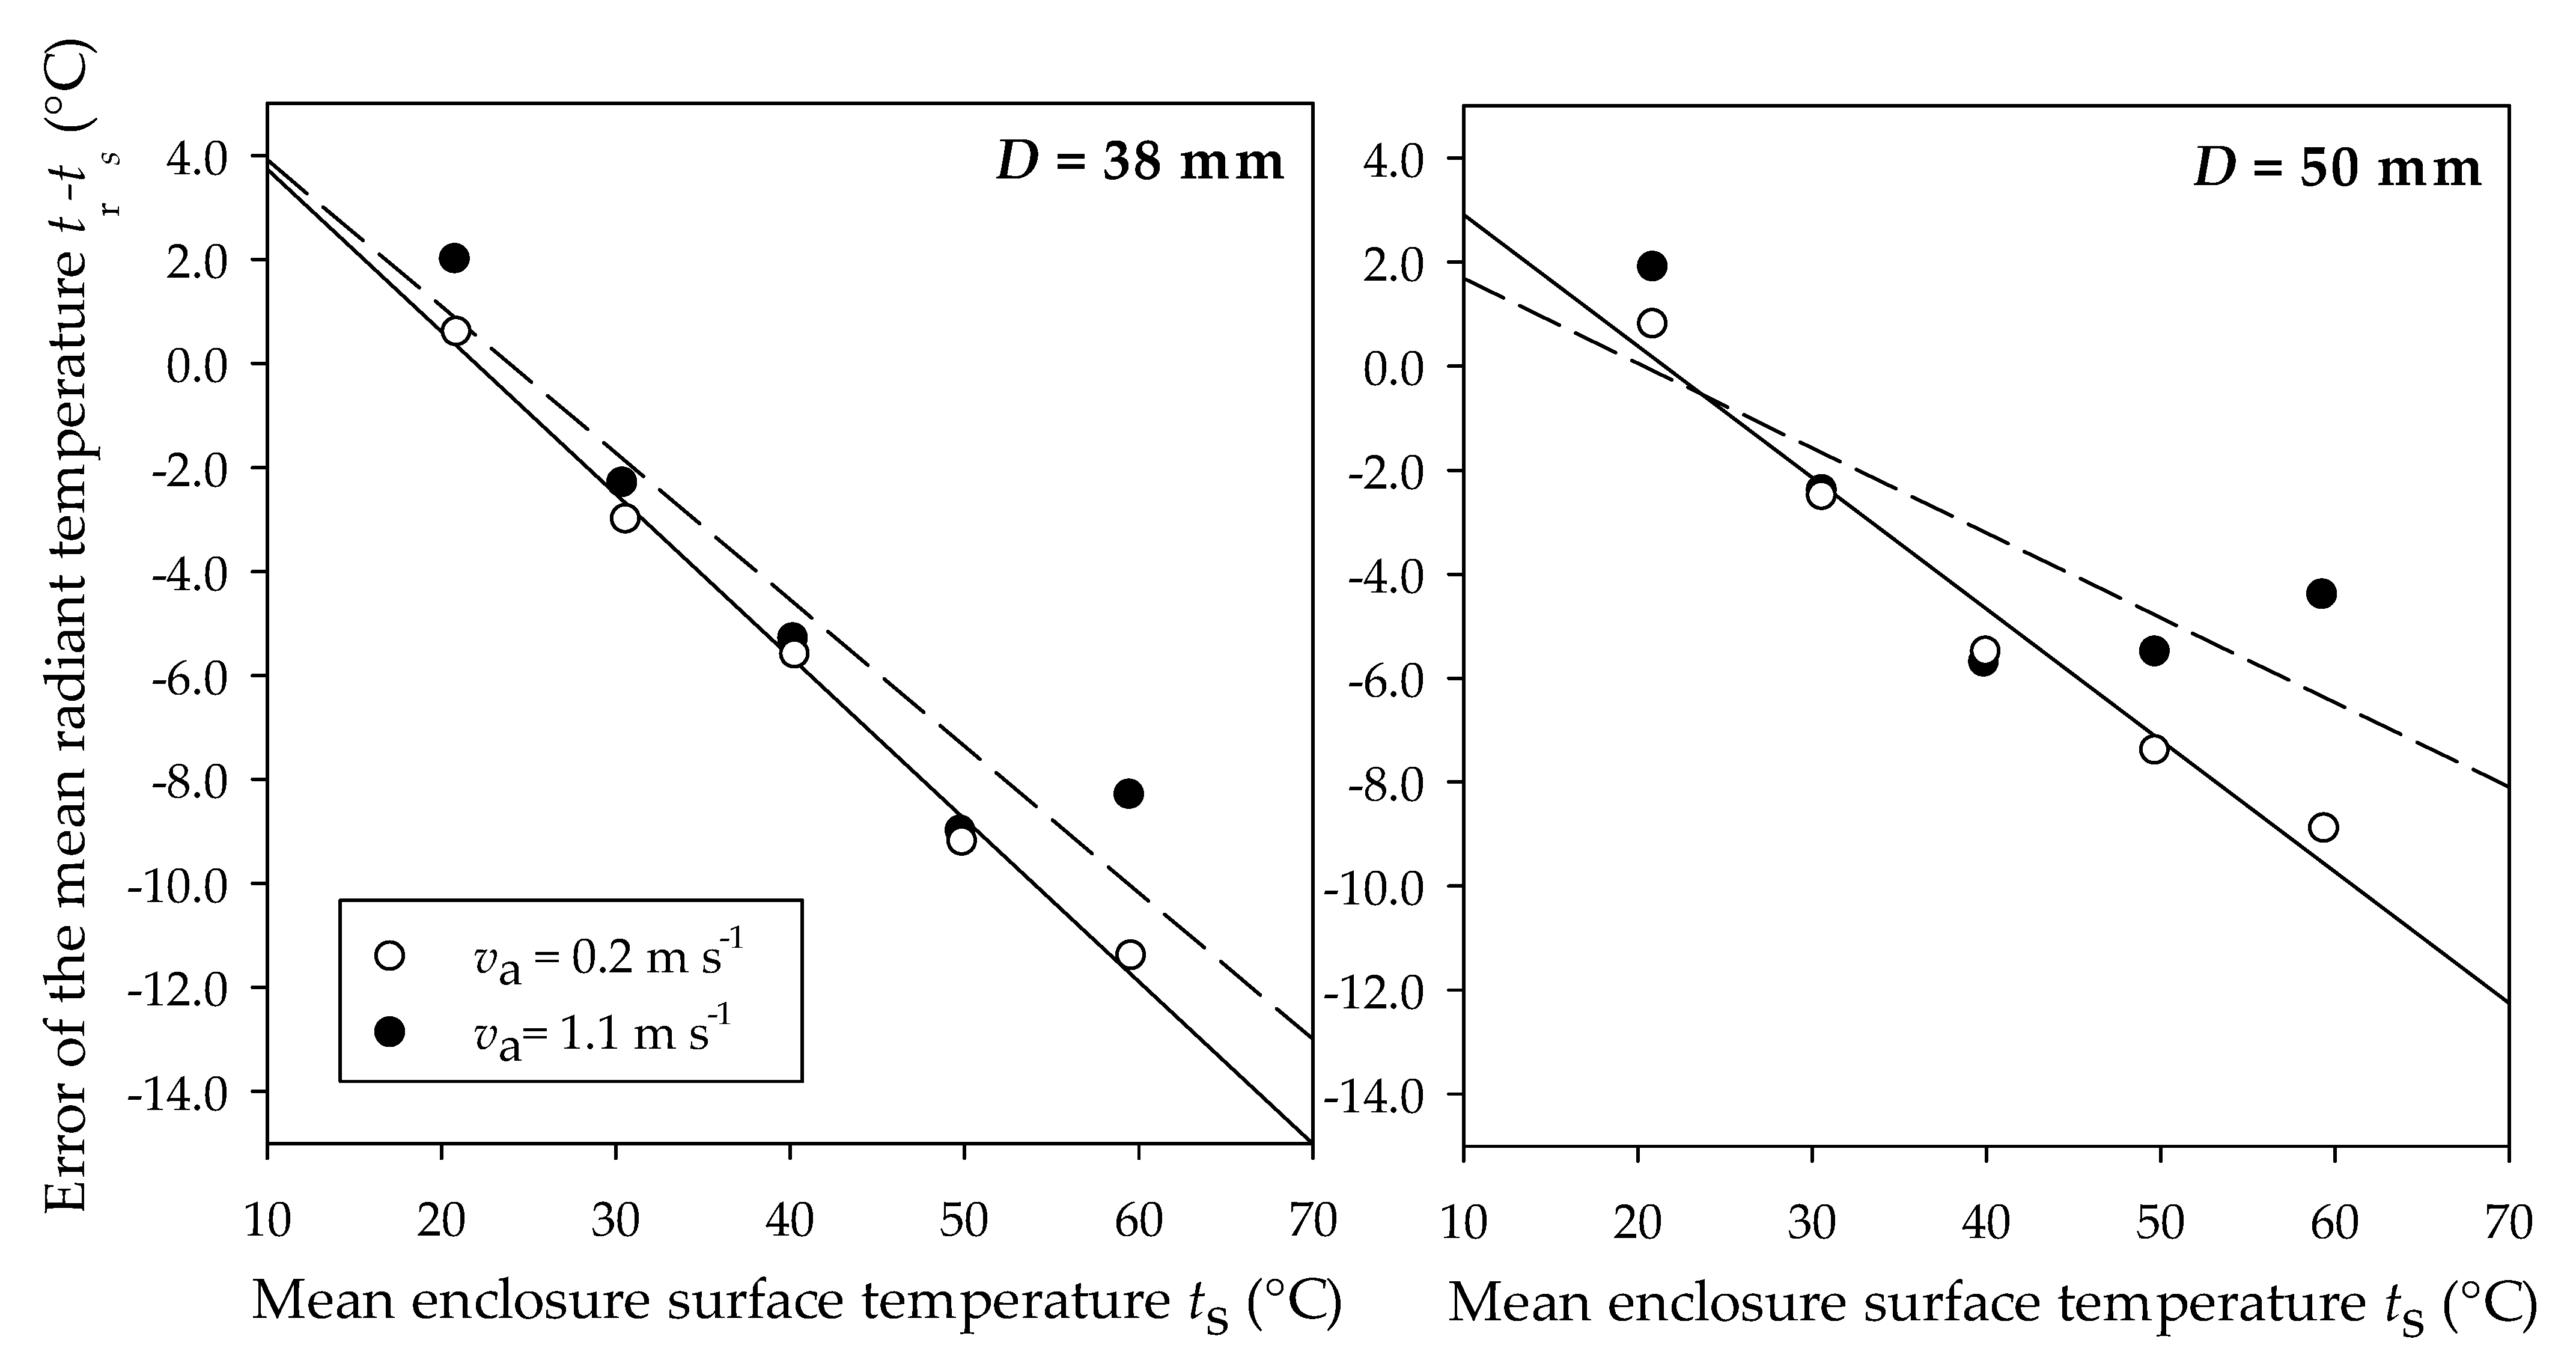
3.1. Mean Radiant Temperature Measurements

In Table 4 and Figure 3 the experimental results are summarized in terms of errors of the predicted mean radiant temperature. Data demonstrate the poor metrological performances of small globes in terms of accuracy of the mean radiant temperature and further confirm the findings in most relevant literature studies [48,49,50,51]. Contrarily to what we have recently found, in the case of standard 150 mm globes [25], there is no agreement between the mean surface temperature and the predicted mean radiant one in the whole range of investigated experimental conditions. In fact, errors even exceeding 10 °C at high radiative thermal loads (e.g., when ts = 60 °C) have been found.
From the analysis of the above results, the following findings emerge:
(i) At ts = 20 °C a slight overestimation of about 2.0 °C for the predicted mean radiant temperature was observed, especially at high air velocity.
(ii) A general trend of underestimation (up to −11.4 °C for ts = 60 °C) for enclosure temperature values equal or greater than 30 °C. Such effect seems to be more relevant for a 38 mm globe at low air velocity. As a matter of fact, for the 38 mm (50 mm) globe the module of the error increases from 8.3 to 11.4 °C (from 4.4 to 8.9 °C) as the air velocity decreases from 0.2 to 1.1 m s−1.
Another singularity which demonstrates the high uncertainty in the measurement of the mean radiant temperature with small globes [48,49,50,51] is that the error is a function of the enclosure temperature. In fact, while at low air velocity the error decreases quite linearly as the enclosure temperature increases, at higher air velocity and radiative loads the error increases (e.g., at ts = 60 °C for the 38 mm globe of and ts = 50 °C for the 50 mm one).
As also highlighted in [25] we can exclude possible influences of the globe material and the experimental apparatus. This is why measurements of mean radiant temperature carried out on standard 150 mm globes under similar radiative conditions (but under still air) showed a good agreement with the enclosure temperature with errors less than 0.6–0.8 °C.

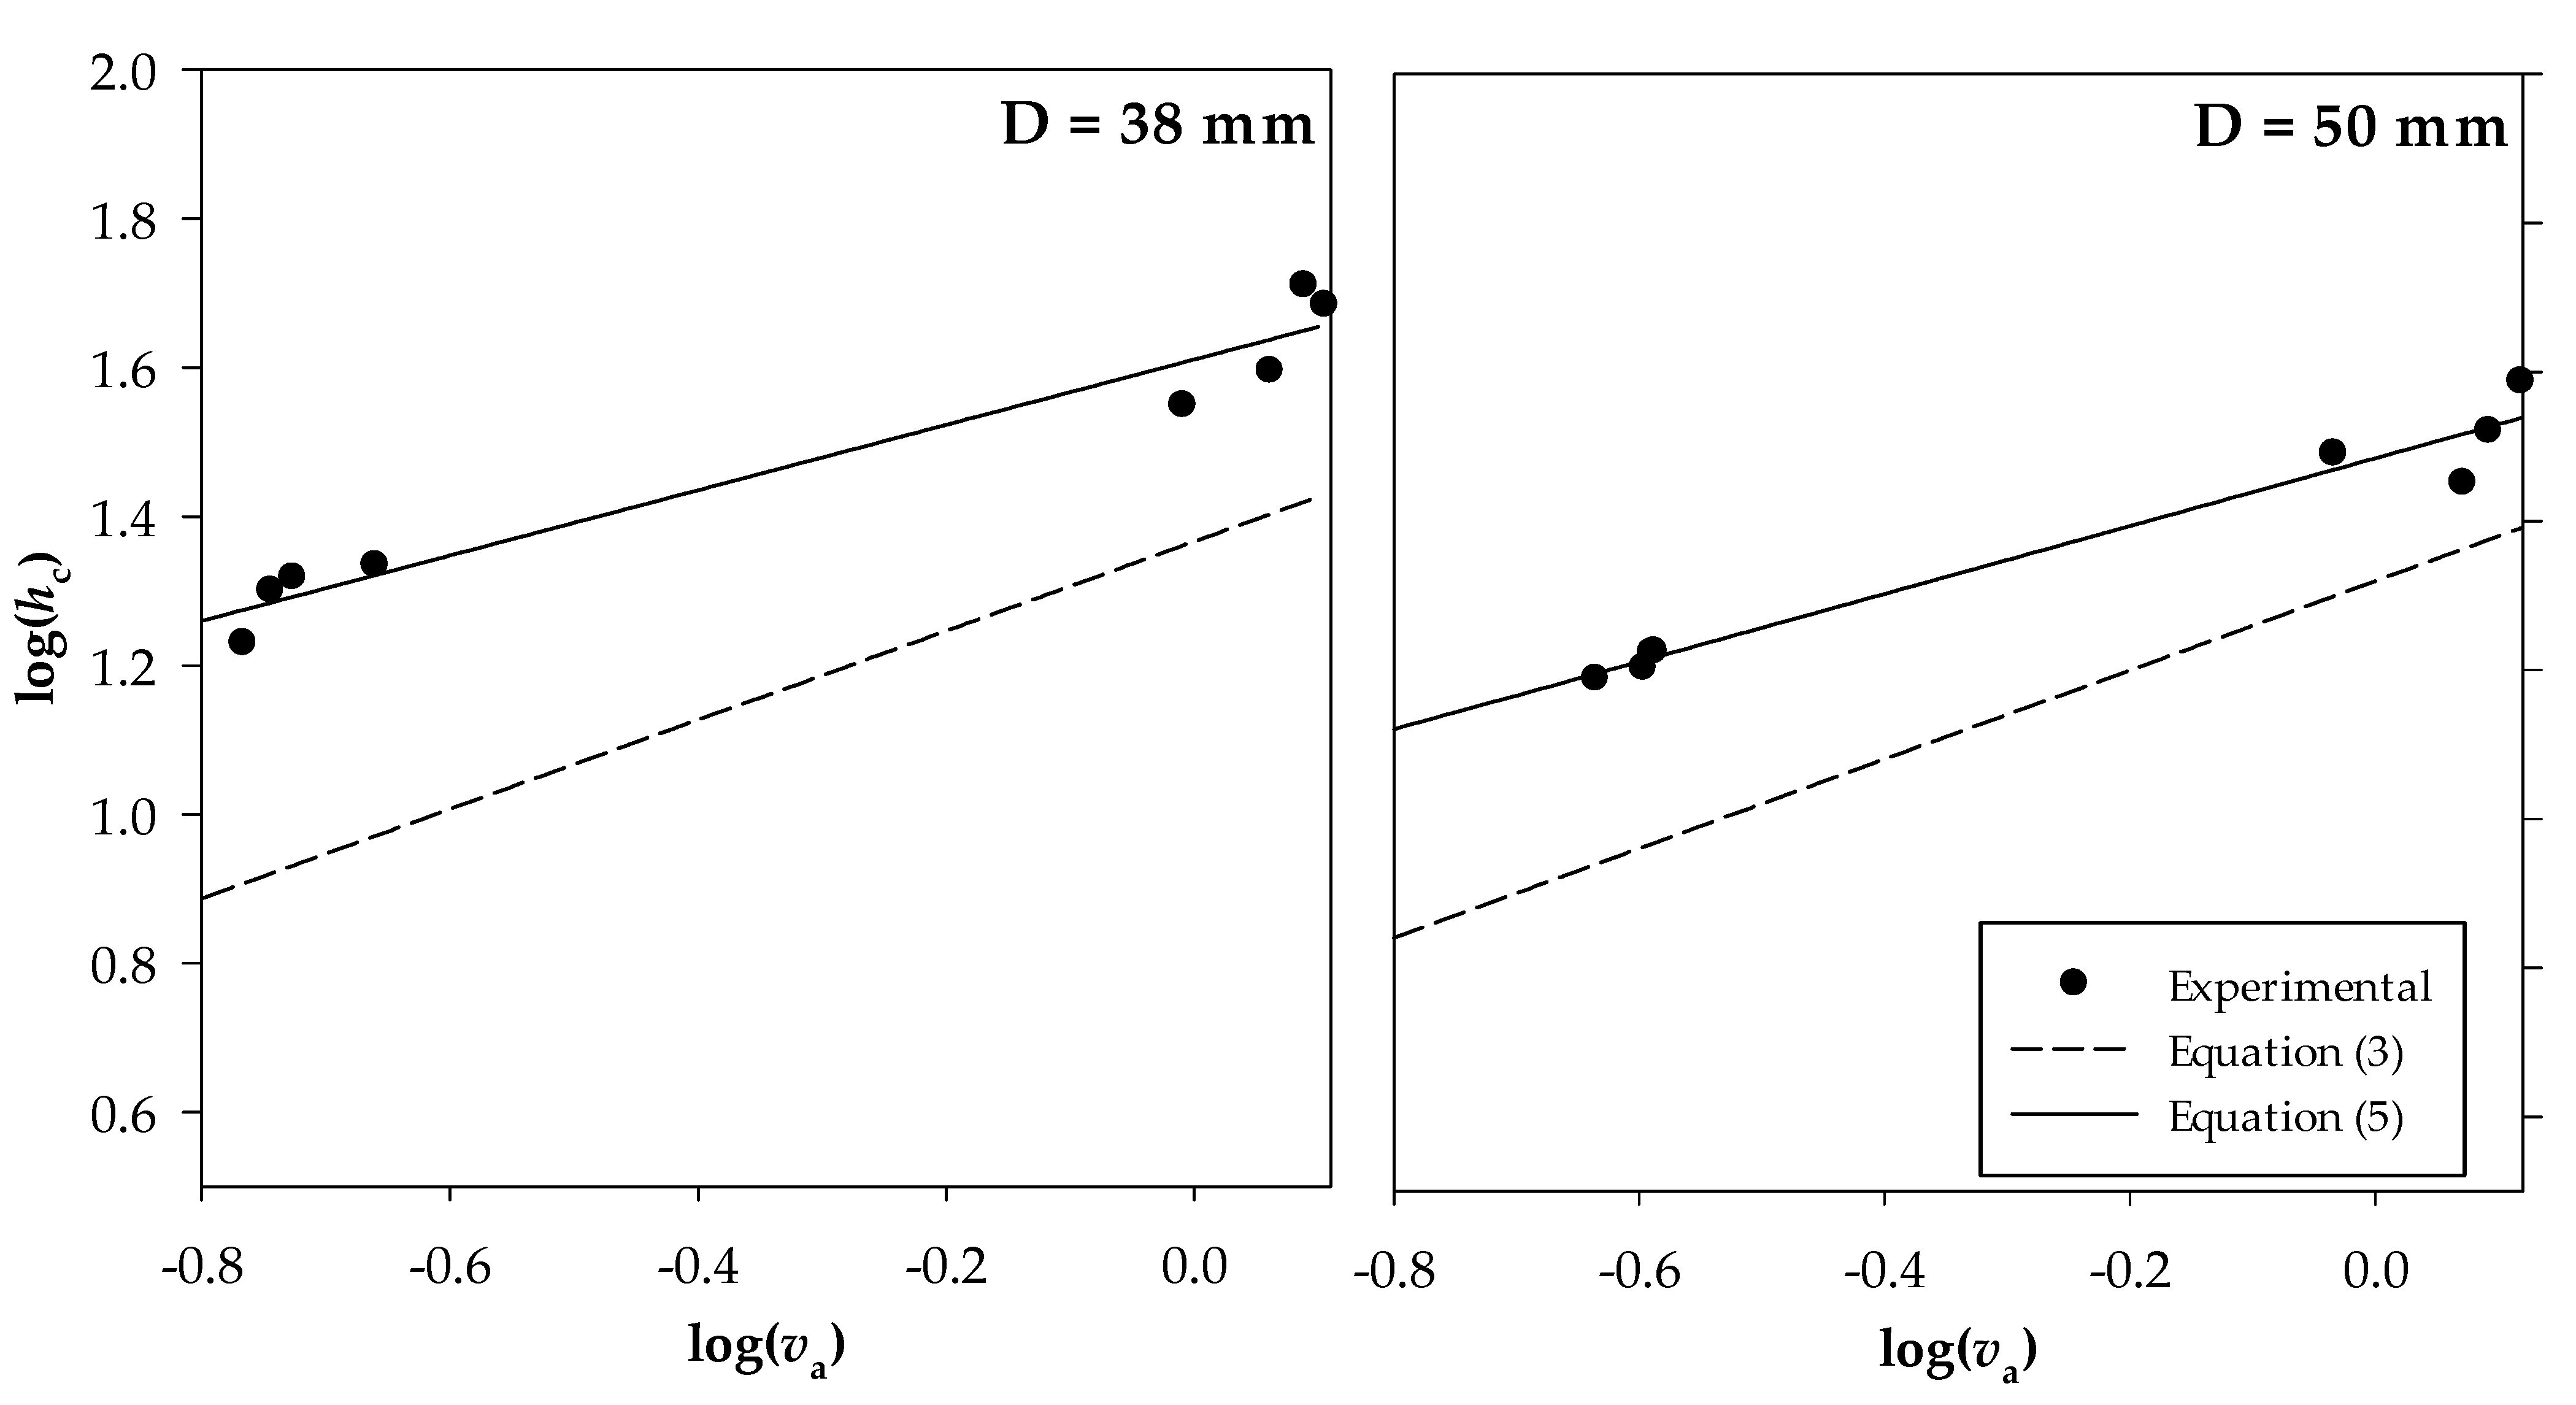
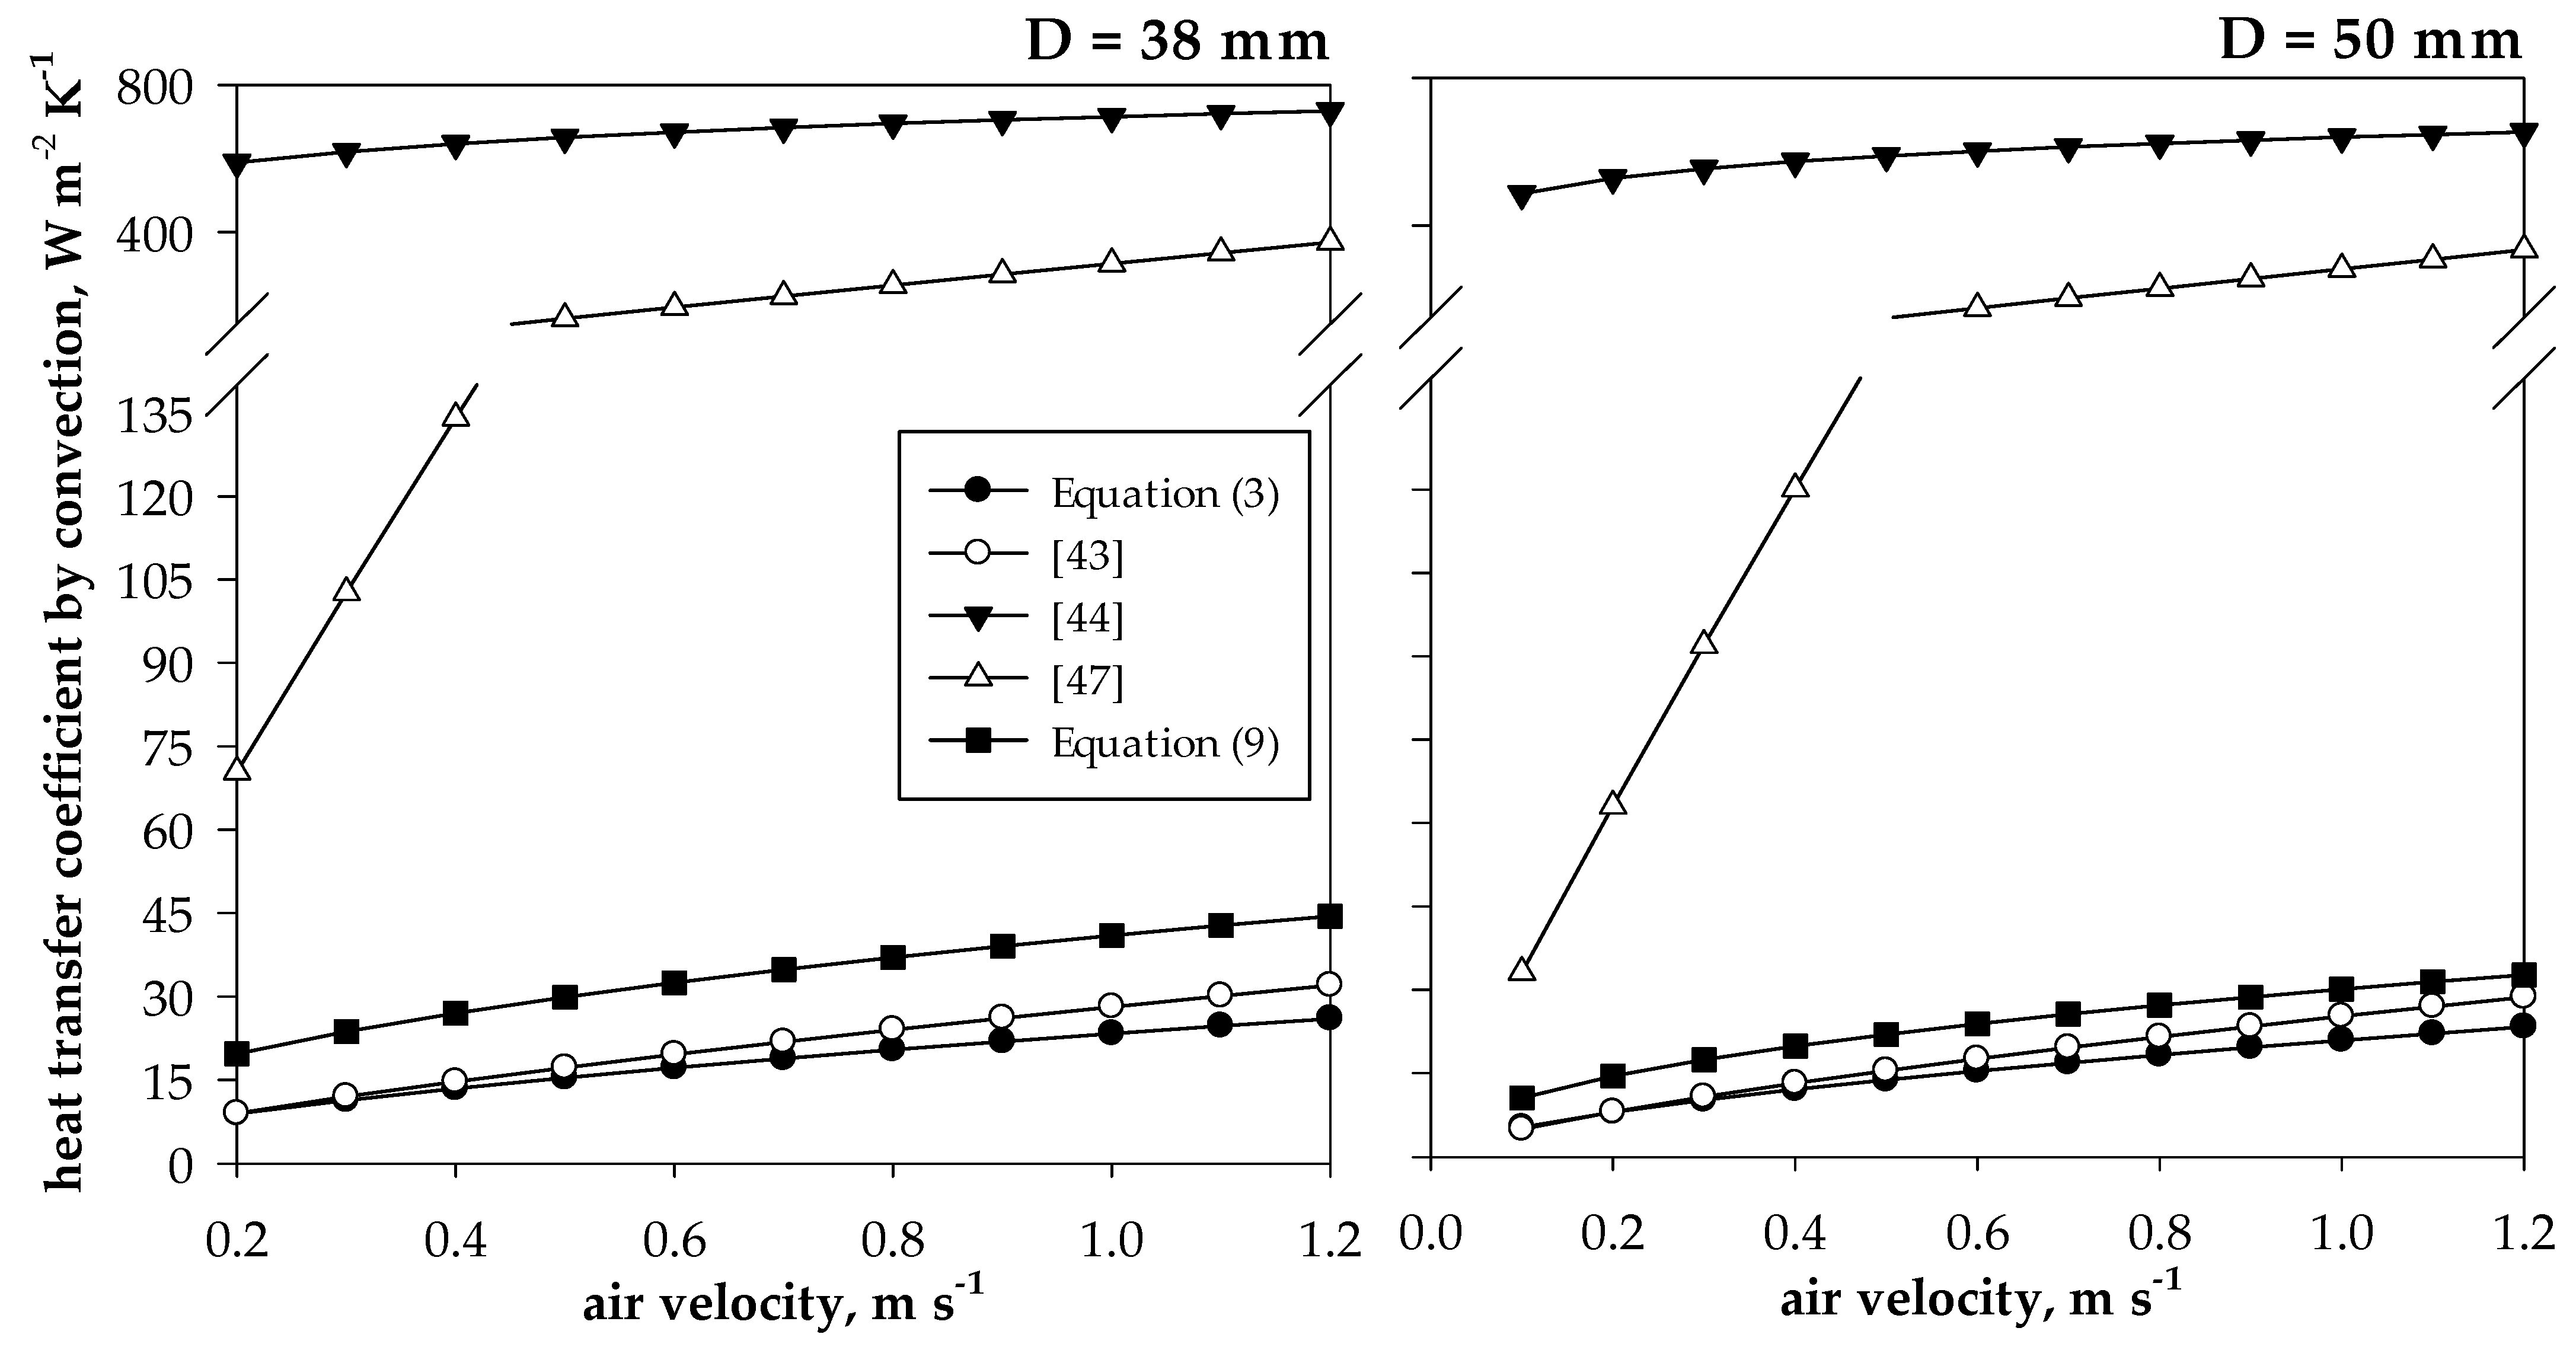
3.2. Analysis of the Heat Transfer by Convection on the Globes

The inaccuracy in the evaluation of the mean radiant temperature observed above (especially at high enclosure temperatures) could be ascribed to the incorrect estimation of the heat transfer coefficient hc,g in Equation (3), which has been derived from the equation recommended by McAdams for spheres heated or cooled by gas with a Reynolds’ number ranging from 25 to 100,000 [65]. To verify this hypothesis [25,43,44,47], Equation (1) has been rearranged by assuming that the enclosure surface temperature is equal to the mean radiant temperature (ts = tr). In this way, the heat transfer coefficient by convection can be measured using the following equation [25]:
hc,g = ε σ [(ts + 273)4 − (tg + 273)4]/(tgta)
Then the measured values of the heat transfer coefficient by convection were correlated with the air velocity in two different ways:
  • through one simple empirical power law:
    hc,g = a0 (va)m
  • through two power laws, formulated consistently to the Nusselt number’s definition as a function of the diameter of the globe D:
    hc,g = Nu kf/D
    Nu = a Rem
On the basis of the definition of Reynolds’ number (va D/ν), and assuming constant values of fluid transport properties and Prandtl’s number, Equation (6) can be rearranged as follows:
hc,g = a’0 (va)m/D1−m
hc,g = a’’0 (va)m/Dn
and:
a’0, = a kf/(va)m
a’’0 = a kf Dm−1/(va)m
The obtained results are depicted in Figure 4 on a logarithmic scale as a function of the air velocity. The coefficients for Equations (5), (8) and (9), obtained by means of simple/multivariable regressions with Sigma Plot [66] are summarized in Table 5. Table 6 also summarizes coefficients for Equation (5) obtained in other literature studies [20,43,44,47].
Experimental results in Figure 4 demonstrate that the measured values of the heat transfer coefficients by convection are generally higher than those predicted by ISO equations [20]. This phenomenon is more significant for the small globe at low air velocity. In this case, the experimental hc,g value increases from 20.8 to 40.7 W m−2 K−1 when the air velocity ranges from 0.2 to 1.1 m s−1, whereas the value predicted by Equation (3) ranges from 8.5 to 25.1 m−2 K−1. The measurements carried out on the 50 mm globe provide less significant deviations of +78% and +51% at air velocity values of 0.2 and 1.1 m s−1, respectively.
According to the R2 values summarized in Table 5, Equation (5) returns the best fitting with an acceptable level of correlation (R2 > 0.950). Equation (8) exhibits a lower correlation (R2 = 0.906), whereas Equation (8), based on an exponent for the diameter different from the exponent based on the Reynolds’ number, leads to quite comparable results with Equation (5). Particularly, for Equation (9), R2 is 0.941, which is close to that obtained with the simple power law for both globes.
As far as comparison with other literature correlations for hc,g under not controlled outdoor forced convection conditions [43,44,47] is concerned (see Table 6), the data in Figure 5 provide meaningful information.
Particularly, values of the heat transfer coefficient by convection obtained in the present study seem to be relatively close to those obtained by Thorsson et al. [43] outdoors. This is especially true for the 50 mm globe at higher air velocity values. Particularly, at va = 1.1 m s−1, Equation (9) overestimates the convection heat transfer by 34% for the 38 mm globe (43 W m−2 K−1 instead of 32 W m−2 K−1) and by 15% for the 50 mm one (31 W m−2 K−1 instead of 27 W m−2 K−1). In addition, the correlations empirically formulated by Tan et al. [44] and Manavvi et al. [47] (Table 6) return quite unrealistic hc,g values for heat transfer convection in air being more consistent with forced convection in water [65] which typically exhibits mean heat transfer coefficient in the range from 300 to 1.8·104 W m−2 K−1 [65].
Finally, aimed at evaluating the effect of the correlation for heat transfer by convection, in Table 7 and Figure 6 the errors between the predicted mean radiant and the mean enclosure temperatures through different equations and at different air velocities are summarized. The analysis has been restricted only to the previous investigation by Thorsson et al. [43] which returned heat transfer coefficient values typical for forced convection in air (e.g., in the range from 30 to 300 W m−2 K−1 [65]).
Obtained results demonstrate how the accuracy of the mean radiant temperature is significantly improved when correlation for hc,g formulated on an experimental basis is applied. Particularly, the mean measurement error ranges from −5.7 to −3.2 °C with Equation (3) [17,20] (see Table 4) for the 38 mm table tennis ball but is within 1 °C in the case of Equation (9). Results of measurements carried out at a high radiative load (ts = 60 °C) also confirm the general trend of improvement, since the excessive and systematic underestimation recorded on the 38 mm globe (from −11.3 to −8.3 °C depending on the air velocity) is within −2.1 °C for measurements at va = 0.1 m s−1 while a slight overestimation of the same magnitude has been observed at higher air velocity (2.3 °C).
It is noteworthy to observe that the equation in Thorsson et al. [43], which is valid outdoors in a wide range of air velocities (0.1÷4.0 m s−1), returns the same errors observed with Equation (3) [20] at low air velocity. To the contrary, at higher air velocities, due to higher coefficients than those used by ISO (see Table 5), the errors significantly decrease especially for the larger globe, which exhibits a mean error of the same magnitude of Equations (5), (8) and (9).
This implies the need to investigate a better refined and wider range of air velocity values to formulate a specific correlation which is effective in increasing the accuracy of mean radiant temperature predictions by small globes.

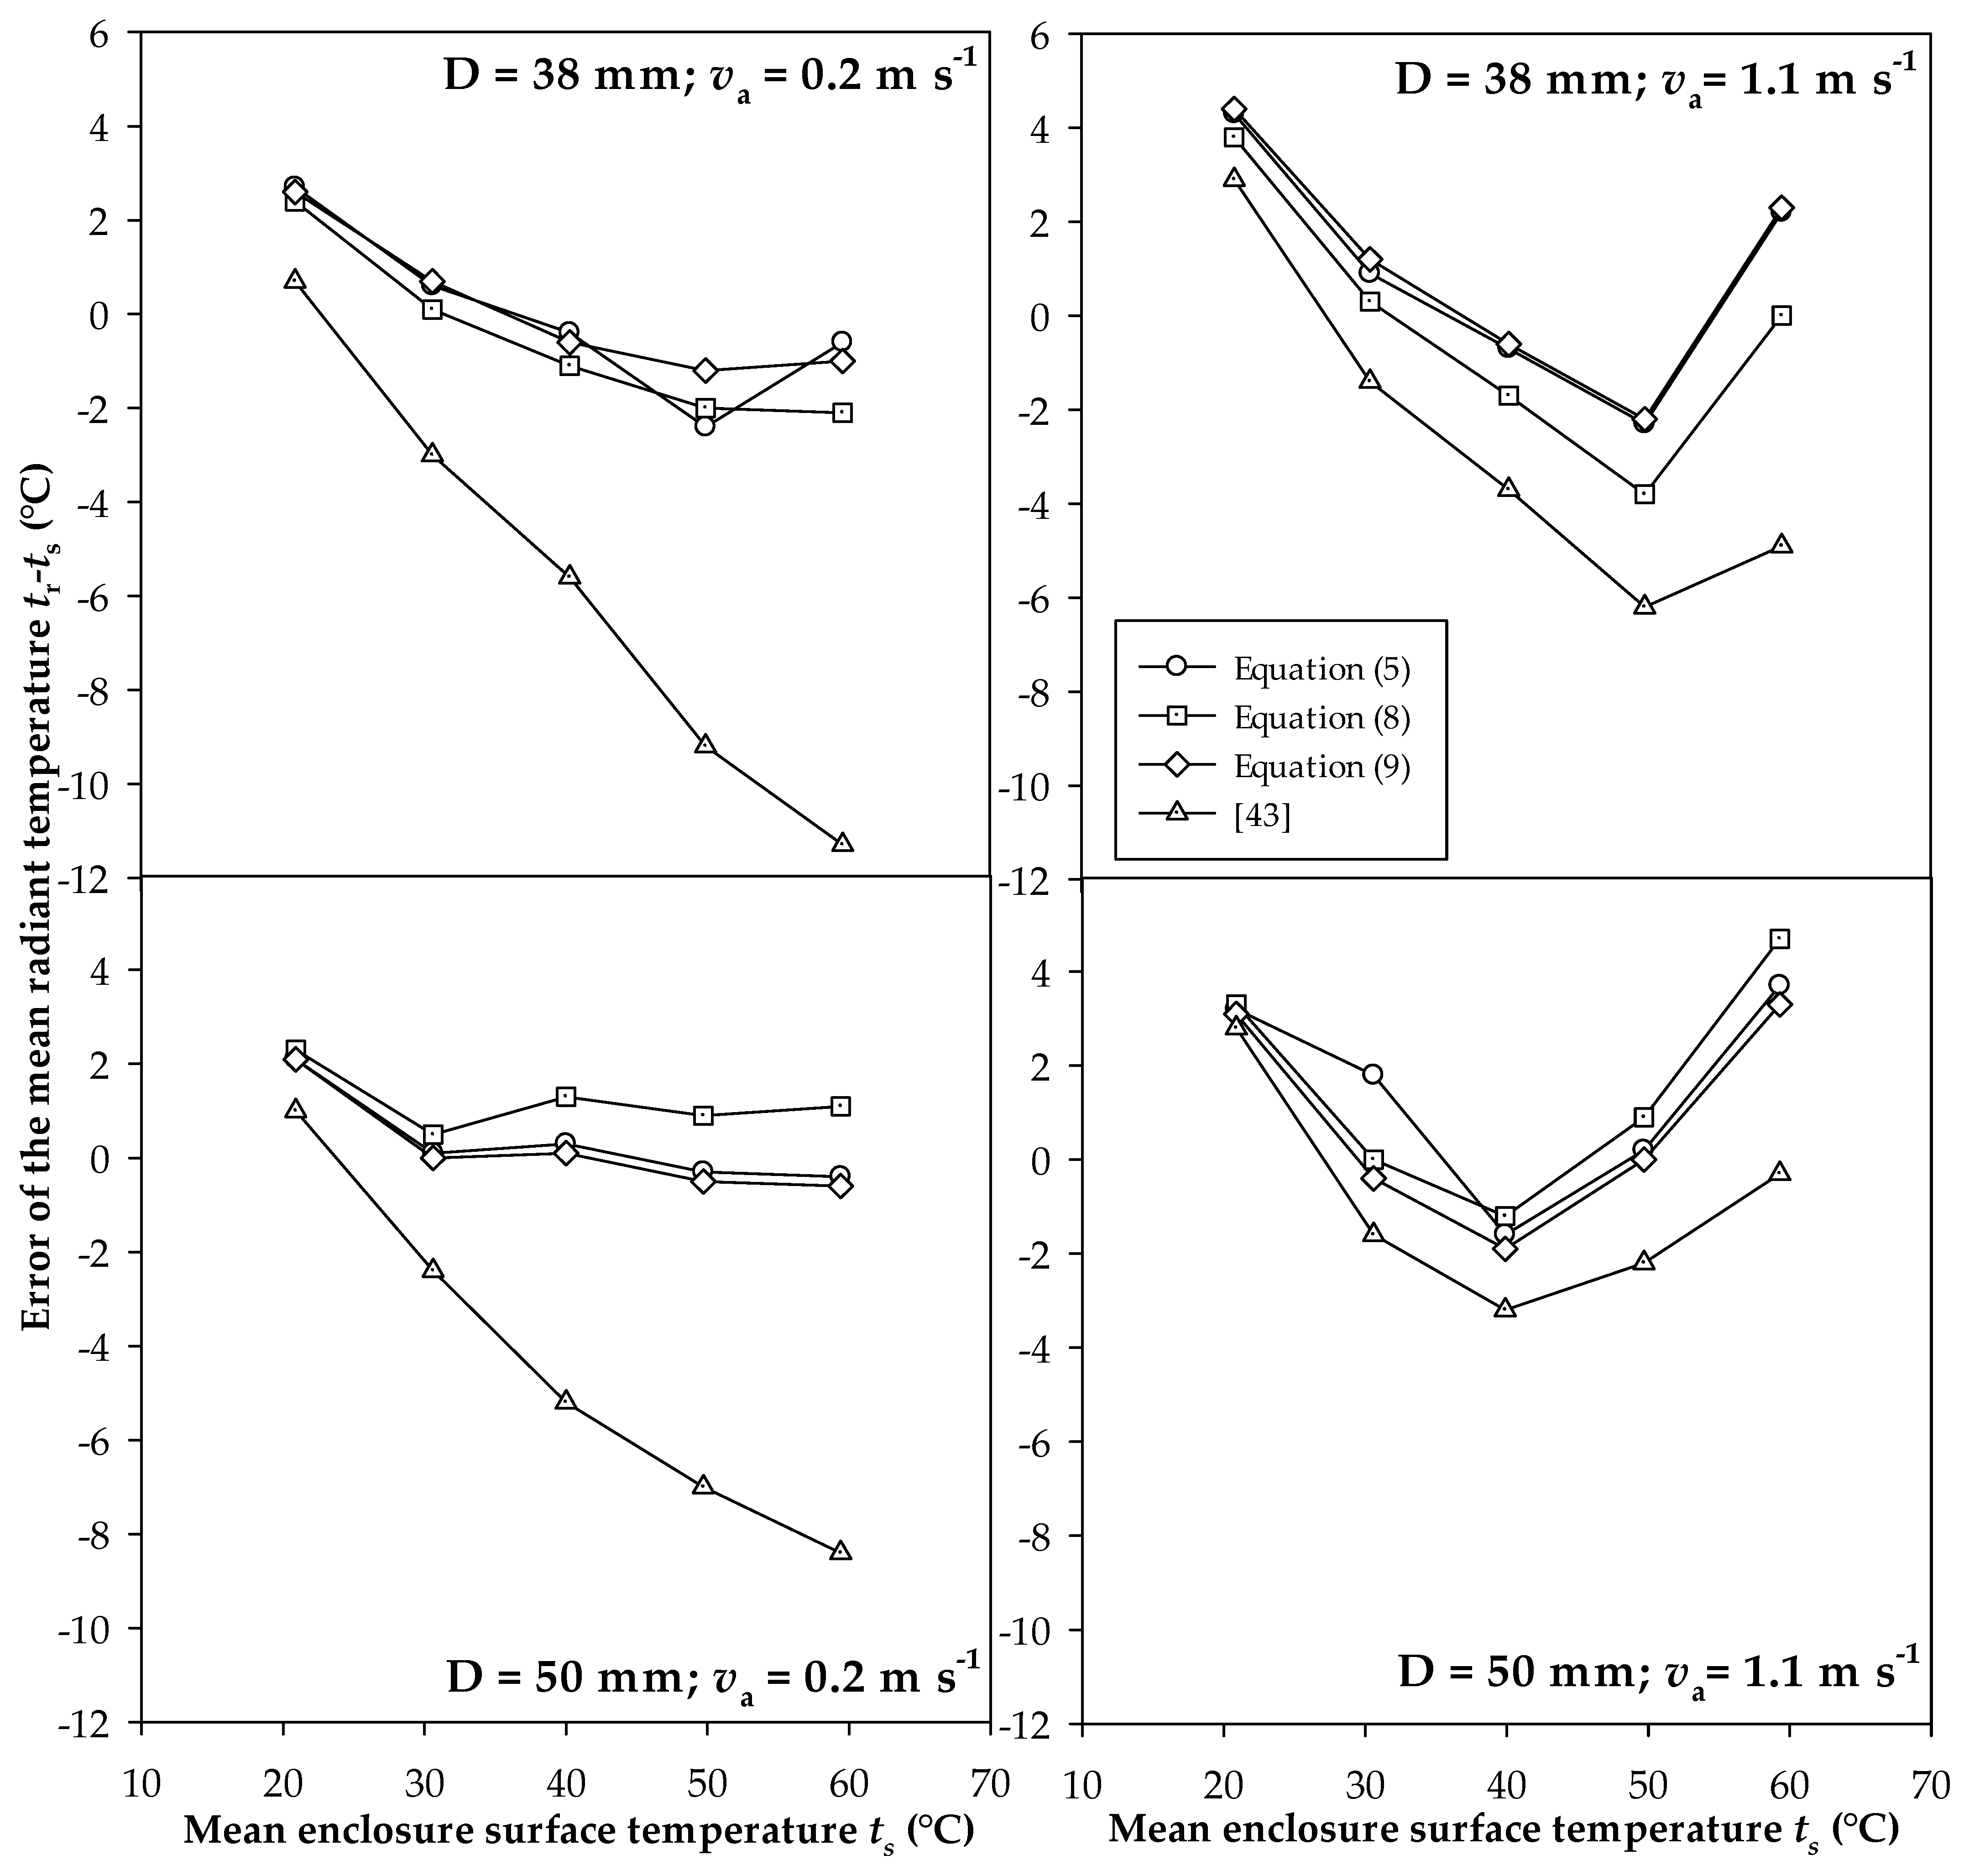
3.3. Impact of Measurement Errors on the Assessment of Thermal Environments

The above-highlighted measurement errors give rise to critical issues on the assessment of comfort and stress conditions by means of the PMV index [26] and PHS model [53] when small globes are used. To this end, the authors focused on two scenarios:
  • Thermal Comfort
    ta = 22.8 °C; tr = ts = 30.0 °C; va = 0.2 m s−1; RH = 50%
  • Heat stress
    ta = 28.6 °C; tr = ts = 50.0 °C; va = 0.2 m s−1; RH = 50%
The metabolic rate value considered in case of comfort (heat stress) conditions were 1.2 met (2.8 met) which corresponds to sedentary (moderate) activity according to ISO 8996 [67]. In both cases, a basic clothing insulation value typical of the summer season has been considered (e.g., Icl = 0.5 clo) [26,68]. Numerical simulations were performed using the TEE (Thermal Environment Evaluation) package [69,70,71], a special software devoted to the assessment of the Thermal Environment in agreement with all international standards in the field of the Ergonomics of the Physical Environment. Obtained results, expressed in terms of PMV and duration of limit exposure (DLE) predicted by the PHS model have been summarized in Table 8 and Table 9.
According to data in Table 8, the underestimation of the mean radiant temperature of small globes results in the underestimation of the PMV when ISO 7726 algorithms are considered (Equation (3)). Particularly, globe A (B) leads to an underestimation of the PMV of 0.43 (0.35) if compared with the reference value obtained by assuming tr = ts. Consequently, when the mean radiant temperature is measured with the small globe A, the environmental category drops down from II to IV (category IV is characterized by a low level of expectation and should only be accepted for a limited part of the year [9]). On the contrary, if the correlations discussed above are used, due to the reduced measurement errors (see Table 7), PMV values change by 1 decimal point at the most without category shifts.
Data in Table 9 also reveal meaningful errors in the assessment of the thermal environment related to the use of small globes. Particularly, globe A (B) overestimates the DLE by 91 min (71 min) with unforeseeable consequences for the health of workers. In both cases, a better agreement is obtained if new algorithms are used, as shown by the small differences exhibited in the DLEs (+21 min for globe A and +8 min for globe B in worst cases). However, these preliminary results require further investigations for different air temperature, humidity, and metabolic rate conditions. This is because, according to past studies [16,21], measurement uncertainties of the mean radiant temperature significantly affect the objective assessment of thermal environments even within the requirements prescribed by ISO 7726 and ISO 8996 Standards [72,73].

4. Conclusions

This paper was addressed at answering the most debated metrological issue which the past and the present literature in the field of the ergonomics of the physical environment seem to be far from reaching a unique answer. Particularly, are small globes accurate in predicting the mean radiant temperature?
The analysis of the literature focused on globe thermometer accuracy and revealed several inconsistencies, mainly due to a lack of definition and control of the influence variables which affect this kind of measurement. Consequently, it is still unclear whether small globes, characterized by low response times, exhibit the same accuracy of the standard 150 mm Vernon globe in predicting the mean radiant temperature. Besides, since few investigations are based on measurements in a black enclosure at a uniform temperature, the authors specifically designed an experimental apparatus capable to characterize the radiant heat transfer between the globe and the surrounding environment.
From the results several crucial issues related to the accuracy of small globes have been found:
  • Firstly, in the presence of high-radiative loads, small globes exhibit a general trend of underestimation of the mean radiant temperature calculated according to the ISO 7726 model. This phenomenon is affected by the temperature of the enclosure (generally, the warmer the enclosure, the greater the underestimation) and the air velocity (at higher air velocity, the errors are reduced by 3–4 °C).
  • Moreover, larger errors have been observed for a 38 mm globe (i.e., table tennis ball) leading to mean radiant temperature values even 11.4 °C lower than the enclosure temperature. On the other hand, the 50 mm globe showed lower errors (i.e., up to 8.9 °C).
  • The main effect can be ascribed to the underestimation of the heat transfer convective coefficients calculated according to the ISO 7726 Standard. To this aim, the authors proposed new experimental correlations leading to an accuracy within 1.0 ÷ 1.5 °C for the mean radiant temperature.
  • The measurement errors exhibited by small globes lead to critical issues in the objective assessment of thermal comfort and heat stress when ISO 7726 algorithms are used. On the contrary, the proposed experimental correlations result in a more reliable assessment of microclimatic conditions.
In the near future, further investigation will be extended to a wider and more refined range of air velocity and enclosure temperature values, in order to formulate more specific correlations aimed at increasing the accuracy of mean radiant temperature predictions by small globes. Finally, further efforts will be addressed to quantify the effect of small globes on the objective assessment of the thermal environments.

Author Contributions

All authors contributed in equal amounts to the whole research activity here discussed: conceptualization, F.R.d.A., G.F., B.I.P., A.F., and G.R.; methodology, F.R.d.A., G.F., B.I.P., A.F., and G.R.; investigation, F.R.d.A., G.F., B.I.P., A.F., and G.R.; resources, F.R.d.A., G.F., B.I.P., A.F., and G.R.; writing—original draft preparation, review, and editing, F.R.d.A., G.F., B.I.P., A.F., and G.R. All authors have read and agreed to the published version of the manuscript.

Funding

This research has been carried out within the “Renovation of existing buildings in NZEB vision (nearly Zero Energy Buildings)” Project of National Interest (Progetto di Ricerca di Interesse Nazionale—PRIN) funded by the Italian Ministry of Education, Universities and Research (MIUR), Protocol No. 2015S7E247_005.

Institutional Review Board Statement

Not applicable.

Informed Consent Statement

Not applicable.

Data Availability Statement

Not applicable.

Acknowledgments

We owe special thanks to Maria Teresa Restieri (BSc in Biomedical Engineering) and Valerio Viola (BSc in Biomedical Engineering) for their assistance in data analysis.

Conflicts of Interest

The authors declare no conflict of interest.

Symbols

aConstant in Equation (7)
a0Constant in Equation (5)
a’0Constant in Equation (8)
a’’0Constant in Equation (9)
DGlobe diameter, mm
DLEDuration of limit exposure, min
Dlimloss,95Maximum allowable exposure time for water loss, 95% of the working population, min
Dlim,treMaximum allowable exposure time for heat storage, min
hc,gConvective heat transfer coefficient of the globe W m−2 K−1
IclBasic clothing insulation, m2 K W−1 or clo
kfAir thermal conductivity, W m−1 K−1
m Coefficient in in Equations (5), (8) and (9), 1
nCoefficient in Equation (9), 1
NuNusselt’s number, 1
PMVPredicted mean vote
PHSPredicted heat strain
ReReynolds’ number, 1
RHRelative humidity, %
taAir temperature, °C
tgGlobe temperature, °C
tsMean surface temperature of the enclosure, °C
trMean radiant temperature, °C
vaAir velocity, m s−1
WBGTWet bulb globe temperature, °C
ε Globe emissivity, 1
νCinematic viscosity or air, m2 s−1
σ Stefan–Boltzmann constant, W m−2 K−4

References

  1. Simberloff, D. The Balance of Nature—Evolution of a Panchreston. PLoS Biol. 2014, 12, e1001963. [Google Scholar] [CrossRef] [PubMed] [Green Version]
  2. United Nations Framework Convention on Climate Change (UNFCCC). The Paris Agreement. 2016. Available online: https://unfccc.int/sites/default/files/resource/parisagreement_publication.pdf (accessed on 11 May 2021).
  3. Patz, J.A.; Campbell-Lendrum, D.; Holloway, T.; Foley, J.A. Impact of regional climate change on human health. Nature 2005, 438, 310–317. [Google Scholar] [CrossRef]
  4. Watts, N.; Amann, M.; Arnell, N.; Ayeb-Karlsson, S.; Belesova, K.; Boykoff, M.; Byass, P.; Cai, W.; Campbell-Lendrum, D.; Capstick, S.; et al. The 2019 report of The Lancet Countdown on health and climate change: Ensuring that the health of a child born today is not defined by a changing climate. Lancet 2019, 394, 1836–1878. [Google Scholar] [CrossRef] [Green Version]
  5. Global Alliance for Buildings and Construction; International Energy Agency; United Nations Environment Programme. 2019 Global Status Report for Buildings and Construction: Towards a Zero-Emission, Efficient and Resilient Buildings, and Construction Sector; Global Alliance for Buildings and Construction: Paris, France, 2019. [Google Scholar]
  6. European Parliament. Council Directive of 16 December 2002 on the energy performance of buildings (2002/91/EC). Off. J. Eur. Communities 2003, 46, 65–71. [Google Scholar]
  7. European Parliament. Directive 2018/844/EU of The European Parliament and of the Council of 30 May 2018 amending Directive 2010/31/EU on the energy performance of buildings and Directive 2012/27/EU on energy efficiency. Off. J. Eur. Communities 2018, 61, 75–91. [Google Scholar]
  8. European Committee for Standardization. EN 15251. Indoor Environmental Input Parameters for Design and Assessment of Energy Performance of Buildings Addressing Indoor Air Quality, Thermal Environment, Lighting and Acoustics; European Committee for Standardization: Brussels, Belgium, 2007. [Google Scholar]
  9. European Committee for Standardization. EN 16798-1. Energy Performance of Buildings—Ventilation for Buildings—Part 1: Indoor Environmental Input Parameters for Design and Assessment of Energy Performance of Buildings Addressing Indoor Air Quality, Thermal Environment, Lighting and Acoustics—Module M1-6; European Committee for Standardization: Brussels, Belgium, 2019. [Google Scholar]
  10. European Committee for Standardization. EN 16798-2. Energy Performance of Buildings—Ventilation for Buildings—Part 2: Interpretation of the Requirements in EN 16798—Indoor Environmental Input Parameters for Design and Assessment of Energy Performance of Buildings Addressing Indoor Air Quality, Thermal Environment, Lighting and Acoustics (Module M1-6); European Committee for Standardization: Brussels, Belgium, 2019. [Google Scholar]
  11. International Standardization Organization. ISO 17772-1. Energy Performance of Buildings—Indoor Environmental Quality—Part 1: Indoor Environmental Input Parameters for the Design and Assessment of Energy Performance of Buildings; International Standardization Organization: Geneva, Switzerland, 2017. [Google Scholar]
  12. Attaianese, E.; Duca, G. The human component of sustainability: A study for assessing human performances of energy efficient construction blocks. Work 2012, 41, 2141–2146. [Google Scholar] [CrossRef] [Green Version]
  13. Andersson, J.; Boerstra, A.; Clements-Croome, D.; Fitzner, K.; Hanssen, S.O. Indoor Climates and Productivity in Offices—REHVA Guidebook No. 6; REHVA: Brussels, Belgium, 2006. [Google Scholar]
  14. Mahmoud, S.; Zayed, T.; Fahmy, M. Development of sustainability assessment tool for existing buildings. Sustain. Cities Soc. 2019, 44, 99–119. [Google Scholar] [CrossRef]
  15. Olesen, B.W. The philosophy behind EN 15251: Indoor environmental criteria for design and calculation of energy performance of buildings. Energ. Build. 2007, 39, 740–749. [Google Scholar] [CrossRef]
  16. d’Ambrosio Alfano, F.R.; Olesen, B.W.; Palella, B.I.; Riccio, G. Thermal comfort: Design and assessment of energy saving. Energ. Build. 2014, 81, 326–336. [Google Scholar] [CrossRef]
  17. ASHRAE. Thermal comfort. In ASHRAE Fundamentals; American Society of Heating, Refrigerating and Air Conditioning Engineers: Atlanta, GA, USA, 2017. [Google Scholar]
  18. Fanger, P.O. Thermal Comfort; Danish Technical Press: Copenhagen, Denmark, 1970. [Google Scholar]
  19. Parsons, K.C. Human Thermal Environments: The Effects of Hot, Moderate, and Cold Environments on Human Health, Comfort and Performance, 3rd ed.; Taylor and Francis: London, UK, 2014. [Google Scholar]
  20. ISO. ISO 7726. Ergonomics of the Thermal Environment—Instruments for Measuring Physical Quantities; International Standardization Organization: Geneva, Switzerland, 1998. [Google Scholar]
  21. d’Ambrosio Alfano, F.R.; Dell’Isola, M.; Palella, B.I.; Riccio, G.; Russi, A. On the measurement of the mean radiant temperature and its influence on the indoor thermal environment assessment. Build. Environ. 2013, 63, 79–88. [Google Scholar] [CrossRef]
  22. Vernon, H.M. The measurement of radiant heat in relation to human comfort. J. Ind. Hyg. 1932, 14, 95–111. [Google Scholar]
  23. ISO. ISO 7243. Ergonomics of the Thermal Environment—Assessment of Heat Stress using the WBGT (Wet Bulb Globe Temperature) Index; International Standardization Organization: Geneva, Switzerland, 2017. [Google Scholar]
  24. ACGIH. Threshold Limit Values for Chemical Substances and Physical Agents and Biological Exposures Indices; American Conference of Governmental Industrial Hygienists: Cincinnati, OH, USA, 2019. [Google Scholar]
  25. d’Ambrosio Alfano, F.R.; Dell’Isola, M.; Ficco, G.; Palella, B.I.; Riccio, G. On the Measurement of the Mean Radiant Temperature by means of Globes: An Experimental Investigation under Black Enclosure Conditions. Build. Environ. 2021, 193, 107655. [Google Scholar] [CrossRef]
  26. ISO. ISO 7730. Ergonomics of the Thermal Environment—Analytical Determination and Interpretation of Thermal Comfort using Calculation of the PMV and PPD Indices and Local Thermal Comfort; International Standardization Organization: Geneva, Switzerland, 2005. [Google Scholar]
  27. ANSI. ASHRAE 55. Thermal Environmental Conditions for Human Occupancy; American Society of Heating, Refrigerating, and Air-Conditioning Engineers, Inc.: Atlanta, GA, USA, 2021. [Google Scholar]
  28. Oliveira, A.V.M.; Raimundo, A.M.; Gaspar, A.R.; Quintela, D.A. Globe Temperature and Its Measurement: Requirements and Limitations. Ann. Work Expo. Health 2019, 63, 743–758. [Google Scholar] [CrossRef] [PubMed]
  29. Guo, H.; Aviv, D.; Loyola, M.; Teitelbaum, E.; Houchois, N.; Meggers, F. On the understanding of the mean radiant temperature within both the indoor and outdoor environment, a critical review. Renew. Sust. Energ. Rev. 2020, 117, 109207. [Google Scholar] [CrossRef]
  30. Guo, H.; Ferrara, M.; Coleman, J.; Loyola, M.; Meggers, F. Simulation and measurement of air temperatures and mean radiant temperatures in a radiantly heated indoor space. Energy 2020, 193, 116369. [Google Scholar] [CrossRef]
  31. Humphreys, M.A. The optimum diameter for a globe thermometer for use indoors. Ann. Occup. Hyg. 1977, 20, 135–140. [Google Scholar]
  32. Fountain, M. Instrumentation for Thermal Comfort Measurements: The Globe Thermometer; UC Berkeley—Center for the Built Environment: Berkeley, CA, USA, 1987; Available online: https://escholarship.org/uc/item/1qx8c7sm (accessed on 9 May 2021).
  33. Fontana, L. Experimental study on the globe thermometer behaviour in conditions of asymmetry of the radiant temperature. Appl. Therm. Eng. 2010, 30, 732–740. [Google Scholar] [CrossRef] [Green Version]
  34. Wang, S.; Li, Y. Suitability of acrylic and copper globe thermometers for diurnal outdoor settings. Build. Environ. 2015, 89, 279–294. [Google Scholar] [CrossRef]
  35. de Sampaio, P.C.; Terezo, R.F.; Júnior, I.V.; da Silva, L.M.; Borges, L.K. Hysteresis and Thermal Inertia of Spheres of Alternative Materials for Black Globe Thermometers. Eng. Agríc. 2019, 39, 567–572. [Google Scholar] [CrossRef]
  36. Obando Vega, F.A.; Montoya Rìos, A.P.; Osorio Saraz, J.A.; Vargas Quiroz, L.G.; Damasceno, F.A. Assessment of black globe thermometers employing various sensors and alternative materials. Agr. For. Meteorol. 2020, 284, 107891. [Google Scholar] [CrossRef]
  37. McIntyre, D.A. Indoor Climate; Applied Science Publisher Ltd.: London, UK, 1980. [Google Scholar]
  38. Quintela, D.A.; Oliveira, A.V.M.; Cardoso, D. Assessment of the performance of globe thermometers under different environmental conditions. In Occupational Safety and Hygiene II; Arezes, P.M., Baptista, J.S., Barroso, M.P., Carneiro, P., Cordeiro, P., Costa, N., Melo, R.B., et al., Eds.; CRC Press: London, UK, 2014; pp. 523–528. [Google Scholar]
  39. Halawa, E.E.H. Operative Temperature Measurement and Control. Master’s Thesis, School of Manufacturing and Mechanical Engineering, University of South Australia, Adelaide, Australia, 1994. [Google Scholar]
  40. Bernard, T.E.; Barrow, A. Empirical Approach to Outdoor WBGT from Meteorological Data and Performance of Two Different Instrument Designs. Ind. Health 2013, 51, 79–85. [Google Scholar] [CrossRef] [PubMed] [Green Version]
  41. d’Ambrosio Alfano, F.R.; Malchaire, J.; Palella, B.I.; Riccio, G. The WBGT index revisited after 60 years of use. Ann. Occup. Hyg. 2014, 58, 955–970. [Google Scholar] [CrossRef] [Green Version]
  42. Vargas-Salgado, C.; Chiñas-Palacios, C.; Aguila-Leónc, J.; Alfonso-Solar, D. Measurement of the black globe temperature to estimate the MRT and WBGT indices using a smaller diameter globe than a standardized one: Experimental analysis. In Proceedings of the 5th CARPE Conference, Valencia, Spain, 23–25 October 2019; pp. 201–207. [Google Scholar] [CrossRef]
  43. Thorsson, S.; Lindberg, F.; Eliasson, I.; Holmer, B. Different methods for estimating the mean radiant temperature in an outdoor urban setting. Int. J. Climatol. 2007, 27, 1983–1993. [Google Scholar] [CrossRef]
  44. Tan, N.H.; Wong, S.; Jusuf, S.K. Outdoor mean radiant temperature estimation in the tropical urban environment. Build. Environ. 2013, 64, 118–129. [Google Scholar] [CrossRef]
  45. Teitelbaum, E.; Rysanek, A.; Pantelic, J.; Aviv, D.; Obelz, S.; Buff, A.; Luo, Y.; Sheppard, D.; Meggers, F. Revisiting radiant cooling: Condensation-free heat rejection using infrared-transparent enclosures of chilled panels. Archit. Sci. Rev. 2019, 62, 152–159. [Google Scholar] [CrossRef]
  46. Guo, H.; Teitelbaum, E.; Houchois, N.; Bozlar, M.; Meggers, F. Revisiting the use of globe thermometers to estimate radiant temperature in studies of heating and ventilation. Energ. Build. 2018, 180, 83–94. [Google Scholar] [CrossRef]
  47. Manavvi, S.; Rajasekar, E. Estimating outdoor mean radiant temperature in a humid subtropical climate. Build. Environ. 2020, 171, 106658. [Google Scholar] [CrossRef]
  48. Höppe, P. A new procedure to determine the mean radiant temperature outdoors. Wetter unt Leben 1992, 44, 147–151. [Google Scholar]
  49. Kàntor, N.; Unger, J. The most problematic variable in the course of human biometeorological comfort assessment—The mean radiant temperature. Cent. Eur. J. Geosci. 2011, 3, 90–100. [Google Scholar] [CrossRef] [Green Version]
  50. Lin, T.-P.; Matzarakis, A. Estimation of outdoor mean radiant temperature by field experiment and modelling for human biometeorology use. In Proceedings of the 11th Annual Meeting of the European Meteorological Society, Berlin, Germany, 19–22 September 2011. [Google Scholar]
  51. Chen, Y.G.; Lin, T.P.; Matzarakis, A. Comparison of mean radiant temperature from field experiment and modelling: A case study in Freiburg, Germany. Theor. Appl. Climatol. 2014, 118, 535–551. [Google Scholar] [CrossRef]
  52. Teitelbaum, E.; Chen, K.W.; Meggers, F.; Guo, H.; Houchois, N.; Pantelic, J.; Rysanek, A. Globe thermometer free convection error potentials. Sci. Rep. 2020, 10, 2652. [Google Scholar] [CrossRef] [PubMed]
  53. ISO. ISO 7933. Ergonomics of the Thermal Environment—Analytical Determination and Interpretation of Heat Stress using Calculation of the Predicted Heat Strain; International Organization for Standardization: Geneva, Switzerland, 2004. [Google Scholar]
  54. Höppe, P. The physiological equivalent temperature—A universal index for the biometeorological assessment of the thermal environment. Int. J. Biometeorol. 1999, 43, 71–75. [Google Scholar] [CrossRef] [PubMed]
  55. Matzarakis, A.; Mayer, H.; Iziomon, M.G. Applications of a universal thermal index: Physiological equivalent temperature. Int. J. Biometeorol. 1999, 43, 76–84. [Google Scholar] [CrossRef]
  56. Steiger, H.; Matzarakis, A. Accuracy of Mean Radiant Temperature Derived from Active and Passive Radiometry. Atmosphere 2020, 11, 805. [Google Scholar] [CrossRef]
  57. Jendritzky, G.; de Dear, R.; Havenith, G. UTCI-Why another thermal index? Int. J. Biometeorol. 2012, 56, 421–428. [Google Scholar] [CrossRef] [PubMed] [Green Version]
  58. Havenith, G.; Fiala, D. Thermal Indices and Thermophysiological Modeling for Heat Stress. Compr. Physiol. 2016, 6, 255–302. [Google Scholar] [CrossRef]
  59. Fiala, D.; Lomas, K.J.; Stohrer, M. A computer model of human thermoregulation for a wide range of environmental conditions: The passive system. J. Appl. Physiol. 1999, 87, 1957–1972. [Google Scholar] [CrossRef]
  60. Kobayashi, Y.; Tanabe, S. Development of JOS-2 human thermoregulation model with detailed vascular system. Build. Environ. 2013, 66, 1–10. [Google Scholar] [CrossRef]
  61. Houchois, N.; Teitelbaum, E.; Chen, K.W.; Rucewicz, S.; Meggers, F. The SMART sensor: Fully characterizing radiant heat transfer in the built environment. J. Phys. Conf. Ser. 2019, 1343, 012073. [Google Scholar] [CrossRef]
  62. Park, H.; Rhee, S. IoT-Based Smart Building Environment Service for Occupants’ Thermal Comfort. J. Sens. 2018, 1757409, 1757409. [Google Scholar] [CrossRef]
  63. Izhar, U.H.; Wang, X.; Xu, W.; Tavakkoli, H.; Yuen, Z.; Shan, X.; Lee, Y.H. Integrated Predicted Mean Vote Sensing System Using MEMS Multi-Sensors for Smart HVAC Systems. IEEE Sens. J. 2021, 21, 8400–8410. [Google Scholar] [CrossRef]
  64. Tomat, V.; Ramallo-González, A.P.; Skarmeta Gómez, A.F. A Comprehensive Survey about Thermal Comfort under the IoT Paradigm: Is Crowdsensing the New Horizon? Sensors 2020, 20, 4647. [Google Scholar] [CrossRef]
  65. Kreith, F.; Mangli, R.M.; Bohn, M.S. Principles of Heat Transfer; Cengage Learning Inc.: Stamford, CT, USA, 2011. [Google Scholar]
  66. SigmaPlot. Systat Software; SigmaPlot: San Jose, CA, USA, 2012. [Google Scholar]
  67. ISO. ISO 8996. Ergonomics of the Thermal Environment—Determination of Metabolic Rate; International Standardization Organization: Geneva, Switzerland, 2004. [Google Scholar]
  68. ISO. ISO 9920. Ergonomics of the Thermal Environment—Estimation of Thermal Insulation and Water Vapour Resistance of a Clothing Ensemble; International Standardization Organization: Geneva, Switzerland, 2007. [Google Scholar]
  69. d’Ambrosio Alfano, F.R.; Palella, B.I.; Riccio, G. Notes on the implementation of the IREQ model for the assessment of extreme cold environments. Ergonomics 2013, 56, 707–724. [Google Scholar] [CrossRef] [PubMed]
  70. d’Ambrosio Alfano, F.R.; Palella, B.I.; Riccio, G.; Toftum, J. Fifty years of Fanger’s equation: Is there anything to discover yet? Int. J. Ind. Ergonom. 2018, 66, 157–160. [Google Scholar] [CrossRef]
  71. d’Ambrosio Alfano, F.R.; Olesen, B.W.; Palella, B.I.; Pepe, D.; Riccio, G. Fifty years of PMV model: Reliability, implementation, and design of software for its calculation. Atmosphere 2020, 11, 49. [Google Scholar] [CrossRef] [Green Version]
  72. d’Ambrosio Alfano, F.R.; Palella, B.I.; Riccio, G. The Role of Measurement Accuracy on the Thermal Environment Assessment by means of PMV Index. Build. Environ. 2011, 46, 1361–1369. [Google Scholar] [CrossRef]
  73. d’Ambrosio Alfano, F.R.; Palella, B.I.; Riccio, G. The role of Measurement Accuracy on the Heat Stress Assessment according to ISO 7933: 2004. WIT Trans. Biomed. Health 2007, 11, 115–124. [Google Scholar] [CrossRef] [Green Version]
Figure 1. Experimental apparatus provided with fan (F), air inlets (AI1, AI2, AI3), the globe (S) and sensors for the measurement of air temperature, air velocity and heat transfer fluid temperatures (not in scale). Legend: Ti,lp: lower plate inlet thermocouple; To,lp: lower plate outlet thermocouple; Ti,lc: lower cylinder inlet thermocouple; To,lc: lower cylinder outlet thermocouple; Ti,uc: upper cylinder inlet thermocouple; To,uc: upper cylinder outlet thermocouple; Ti,up: upper plate inlet thermocouple; To,up: upper plate outlet thermocouple; TAI,2: inlet air temperature thermocouple.
Atmosphere 12 00621 g001
Figure 2. The experimental apparatus.
Atmosphere 12 00621 g002
Figure 3. Error of the predicted mean radiant temperature as a function of the mean enclosure surface temperature.
Atmosphere 12 00621 g003
Figure 4. Measured heat transfer coefficient by convection hc,g as a function of the air velocity.
Atmosphere 12 00621 g004
Figure 5. Comparison between different empirical correlations for the calculation of the heat transfer coefficients by forced convection as a function of the air velocity.
Atmosphere 12 00621 g005
Figure 6. Error of the predicted mean radiant temperature (trts) on the two investigated globes for the different equations for the calculation of hc,g investigated in the present study.
Atmosphere 12 00621 g006
Table 1. Characteristics of the small black globes investigated.
DescriptionGlobe AGlobe B
Globe thickness1.5 mm1.5 mm
Globe diameter38 mm50 mm
Temperature sensor typePt-100Pt-100
Table 2. Measured air temperature gradient between the equatorial diameter of the globe (point S in Figure 1) and the inlet of the enclosure (point AI2 in Figure 1) and predicted differences [25] of air temperature between the top and the bottom of the investigated globes.
Set Point Temperature of the Baths (°C)Vertical Air Temperature Gradient in the Enclosure
(°C cm−1)
Vertical Air Temperature Gradient in the Globe (°C)
D = 38 mmD = 50 mmD = 38 mmD = 50 mm
va = 0.2 m s−1
200.000.010.00.1
300.080.060.20.2
400.150.180.50.6
500.230.240.70.8
600.290.370.91.1
va = 1.1 m s−1
200.000.010.00.0
300.060.050.20.2
400.120.170.40.5
500.200.220.70.7
600.240.300.81.0
Table 3. Summary of the air temperature values for the different set points of air velocity and enclosure surface temperature.
Set Point Temperature of the Baths (°C)D = 38 mmD = 50 mm
va = 0.2 m s−1va = 1.1 m s−1va = 0.2 m s−1va = 1.1 m s−1
2018.718.518.818.6
3022.822.622.622.4
4027.426.221.420.8
5028.627.925.524.9
6031.629.929.426.6
Table 4. Error of the predicted mean radiant temperature (tr − ts) on the two investigated globes as a function of the set point value of the enclosure temperature.
ts
(°C)
D = 38 mmD = 50 mm
va = 0.2 m s−1va = 1.1 m s−1va = 0.2 m s−1va = 1.1 m s−1
200.62.00.81.9
30−3.0−2.3−2.5−2.4
40−5.6−5.3−5.5−5.7
50−9.2−9−7.4−5.5
60−11.4−8.3−8.9−4.4
MEAN−5.7−4.6−4.7−3.2
Table 5. Values for coefficients in Equations (5), (8) and (9).
Equationa0a’0a’’0mnR2Data Set
(5)40.8--0.439-0.950D = 38 mm
(5)30.5--0.455-0.962D = 50 mm
(8)-5.78-0.431-0.906D = 38 mm and D = 50 mm
(9)--1.050.4551.120.941D = 38 mm and D = 50 mm
Table 6. Values for coefficients in Equation (9) from the literature.
a’’0mnRef.Data Set/Experimental Conditions
6.30.60.4[20]No restrictions
7.60.710.4[43]D = 38 mm; grey globe; va = 0.1 ÷ 4.0 m s−1 incoming short-wave radiation 100 ÷ 850 W m−2 (clear summer/autumn days in Göteborg)
1940.1190.4[44]D = 40 mm; grey globe; va = 0.1 ÷ 4.0 m s−1incoming short-wave radiation up to 1300 W/m2 (February–April and August–September in Singapore)
850.930.4[47]Small globe placed on a portable data logger; va = 0.1 ÷ 4.0 m s−1 incoming short-wave radiation up to 950 W m−2 (March, May, and December in Singapore)
Table 7. Effect of the equation used for the calculation of the heat transfer coefficient by convection on the error of the predicted mean radiant temperature (trts) on the two investigated globes.
ts
(°C)
Equation (5)Equation (8)Equation (9)[43]
0.2 m s−11.1 m s−10.2 m s−11.1 m s−10.2 m s−11.1 m s−10.2 m s−11.1 m s−1
D = 38 mm
202.74.32.43.82.64.40.72.9
300.60.90.10.30.71.2−3−1.4
40−0.4−0.7−1.1−1.7−0.6−0.6−5.6−3.7
50−2.4−2.3−2−3.8−1.2−2.2−9.2−6.2
60−0.62.2−2.10−12.3−11.3−4.9
MEAN−0.10.9−0.5−0.30.11.0−5.7−2.7
D = 50 mm
202.13.22.33.32.13.112.8
300.11.80.500−0.4−2.4−1.6
400.3−1.61.3−1.20.1−1.9−5.2−3.2
50−0.30.20.90.9−0.50−7−2.2
60−0.43.71.14.7−0.63.3−8.4−0.3
MEAN0.41.51.21.50.20.8−4.4−0.9
Table 8. PMV values and comfort categories [9,11] calculated based on the measured mean radiant temperature at ta = 22.8 °C; va = 0.2 m s−1; RH = 50%; Icl = 0.5 clo; M = 1.2 met.
trGlobe A
D = 38 mm
Globe B
D = 50 mm
PMVCategoryPMVCategory
tr = ts (reference)−0.33II−0.33II
Equation (3)−0.76IV−0.68III
Equation (5)−0.24II−0.31II
Equation (8)−0.31II−0.25II
Equation (9)−0.21II−0.33II
Table 9. DLEs calculated based on the mean radiant temperature measured with the small globes A and B at ta = 28.4 °C; va = 0.2 m s−1; RH = 50%; Icl = 0.5 clo; M = 2.8 met.
trGlobe A
D = 38 mm
Globe B
D = 50 mm
DLEDlim,treDlim,loss95DLEDlim,treDlim,loss95
tr = ts (reference)297>480297297>480297
Equation (3)388388368368
Equation (5)318318299299
Equation (8)315315305305
Equation (9)307307301301
Publisher’s Note: MDPI stays neutral with regard to jurisdictional claims in published maps and institutional affiliations.

