


1. Introduction
Recent discussions on inequality have focused on increasing global income and wealth inequality between individuals, inequality between countries and inequality among different population groups within a country (Atkinson, Reference Atkinson2015; Pickety, Reference Pickety2014; Stiglitz, Reference Stiglitz2013, Reference Stiglitz2015). Spatial inequality, i.e. inequality over geographic regions has also been receiving some attention (Kanbur and Venables, Reference Kanbur and Venables2005). However, inequality in the financial sector remains less explored.
In this study, we examine financial development at the sub-national level. Our major research questions are: how do we measure the level of financial development at the sub-national level? How unequal is the financial development across the states? Does it vary by the ownership of financial institutions? We examine these in the context of a large country, India. To explore the research questions, our study develops a banking development index at the sub-national level for three different bank groups – public, private and foreign for 25 Indian states covering 1996–2015. For analytical purposes following Arora and Wondemu (Reference Arora and Wondemu2018), we group states into leading and lagging. States with per capita incomes above the national average are leading, whereas those below are lagging (Appendix A).
India is an interesting case to examine as it presents a picture of marked diversity with the sub-national units at different stages of development (Dreze and Sen, Reference Dreze and Sen2013; Frankel, Reference Frankel2005). Although some states (Kerala) have development levels somewhat similar to those of developed countries, others significantly lag.Footnote 1 Since the economic reforms in 1991, regional disparities appear to have increased significantly (Kurian, Reference Kurian2000).
Inequalities have been persistent in the level of financial development across the states. Several policies, especially those targeted at the financial sector, were adopted in the 1960s and 1970s to promote balanced regional development (Narasimham Committee Report, Reference Narasimham1991; RBI, 2008). These included social control and nationalisation of banks in 1969 and 1980, investments in less developed regions, directed lending, insistence of 60% credit–deposit ratios for rural and semi-urban areas and establishment of Regional Rural Banks (RRBs).
Furthermore, financial development is crucial for the development of business and private sectors. An International Monetary Fund (IMF) study noted that Indian firms depend significantly on external sources of finance (Oura, Reference Oura2008) and therefore, poor access to banks can limit the sources of finance for business growth in the lagging states.
Our study contributes to the existing literature in several respects. First, our study is at the sub-national level and overcomes some limitations of cross-country/national level studies. In a large diverse country, sub-national picture could be very different from that at the national level. Second, we build unique state level banking development index summarising diverse information on various indicators. This allows comprehensive assessment of the state of financial development in Indian states. Third, we consider three bank groups (public, private and foreign banks) separately and capture competitive effects of different ownership of banks.
Although all banks are important in terms of financial development and their contribution to poverty reduction and economic growth (Levine, Reference Levine1997), differentiation across different bank groups is useful because Indian public banks are guided by national policy priorities, whereas private banks have somewhat more freedom to pursue their own markets. International banks, in contrast, are predominantly located in metropolitan cities and we wanted to examine whether their behaviour is different from domestic banks. Nonetheless, despite these differences all bank groups (including foreign banks with more than 20 branches) should meet priority sector lending targets of 40% of net bank credit (RBI, 2020a).Footnote 2 Lately, the crucial role played by public banks in contributing to financial stability especially in crisis (e.g. 2007–08 global financial crisis) has been well acknowledged (Andrianova, Reference Andrianova2012; Arora, Reference Arora and Gianluigi2017; Panizza, Reference Panizza2012; Yeyati et al., Reference Yeyati, Micco and Panizza2007).Footnote 3 Furthermore, the years covered in our study show different phases of India's economic development since the 1991 reforms. Also, following existing literature (Ayyagari et al., Reference Ayyagari, Beck and Hoseini2020) our index combines both financial depth (captured by credit/GDP ratio) and outreach indicators (proxied by population covered per bank branch). Finally, our study has implications not just for India but also for other similar large emerging economies with sub-national variations in banking development and existing regional inequalities.
Following this Introduction, section 2 briefly presents related literature. Section 3 lays out stylised facts on India's financial sector. Section 4 provides methodology and outlines choice of indicators. Section 5 presents banking development indices for public, private and foreign bank groups and discusses major findings. Finally, in section 6 conclusions and implications are discussed.
2. Literature review
On spatial and geographical inequalities, Kanbur and Venables (Reference Kanbur and Venables2005) note ‘spatial inequality is a dimension of overall inequality, but it has added significance when spatial and regional divisions align with political and ethnic tensions to undermine social and political stability’. Prager and Thisse (Reference Prager and Thisse2012) observe, ‘…while it is true that the importance of proximity to natural resources has declined considerably…this does not mean that distance and location have disappeared from economic life. Quite the contrary, economic geography indicates that new forces, hitherto outweighed by natural factors, are shaping an economic landscape that, with its many barriers and inequalities, is anything but flat’. In the early literature, Robock (Reference Robock1960) had cautioned ‘Increasing attention… is now being paid to the related problem of regional economic disparities within a country’.
Earliest studies for instance, Williamson (Reference Williamson1965) explained that regional disparities rise in the early stages of development and weaken in later stages. Empirically, several studies such as Démurger (Reference Démurger2001) and Kanbur and Zhang (Reference Kanbur and Zhang2005) for China; Esmara (Reference Esmara1975) for Indonesia; Azzoni (Reference Azzoni2001) for Brazil; Bonet (Reference Bonet2006) for Columbia; Yamamoto (Reference Yamamoto2007) and Kim (Reference Kim2009) for the USA have examined regional disparities. These studies have analysed regional disparities using different methodologies, time periods and identified different factors potentially causing disparities. For instance, Kanbur and Zhang (Reference Kanbur and Zhang2005) identify industrial output, degree of decentralisation and degree of openness as the factors responsible for regional disparities in China. Bonet (Reference Bonet2006) argues that poorly designed decentralisation policies led to increase in regional disparities in Columbia. Institutional factors also could lead to increase in income inequality as Holcombe and Boudreaux (Reference Holcombe and Boudreaux2016) concluded in their study on market institutions. Kim (Reference Kim2017) assigned divergence in legal and political institutions in explaining differences in the level of economic development in Virginia and Massachusetts in the USA.
Similar to large countries, even small countries can have significant regional inequalities as several papers in Felsenstein and Portnov (Reference Felsenstein and Portnov2005) argued. Within the United Kingdom, for example, significant regional variations exist with a clear North-South divergence visible. Such disparities, whether in large or small countries, can concentrate poverty in certain regions, skew intra-national migration patterns, create the grounds for resource-based and inequality-based conflicts and militancy and pose threats to national security in general. In the context of Sustainable Development Goals (SDGs), eliminating extreme poverty and hunger, reducing other forms of poverty and promoting inclusive and sustainable human settlements are national policy priorities (SDGs 5 and 10). Not much literature, however, exists on the role of financial sector in escalating or reducing regional disparities.
Theoretically, well-developed financial systems can promote economic growth, remove financing constraints for firms, reduce poverty and provide new opportunities (Jalilian and Kirkpatrick, Reference Jalilian and Kirkpatrick2005; Levine, Reference Levine1997). Less developed financial systems, on the contrary, lead to entrenching of inequality, loss of opportunities to the poor, less investment in enterprise growth and human capital development (Arora, Reference Arora2012; Claessens and Perotti, Reference Claessens and Perotti2007). Economic history suggests that due to path dependence and long-term nature of institutional evolution, in many former colonies, the present-day institutions may still be affected by the colonial and extractive institutional architecture notwithstanding several decades of policy interventions after Independence (Acemoglu and Robinson, Reference Acemoglu and Robinson2012; Greif, Reference Greif2006).
Empirically, among the few studies Peng et al. (Reference Peng, He, Li, Yi and Groenewold2010) examined regional finance as the cause of regional disparities in China. Zou and He (Reference Zou and He2018) employing data on 282 Chinese cities investigated the relationship between economic disparity and financial sector. Sharma (Reference Sharma2008) investigated whether regional disparities in India are due to immobility of capital. Findings show that high returns to capital exist in low industrial districts. Regional inequality, therefore, could be reduced if financial sector is developed further and capital is made more mobile. Rajesh Raj et al. (Reference Rajesh Raj, Sen and Kathuria2014) explore whether inequalities in banking services explain disparities in firm start-ups in the informal sector in India. Results show that although availability of local bank branches had a positive impact on informal firms, the effect was more pronounced for the large firms within the sector. Kumar (Reference Kumar2013) in the Indian context showed branch network having a positive impact on financial inclusion. Similarly, Zeng (Reference Zeng2016) examined the impact of capital immobility on regional incomes and inequality. Data (from New World Wealth 2018) on world's top 15 wealthiest cities (including New York, London, Paris and Mumbai) also show that almost all of them are financial centres indicating that wealth creation and financial services may be spatially associated (due to agglomeration economies). Younas (Reference Younas2009), although not focused on within country inequality, notes that institutional factors such as strength of the legal system, investment risk and democratic accountability impacts capital mobility in developing countries.
Above indicates that unequal financial sector has profound implications for the rest of the economy and an inclusive financial development may provide more opportunities and reduce regional inequalities. Improved access to financial services and products for the households also promotes financial development, contributes to economic growth, reduces income inequality, poverty and has positive effect on household incomes (Beck & De La Torre, Reference Beck and de la Torre2007; Demirguc-Kunt et al., Reference Demirguc-Kunt, Klapper, Ansar and Jagati2017). Recent years have witnessed considerable emphasis on financial inclusion by several developing and developed economies. Yet, not much is known on the level of financial development at the sub-national level.
In the Indian context, several studies examined differences in states' economic performance in pre-reform and post-reform periods and observed a widening of regional disparities especially since the 1990s.Footnote 4 Joumard et al. (Reference Joumard, Morgavi and Bourrousse2017) also observed increasing inter-state and rural-urban inequalities. Poverty in all dimensions is also higher in the rural areas as the UNDP Multidimensional Poverty Index noted that 69% of rural poor households are multidimensionally poor compared to 31% in the urban areas (OPHI, 2017). Chancel and Piketty (Reference Chancel and Piketty2017) observed that Indian income inequality (marked decline in the early 1940s and strong reduction in top income shares in 1950–1970s) registered a significant increase from 1980s onwards. These trends are consistent with growth episodes in other emerging economies such as Brazil and China, both of which experienced worsening regional inequalities as their economies began to grow after the mid-1990s (Anand et al., Reference Anand, Fennell, Comim, Anand, Fennell and Comim2021).
Disparities also exist in the availability of infrastructure facilities and human development. Per capita electricity consumption, for instance, was only 133.6 kW hours in Bihar, a less developed state compared to 1,799.01 kW hours in Punjab in 2011. Other infrastructure facilities such as road density and teledensity (number of telephone landline connections per 1,000 population) are also low in less developed states compared to more developed and prosperous states. Of course, with the advent of mobile phones, landlines are becoming less important, but it may still indicate some degree of inequality especially concerning enterprises and firms. Among development indicators, infant mortality rates vary from 12 per 1,000 live births (Kerala) to 52 per 1,000 live births (Madhya Pradesh). A composite infrastructure index covering both dimensions – physical infrastructure (electricity consumption, road density and teledensity) and social infrastructure (human development and quality of life indicators) for 2011–12 once again confirms considerable differences across states (Figure 1).Footnote 5
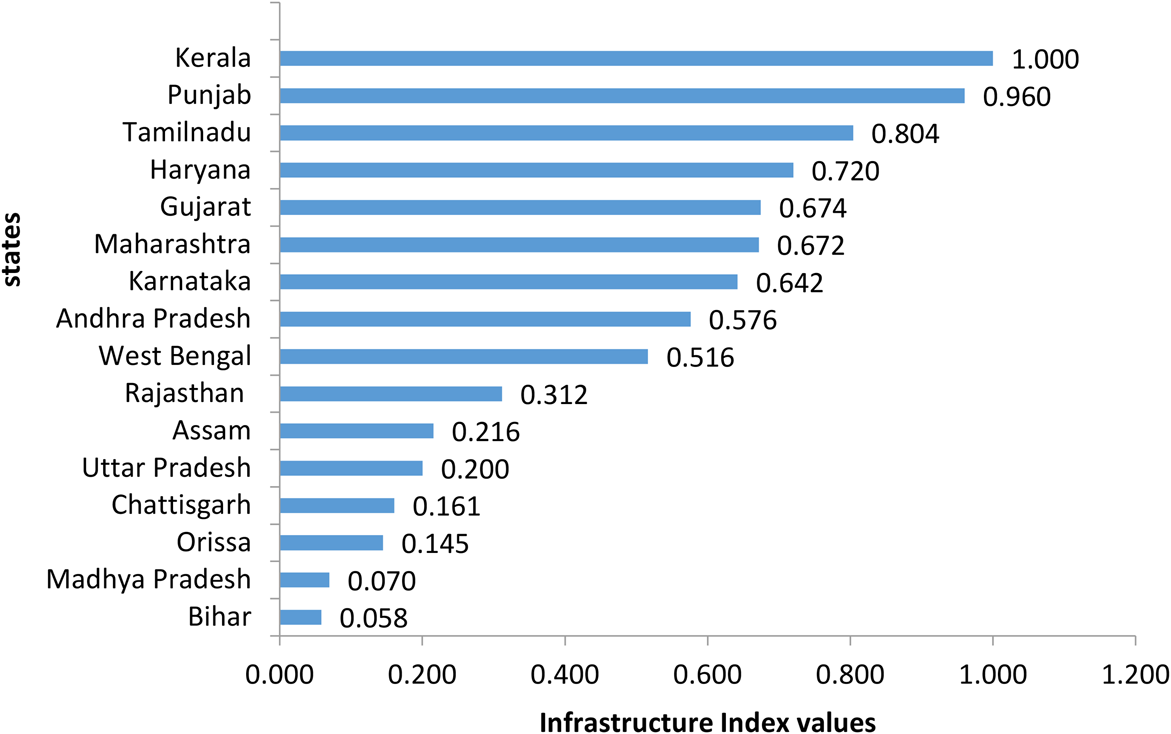
Figure 1. Composite infrastructure index of states.
Another useful index at the sub-national level is Social Progress Index (2017) (SPI) which captures social progress or citizens' experience in three dimensions – basic human needs (includes nutrition, basic medical care, water and sanitation, shelter and personal safety); well-being (includes education, access to information, health care and environmental quality) and opportunity (captures citizens personal rights, personal freedom and choice, inclusion of different groups and access to advanced education). This index covers outcome indicators and also reflects institutional quality at the state level (Nirola and Sahu, Reference Nirola and Sahu2019). In 2017 the index scores ranged from high of 68.09 (Kerala) to a low of 44.89 (Bihar). Overall, it showed that although all states have made headway in terms of social progress over the years, considerable differences still persist. An interesting finding is that the states which have performed well economically have not necessarily performed well in social progress (for instance Maharashtra, Gujarat and Karnataka) and reverse in the states such as Kerala which scored highest (68.09) despite low-economic achievements.
3. Stylised facts on Indian financial sector
Indian financial sector is largely dominated by commercial banks comprising public, private and foreign banks. As of March 2016, there were 27 public banks, 21 private banks, 43 foreign banks and 56 RRBs.Footnote 6 The government continues to maintain more than the statutory minimum shareholding of 51% in all public banks (RBI, 2016).
Besides commercial banks, hosts of other financial intermediaries co-exist e.g. cooperative banks, small payment banks, development banks and non-banking financial companies (NBFC). Total number of NBFCs registered with RBI in March 2016 was 11,682 of which 202 were deposit-taking and 11,480 non-deposit accepting. In 2014–15, NBFC assets (deposit and non-deposit taking)/GDP ratio was only 12.9% compared to 96.4% of banking sector (Arora and Zhang, Reference Arora and Zhang2019). Credit intensity measured by NBFCs credit/GDP ratio was 11.6% in 2019–20 compared to 50.7% of non-food credit banks/GDP ratio (RBI, 2020b). Of total non-deposit accepting NBFCs, 220 are systemically important, i.e. those with asset size greater than Rs 5 billion. Total assets of deposit accepting NBFCs was Rs 2.4 trillion in 2016 forming 14% of total NBFC assets whereas those of systemically important NBFCs were Rs 14.8 trillion. Despite their smaller size compared to banks, NBFCs have played a crucial role in providing financial access to rural, agricultural and small borrowers (Arora and Zhang, Reference Arora and Zhang2019; Mohan and Ray, Reference Mohan and Ray2017). Major factors behind the rise of NBFCs in the recent years include ongoing financial sector reforms allowing entry to new entrants; unmet demand from small and rural borrowers; risk averseness of commercial banks following high prevalence of non-performing assets.
Development banks (almost all government owned), which played a significant role prior to 1990s in India, have been largely closed or merged with their parent institutions in recent years. Total disbursements (mostly private sector) by development banks as proportion of gross fixed capital formation in the manufacturing sector rose from 10% in 1970–71 to 36% in 1990–91 and further to 49% in 2000–01 however, declined sharply to just 6% in 2005–06 (Nayyar, Reference Nayyar2015). Only three development banks (mainly refinancing institutions) still exist – National Bank for Agriculture & Rural Bank, National Housing Bank and Small Industries Development Bank of India. Furthermore, several urban and rural cooperative banks exist, however these are very much localised. In this study we, therefore, focus on commercial banks as they are the major financial intermediaries and are well spread out across the country.
Tables 1–3 show disparities in the Indian banking sector. For analytical brevity, we use the terms leading and lagging regions, where leading have income above the national income average, whereas lagging have income below that threshold (Appendix A). Table 1 reveals disparities in bank branch density across the leading and lagging regions. As there is considerable disparity in the economic development of states, deposits and credit per capita are significantly higher in the leading regions compared to lagging ones (Table 2). Furthermore, almost all bank groups (public, private and foreign) are concentrated in terms of deposit and credit, more in the leading and developed regions (Table 3).
Table 1. Bank branch density in India
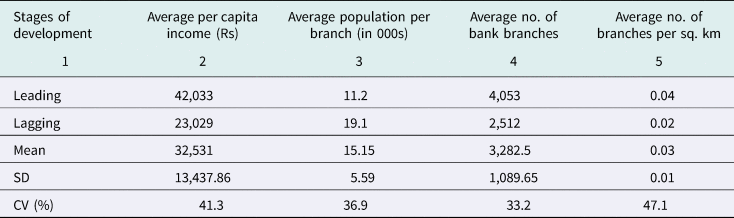
Source: Computed by authors. Derived from Reserve Bank of India Publications and CSO data on state Gross Domestic Product.
Note: Excludes union territories.
Table 2. Bank services across regions
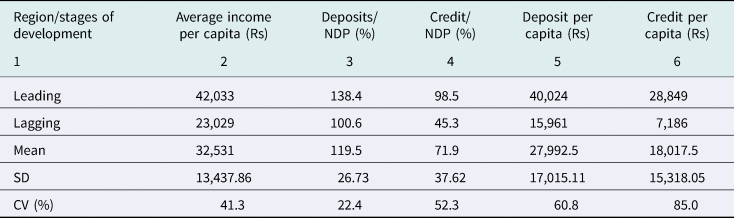
NDP, net domestic product.
Source: Computed by authors. Derived from Reserve Bank of India Publications and CSO data on state Gross Domestic Product.
Note: Excludes union territories.
Table 3. Public, private and foreign provision of bank services across regions
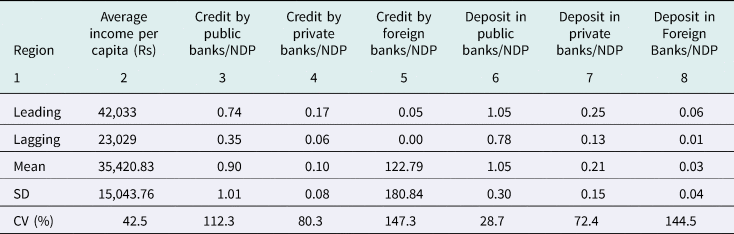
NDP, net domestic product.
Source: Computed by authors. Derived from Reserve Bank of India Publications and CSO data on state Gross Domestic Product.
Note: Excludes union territories.
4. Methodology and data specification
Many studies have used indicators such as M3/GDP (broad money or liquid liabilities) or private credit/GDP to proximate financial development. In recent studies, Arcand et al. (Reference Arcand, Berkes and Panizza2012) use credit/GDP ratio, whereas Dabla-Norris and Srivisal (Reference Dabla-Norris and Srivisal2013) employ private credit/GDP from banks and other financial institutions to investigate impact of macroeconomic volatility. Ang (Reference Ang2010) to represent overall financial sector development considered claims on private sector/GDP; M3/GDP; share of commercial bank assets in the sum of commercial and central bank assets.
Financial development is, however, a multidimensional concept encompassing different dimensions e.g. outreach, size, depth, stability and access to finance (Čihák et al., Reference Čihák, Demirgüç-Kunt, Feyen and Levine2012). Lone or a couple of measures cannot capture the complexity of the financial system (Svirydzenka, Reference Svirydzenka2016). As Creane et al. (Reference Creane, Goyal, Mobarak and Sab2003) observed:
Financial sector development is a multifaceted concept, encompassing not only monetary aggregates and interest rates (or rates of return) but also financial openness, regulation and supervision, technological advances, degree of competition, and institutional capacity such as the strength of creditor rights.
This multidimensionality of financial development is also captured by Svirydzenka (Reference Svirydzenka2016) who defined financial development as:
combination of depth (size and liquidity of markets), access (ability of individuals and companies to access financial services), and efficiency (ability of institutions to provide financial services at low cost and with sustainable revenues, and the level of activity of capital markets).
As single indicator is unable to capture the full extent of financial development, we build composite banking index for 25 states for 1996–2015. Following the literature, we follow similar methodology followed by UNDP in building its human development index and other UNDP indices (Arora, Reference Arora2012). The detailed methodology and choice of indicators are given below.
Methodology
We denote each bank group by Dj where j = 1…J, and therefore, in our case j = 3 (public, private and foreign). Each dimension consists of n number of determinants which we denote by Xi, and i = 1 to n. First, we compute the value Xi for each dimension j as follows:
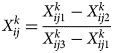 $$X_{ij}^k = \displaystyle{{X_{ij1}^k -X_{ij2}^k } \over {X_{ij3}^k -X_{ij1}^k }}$$
Here, the notations Xkij 1, Xkij 2 and Xij 3, respectively, represent actual (1) observed value, minimum value (2) and maximum value (3) for ith determinant in jth dimension. The minimum and maximum values, termed as ‘goalposts’ (UNDP, 2009), are minimum and maximum values of each variable in different states. Now, we use simple arithmetic average as follows to determine the value for each dimension Dj. We use arithmetic average instead of geometric mean mainly because of several dimensions having values of zeros or close to zero observations in our database particularly for foreign banks. Arithmetic mean takes zeros or very low values into account implying that high values perfectly substitute for low or zero values. In contrast, geometric mean does not proceed with zero or near zero values and values are imperfect substitutes of each other (Svirydzenka, Reference Svirydzenka2016):
 $$D_j = \displaystyle{{\mathop \sum \nolimits_{i = 1}^n \,X_{ij}^k } \over n}$$
Next, we assign equal weights (denoted by αj for dimension j to each dimension). We compute the banking development index for each bank group at the sub-national level as follows:
 $$Banking\,\,sector\,\,Index = \sum\limits_{\,j = 1}^J {\alpha _j} D_j$$
There are number of missing values on both deposits and credit for foreign banks especially in the lagging states.Footnote 7 This clearly indicates that foreign banks are very picky and prefer locating in developed and more prosperous regions, indulge in so-called ‘cream skimming’ and provide finance to selected very profitable firms (Gormley, Reference Gormley2010; Sarma and Prashad, Reference Sarma and Prashad2016; Sharda et al., Reference Sharda, Swamy and Singh2014). They consequently avoid spreading to rural or lagging regions resulting in negligible or no deposit/credit values. We have set the values to zero if no data are available. This is not ideal but in the circumstances with limited data we believe this is a reasonable compromise.
Choice of indicators
Some studies have built financial development indices at the cross-country level and national level. World Economic Forum (2012) used seven dimensions – institutional environment, business environment, financial stability, banking financial services, non-banking financial services, financial markets, financial access and constructed financial development index for 62 countries. Hong Kong SAR scored highest at 5.3 out of 7, whereas Venezuela scored lowest (2.37). India ranked 40 (3.3) out of 62 and slightly ahead of Peru, Turkey and Mexico and behind Slovak Republic and Poland.
At the cross-country level, Arora (Reference Arora2012) built multidimensional financial development index including dimensions – banking development; financial freedom; regulation and supervision and institutional environment. The indicators included M2/GDP, non-performing loans, interest rate spread, domestic private sector credit, value of stocks traded/GDP, number of bank branches and ATMs per 100,000 people, financial freedom from Heritage Foundation, bank capital/assets ratio, credit depth of information index and strength of legal rights index. Svirydzenka (Reference Svirydzenka2016) developed financial development index for 183 countries for 1980 to 2013 capturing depth, access and efficiency dimensions.
At the sub-national level, time series bank group data on many indicators usually employed in cross-country studies are not available. We have come across only one study which has attempted to construct a banking index to measure the outreach of banking services across different states of India. Pal (Reference Pal2009) constructed a banking index for 14 major states combining indicators on access and banking services usage to arrive at the level of banking development. Our index differs from Pal (Reference Pal2009) as it covers 25 states, includes increased number of years and unlike Pal (Reference Pal2009) we build separate indices for public, private and foreign banks.
As we focus on banks and different bank groups, we only consider banking indicators and construct indices for the three bank groups separately (something not done in Pal, Reference Pal2009). At the sub-national level for different bank groups and years, data are only available for credit, deposit and population per bank branch. Following other studies, we, therefore, focus on above three variables (Degryse and Ongena, Reference Degryse and Ongena2005; Jayaratne and Strahan, Reference Jayaratne and Strahan1996). We do not have bank group data on other dimensions for instance, efficiency and stability of the financial system (average staff costs per branch, or non-performing assets at the state level). Nonetheless, our choice of indicators, constrained by data availability, reflects depth and outreach of banking services in different Indian states.
In this study, we have captured to some extent financial development since the initiation of economic reforms covering 1997 east Asian financial crisis, 2001 Millennium and Dot.Com bubble and 2007–08 global financial crisis. However, we do not aim to identify or isolate specific effects of each of those events.
We construct composite indices for different bank groups in 25 states considering three broad indicators – deposits; credit and population per bank branch reflecting financial system's depth and outreach. Credit indicators include per capita bank credit; credit/state output and number of credit accounts per 1,000 people. Deposit indicators are deposits/state output; deposit accounts per capita (number of deposit accounts per 1,000 people) and per capita bank deposit. Although deposits reflect public's trust in the banking system, sensitivity to interest rate, relative liquidity, resource allocation and technological innovation; provision of bank credit too demonstrates various functions performed by the financial system (Levine, Reference Levine1997). Close access to bank branches also matters in credit demand and provision of credit by the banks (Jayaratne and Strahan, Reference Jayaratne and Strahan1996). However, although a higher bank credit/GDP ratio indicates financial sector's depth and improved financial development, yet this focuses only on the size (quantity) of credit regardless of credit quality. Nonetheless, depth and outreach are standard indicators adopted by other studies too (Ayyagari, et al., Reference Ayyagari, Beck and Hoseini2020).
Our data cover the period 1996–2015 and is sourced from annual publications of RBI for banking indicators and Central Statistical Organisation for state output. Data available on credit for each bank group relate to total credit and do not distinguish between public and private credit.
5. Results
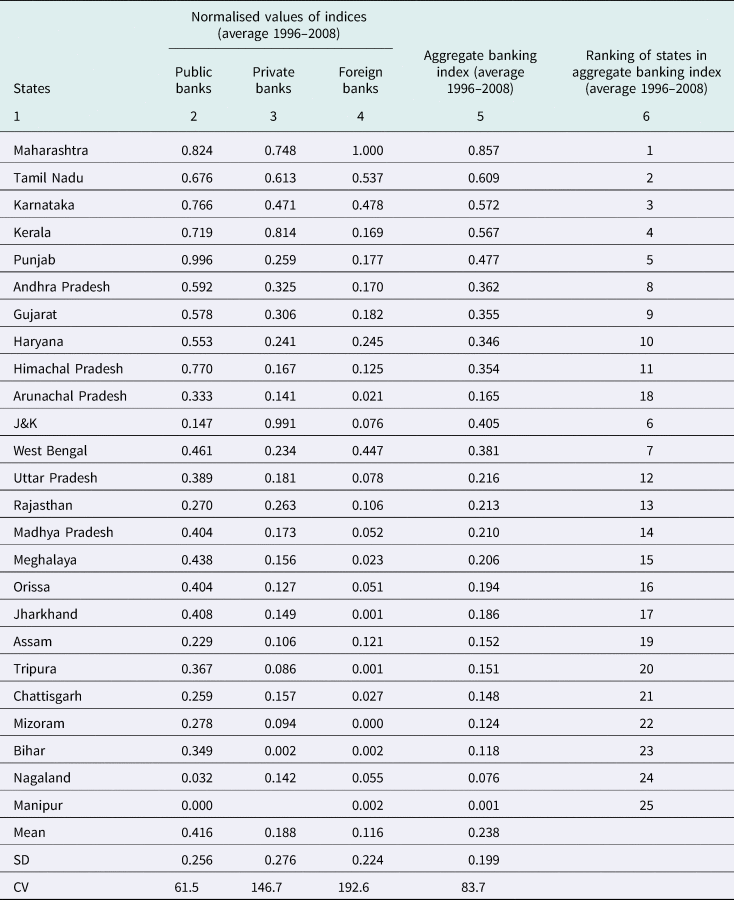
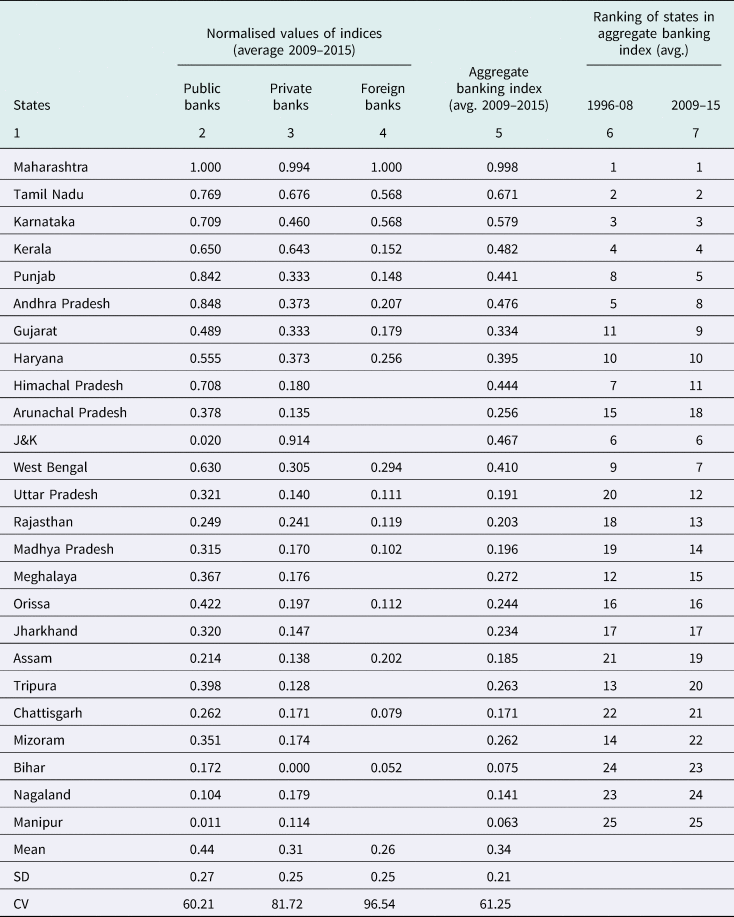
Bank group indices for public, private and foreign banks for each state for 1996–2008 and 2009–2015 are shown in Tables 4 and 5.Footnote 8 As the aggregate banking index shows (column 6, Table 4), Maharashtra (western region) has outperformed all other states followed by Tamilnadu, Karnataka and Kerala (southern region). An interesting observation was high presence of public banks in agriculturally prosperous state, Punjab, higher even than the developed and well-banked state, Maharashtra. A rapid increase in public bank branches followed by manifold increase in deposits and credit also took place in Punjab during 1996–2008 (Kaur and Silony, Reference Kaur and Silony2011). However, the state has not performed well in the post-reform period and its economic growth has decelerated due to several factors such as a lack of technological breakthroughs, decline in public expenditure particularly development expenditure, low human capital development and crisis in the agricultural sector (Shergill and Kaur, Reference Shergill and Kaur2019; Singh and Singh, Reference Singh and Singh2002).
Table 4. Ranking of states in aggregate banking indices (1996–2008)
Source: Computed by authors.
Table 5. Ranking of states in aggregate banking indices (2009–15)
Source: Computed by authors.
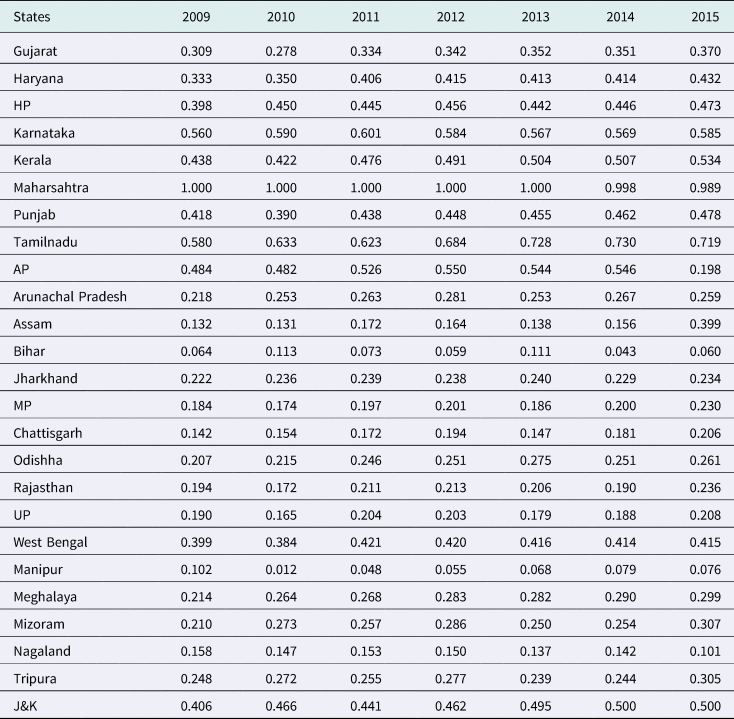
During 2009–15 as well, the top four states continue to be Maharashtra followed by three southern states Tamilnadu, Karnataka and Kerala (Table 5). Although Punjab's overall ranking remained the same as in 1996–2008, in terms of composition the proportion of public banks declined with a slight increase in private banks during this period. Overall, the position of top three and bottom three states in aggregate banking index has remained unchanged reflecting a lack of convergence across the states, lop-sidedness of regional development and persistence in regional disparities (Joumard, et al., Reference Joumard, Morgavi and Bourrousse2017; Kumar, Reference Kumar2013).
An interesting finding is improvement in the ranking of some north-eastern states (Arunachal Pradesh, Tripura, Mizoram and Meghalaya) during 2009–15, although most still fall in the lagging group. Population covered per bank branch (public and private banks) declined steadily in these states showing increased government emphasis on enhancing financial inclusion (Figure 2).
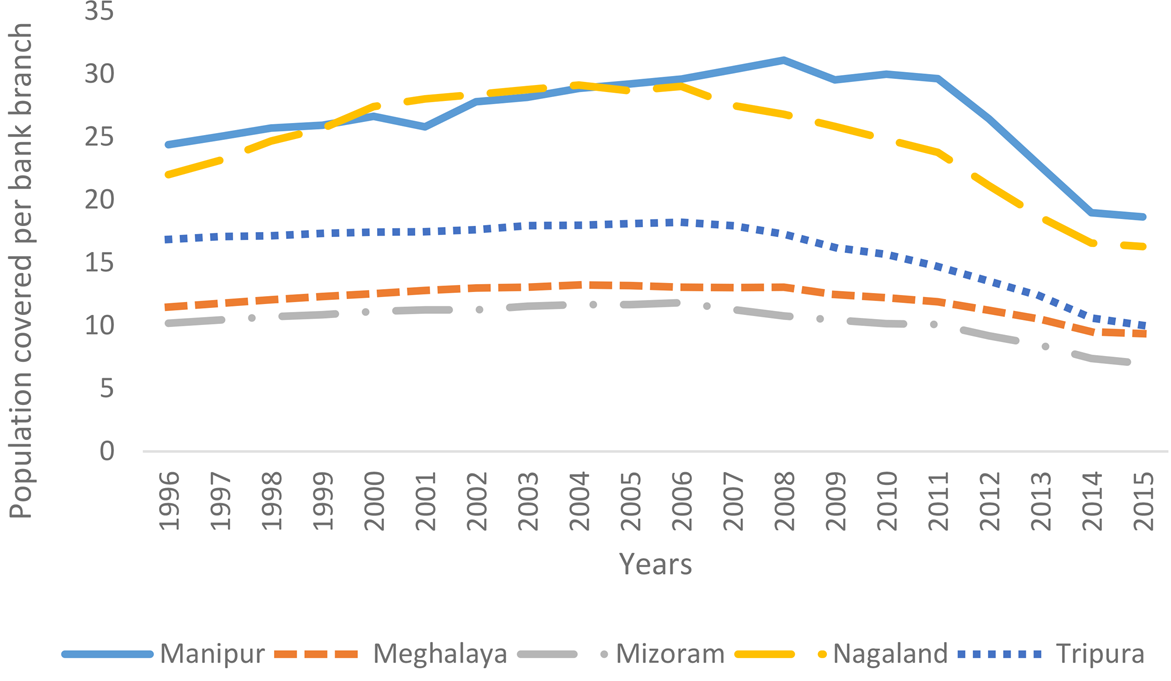
Figure 2. Population covered per bank branch in selected north-Eastern states.
Following Sarma and Pais (Reference Sarma and Pais2011), we grouped states into four categories: those with indices value <0.1, low (0.10–0.24), medium (0.25–0.49) and high banking development values (>0.5). In 1996–2008, only four states had high financial development and at least 14 states fell into low to very low banking development group (Figure 3). There were marginal changes during 2009–15 as states with high financial development declined to three instead of four earlier. The number of states, however, falling in low to very low banking development group declined to 10 as financial development improved in few states reflecting increased governmental focus on financial inclusion in the recent years.
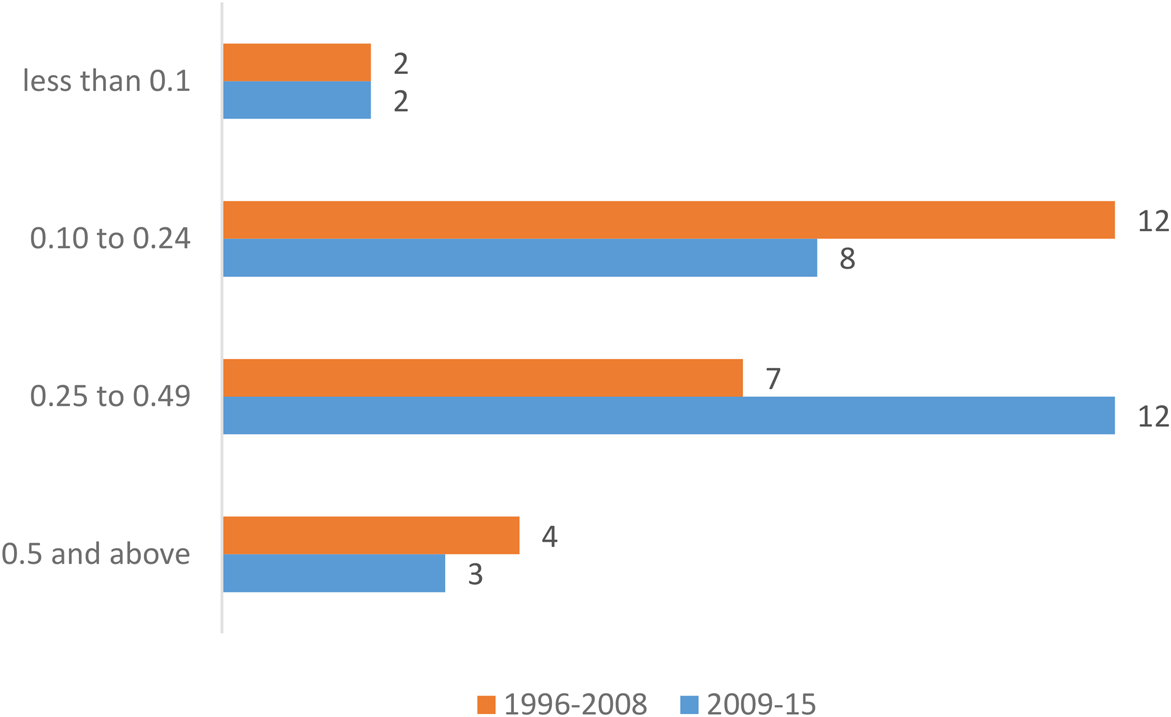
Figure 3. Banking development across the states.
Furthermore, banking presence is far higher in leading states compared to lagging states (Tables 6 and 7). All bank groups, including public banks, are inclined towards leading regions compared to lagging. These trends prevail in both time periods.Footnote 9 This finding is especially surprising considering public banks are viewed as harbingers of economic development and overcome problems of market failure in financial sector and finance socially valuable projects in less developed regions and rural areas (Yeyati et al., Reference Yeyati, Micco and Panizza2005). Prior to 1991, Indian public banks have played a significant role in nationwide banking spread, reduction in rural poverty and increase in rural output (Burgess & Pande, Reference Burgess and Pande2005; Arora, Reference Arora and Gianluigi2017). In the post-reform period after 1991, there is evidence of public banks having reduced their presence in lagging states through rationalisation of bank branches including rural branches and fall in credit (Kohli, Reference Kohli1999; Narayana, Reference Narayana2000; Shete, Reference Shete2002).Footnote 10
Table 6. Breakdown of banking indices – leading and lagging states 1996–2008
Source: Authors' calculations.
Table 7. Breakdown of banking indices – leading and lagging states 2009–15
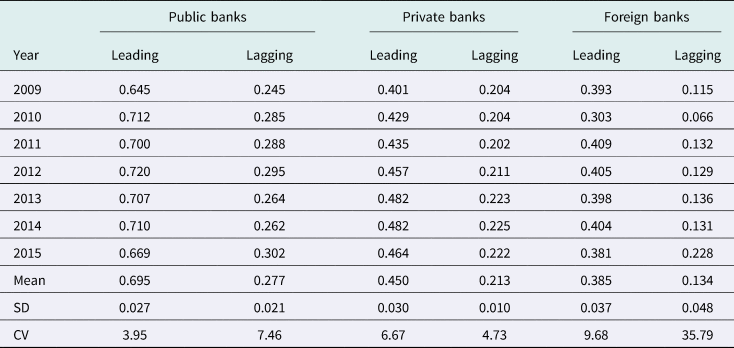
Source: Authors' calculations.
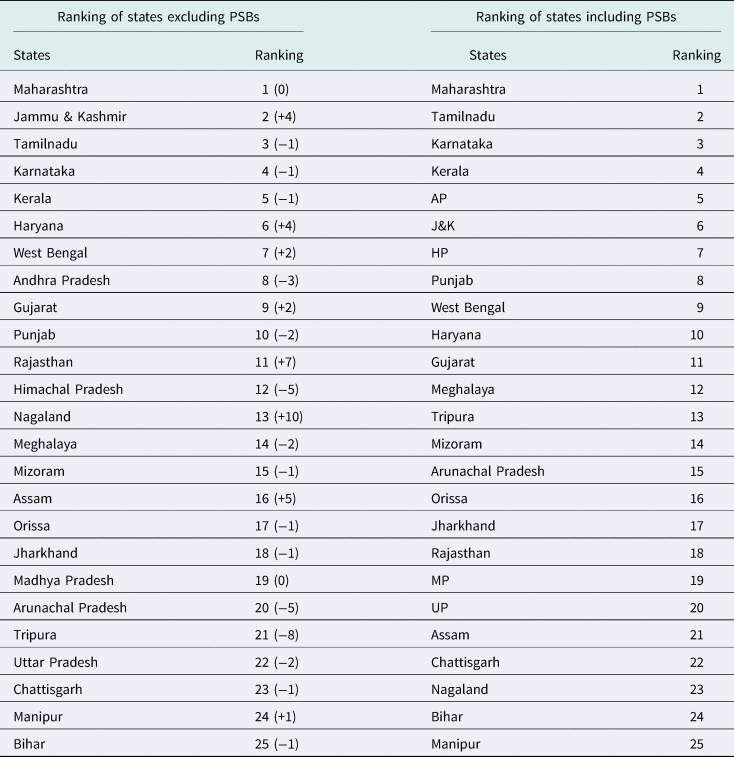
We also examined whether public banks could be crowding out private and foreign banks, and whether that would have an impact on states banking index rankings. The rankings excluding (and including) public banks are shown in Tables 8 and 9.
Table 8. Ranking of states excluding/including public banks (average 1996–2008)

Source: Authors' calculations.
Note: Figures in brackets show slippages (−) and gains (+) compared to rankings including PSBs.
Table 9. Ranking of states excluding/including public banks (average 2009–15)
Source: Authors' calculations.
Note: Figures in brackets show slippages (−) and gains (+) compared to rankings including PSBs.
Some interesting observations from above exercise are: ranking of top end and bottom end states remains nearly the same in both rankings. However, some states – Punjab, Andhra Pradesh, Uttar Pradesh and Tripura – slip in rankings excluding PSBs showing the higher presence of public banks in these states. In contrast, some states (Jammu & Kashmir, Rajasthan, Assam and Nagaland) have jumped in rankings excluding public banks.
As mentioned elsewhere, some economically well-performing states had not performed well in the SPI. For instance, a developed state – Maharashtra, which tops in the banking development index in 2015 – slips to 7th rank in the SPI. Quite the reverse, Mizoram (north-eastern state) ranking 12th in financial development, scores much higher at 4 in social progress rankings. Overall, a positive correlation (0.53) exists between the banking development index and SPI. It may be worth mentioning that our objective is not to examine causality, rather we aim only to measure and understand states financial development (and their differences).
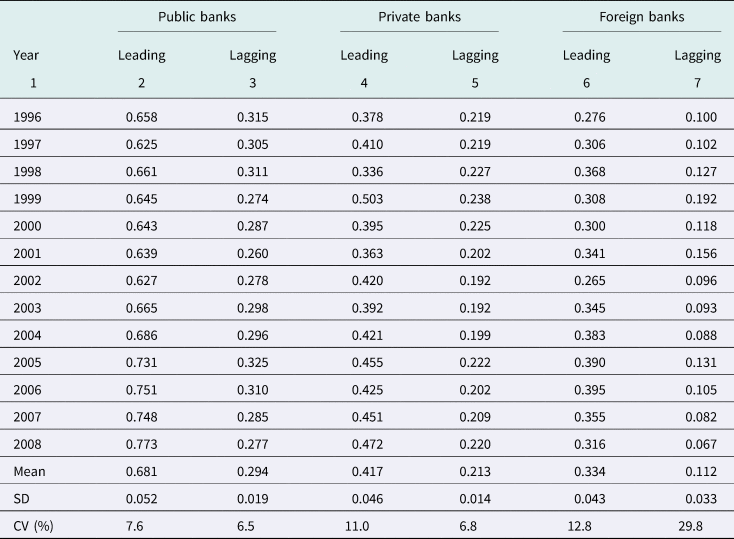
The divergence in banking development between leading and lagging regions has in fact, increased over the years, although it has slightly narrowed from 2014 onwards and is evident across all bank groups (Figures 4a and 4b).
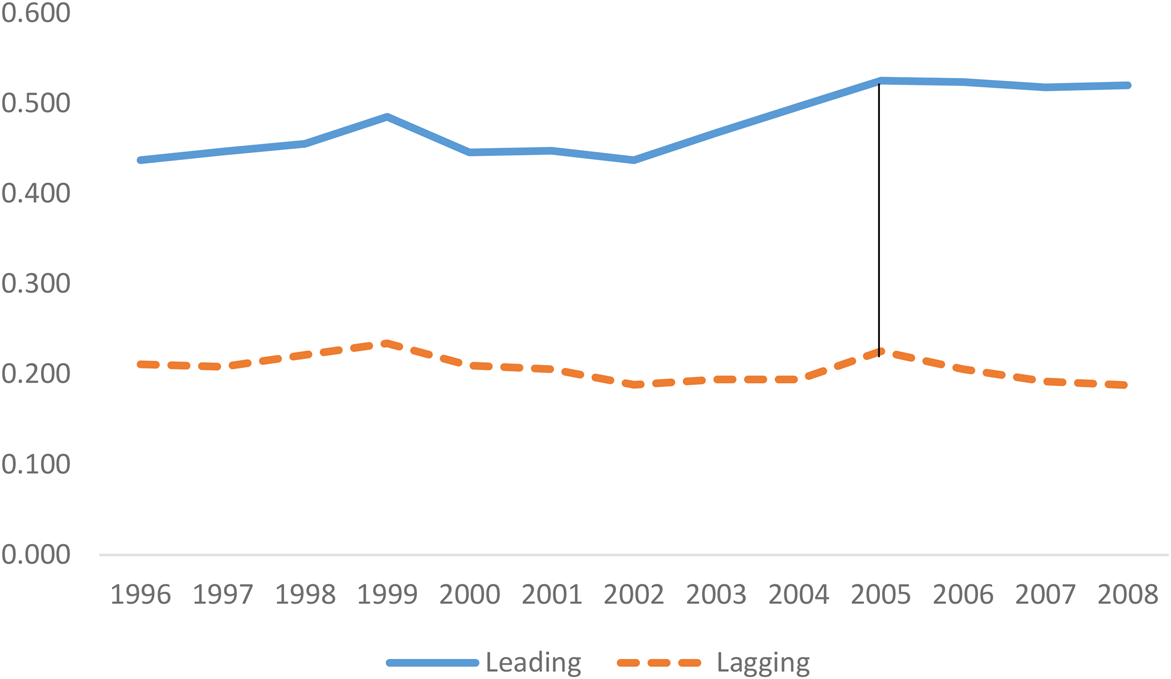
Figure 4a. Banking development in leading and lagging states during 1996–2008.
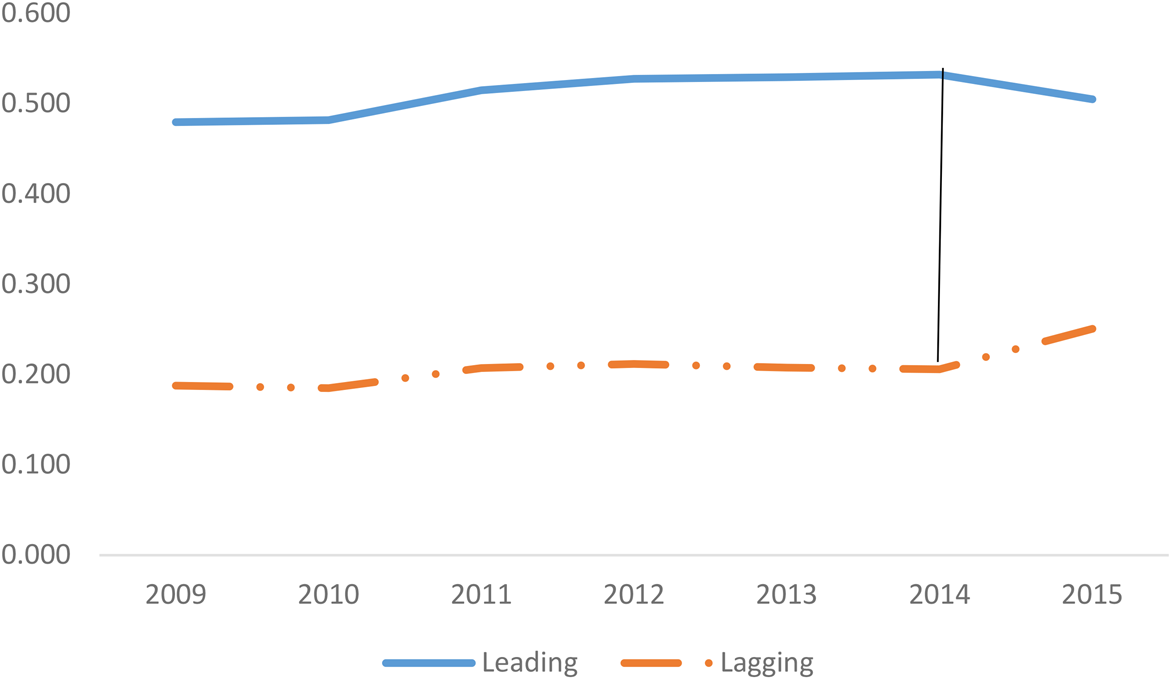
Figure 4b. Banking development in leading and lagging states during 2009–15.
Per capita credit has been much higher to leading regions. Banks also invest in state government securities and including credit indicates total flow of funds to states. Once again, the leading states have retained their position in terms of these investments. Another indicator to examine diverse flow of funds across the states is credit–deposit ratio (C/D ratio). The concept indicates the ‘credit direction of banks and is used as a credit efficiency indicator for analyzing the role of banks in promoting productive sectors and contributing to economic growth’ (RBI, 2003, 2005: 77). In 2008, the C/D ratio ranged between 27.3 in Bihar, a less developed and high poverty state, and 143.3 in Tamilnadu.Footnote 11
Differences in property rights enforcement across states could be another factor which may be influencing banks in their location and lending decisions, as emphasised by De Soto (Reference De Soto2000).Footnote 12 Considerable evidence exists on secure property rights and its positive impact on per capita income, investment opportunities and efficient allocation of resources (Acemoglu et al., Reference Acemoglu, Johnson and Robinson2001; Field, Reference Field2007; Hornbeck, Reference Hornbeck2010). Furthermore, several studies have highlighted that institutional factors such as enforcement of property rights and legal rights play an important role in credit allocation (Kimura, Reference Kimura2011; Rao, Reference Rao2020). For instance, Rao (Reference Rao2020) in her cross-sectional study on judicial presence (judge occupancy) and its impact on credit allocation in 195 Indian districts found that in districts with higher judicial capacity, inefficient credit allocation such as loans to defaulting firms was lower. The study also showed that ‘one percentage point increase in the average prior period judge occupancy decreases outstanding loan by 0.5%’. Zhang et al. (Reference Zhang, Arora and Colombage2021) too found that region specific factors influence the location of bank branches in India.
Furthermore, land being a state subject in India, land regulations have varied from state to state (Banerjee and Iyer, Reference Banerjee and Iyer2005; Besley and Burgess, Reference Besley and Burgess2000; Bolhuis et al., Reference Bolhuis, Rachapalli and Restuccia2020). For instance, land tenancy laws vary across India due to combination of historical land tenure systems and land being a state subject since independence (Bolhuis et al., Reference Bolhuis, Rachapalli and Restuccia2020). However, despite reforms this has led to several inefficiencies and persistence of informal, insecure, short-term tenancies impacting their access to formal credit (Bolhuis et al., Reference Bolhuis, Rachapalli and Restuccia2020).
In order to examine disparities in regional banking development even furthermore, we compute Gini coefficients for banking development indices across the states for public and private banks for 1996 to 2015. The value of Gini lies between 0 and 1. Zero value implies that financial development across the states is perfectly equal, whereas 1 indicates a state of perfect inequality as financial development exists only in one state. Gini coefficient measures deviations from equal distribution, with a higher value indicating more unequal distribution. The formula used to calculate Gini coefficient is:
 $$G_{\,fd} = \left[{\displaystyle{2 \over {N\mathop \sum \nolimits_{i = 1}^N \,fd_i}}\mathop \sum \limits_{i = 1}^N i\cdot fd_i} \right]\;-1-\displaystyle{1 \over N}$$
Here, N is the number of states and fd is the financial development of the ith state. The Gini coefficients for public and private banks so estimated are plotted in Figure 5.
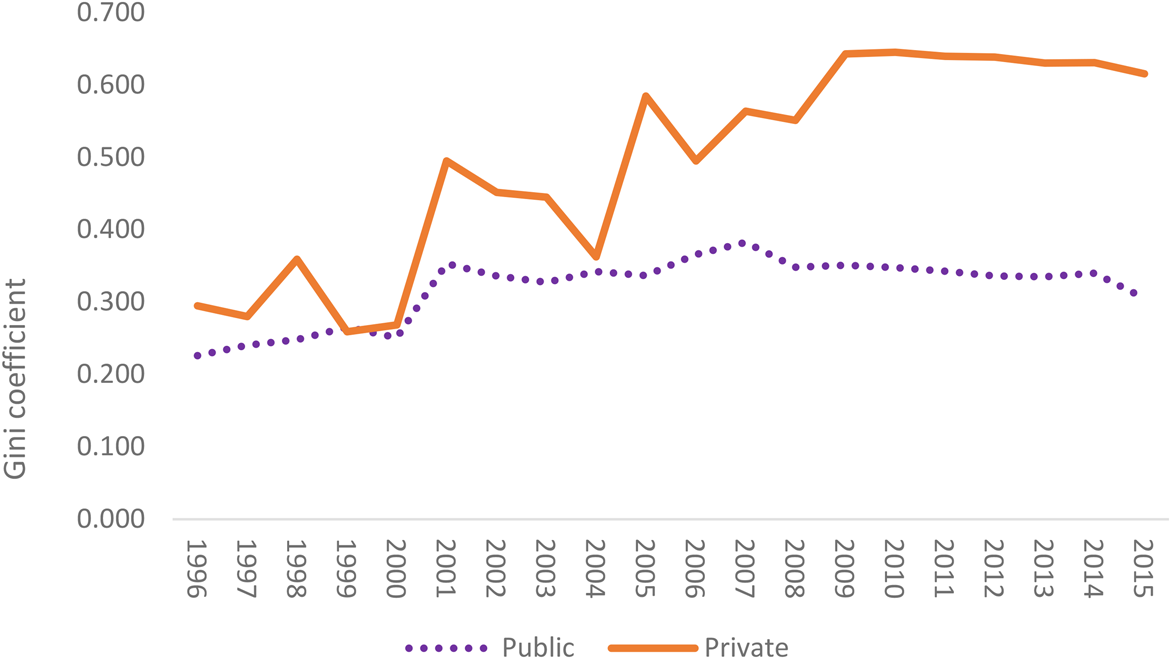
Figure 5. Disparity (Gini coefficient) in banking development across states.
We further estimated the coefficient of variation (CV), the simplest and most commonly used among various methods of dispersion. The CV in financial development across the states for 1996 to 2015 for all three bank groups is shown in Figure 6. Generally, a stable trend is observed except for foreign banks, however, there is an evidence of a slight decline in recent period across all the bank groups. Regarding foreign banks, their entry was highly regulated until 1994 when under WTO General Agreement on Trade in Services (GATS) the licences issued to open new branches increased from initially five to 12 in 1998. The total number of foreign bank branches declined in 2003 and 2004 to 219 (from 251 in 2002) rising again to 229 in 2008 and further to 286 in 2018. The fall in the number of foreign bank branches in 2003 was mainly due to the closure of some banks and merger of Standard Chartered Grindlays Bank Ltd. with Indian branches of Standard Chartered Bank (Sharda et al., Reference Sharda, Swamy and Singh2014). Global financial crisis of 2008 also affected the performance of both foreign and private banks as their credit declined and flight of deposits to public banks took place (Acharya and Kulkarni, Reference Acharya and Kulkarni2012; Eichengreen and Gupta, Reference Eichengreen and Gupta2012). As Eichengreen and Gupta (Reference Eichengreen and Gupta2012) note, ‘deposit reallocation from the foreign banks was statistically as sharp as from the domestic private banks; and the credit growth slowdown from the foreign banks was also comparable to that of the Indian private banks’.
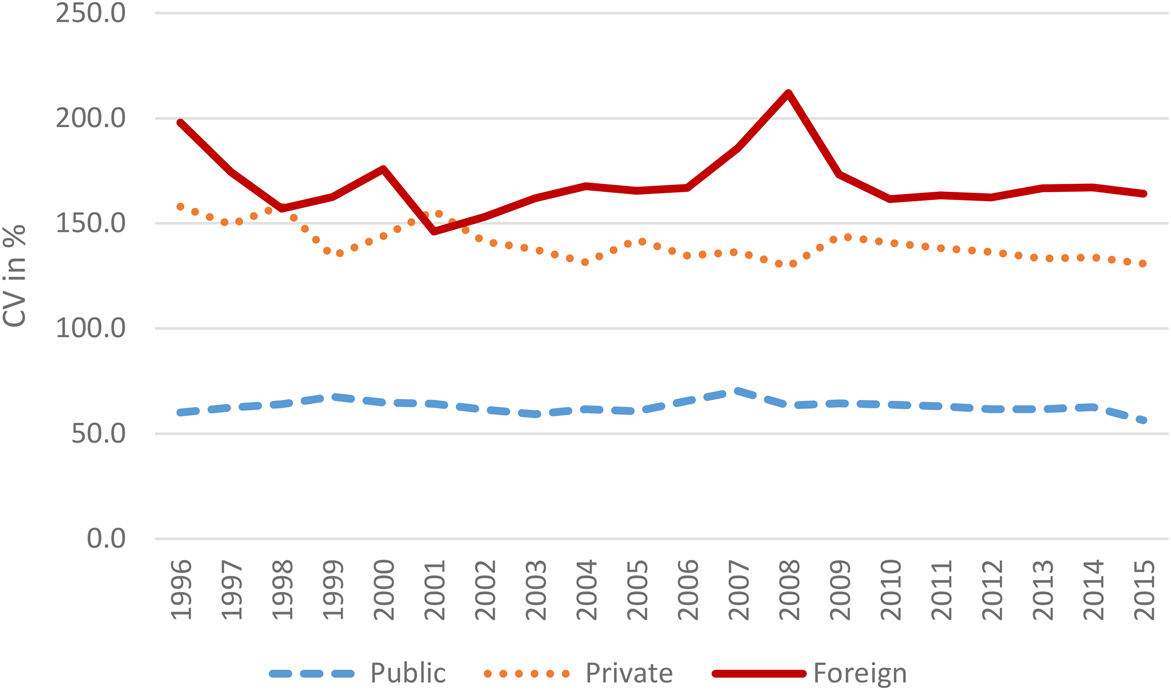
Figure 6. CV across the states.
As Svirydzenka (Reference Svirydzenka2016) observes, ‘financial development is not (added) linear process. Indeed, like with economic development, some countries go through stages of development, but then regress’. Overall, banking development across the Indian states has progressed (Figure 7), although it was influenced by the trend in public banks. The country's banking sector remained predominantly in the public sector with public banks accounting for 72.1% of total banking assets even as in 2014, notwithstanding the marginal decline in ownership over the years. The Government of India continues to hold more than the stipulated 51% shareholding in all the public banks, despite a decline in the stake in some of them in recent years. Even as in 2020 government shareholding in public banks ranges from 57.9 to 97.4% (RBI, 2020b). On the contrary, this period was also marked by the entry of new private banks. Although some private banks existed prior to reforms, the entry of new ones was largely initiated from 1993 as 10 new private banks were set up. In the early 2000s, two large development finance institutions were also converted into banking institutions.
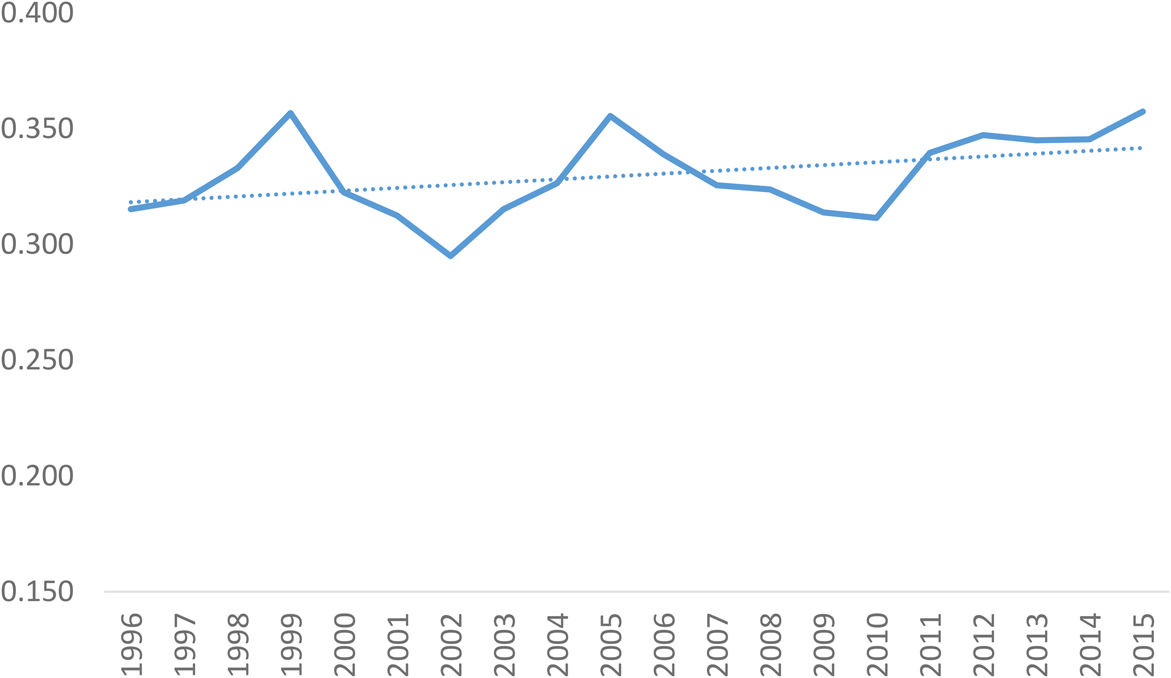
Figure 7. Banking development during 1996–2015.
6. Conclusion
To summarise, our study started with the research questions: how do we measure financial development at the sub-national level? How unequal is the financial development across the states, and does it vary by ownership of financial institutions? We examined the extent of disparities in financial development at the sub-national level as a step towards understanding the financial dimension of regional disparities in the Indian context. As a large emerging economy, India is particularly an interesting case to examine as it is not only a large federal economy with sub-national units at varying stages of development, but the ownership of its financial sector is also quite skewed and diverse.
To investigate the extent of financial deepening at the sub-national level further, our study builds composite banking development indices for public, private and foreign banks for 25 Indian states for the years 1996 to 2015. We have four major findings. First, over the years, the position of top three and bottom three states in the aggregate banking index has remained unchanged. Second, our results show that banking development is much higher in the leading states (i.e. leading in terms of per capita income and physical and social infrastructure) compared to the lagging states and this divergence has not narrowed over the years. Third, just like other bank groups, the presence of public banks is much higher in the leading states. In another study, our research too showed that contrary to general perception, public banks consider regional and economic activity of region in locating their bank branches (Zhang et al., Reference Zhang, Arora and Colombage2021). Finally, an interesting finding is improvement in index scores in the recent years for some states including those in the north-east reflecting some early impact of recent drive on financial inclusion. We reiterate that our objective in this study is to examine key features of sub-national financial system and not examine endogeneity. Nonetheless, the indices could be used to carry out rigorous growth regressions to test the importance of banking access to convergence within India.
Overall, our analysis on the unevenness in the spread of financial sector development in the Indian states and its association with regional endowments indicates that regional development strategies are required to improve states' economic development.
Specific policies are needed to improve financial development in lagging regions. This requires different approaches for public and private sector banks. We believe it is difficult to force foreign banks to increase their operations in lagging states considering that they also face several constraints and tighter regulations on branch expansion (Sharda et al., Reference Sharda, Swamy and Singh2014). It is quite possible that their products are at present geared towards high-net-worth households and formal sector firms (or cream skimming). They have the potential to come up with innovative products to capture huge market in India where there is a gap for efficient and less bureaucratic form of banking, but at present it appears that foreign banks do not see themselves doing this any sooner perhaps due to complexity of state level operations and transaction entry costs.Footnote 13 That does not mean the market should not be open for entry by foreign banks but just that they are unlikely to be venturing into that segment of banking. As can be anticipated, private banks appear to be more risk averse than public banks leaving them to take care of less developed regions and rural sectors. This suggests that public banks, despite their high presence in leading states (as our results showed) are nonetheless locked into a sort of low-level equilibrium trap with a primary responsibility to provide banking services in the lagging regions. The problems of information asymmetry are high in this sector increasing the possibilities of moral hazard and proportion of non-performing loans. This suggests that some important reforms are needed for lagging states to converge and for financial development to have significant impact of extreme poverty in India and thus contribute to SDGs.
Recent drive to increase financial inclusion and financial development has remained mainly supply centric and neglects demand side barriers for instance, low incomes of many households leading to low demand for formal financial services, financial illiteracy, travelling costs to the bank to conduct banking transactions and poor education in general. Although there are efforts to formalise the financial sector, overall employment in India remains dominated by unorganised sector and merely forcing people to use formal financial channels may not work unless it is accompanied by education, awareness and safeguards for small enterprises and informal sector businesses to be part of the formal financial system. The demand for working capital and huge seasonality of such enterprises and smoothing this out through appropriate products remains a huge challenge for formal financial models especially given the nature of distribution of risks and limited penetration of insurance including business insurance services. Addressing these would increase demand for financial services, improve financial inclusion and increase banking development (Tulasi et al., Reference Tulasi, Goliat and Sethi2017). At the same time, as our analysis showed the crucial role played by institutional factors such as differences in land systems across the states historically which has shaped and influenced economic development including access to credit of lagging states cannot be overlooked (Banerjee and Iyer, Reference Banerjee and Iyer2005; Bolhuis et al., Reference Bolhuis, Rachapalli and Restuccia2020). This implies that demand alone may not be a sole barrier to accessing financial services.
As developing countries are adopting several measures to improve financial development and financial inclusion (Demirgüç-Kunt et al., Reference Demirgüç-Kunt, Klapper, Singer, Ansar and Hess2018), national level efforts alone may not be adequate as they may fail to redress underlying inequalities at the local/regional level. More focused approach is needed at the sub-national/local levels to achieve increased financial development (Fafchamps and Schündeln, Reference Fafchamps and Schündeln2013). This is especially relevant for large federal economies.
Acknowledgements
We gratefully thank the three anonymous referees and editor, Prof Geoffrey Hodgson for very valuable and constructive feedback on our paper. We also acknowledge comments and feedback received from the participants of 3rd Development Economics Conference, 17–19 June 2019, University of Lincoln, Lincoln, UK; Global Inequalities: Annual Conference of Development Studies Association, University of Manchester and Annual Conference of Regional Studies Association, held at Trinity College, Dublin.
Appendix A
Table A1. Classification of states based on per capita income
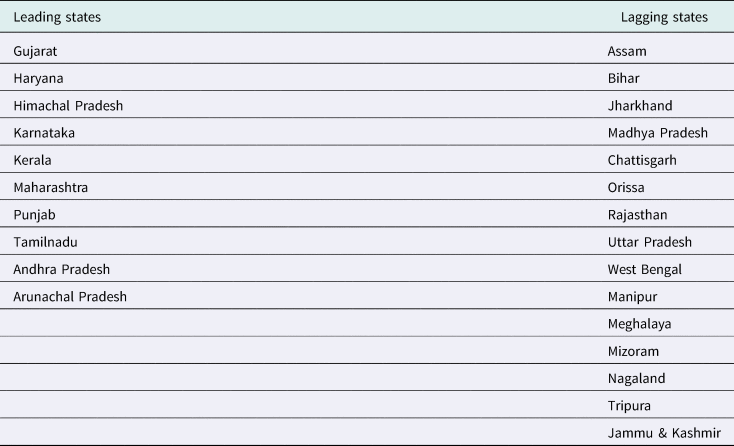
Table A2. Banking development index values
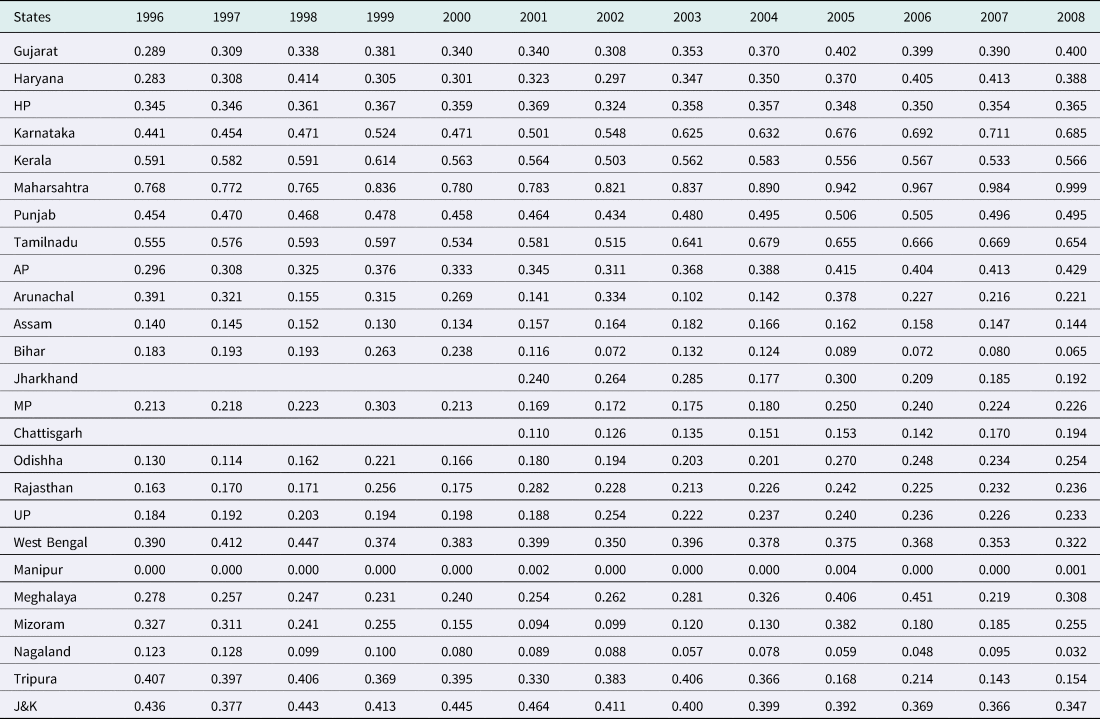
Table A3. Banking development index values


 Open access