
Gravity Control-Based Data Augmentation Technique for Improving VR User Activity Recognition


Department of Software Convergence, Kyung Hee University, Yongin 17104, Korea
*
Author to whom correspondence should be addressed.
Symmetry 2021, 13(5), 845; https://doi.org/10.3390/sym13050845
Submission received: 2 April 2021
/
Revised: 29 April 2021
/
Accepted: 2 May 2021
/
Published: 11 May 2021
(This article belongs to the Section Computer)
Abstract
:The neural-network-based human activity recognition (HAR) technique is being increasingly used for activity recognition in virtual reality (VR) users. The major issue of a such technique is the collection large-scale training datasets which are key for deriving a robust recognition model. However, collecting large-scale data is a costly and time-consuming process. Furthermore, increasing the number of activities to be classified will require a much larger number of training datasets. Since training the model with a sparse dataset can only provide limited features to recognition models, it can cause problems such as overfitting and suboptimal results. In this paper, we present a data augmentation technique named gravity control-based augmentation (GCDA) to alleviate the sparse data problem by generating new training data based on the existing data. The benefits of the symmetrical structure of the data are that it increased the number of data while preserving the properties of the data. The core concept of GCDA is two-fold: (1) decomposing the acceleration data obtained from the inertial measurement unit (IMU) into zero-gravity acceleration and gravitational acceleration, and augmenting them separately, and (2) exploiting gravity as a directional feature and controlling it to augment training datasets. Through the comparative evaluations, we validated that the application of GCDA to training datasets showed a larger improvement in classification accuracy () compared to the typical data augmentation methods () applied and those that did not apply the augmentation method ().
1. Introduction
Sensor-based human activity recognition (HAR) aims to recognize the actions and goals of the users from a series of observations by the sensors, which are attached to the users. Today, HAR is being increasingly used as a non-verbal interaction methodology for virtual reality (VR) users because it can provide a more realistic and immersive experience compared to the controller-button-based interaction methodologies. For example, users will be more immersed in the game when they can throw a weapon with an actual throwing action instead of simply clicking a controller button.
HAR in VR applications is often achieved by using machine learning methods because of their robustness [1,2]. However, collecting large-scale and labeled datasets, which are key to deriving robust recognition models, has been limited because the collection process is often costly. Such a sparse data problem will be aggravated as the number of activities to be classified increases. For example, in commercial action fighting VR games, such as Blade & Sorcery, shielding front can block a stabbing from the front, and shielding downward can block a stabbing from the below, but not vice versa. Therefore, it is necessary to classify them into different labels to provide users with appropriate responses and results. However, this requires a sufficient number of training data for the shielding front and shielding downward.
On the other hand, in a VR game, which is the most widely used application in the field of VR, there are activities that have a similar motion structure but different motion directions. These activities often result in different consequences. For example, in commercial action fighting VR games such as Blade & Sorcery, shielding front can block a stabbing from the front, but not a stabbing from below. Therefore, it is necessary to classify them into different labels to provide users with appropriate responses and results. However, this will increase the number of activities to be distinguished by recognition models, and aggravate the sparse data problems.
Sparse data problems can be alleviated by using data augmentation methods. Those methods artificially create new training data based on the existing training data. Since the symmetrical structure of the data is preserved, the generated data have similar properties to the existing training data. For time-series data, there are a number of data augmentation methods [3,4]. However, those methods did not take the characteristics of the acceleration data obtained from the sensors into account. For example, the scaling method, which is one of the widely used data augmentation methods, either scales the training data up or down. When applying this to the controller accelerations as it is, not only the acceleration derived from the motion, but also the acceleration of gravity, will be scaled simultaneously. This deviates from the general fact that the magnitude of gravitational acceleration should always be constant, which means that incorrect data have been generated.
In this paper, we propose a data augmentation technique named gravity control-based data augmentation (GCDA). The goal of the GCDA is to increase the number of training data without performing expensive actual motion collection. The underlying idea of GCDA is to decompose the input acceleration data into the acceleration of the actual activity (zero-gravity acceleration) and acceleration of gravity (gravitational acceleration), and augments them separately. Furthermore, focusing on the activities that have similar motion structures to each other but have different motion directions, we used them to augment each other by changing direction information. Then, the comparative evaluations were conducted to validate whether the proposed technique provides better results compared to the previous augmentation method.
2. Related Work
Human activity recognition (HAR) has long been studied in both the academic and commercial fields as a method of future interaction. There are roughly two mainstreams in the field of HAR: camera-based and sensor-based methods. Camera-based methods generally use video images [5,6,7,8] or depth camera images [9,10,11]. Although camera-based approaches have the advantage of being able to utilize a variety of information captured by the camera, they often suffer from problems of self-occlusion and a limited camera workspace. On the other hand, sensor-based methods generally rely on 3D kinematic information, such as angular and linear parameters, measured from wearable or handheld devices [12,13,14,15,16,17]. The major advantage of these methods is that 3D kinematic information can be obtained continuously without suffering from the self-occlusion problem. However, such sensors are often inaccessible to general users and suffer from calibration errors.
Our study builds on the field of sensor-based HAR. In this field, activity recognition was generally achieved by performing signal processing of the acceleration data [18,19]. Chen et al. [20] used surface electromyography (sEMG) and 2D accelerometers to achieve hand motion recognition. For hand motion recognition, several studies [21,22] have tried to measure the hand motion data by using CyberGlove and calibrated the data. However, a Cyberglove is expensive to general users and shows low accuracy when measuring large curvatures on fingers. Jeong et al. [23] presented an inexpensive finger-gesture recognition glove that recognizes sign language. However, it revealed some problems in terms of reaction speed and stability. Wang and Neff [24] presented a glove calibration method that can recognize the hand motion in real-time. Wolf et al. [25] developed a wearable device called BioSleeve, and inferred arm and hand gestures based on the measured data from the Electromyogram (EMG) and Inertial Measurement Unit (IMU) sensors. Georgi et al. [26] suggested an activity recognition framework, based on arm, hand, and finger movements. To this end, they fused the signals of an IMU and EMG attached to the user’s wrist and forearm, respectively. Huang et al. [27] developed hand gesture recognition wrist band by combining EMG and IMU sensors. Calella et al. [28] developed a 3D gesture recognition device called HandMagic based on an IMU sensor. Alavi et al. [29] used 10 sensors attached to the body to capture human motion and classified six different gestures. Zadeh et al. [30] developed a biosensor-based hand-finger gesture recognition method. Mummadi et al. [31] introduced a novel sensing glove design that detects its wearer’s hand postures and motion at the fingertips. Diliberti et al. [16] used customized motion-capturing gloves to obtain gestural datasets and implemented a neural network for real-time gesture recognition. All of these studies showed acceptable recognition performance, but they have the disadvantages that the sensor devices are hardly accessible to the general public and that the recognition performance is largely dependent on the performance of the sensor. On the other hand, many commercial VR applications generally allow users to interact with virtual worlds through the VR controller because the controller is widely distributed as a basic VR kit. Therefore, we aim to recognize VR users’ activity based on the 3D kinematic information, measured by the HTC VIVE controller.
There are many ways to recognize what activity is taking place based on human activity data such as images or acceleration. Spatio-temporal-matching-based methods [32,33,34,35] recognize human activity based on where the motion is (spatial information) and how the motion moves (temporal information). These methods are easy to implement, but their recognition performance is not good enough. Hidden Markov model (HMM)-based methods [13,36,37,38,39] exploit the concept of finite-state automata, in which each state transition arc has an associated probability value. From the initial state, the state moves toward one of the output symbols based on the obtained human activity data and state transition probability. Each output symbol represents a specific activity. Although HMM-based methods have shown satisfactory performance in terms of activity recognition, they usually have a high computational cost for calculating a large number of state probability densities and parameters. Recently, the neural network based methods [16,40,41,42,43,44] have become popular because they have strong classification performance, a fast response time, and enable non-linear classification. Since the human activity data are often a form of sequential data, the Recurrent Neural Network (RNN)-based model has been studied for the HAR tasks [45,46,47,48]. However, RNN-based models often suffer from slow learning speed and resource consumption. On the other hand, the Convolutional Neural Network (CNN)-based models have shown fast learning ability, low resource consumption, and high accuracy in classification. Due to its effectiveness, existing deep learning methods are mainly based on Convolutional Neural Network (CNN) architecture [49,50,51,52]. Therefore, we use a CNN architecture to construct a neural network model for HAR. Each dimension of the 3D kinematic data is treated as one channel of an image, and the convolution and pooling are performed separately.
The major issue of a neural network-based HAR is to collect large-scale training datasets which are key for deriving a robust recognition model. Since collecting the actual data is a costly and time-consuming process, the data augmentation technique is often exploited to increase the amount of training data [53,54]. However, augmenting time-series data has not been received much attention. Cui et al. [3] and Le Guennec et al. [55] used window slicing and time-warping techniques to augment the time-series data. Forestier et al. [56] proposed Dynamic Time Warping (DTW) which averages a set of time-series data and uses the average time-series as a new synthetic example. Um et al. [4] applied many well-known data augmentation methods used for image data to the wearable sensor data and investigated which method improves the classification performance. Camps et al. [57] augmented time-series data with random data shifting and rotating. Fawaz et al. [58] showed how the overfitting problem with small time-series datasets can be mitigated using a recent data augmentation technique that is based on DTW and a weighted version of the DTW Barycentric Averaging algorithm. Rashid et al. [59] presented a data-augmentation framework for generating synthetic time-series training data for an RNN-based deep learning network to accurately and reliably recognize equipment activities. Wang et al. [60,61,62] used an augmentation method of jittering and cropping to increase the performance of automatic protective behavior detection. Gao et al. [63] presented several data augmentation techniques specifically designed for time-series data in both the time domain and frequency domain. The studies on various data augmentation methods for time-series data can be found in the survey paper published by Wen et al. [64]. In most cases, the augmentation for time-series data simply exploits the combination of existing augmentation techniques used in image data augmentation such as jittering, scaling, and warping.
In this paper, we presented a data augmentation method specifically designed for time-series data obtained from the wearable IMU sensor. In the IMU sensor-based HAR, gravity is often considered unnecessary noise data. Therefore, many studies filtered out the gravitational acceleration from the measured sensor data to obtain zero-gravity sensor data [65,66]. However, gravitational acceleration can be an important indicator. Kim et al. [67] found that gravity can be used as directional feature that increases the recognition accuracy in some activities. Inspired by this work, we used gravitational acceleration as a directional feature and controlled it to augment activity datasets.
3. Data Collecting
In VR applications, HAR technique can be used to provide non-verbal interactions to VR users. To enable this, application designers first define a number of activities to use for interactions. Then, they build an activity recognition model and acquire training dataset. The training dataset is often collected from the designers themselves or a few people, because collecting the data from a variety of real users is costly. After the small amount of training data is collected, the data are augmented to avoid problems caused by the use of sparse training data, and used for training the recognition model.
In this paper, we simulate this scenario to validate our augmentation technique. Since the author defines the activities and has high expertise in performing the activities, he can be regarded as a designer in the scenario. Therefore, the training dataset (TR) which is used to train the neural network is collected from the author. For the role of the general VR users in the scenario, we hire several participants and collect their activity data. When they perform a certain activity, the trained model must recognize the activity and provide an appropriate response to it. Therefore, a test dataset (TS) which is used to test the performance of our neural network is collected from the participants.
3.1. Participants
We acquired data from five participants including an author (two females and three males, age: years, and height: cm), and all of them had experienced VR games. Participants were composed of undergraduate or graduate students, with a normal or corrected-to-normal vision to minimize the effect of the physical condition and age of participants on the validation.
3.2. Activities
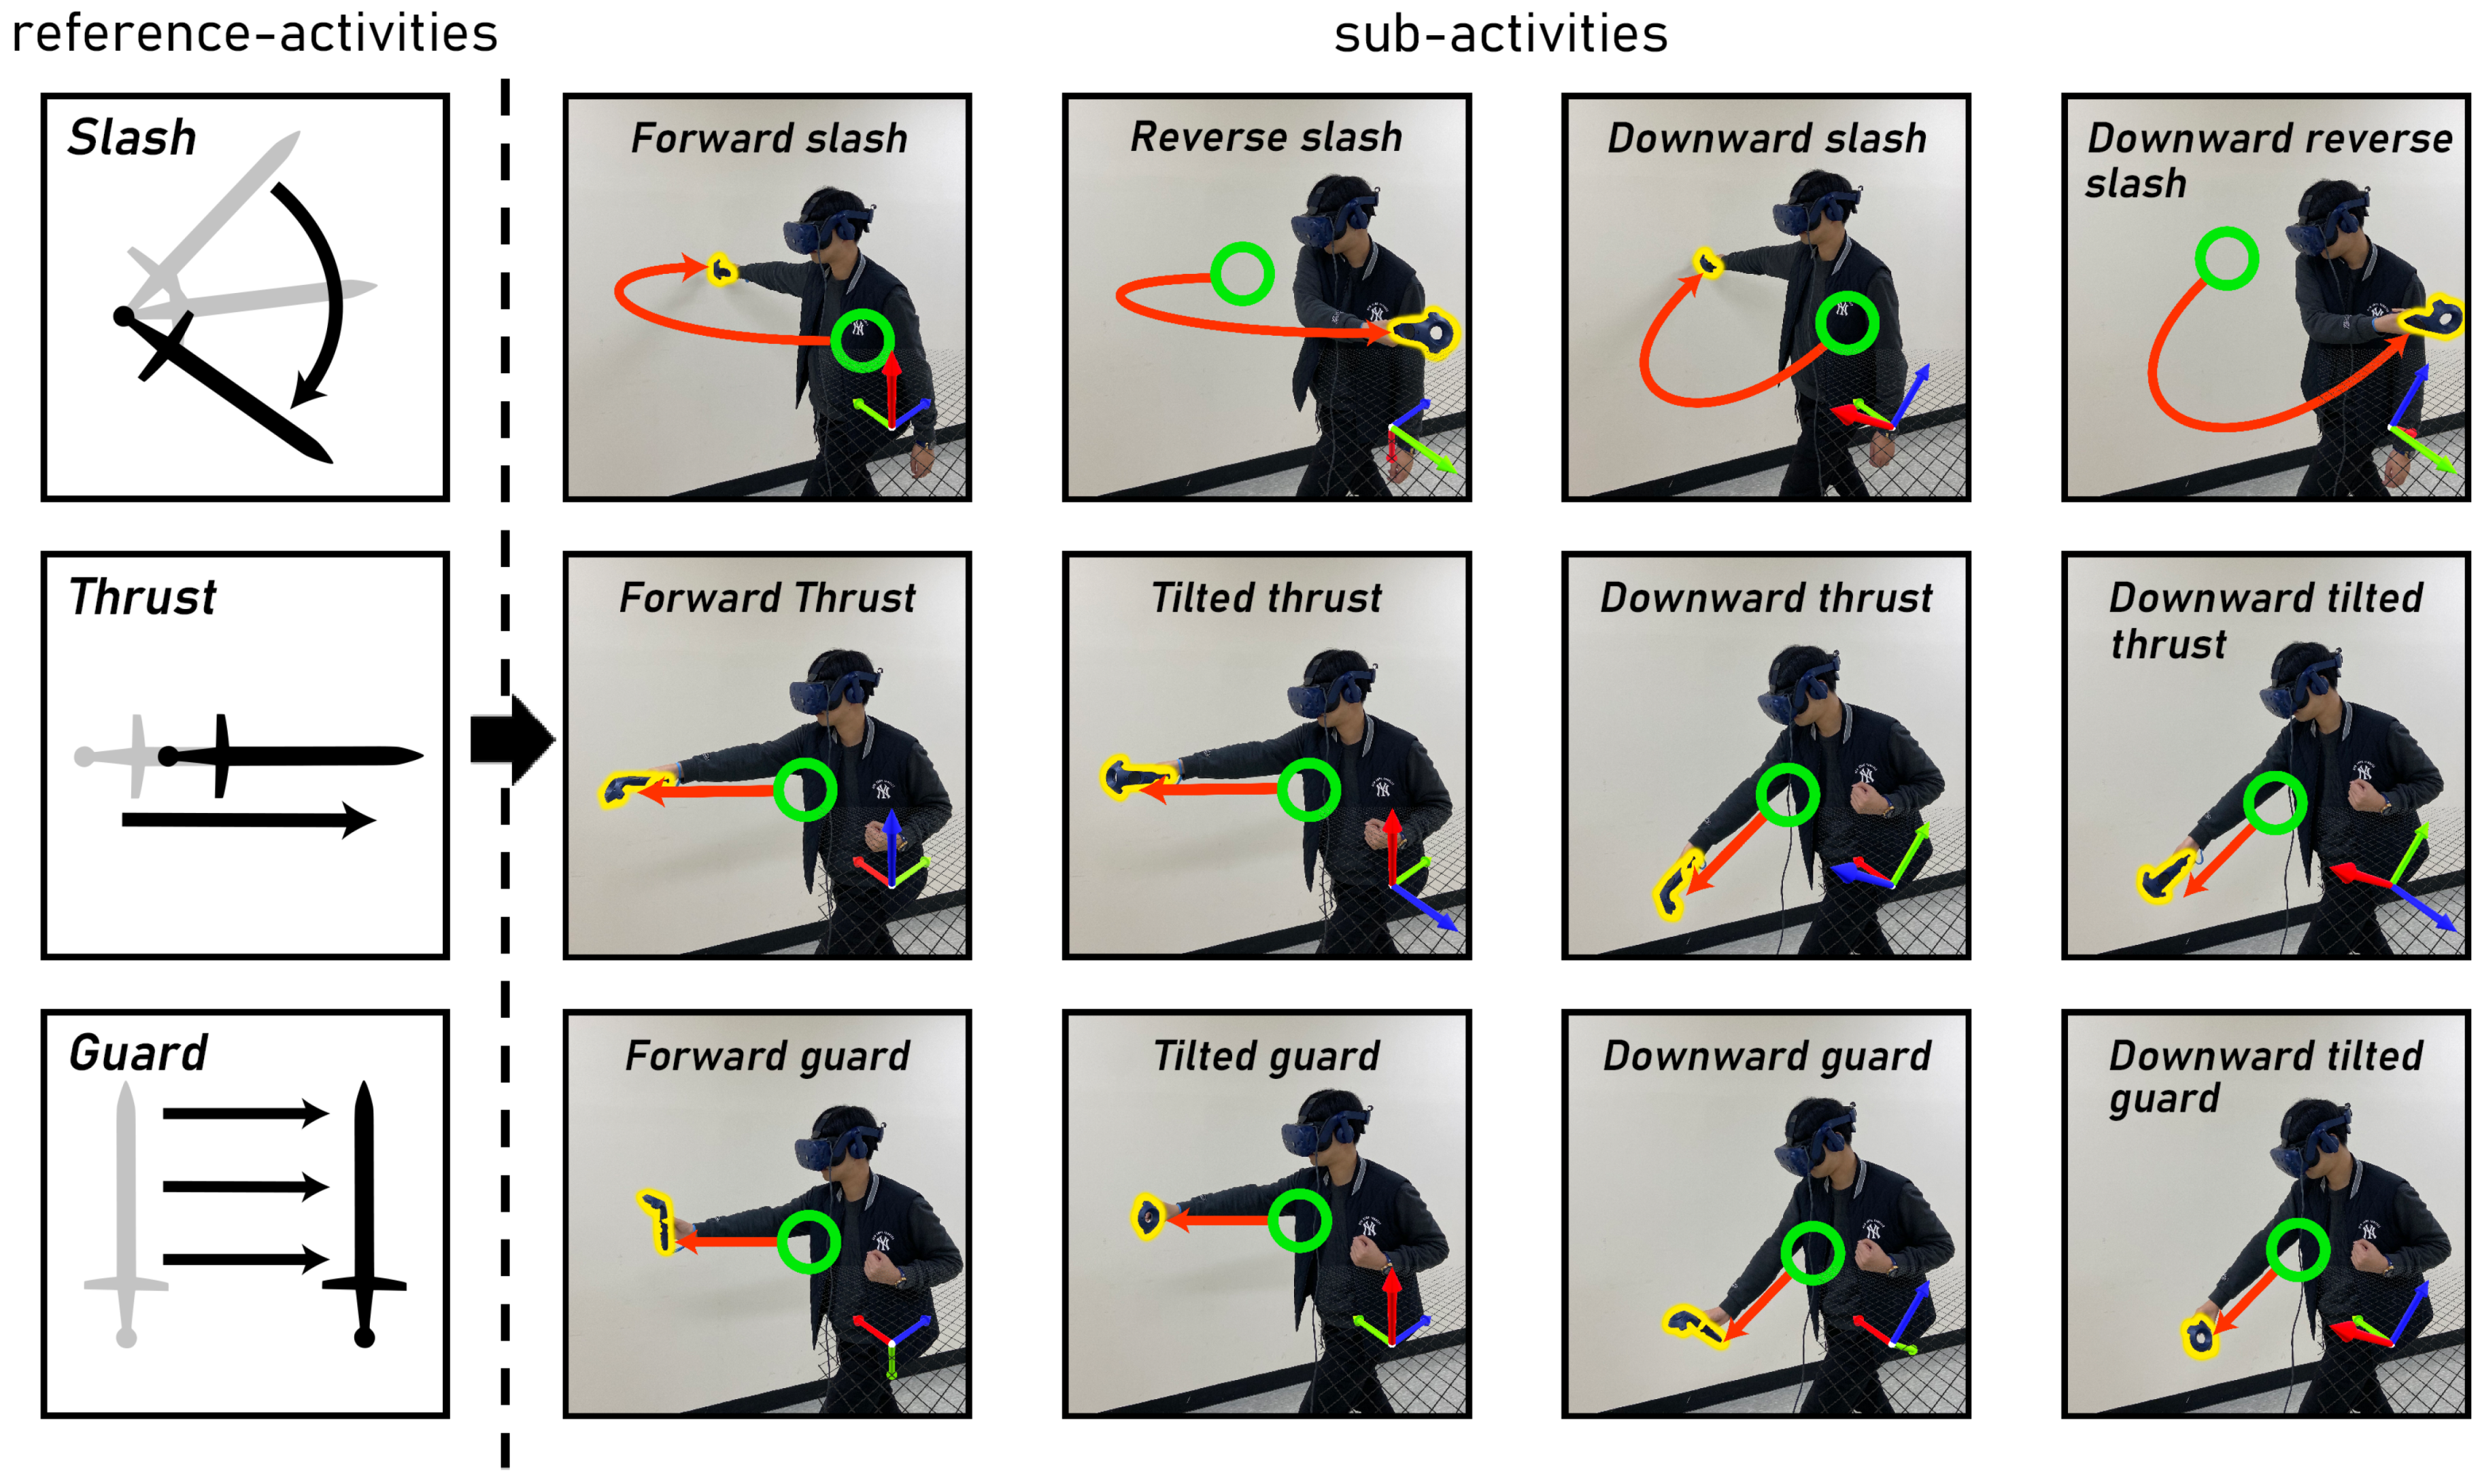
We focused on activities performed by moving the VR controller because the controller is the most widely used interaction device. We also focused on activities that are frequently observed in games, since games are not only the most prevalent type of VR application but also often require real-time activity recognition methods to provide a real-time response to user interactions. Therefore, we designed the activities based on the motions in the commercial VR game, Blade & Sorcery. First, we defined three types of reference activity: Slash, Thrust, and Guard. In games, these activities can be carried out in a variety of directions, and the consequences of the activity may vary depending on the direction. For example, frontal guard activity can block a stabbing from the front, but not a stabbing from below. This means that it is necessary to consider the reference activities as different activities when they are performed in different directions. Therefore, we defined four sub-activities for each reference activity and aimed to classify 12 sub-activities through the recognition model. Sub-activities derived from the same reference activity have similar motion structures but have different motion directions. The reference and sub-activities are shown in Figure 1.
3.3. Procedure
On arrival, each participant was provided a brief explanation about the data collection procedure. Subsequently, each participant was given a 10-min training session to familiarize themselves with each sub-activity. After the training session, each participant was asked to perform 60 repetitions of each of the 12 sub-activities and the order of sub-activities was randomly provided. Participants were asked to perform only with the right hand since all activities are designed to be performed with the right hand. Before starting each repetition, participants were asked to place the controller in the start position and wait. When the experimenter signals, participants began to perform the activity. Participants were asked to keep pressing the trigger button during the activity and to release the button when the activity was over. To avoid participant fatigue, a 5-min break was provided for every 60 repetitions completed. In total, each participant took about 115 min to complete the data collection procedure. As a result, we collected 300 activity data for each sub-activity, and thus 3600 activity data were collected in total. The collected data was divided into two groups: TR and TS. We constructed TR by using data collected from the author. Therefore, TR has 720 activity data. We constructed TS by using data collected from the participants. Therefore, TS has 2880 activity data.
3.4. Data Sensing
While the participant repeatedly conducted each sub-activity, we saved activity data from s before the moment the participant pressed the trigger button to the moment the participant released the trigger button. This s margin, which was exploited for real-time recognition, will be discussed in Section 5.2.
We stored three kinds of information: three-dimensional acceleration of VR controller in the controller device space (), orientation of VR controller in the world space (), and orientation of head-mounted display (HMD) in the world space (). These data can be measured by the Vive controllers with 24 infrared and IMU sensors, and by a SteamVR tracking system that tracks the controller and an HMD with millimeter-level accuracy with an update rate ranging from 250 Hz to 1 kHz. The measured data are stored in circular buffers using OpenVR API which automatically calibrates IMU and orientation data at the rate of 250 Hz and 90 Hz, respectively. OpenVR API is developed by Valve Corporation, headquartered in Bellevue, Washington, USA. To match the data frequency between acceleration and orientation, orientation data were linearly interpolated and resampled at the rate of 250 Hz. Examples of collected acceleration, , are shown in Figure 2.
3.5. Outlier Removal
After the data acquisition, we performed outlier removal process for both TR and TS. In TR, there were 60 activity data for each sub-activity. For each sub-activity dataset, we removed 10 activity data, which showed either extreme acceleration or orientation. This is achieved manually by authors. As a result, the number of data in TR has been reduced from 720 to 600.
In TS, we also removed outliers. For each participant’s data, we removed 10 data from each of the 60 sub-activity data. Unlike the manual outlier removal process used for TR, we employed an automatic outlier removal process based on the data in TS. For example, to determine the outliers from the Forward slash activity data in TS, we tested whether the controller accelerations () of the data satisfied the following criteria:
- The average of the activity data is within the range [, ].
- The minimum of the activity data is within the range [, ].
- The maximum of the activity data is within the range [, ].
where
- :
- The average of all Forward slash activity data in TR.
- :
- The standard deviation of of all Forward slash activity data in TR.
- :
- The average of minimum of each Forward slash activity data in TR.
- :
- The standard deviation of minimum of each Forward slash activity data in TR.
- :
- The average of maximum of each Forward slash activity data in TR.
- :
- The standard deviation of maximum of each Forward slash activity data in TR.
Unless all criteria are satisfied, the activity data are considered an outlier and removed from TS. After that, we also tested the same criteria with the controller orientation () instead of acceleration (). This removes data that include extreme orientation. As the last step, we manually removed outliers that are not detected by the automatic removal process until the number of Forward slash activity data became 50 for each participant. As this outlier removal process was conducted for each sub-activity dataset, the total number of activity data in TS has been reduced from 2880 to 2400.
4. Gravity Control-Based Data Augmentation
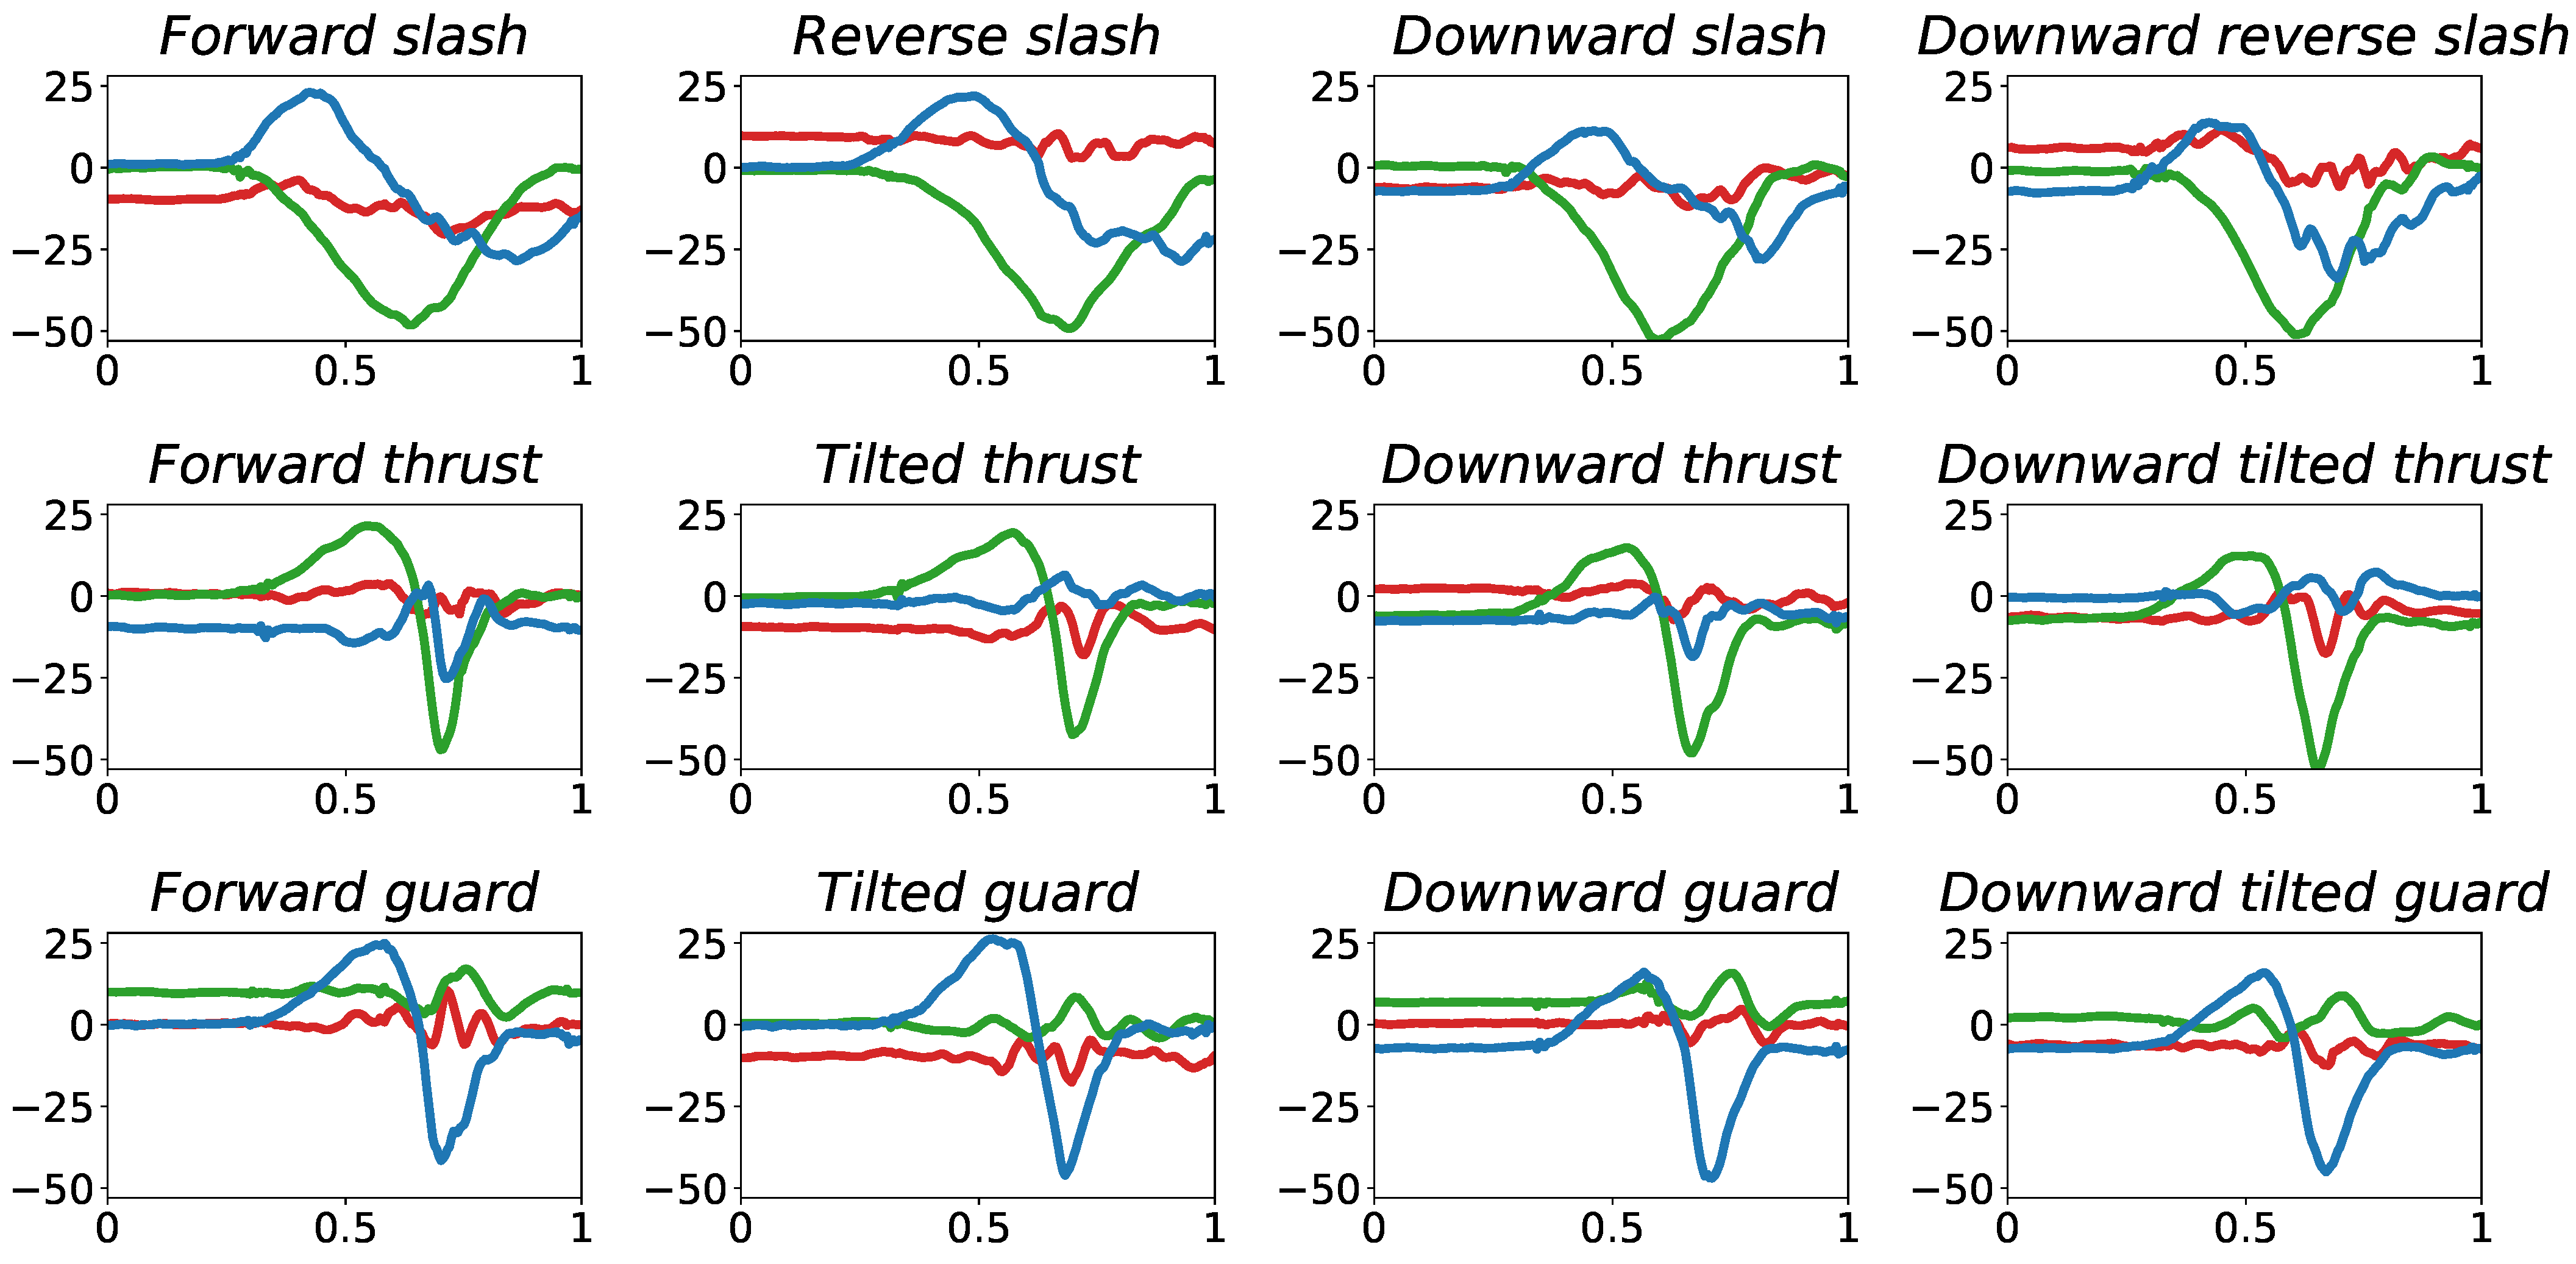
The goal of the GCDA is to increase the amount of training dataset (TR) without performing actual motion collection. Recall that the underlying idea of GCDA is to decompose the of activity data into zero-gravity acceleration () and gravitational acceleration in controller device space (), and augment each of them separately. can be obtained by using gravitational acceleration in the world space (g) and controller orientation (). Then, can be computed by subtracting from the . Note that is the key component that defines an activity, regardless of the direction in which the user performs the activity. For example, s obtained from the Forward slash and Downward slash activities are similar to each other because both of them are derived from the same reference activity, Slash. Figure 3 shows the similar s of four sub-activities derived from the Slash.
Figure 4 shows the five steps of GCDA: gravity decomposition, data augmentation, gravity rotation, gravity switching and gravity addition. In the gravity decomposition step, decomposed into and .
In the data augmentation step, typical data augmentation methods are applied to . Since there are various types of augmentation methods, we performed comparative tests to investigate which method leads to an improvement in classification performance when applied to TR. For comparison, we first chose seven different types of typical data augmentation methods for the time-series data [4]: jittering, scaling, rotation, permutation, magnitude-warping, time-warping, and cropping. Each augmentation method was applied to TR, and recognition model was trained with each of the augmented TRs. Then, we measured their classification accuracy. As a baseline, we additionally trained the recognition model with non-augmented TR and measured the classification accuracy. For a fair comparison, we optimized the augmentation parameters of each method to our datasets with a number of internal tests. As shown in Table 1, the five types of augmentation method, except for permutation and cropping, increase classification accuracy by at least when applied to TR.
The use of combinations of various data augmentation methods sometimes shows better augmentation performance compared to the use of a single method. Therefore, we additionally compared two more methods in which TR is augmented by different combinations of typical augmentation methods: (1) a combination of all seven typical augmentation methods (typical-all), and (2) a combination of only typical augmentation methods that actually improve the classification accuracy (typical-improve). In typical-improve, we combined jittering, scaling, rotation, magnitude-warping and time-warping methods because they increase classification accuracy when applied to TR. Since the typical-improve improved the classification accuracy the most (), we decided to use it in the data augmentation step.
In the gravity rotation step, we used the fact that the measured gravitational acceleration could be slightly different for each trial, even for the same activity. Therefore, was slightly rotated about the forward component of to generate new data. In internal test, rotation ranges within [, ] generally improved the inference performance of the neural network.
On the other hand, a large rotation can be used for augmenting other sub-activity that has a similar motion structure but a different motion direction. To avoid the confusion with gravity rotation, we named the step gravity switching. In the gravity switching step, was largely rotated about the forward component of . The amount of rotation is determined by the designer, based on the activity design. For example, rotating of Forward slash by about can be used as TR of Reverse slash. Since we defined four sub-activities for each reference-activity, gravity switching can increase TR by four times.
In the gravity addition step, augmented zero-gravity acceleration () and augmented gravitational acceleration () are combined. Algorithm 1 shows the procedure of GCDA.
| Algorithm 1. Gravity Control-based Augmentation. |
|

5. Activity Recognition
In this section, we present our activity recognition model. Our recognition model is built upon a neural network model since it has not only strong classification performance but also a fast computation time. As a network architecture, we chose to use a convolutional neural network (CNN), which is competent in capturing the local connections and the translational invariance of sensory data [45].
5.1. Neural Network Model
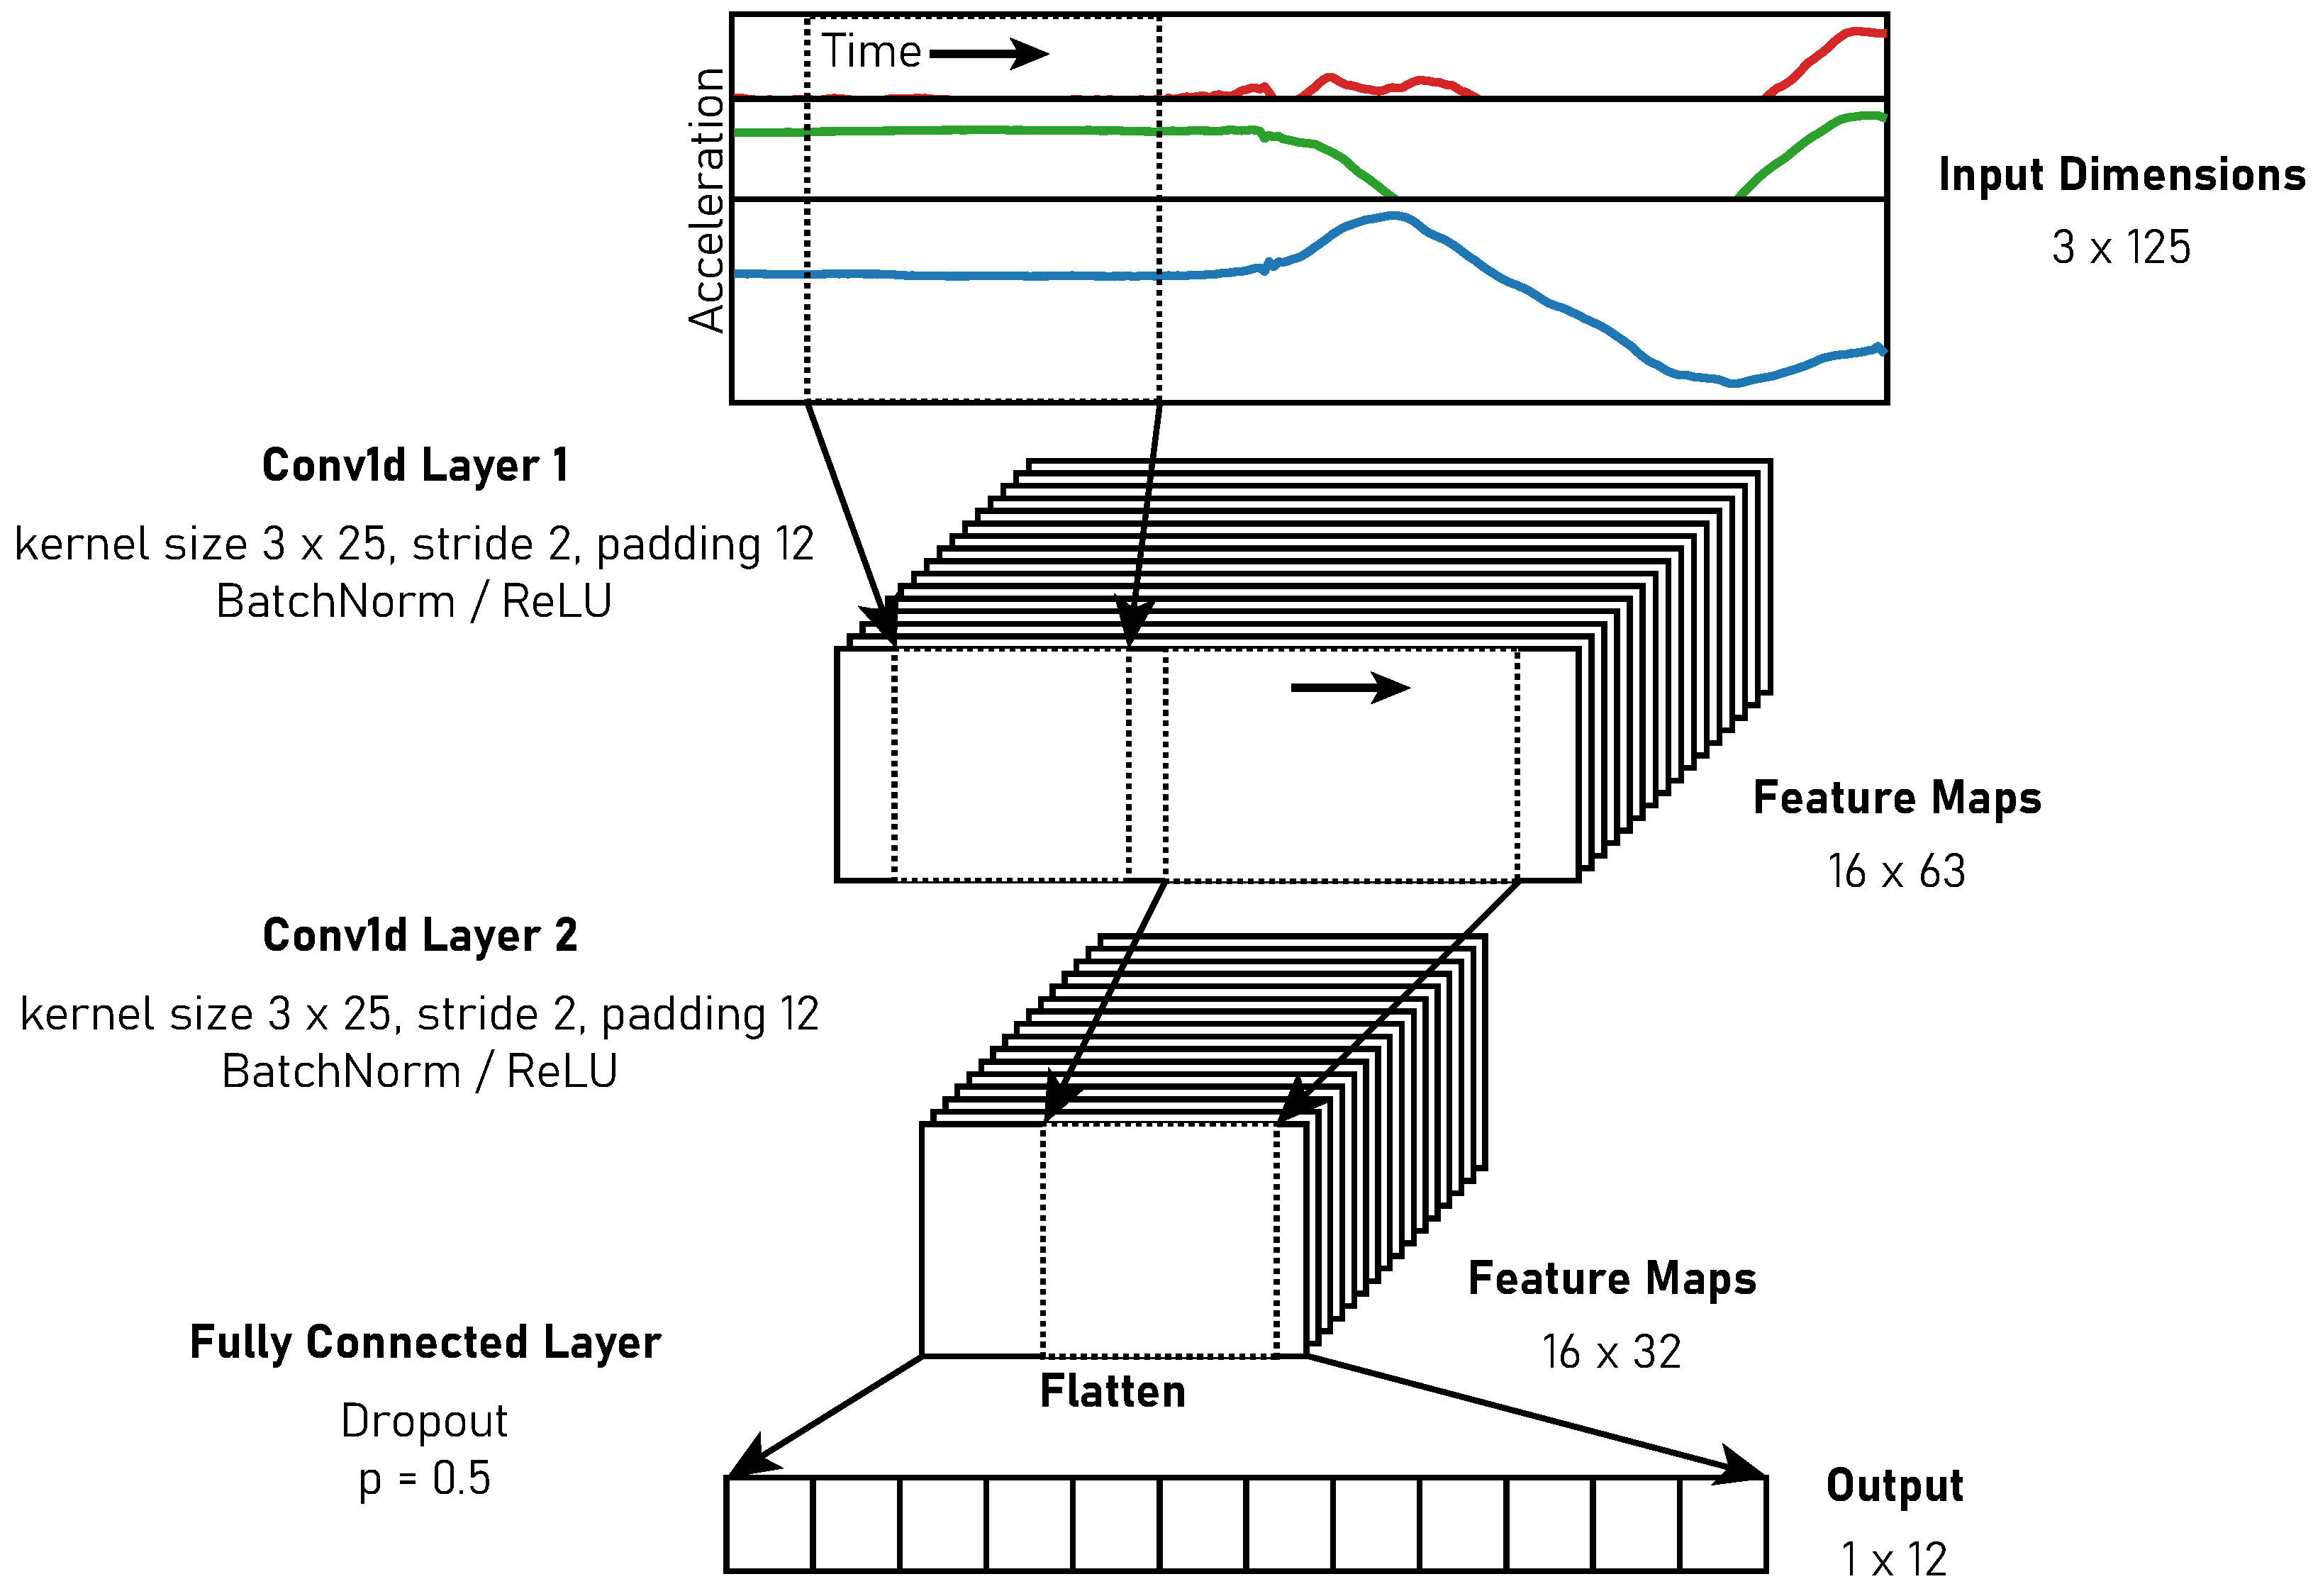
We employed one-dimensional (1D) convolutions [17,68]. The convolution and pooling are performed along the time of the 3D acceleration data obtained from the accelerometer. To achieve real-time classification, our neural network is designed in a simple form with only two 1D CNN layers and one fully connected layer with a dropout [69]. Each CNN layer passes the output to the batch normalization layer [70] and ReLU non-linear activation layer [71]. Our CNN model consisted of 13.852 parameters occupies 55.408 KB of memory and requires a total of 145.5 kFLOPS for each inference. Figure 5 shows the architecture.
A CNN layer consists of sets of filters. Each CNN layer takes the output of the previous layer as input. Then, it convolves the input by moving the filters horizontally and learns features of the input. Through this, neural networks can understand the user’s activity from the high-level to the low-level features.
Since the number of sub-activities we want to recognize is 12, the fully connected layer consists of 12 neurons. The value of each neuron indicates the probability that the given acceleration is a sub-activity corresponding to the neuron. For example, if the acceleration data of Forward slash are given as input, and the corresponding sub-activity of the first neuron is Forward slash, then the first neuron will have the largest value compared to other neurons. The value of each neuron is computed by conducting a weighted sum of all input values from the previous layer, giving us a probability distribution of what activity the user is performing.
5.2. Input Activity Data
Neural networks generally take fixed-size data as input. Therefore, activity data cannot be used directly as input to the neural networks since the length of activity data varies from person to person and activity to activity.
Therefore, we exploited the window slicing approach [3]. When the user’s activity started, sized window began to convey the three-dimensional acceleration of VR controller () to the neural network. Since the hop-size of the window is set to , consecutive two windows share data each other. The size of the window was determined, taking into account both strong feature extraction and minimal response delay. If the window size is designed to be too small, the data will not be able to extract the proper features of the activity, which will significantly decrease the inference performance of the neural network. On the contrary, if the window size is designed to be too large, the time interval between consecutive inputs increases. This will increase the response time of the neural network.
As acceleration is obtained at the rate of 250 Hz from the accelerometer, it can say that our neural network is designed to take s of activity data as input and consecutive two inputs share s of activity data each other. Unfortunately, the use of s input inevitably causes s delay at the initial inference since the initial window has to wait for it to be filled with acceleration data. This initial delay is a critical problem to the real-time VR application. To address this issue, we used s of acceleration before the user started the activity to fill the initial window. In our internal test, this successfully reduced the delay of the initial inference without decreasing the inference accuracy. We speculate that the acceleration of s before the user starts an activity seems to be a classifiable feature, such as activity preparation movement.
6. Evaluation
In this section, we evaluate whether the application of GCDA to activity data increases the information power which is helpful to train the activity recognition model.
6.1. Comparison between Data Augmentation Methods
In this evaluation, we aimed to show whether GCDA leads to better improvement in classification accuracy compared to the typical augmentation methods. To this end, we defined three test cases: (1) TR is augmented with GCDA (GCDA); (2) TR is augmented with a combination of jittering, scaling, rotation, magnitude-warping, and time-warping (typical-improve); (3) TR is not augmented (baseline). Additionally, we analyzed the contributions of each augmentation step of GCDA to the improvement that GCDA brings. Therefore, we defined three more test cases with different versions of GCDA: (4) GCDA without gravity rotation and gravity switching steps (GCDA-augment); (5) GCDA without data augmentation and gravity switching steps (GCDA-rotation); 6) GCDA without data augmentation and gravity rotation steps (GCDA-switching). In total, we compared 6 test cases.
To investigate whether GCDA has more improvements for smaller TR, we defined 13 test conditions by restricting fraction of the available TR: 2%, 6%, 10%, 14%, 18%, 30%, 40%, 50%, 60%, 70%, 80%, 90%, 100%. By using repeated random subsampling cross-validation [72], each test case was evaluated in different 13 test conditions.
The evaluation result is illustrated in Figure 6. In terms of the average accuracy for all fractions, GCDA shows higher accuracy () compared to the typical-improve () and baseline (). From this point, we can conclude that GCDA leads to better improvement in classification accuracy compared to the typical augmentation methods. On the other hand, the average accuracy for all fractions of GCDA-augment, GCDA-rotation, and GCDA-switching are , , and , respectively. It seems that gravity switching, data augmentation, and gravity rotation are in the order of contribution to the improvement of classification accuracy.
On the other hand, the improvement brought by GCDA is the most noticeable when the fraction of the available TR is . GCDA shows higher accuracy compared to the typical-improve () while it shows higher accuracy compared to baseline (). Furthermore, the accuracies of GCDA are not significantly different from each other when the fraction of the available TR is larger than . In typical-improve, the same phenomenon is shown only after the fraction is larger than . This means that GCDA brings greater improvements for smaller training sets.
6.2. Visualization of the Gravity Augmentation Result
When the augmentation technique is applied to the training datasets, data are altered while the class labels are preserved. If the data change significantly, the correlation between the data and the label will no longer be valid. To examine whether gravity rotation and gravity switching steps change the data too much and invalidate the correlation, we exploited the t-distributed stochastic neighbor embedding (t-SNE) [73]. First, we trained our neural network with TR. Then, TR is augmented with gravity rotation and gravity switching steps and fed into the neural network. After this, we extracted the feature vectors from the latent space located right before the fully connected layer. Lastly, these 512-dimensional feature vectors are projected into 2-dimensional vectors and plotted, as shown in Figure 7. The result demonstrates that the augmented data show a similar distributions to their original data. Therefore, gravity rotation and gravity switching steps successfully augment training data while preserving the correlation between the data and the label.
7. Conclusions
In this paper, we propose a novel augmentation technique, GCDA. GCDA focuses on VR user activity data where the activities have similar motion structures to each other but different motion directions. Given the acceleration data obtained from the VR controller, GCDA first decomposes the acceleration into zero-gravity acceleration and gravitational acceleration. Then, it augments each acceleration data by applying different augmentation techniques. The zero-gravity acceleration data are augmented by the combination of typical augmentation techniques widely used in previous studies, while the gravitational acceleration data are augmented by two steps of gravity rotation and gravity switching. Lastly, two types of augmented acceleration are merged and used for training. The evaluation tests have validated that applying GCDA to the training datasets increases the classification accuracy of the activity recognition model more than applying typical augmentation techniques to the training datasets.
GCDA can be a solution to a sparse data problem, which is one of the major issues of a neural-network-based HAR. In our tests with GCDA, activities performed by participants were successfully classified into 12 sub-activities with more than accuracy; even the recognition model was trained by sparse data, collected from only one person. One drawback of our method is the fact that the gravity switching step can only be used when sub-activities are correlated through their reference-activity. However, we envision that the hierarchy between sub-activity and reference-activity will be more common in future VR applications since they require more types of interaction methods. In future VR applications, if the user’s upward clap and downward clap are used as different interaction methods, GCDA will help to increase the interaction recognition performance.
Another drawback is the fact that gravity switching requires prior knowledge about how much each activity is rotated from the reference-activity. To resolve this problem, our future research will be conducted to infer the required amount of rotation for each sub-activity automatically.
Author Contributions
Conceptualization, D.H., C.L. and H.K.; methodology, D.H.; Project administration, H.K.; software, D.H. and C.L.; Supervision, H.K.; Validation, D.H.; Writing—original draft, H.K.; Writing—review and editing, H.K. All authors have read and agreed to the published version of the manuscript.
Funding
This work was supported by the National Research Foundation of Korea (NRF) grant funded by the Korea government(MSIT) (No. NRF-2020R1F1A1076528).
Institutional Review Board Statement
Not applicable.
Informed Consent Statement
Not applicable.
Data Availability Statement
The data presented in this study are available on request from the corresponding author. Since the data is intended to be used as internal data for certain companies, it is not publicly available.
Conflicts of Interest
The authors declare no conflict of interest.
Abbreviations
The following abbreviations are used in this manuscript:
| CNN | Convolutional neural network |
| DTW | Dynamic time warping |
| EMG | Electromyogram |
| GCDA | Gravity control-based augmentation |
| HAR | Human activity recognition |
| HMD | Head mounted display |
| HMM | Hidden markov model |
| IMU | Inertial measurement unit |
| KB | Kilobyte |
| FLOPS | floating point operations per second |
| MAC | Multiply-and-accumulate |
| RNN | Recurrent neural network |
| ReLU | Rectified linear unit |
| sEMG | Surface electromyography |
| TR | Training dataset |
| TS | Test dataset |
| t-SNE | t-distributed stochastic neighbor embedding |
| USD | United states dollar |
| VR | virtual reality |
References
- Kim, J.H.; Hong, G.S.; Kim, B.G.; Dogra, D.P. deepGesture: Deep learning-based gesture recognition scheme using motion sensors. Displays 2018, 55, 38–45. [Google Scholar] [CrossRef]
- Xiao, F.; Pei, L.; Chu, L.; Zou, D.; Yu, W.; Zhu, Y.; Li, T. A Deep Learning Method for Complex Human Activity Recognition Using Virtual Wearable Sensors. arXiv 2020, arXiv:2003.01874. [Google Scholar]
- Cui, Z.; Chen, W.; Chen, Y. Multi-scale convolutional neural networks for time series classification. arXiv 2016, arXiv:1603.06995. [Google Scholar]
- Um, T.T.; Pfister, F.M.; Pichler, D.; Endo, S.; Lang, M.; Hirche, S.; Fietzek, U.; Kulić, D. Data augmentation of wearable sensor data for parkinson’s disease monitoring using convolutional neural networks. In Proceedings of the 19th ACM International Conference on Multimodal Interaction, Glasgow, UK, 13–17 November 2017; pp. 216–220. [Google Scholar]
- Ali, S.; Shah, M. Human action recognition in videos using kinematic features and multiple instance learning. IEEE Trans. Pattern Anal. Mach. Intell. 2008, 32, 288–303. [Google Scholar] [CrossRef]
- Hoai, M.; Lan, Z.Z.; De la Torre, F. Joint segmentation and classification of human actions in video. In Proceedings of the CVPR 2011, Colorado Springs, CO, USA, 20–25 June 2011; pp. 3265–3272. [Google Scholar]
- Zanfir, M.; Leordeanu, M.; Sminchisescu, C. The Moving Pose: An Efficient 3D Kinematics Descriptor for Low-Latency Action Recognition and Detection. In Proceedings of the IEEE International Conference on Computer Vision (ICCV), Sydney, NSW, Australia, 1–8 December 2013. [Google Scholar]
- Gao, R.; Feris, R.; Grauman, K. Learning to Separate Object Sounds by Watching Unlabeled Video. In Proceedings of the European Conference on Computer Vision (ECCV), Munich, Germany, 8–14 September 2018. [Google Scholar]
- Biswas, K.K.; Basu, S.K. Gesture recognition using microsoft kinect®. In Proceedings of the 5th International Conference on Automation, Robotics and Applications, Wellington, New Zealand, 6–8 December 2011; pp. 100–103. [Google Scholar]
- Mapari, R.B.; Kharat, G. Real time human pose recognition using leap motion sensor. In Proceedings of the 2015 IEEE International Conference on Research in Computational Intelligence and Communication Networks (ICRCICN), Kolkata, India, 20–22 November 2015; pp. 323–328. [Google Scholar]
- Naidu, C.; Ghotkar, A. Hand gesture recognition using leap motion controller. Int. J. Sci. Res. 2016, 5, 2319–7064. [Google Scholar]
- Schlömer, T.; Poppinga, B.; Henze, N.; Boll, S. Gesture recognition with a Wii controller. In Proceedings of the 2nd International Conference on Tangible and Embedded Interaction, Bonn, Germany, 18–20 February 2008; pp. 11–14. [Google Scholar]
- Shi, G.; Zou, Y.; Jin, Y.; Cui, X.; Li, W.J. Towards HMM based human motion recognition using MEMS inertial sensors. In Proceedings of the 2008 IEEE International Conference on Robotics and Biomimetics, Bangkok, Thailand, 22–25 February 2009; pp. 1762–1766. [Google Scholar]
- Shin, B.; Kim, C.; Kim, J.; Lee, S.; Kee, C.; Kim, H.S.; Lee, T. Motion recognition-based 3D pedestrian navigation system using smartphone. IEEE Sens. J. 2016, 16, 6977–6989. [Google Scholar] [CrossRef]
- Sheng, M.; Jiang, J.; Su, B.; Tang, Q.; Yahya, A.A.; Wang, G. Short-time activity recognition with wearable sensors using convolutional neural network. In Proceedings of the 15th ACM SIGGRAPH Conference on Virtual-Reality Continuum and Its Applications in Industry, Zhuhai, China, 3–4 December 2016; Volume 1, pp. 413–416. [Google Scholar]
- Diliberti, N.; Peng, C.; Kaufman, C.; Dong, Y.; Hansberger, J.T. Real-time gesture recognition using 3d sensory data and a light convolutional neural network. In Proceedings of the 27th ACM International Conference on Multimedia, Nice, France, 21–25 October 2019; pp. 401–410. [Google Scholar]
- Chen, K.; Zhang, D.; Yao, L.; Guo, B.; Yu, Z.; Liu, Y. Deep learning for sensor-based human activity recognition: Overview, challenges and opportunities. arXiv 2020, arXiv:2001.07416. [Google Scholar]
- Jang, I.; Park, W. Signal processing of the accelerometer for gesture awareness on handheld devices. In Proceedings of the 12th IEEE International Workshop on Robot and Human Interactive Communication ( ROMAN 2003), Millbrae, CA, USA, 2 November 2003; pp. 139–144. [Google Scholar]
- Keir, P.; Payne, J.; Elgoyhen, J.; Horner, M.; Naef, M.; Anderson, P. Gesture-recognition with non-referenced tracking. In Proceedings of the 3D User Interfaces (3DUI’06), Alexandria, VA, USA, 25–26 March 2006; pp. 151–158. [Google Scholar]
- Chen, X.; Zhang, X.; Zhao, Z.Y.; Yang, J.H.; Lantz, V.; Wang, K.Q. Hand gesture recognition research based on surface EMG sensors and 2D-accelerometers. In Proceedings of the 2007 11th IEEE International Symposium on Wearable Computers, Boston, MA, USA, 11–13 October 2007; pp. 11–14. [Google Scholar]
- Yazadi, F. Cyberglove Systems Cyberglove II Wireless Data Glove User Guide; Cyberglove Systems LLC: San Jose, CA, USA, 2009; Volume 7. [Google Scholar]
- Huenerfauth, M.; Lu, P. Accurate and accessible motion-capture glove calibration for sign language data collection. ACM Trans. Access. Comput. (TACCESS) 2010, 3, 1–32. [Google Scholar] [CrossRef]
- Jeong, E.; Lee, J.; Kim, D. Finger-gesture recognition glove using velostat (ICCAS 2011). In Proceedings of the 2011 11th International Conference on Control, Automation and Systems, Gyeonggi-do, Korea, 26–29 October 2011; pp. 206–210. [Google Scholar]
- Wang, Y.; Neff, M. Data-driven glove calibration for hand motion capture. In Proceedings of the 12th ACM SIGGRAPH/Eurographics Symposium on Computer Animation, Anaheim, CA, USA, 8–10 July 2013; pp. 15–24. [Google Scholar]
- Wolf, M.T.; Assad, C.; Stoica, A.; You, K.; Jethani, H.; Vernacchia, M.T.; Fromm, J.; Iwashita, Y. Decoding static and dynamic arm and hand gestures from the JPL BioSleeve. In Proceedings of the 2013 IEEE Aerospace Conference, Big Sky, MT, USA, 2–9 March 2013; pp. 1–9. [Google Scholar]
- Georgi, M.; Amma, C.; Schultz, T. Recognizing Hand and Finger Gestures with IMU based Motion and EMG based Muscle Activity Sensing. In Proceedings of the International Conference on Bio-inspired Systems and Signal Processing (BIOSIGNALS-2015), Lisbon, Portugal, 12–15 January 2015; pp. 99–108. [Google Scholar]
- Huang, Y.; Guo, W.; Liu, J.; He, J.; Xia, H.; Sheng, X.; Wang, H.; Feng, X.; Shull, P.B. Preliminary testing of a hand gesture recognition wristband based on emg and inertial sensor fusion. In Proceedings of the International Conference on Intelligent Robotics and Applications, Portsmouth, UK, 24–27 August 2015; Springer: Berlin/Heidelberg, Germany, 2015; pp. 359–367. [Google Scholar]
- Calella, J.C.; Ortega, F.R.; Rishe, N.; Bernal, J.F.; Barreto, A. HandMagic: Towards user interaction with inertial measuring units. In Proceedings of the 2016 IEEE SENSORS, Orlando, FL, USA, 30 October–3 November 2016; pp. 1–3. [Google Scholar]
- Alavi, S.; Arsenault, D.; Whitehead, A. Quaternion-based gesture recognition using wireless wearable motion capture sensors. Sensors 2016, 16, 605. [Google Scholar] [CrossRef] [PubMed]
- Zadeh, A.S.; Calitz, A.; Greyling, J. Evaluating a biosensor-based interface to recognize hand-finger gestures using a Myo armband. In Proceedings of the Annual Conference of the South African Institute of Computer Scientists and Information Technologists, Port Elizabeth, South Africa, 26–28 September 2018; pp. 229–238. [Google Scholar]
- Mummadi, C.K.; Leo, F.P.P.; Verma, K.D.; Kasireddy, S.; Scholl, P.M.; Kempfle, J.; Laerhoven, K.V. Real-time and embedded detection of hand gestures with an IMU-based glove. Informatics 2018, 5, 28. [Google Scholar] [CrossRef] [Green Version]
- Bobick, A.F.; Wilson, A.D. A state-based technique for the summarization and recognition of gesture. Proceedings of IEEE International Conference on Computer Vision, Cambridge, MA, USA, 20–23 June 1995; pp. 382–388. [Google Scholar]
- Bobick, A.F.; Davis, J.W. The recognition of human movement using temporal templates. IEEE Trans. Pattern Anal. Mach. Intell. 2001, 23, 257–267. [Google Scholar] [CrossRef] [Green Version]
- Efros, A.A.; Berg, A.C.; Mori, G.; Malik, J. Recognizing action at a distance. In Proceedings of the Ninth IEEE International Conference on Computer Vision, Nice, France, 13–16 October 2003; p. 726. [Google Scholar]
- Alon, J.; Athitsos, V.; Yuan, Q.; Sclaroff, S. A unified framework for gesture recognition and spatiotemporal gesture segmentation. IEEE Trans. Pattern Anal. Mach. Intell. 2008, 31, 1685–1699. [Google Scholar] [CrossRef] [PubMed]
- Zhang, X.; Naghdy, F. Human motion recognition through fuzzy hidden markov model. In Proceedings of the International Conference on Computational Intelligence for Modelling, Control and Automation and International Conference on Intelligent Agents, Web Technologies and Internet Commerce (CIMCA-IAWTIC’06), Vienna, Austria, 28–30 November 2005; Volume 2, pp. 450–456. [Google Scholar]
- Lv, F.; Nevatia, R. Recognition and segmentation of 3-d human action using hmm and multi-class adaboost. In Proceedings of the European Conference on Computer Vision, Graz, Austria, 7–13 May 2006; Springer: Berlin/Heidelberg, Germany, 2006; pp. 359–372. [Google Scholar]
- Moni, M.; Ali, A.S. HMM based hand gesture recognition: A review on techniques and approaches. In Proceedings of the 2009 2nd IEEE International Conference on Computer Science and Information Technology, Beijing, China, 8–11 August 2009; pp. 433–437. [Google Scholar]
- Wu, D.; Shao, L. Leveraging hierarchical parametric networks for skeletal joints based action segmentation and recognition. In Proceedings of the IEEE Conference on Computer Vision and Pattern Recognition, Columbus, OH, USA, 23–28 June 2014; pp. 724–731. [Google Scholar]
- Hinton, G.E.; Osindero, S.; Teh, Y.W. A fast learning algorithm for deep belief nets. Neural Comput. 2006, 18, 1527–1554. [Google Scholar] [CrossRef] [PubMed]
- Tieleman, T. Training restricted Boltzmann machines using approximations to the likelihood gradient. In Proceedings of the 25th International Conference on Machine Learning, Helsinki, Finland, 5–9 July 2008; pp. 1064–1071. [Google Scholar]
- Yang, J.; Nguyen, M.N.; San, P.P.; Li, X.; Krishnaswamy, S. Deep convolutional neural networks on multichannel time series for human activity recognition. Ijcai. Buenos Aires, Argentina 2015, 15, 3995–4001. [Google Scholar]
- Laput, G.; Harrison, C. Sensing fine-grained hand activity with smartwatches. In Proceedings of the 2019 CHI Conference on Human Factors in Computing Systems, Glasgow Scotland, UK, 4–9 May 2019; pp. 1–13. [Google Scholar]
- Li, G.; Tang, H.; Sun, Y.; Kong, J.; Jiang, G.; Jiang, D.; Tao, B.; Xu, S.; Liu, H. Hand gesture recognition based on convolution neural network. Clust. Comput. 2019, 22, 2719–2729. [Google Scholar] [CrossRef]
- Hammerla, N.Y.; Halloran, S.; Plötz, T. Deep, convolutional, and recurrent models for human activity recognition using wearables. arXiv 2016, arXiv:1604.08880. [Google Scholar]
- Edel, M.; Köppe, E. Binarized-blstm-rnn based human activity recognition. In Proceedings of the 2016 International Conference on Indoor Positioning and Indoor Navigation (IPIN), Alcala de Henares, Spain, 4–7 October 2016; pp. 1–7. [Google Scholar]
- Guan, Y.; Plötz, T. Ensembles of deep lstm learners for activity recognition using wearables. In ACM on Interactive, Mobile, Wearable and Ubiquitous Technologies; Association for Computing Machinery: New York, NY, USA, 2017; Volume 1, pp. 1–28. [Google Scholar]
- Inoue, M.; Inoue, S.; Nishida, T. Deep recurrent neural network for mobile human activity recognition with high throughput. Artif. Life Robot. 2018, 23, 173–185. [Google Scholar] [CrossRef] [Green Version]
- Zeng, M.; Nguyen, L.T.; Yu, B.; Mengshoel, O.J.; Zhu, J.; Wu, P.; Zhang, J. Convolutional neural networks for human activity recognition using mobile sensors. In Proceedings of the 6th International Conference on Mobile Computing, Applications and Services, Austin, TX, USA, 6–7 November 2014; pp. 197–205. [Google Scholar]
- Chen, Y.; Xue, Y. A deep learning approach to human activity recognition based on single accelerometer. In Proceedings of the 2015 IEEE International Conference on Systems, Man, and Cybernetics, Hong Kong, China, 9–12 October 2015; pp. 1488–1492. [Google Scholar]
- Wang, J.; Chen, Y.; Hao, S.; Feng, W.; Shen, Z. Balanced distribution adaptation for transfer learning. In Proceedings of the 2017 IEEE International Conference on Data Mining (ICDM), New Orleans, LA, USA, 18–21 November 2017; pp. 1129–1134. [Google Scholar]
- Wang, J.; Chen, Y.; Hao, S.; Peng, X.; Hu, L. Deep learning for sensor-based activity recognition: A survey. Pattern Recognit. Lett. 2019, 119, 3–11. [Google Scholar] [CrossRef] [Green Version]
- Krizhevsky, A.; Sutskever, I.; Hinton, G.E. Imagenet classification with deep convolutional neural networks. Adv. Neural Inf. Process. Syst. 2012, 25, 1097–1105. [Google Scholar] [CrossRef]
- He, K.; Zhang, X.; Ren, S.; Sun, J. Deep residual learning for image recognition. In Proceedings of the IEEE Conference on Computer Vision and Pattern Recognition, Las Vegas, NV, USA, 27–30 June 2016; pp. 770–778. [Google Scholar]
- Le Guennec, A.; Malinowski, S.; Tavenard, R. Data augmentation for time series classification using convolutional neural networks. In Proceedings of the ECML/PKDD Workshop on Advanced Analytics and Learning on Temporal Data, Riva del Garda, Italy, 19–23 September 2016. [Google Scholar]
- Forestier, G.; Petitjean, F.; Dau, H.A.; Webb, G.I.; Keogh, E. Generating synthetic time series to augment sparse datasets. In Proceedings of the 2017 IEEE International Conference on Data Mining (ICDM), New Orleans, LA, USA, 18–21 November 2017; pp. 865–870. [Google Scholar]
- Camps, J.; Sama, A.; Martin, M.; Rodriguez-Martin, D.; Perez-Lopez, C.; Arostegui, J.M.M.; Cabestany, J.; Catala, A.; Alcaine, S.; Mestre, B.; et al. Deep learning for freezing of gait detection in Parkinson’s disease patients in their homes using a waist-worn inertial measurement unit. Knowl. Based Syst. 2018, 139, 119–131. [Google Scholar] [CrossRef]
- Fawaz, H.I.; Forestier, G.; Weber, J.; Idoumghar, L.; Muller, P.A. Data augmentation using synthetic data for time series classification with deep residual networks. arXiv 2018, arXiv:1808.02455. [Google Scholar]
- Rashid, K.M.; Louis, J. Times-series data augmentation and deep learning for construction equipment activity recognition. Adv. Eng. Inform. 2019, 42, 100944. [Google Scholar] [CrossRef]
- Wang, C. Automatic Detection of Protective Movement Behavior with MoCap and sEMG Data for Chronic Pain Rehabilitation. In Proceedings of the 2019 8th International Conference on Affective Computing and Intelligent Interaction Workshops and Demos (ACIIW), Cambridge, UK, 3–6 September 2019; pp. 65–69. [Google Scholar]
- Wang, C.; Gao, Y.; Mathur, A.; Lane, N.D.; Bianchi-Berthouze, N. Leveraging Activity Recognition to Enable Protective Behavior Detection in Continuous Data. arXiv 2020, arXiv:2011.01776. [Google Scholar]
- Wang, C.; Olugbade, T.A.; Mathur, A.; Amanda, C.D.C.; Lane, N.D.; Bianchi-Berthouze, N. Chronic-Pain Protective Behavior Detection with Deep Learning; ResearchGate: Berlin, Germany, 2021; Volume 1. [Google Scholar] [CrossRef]
- Gao, J.; Song, X.; Wen, Q.; Wang, P.; Sun, L.; Xu, H. RobustTAD: Robust time series anomaly detection via decomposition and convolutional neural networks. arXiv 2020, arXiv:2002.09545. [Google Scholar]
- Wen, Q.; Sun, L.; Song, X.; Gao, J.; Wang, X.; Xu, H. Time series data augmentation for deep learning: A survey. arXiv 2020, arXiv:2002.12478. [Google Scholar]
- Benoussaad, M.; Sijobert, B.; Mombaur, K.; Azevedo Coste, C. Robust foot clearance estimation based on the integration of foot-mounted IMU acceleration data. Sensors 2016, 16, 12. [Google Scholar] [CrossRef] [Green Version]
- Kalpaxis, A. Wireless temporal-spatial human mobility analysis using real-time three dimensional acceleration data. In Proceedings of the 2007 International Multi-Conference on Computing in the Global Information Technology (ICCGI’07), Guadeloupe, France, 4–9 March 2007; p. 1. [Google Scholar]
- Kim, S.K.; Park, G.H.; Jeon, S.H.; Yim, S.H.; Han, G.J.; Choi, S.M.; Choi, S.J. HMM-based motion recognition with 3-D acceleration signal. J. KIISE Comput. Pract. Lett. 2009, 15, 216–220. [Google Scholar]
- Duffner, S.; Berlemont, S.; Lefebvre, G.; Garcia, C. 3D gesture classification with convolutional neural networks. In Proceedings of the 2014 IEEE International Conference on Acoustics, Speech and Signal Processing (ICASSP), Florence, Italy, 4–9 May 2014; pp. 5432–5436. [Google Scholar]
- Simonyan, K.; Zisserman, A. Very deep convolutional networks for large-scale image recognition. arXiv 2014, arXiv:1409.1556. [Google Scholar]
- Ioffe, S.; Szegedy, C. Batch normalization: Accelerating deep network training by reducing internal covariate shift. In Proceedings of the International Conference on Machine Learning (PMLR), Lille, France, 7–9 July 2015; pp. 448–456. [Google Scholar]
- Nair, V.; Hinton, G.E. Rectified linear units improve restricted boltzmann machines. In Proceedings of the 27th International Conference on Machine Learning (ICML), Haifa, Israel, 21–24 June 2010. [Google Scholar]
- Dubitzky, W.; Granzow, M.; Berrar, D.P. Fundamentals of Data Mining in Genomics and Proteomics; Springer Science & Business Media: Berlin/Heidelberg, Germany, 2007. [Google Scholar]
- Van Der Maaten, L. Accelerating t-SNE using tree-based algorithms. J. Mach. Learn. Res. 2014, 15, 3221–3245. [Google Scholar]
Figure 1.
We defined four types of sub-activity for each of the three reference activities. Therefore, we defined 12 types of sub-activity in total. In each picture, the green circle represents the start position of the activity and the red arrow connected to the circle represents motion direction. At the right bottom of each picture, the X- Y-, and Z-axis of the controller device space are illustrated. As shown in the figure, the orientations of the controller required to perform sub-activities derived from the same reference activity are different from each other.

Figure 2.
Examples of collected acceleration of VR controller, , in each sub-activity. In all graphs, the x-axis represents time and the y-axis represents the acceleration (m/s). The red, green, and blue represent X, Y, Z signals from the accelerometer, respectively.
Figure 2.
Examples of collected acceleration of VR controller, , in each sub-activity. In all graphs, the x-axis represents time and the y-axis represents the acceleration (m/s). The red, green, and blue represent X, Y, Z signals from the accelerometer, respectively.

Figure 3.
Four sub-activities derived from the Slash show similar zero-gravity accelerations. The red, green and blue represent X, Y, Z signals from the accelerometer, respectively.
Figure 3.
Four sub-activities derived from the Slash show similar zero-gravity accelerations. The red, green and blue represent X, Y, Z signals from the accelerometer, respectively.

Figure 4.
Five steps of GCDA procedure. In all graphs, the x-axis represents time and the y-axis represents the acceleration (m/s). The red, green and blue represent X, Y, Z signals from the accelerometer, respectively.
Figure 4.
Five steps of GCDA procedure. In all graphs, the x-axis represents time and the y-axis represents the acceleration (m/s). The red, green and blue represent X, Y, Z signals from the accelerometer, respectively.

Figure 5.
Our simple CNN architecture. Only two 1D convolutions are used for the feature extraction. Batch normalization and ReLU activation layers are placed at the end of each convolution layer. One fully connected layer with a dropout is placed at the end of our network for the classification. The red, green and blue represent X, Y, Z signals from the accelerometer, respectively.

Figure 6.
The comparison of classification accuracy between six test cases.

Figure 7.
Latent space visualization of original TR (original) and augmented TR (augmented). For generating augmented, gravity rotation and gravity switching are applied to TR.
Figure 7.
Latent space visualization of original TR (original) and augmented TR (augmented). For generating augmented, gravity rotation and gravity switching are applied to TR.


Table 1.
The average accuracy of each augmentation method is measured. Then, accuracy improvement between each augmentation method and baseline is computed.
Table 1.
The average accuracy of each augmentation method is measured. Then, accuracy improvement between each augmentation method and baseline is computed.
| Augmentation Methods | Average Accuracy | Accuracy Improvement |
|---|---|---|
| baseline | 85.21% | +0.00% |
| permutation | 83.61% | −1.61% |
| cropping | 85.13% | −0.08% |
| scaling | 87.43% | +2.21% |
| time-warping | 87.48% | +2.26% |
| magnitude-warping | 87.89% | +2.67% |
| jittering | 88.45% | +3.24% |
| rotation | 90.44% | +5.22% |
| typical-all | 87.44% | +2.23% |
| typical-improve | 92.29% | +7.08% |
Publisher’s Note: MDPI stays neutral with regard to jurisdictional claims in published maps and institutional affiliations. |
© 2021 by the authors. Licensee MDPI, Basel, Switzerland. This article is an open access article distributed under the terms and conditions of the Creative Commons Attribution (CC BY) license (https://creativecommons.org/licenses/by/4.0/).
Share and Cite
MDPI and ACS Style
Han, D.; Lee, C.; Kang, H. Gravity Control-Based Data Augmentation Technique for Improving VR User Activity Recognition. Symmetry 2021, 13, 845. https://doi.org/10.3390/sym13050845
AMA Style
Han D, Lee C, Kang H. Gravity Control-Based Data Augmentation Technique for Improving VR User Activity Recognition. Symmetry. 2021; 13(5):845. https://doi.org/10.3390/sym13050845
Chicago/Turabian StyleHan, Dongheun, Chulwoo Lee, and Hyeongyeop Kang. 2021. "Gravity Control-Based Data Augmentation Technique for Improving VR User Activity Recognition" Symmetry 13, no. 5: 845. https://doi.org/10.3390/sym13050845
Note that from the first issue of 2016, this journal uses article numbers instead of page numbers. See further details here.