Article

Biocrude from Nannochloropsis gaditana by Hydrothermal Liquefaction: An Experimental Design Approach

by
Alejandra Sánchez-Bayo
1,
Irene Megía Hervás
1,2,
Rosalía Rodríguez
1,
Victoria Morales
3,
Luis Fernando Bautista
3,* and
Gemma Vicente
1
1
Department of Chemical, Energy and Mechanical Technology, ESCET, Universidad Rey Juan Carlos, Móstoles, 28933 Madrid, Spain
2
AlgaEnergy S.A. Parque Empresarial La Moraleja, Avda. Europa, 19, Alcobendas, 28108 Madrid, Spain
3
Department of Chemical and Environmental Technology, ESCET, Universidad Rey Juan Carlos, Móstoles, 28933 Madrid, Spain
*
Author to whom correspondence should be addressed.
Appl. Sci. 2021, 11(10), 4337; https://doi.org/10.3390/app11104337
Submission received: 20 April 2021 / Revised: 4 May 2021 / Accepted: 6 May 2021 / Published: 11 May 2021
(This article belongs to the Special Issue Recent Advances in Microalgae Biorefinery Processes)

Abstract

:
The aim of the present work was focused on optimising the yield and quality of the biocrude obtained by hydrothermal liquefaction (HTL) of Nannochloropsis gaditana. Temperature, reaction time and microalga concentration were the variables used to carry out an experimental factorial design with a central composite design. The responses chosen were the biocrude yield and the nitrogen and oxygen content in the biocrude phase. A second-order model was obtained to predict the responses as a function of these variables. Temperature is the most determining factor with a positive influence on biocrude yield. The maximum biocrude yield (42.3 ± 0.8 wt%) was obtained at 320 °C, 10 min of reaction and 10 wt% microalgae concentration, and the nitrogen and oxygen content significantly decreased with respect to their corresponding levels in the initial microalgal biomass. The HHV value of the biocrude was 35.7 MJ/kg. The biocrude was composed of 30% of linear and branched hydrocarbons.

1. Introduction

Most of the world energy needs are met through fossil fuels. However, there is a demand to look for a novel, renewable and sustainable alternative energy source, such as microalgal biofuels [1]. These microorganisms show a great potential to complement fossil fuels to satisfy the energy demand since they have a high growth rate, 100 times faster than conventional biomass, and do not compete with food crops [2,3,4,5].
Microalgae can be easily converted into liquid biocrude through advanced thermal conversion technologies such as the hydrothermal liquefaction process (HTL) [6,7,8]. HTL is a promising technology for wet biomass due to the reduction of microalgae drying energy costs. In addition, HTL does not require an extraction step, and converts the main macromolecules of the microalgal biomass (lipids, proteins and carbohydrates) into products of interest [9]. In contrast, biodiesel can be obtained only from the lipid fraction of the microalgae. HTL is usually carried out at a temperature range of 200 to 350 °C and at pressures between 5 and 25 MPa, with or without catalysts to produce an upgradable biocrude, together with gas, aqueous and solid phases that can be used within a biorefinery either for energy production (biocrude) or in the microalgae culture thereof [10,11,12].
HTL biofuel research is currently focused on optimising the yield, quality and chemical properties of biocrude obtained with microalgae. Biocrude from microalgal HTL shows heating values in the range 30–50 MJ/Kg (HHV), although microalgal biocrude is more viscous and presents higher oxygen and nitrogen contents (1–20 wt% and 1–8 wt%, respectively) [13]. The biomass is hydrolysed into smaller molecules, which repolymerise to form the biocrude phase. This phase is a complex mixture of compounds with broad molecular weight distribution, mainly including linear and branched aliphatic chains, carboxylic acids, esters, aromatic and phenolic compounds, and nitrogen within rings or linear structures [14]. The high nitrogen and oxygen content makes the HTL biocrude not directly suitable for storage and use as a transportation fuel, and it requires subsequent hydrotreatment steps [15]. The yield and composition of the biofuel are affected by operating conditions such as temperature, reaction time, biomass concentration, pressure or the presence of a catalyst [8,10,13,16].
In this work, the biocrude production by HTL from Nannochloropsis gaditana L.M. Lubián was investigated because of its high potential to produce biofuels [17]. A 23 factorial design of experiments (three factors and two levels) was carried out, and the effects of temperature, reaction time and microalgae concentration were assessed to maximise the yield of biocrude and minimise the nitrogen and oxygen content.

2. Materials and Methods

2.1. Microalga Biomass

The microalga selected for this work was N. gaditana supplied by Alga Energy S.A. (Alcobendas, Spain). Its biological composition, the main and trace elements are shown in Table 1.

2.2. Experimental Procedure

The HTL was performed in a 100 mL stainless steel autoclave (EZ-SEAL®, Autoclave Engineers, Erie, PA, USA). In each experiment, the microalga was mixed with deionised water to obtain the desired microalgal concentration (10–50 wt%), and the slurry was added to the reactor. The experiments were performed in the temperature range from 200 to 320 °C during 10 to 180 min. The autoclave was heated following a temperature rate of 10 °C/min through a ceramic jacket. In this work, time zero was considered when the reactor reached the temperature setpoint. The slurry was agitated at 500 rpm during the reaction time, then the autoclave was rapidly cooled down to room temperature. Reactor headspace gases were determined by a gas chromatography Varian CP-4900 MicroGC (Varian Inc., Palo Alto, CA, USA) fitted with a thermal conductivity detector (TCD) connected online to the autoclave reactor. The liquid and solid phases were removed from the reactor. The reaction mixture was collected by rinsing with dichloromethane and vacuum filtered. The solid residue (SR) recovered on the filter was dried at 105 °C for 24 h and weighed. The two liquid phases, i.e., biocrude (B) and water-soluble compounds (WSP), were separated by decantation in a separatory funnel. The dichloromethane and water of the respective phases were evaporated to calculate the corresponding B yield on a dry basis.

2.3. Analytical Methods

A Flash 2000 elemental analyser (Thermo Fisher Scientific, Waltham, MA, USA) equipped with a thermal conductivity detector was used to determine the content of nitrogen and oxygen present in all the biocrudes. This equipment was also used to measure the content of the main elements (carbon, hydrogen, nitrogen, oxygen and sulfur) in the microalgal biomass and in the biocrude obtained at the optimal operating conditions.
The high heating value (HHV) of the optimal biocrude and the microalgal biomass was estimated using the Boie’s model (Equation (1)) [18]:
HHV (MJ/kg) = 0.3516 × C + 1.16225 × H − 0.1109 × O + 0.0628 × N
The element recovery in this biocrude phase was determined and calculated using Equation (2) [19], whereas the energy recovery (ER) of the biocrude oil was defined as Equation (3) [16].
Element Recovery (%) = (Element content in biocrude × Mass of biocrude)/(Element content in microalga × Mass of dry microalga) × 100
ER (%) = (HHV biocrude × mass biocrude)/(HHV microalgae × mass dry matter of microalgae) × 100
The composition of the biocrude at optimal operating conditions was determined by gas chromatography-mass spectrometry (GC–MS) (Bruker 450GC, Bruker Corp., Billerica, MA, USA). The samples were diluted with carbon disulphide and filtered with a 0.45 µm nylon filter. The GC-MS was fitted to a triple quadrupole mass spectrometer detector (Bruker 320 MS, Bruker Corp.,Billerica, MA, USA) operating in electronic impact mode. It was provided with a Rxi-5Sil MS 30 m 0.25 mm ID column (Restek, France). Data acquisition and processing were performed by using Bruker MS Workstation software v.7 (Bruker Corp., Billerica, MA, USA).
For the phase of the water-soluble compounds, the water recovery was calculated considering the mass of water after the reaction with respect to the initial mass of water. In addition, total organic content (TOC) was analysed in a Shimadzu-V equipment (Shimadzu Corp., Kyoto, Japan), and the pH was measured in a Basic 30 pH meter (Crison Instruments, Barcelona, Spain). The composition of this phase was also measured by GC-MS.
The biochemical composition of the microalgal biomass was characterised using the following methods: Bligh and Dyer [20] for lipids, Du Bois [21] for carbohydrates and Lowry [22] for proteins.
Trace elements were quantified by induced plasma atomic emission spectroscopy (ICP-AES), using a Vista AX CCD equipment (Varian Inc., Palo Alto, CA, USA). For its analysis, the sample was treated by acid digestion. For this, 0.1 g of sample was treated with 2 mL of 98% vol. sulfuric acid. and 10 mL of water. The sample was heated on a hot plate until both water and acid were removed, and the resulting solid was calcined using a ramp from 50 °C/min to 750 °C, keeping this temperature for 5 h in a CWF 1300 muffle (Carbolite, Hope, UK). The resulting ash was digested with 2 mL of 98% vol sulfuric acid and 10 mL of 35% vol hydrofluoric acid, heated until the latter was removed (appearance of white fumes), thus obtaining the sample ready for measurement.

2.4. Design of Experiments

The experimental design applied to this study was a 23-factorial design (three factors and two levels). Three central point experiments were included in this design and used as a source for error estimation. The factorial design was accomplished to study the effect of the factors and their interactions on the HTL process. Analysis of variance (ANOVA) was carried out using Statgraphics Centurion XVIII software (Statpoint Technologies Inc., Warrenton, VA, USA). The statistical significance was considered when p-value < 0.05.
The factors studied were temperature (T), reaction time (t) and microalgal concentration (CS) because of their influence on the HTL process [5,10,23,24]. The levels of the factors are shown in Table 2. The biocrude yields are very low at lower temperatures than the minimum level (200 °C) chosen [11]. The maximum design temperature was selected based on the limits allowed by the reactor used (320 °C). The reaction time ranged from 10 to 180 min based on previous experimental studies [4,10,11,25,26]. Finally, microalgal concentration (10–50 wt%) was selected considering the levels reached after harvesting and concentrating the microalgae biomass.
The responses selected in the design of experiments were the yield to biocrude (YB) and the contents of nitrogen (CN) and oxygen (CO) in the biocrude. The main objective of this work was to maximise the production of biocrude from HTL and minimise the contents of nitrogen (CN) and oxygen (CO) in the biocrude to improve its properties [13,27].

3. Results

3.1. HTL Experimental Results

The experimental matrix containing product yields and nitrogen and oxygen contents in the biocrude for all reactions is shown in Table 2. The yield of biocrude was highly variable, within the range 14.67–42.55 wt%, typical values in HTL of microalgae [28,29,30].
The oxygen content values varied between 8.97 and 23.11 wt%, representing a significant reduction concerning the oxygen content in the starting N. gaditana (36.5 wt%). On the other hand, the range of nitrogen content (3.10–6.12 wt%) was smaller than the nitrogen amount of the initial biomass (6.80 wt%). The decreases in the heteroatom content were mainly due to hydrolysis reactions and the formation of new molecules, both soluble in aqueous and gaseous media [31].

3.2. Statistical and Technological Models

Experimental results of biocrude yield and contents of nitrogen and oxygen in the biocrude were fitted to nonlinear multiple regression analysis, assuming a second-order polynomial model. The statistical models (Equations (4)–(6)) were obtained from the coded factors (Xi) on a dimensionless scale (−1, 0, 1) and provided information on the real influence of each variable within the HTL process. On the other hand, the technological models (Equations (7)–(9)) were obtained from the actual temperature (T), reaction time (t), and microalga concentration (CS) in their correspondent units within the experimental ranges studied.
Statistic model:
YB (%) = 29.96 + 12.65 XT − 0.84 Xt + 0.52 XCS − 3.32 XT2 − 2.38 XTXt + 0.41 XTXCS − 0.65 Xt2 + 1.05 XtXCS + 0.84 XCS2 (r2 = 0.994)
CO (%) = 5.97 + 0.71 XT − 0.22 Xt − 0.031 XCS − 0.067 XT2 − 0.34 XTXt − 0.21 XTXCS − 0.61 Xt2 + 0.24 XtXCS − 0.37 XCS2 (r2 = 0.867)
CN (%) = 12.79 − 3.25 XT − 1.36 Xt + 0.14 XCS + 4.81 XT2 + 2.22 XTXt + 0.31 XTXCS − 0.10 Xt2 + 0.37 XtXCS − 1.92 XCS2 (r2 = 0.743)
Technological model:
YB (%) = 27.96 + 0.59 T − 0.26 t + 0.91 CS − 8·10−4T2 + 5·10-5T·t + 3·10-4T·CS − 3·10−4t2 + 3·10−3 t·CS − 0.01 CS2 (r2 = 0.994)
CO (%) = 2.69 + 8·10−3 T + 4·10−3 t + 0.07 CS − 3·10−5 T2 + 5·10−5 T·t + 2·10−4 T·CS − 1·10−4 t2 + 2·10−4 t·CS − 0.02 CS2 (r2 = 0.867)
CN (%) = 127.7 − 0.8 T − 0.13 t + 0.1 CS − 1·10−3 T2 + 4·10−4 T·t + 3·10−4 T·CS − 1·10−5 t2 +2·10−4 t·CS − 5·10−3 CS2 (r2 = 0.743)
For each response, the second-order models can be plotted as three contour graphs representing the response (biocrude yield, and nitrogen and oxygen contents in the biocrude) by statistic model. Figure 1 shows the response surfaces for the values predicted by these models for the biocrude yield (a), nitrogen content (b) and oxygen content (c), as a function of two of the three variables, leaving the third fixed at the central point (T = 260 °C, t = 10 min, CS = 30 wt%).

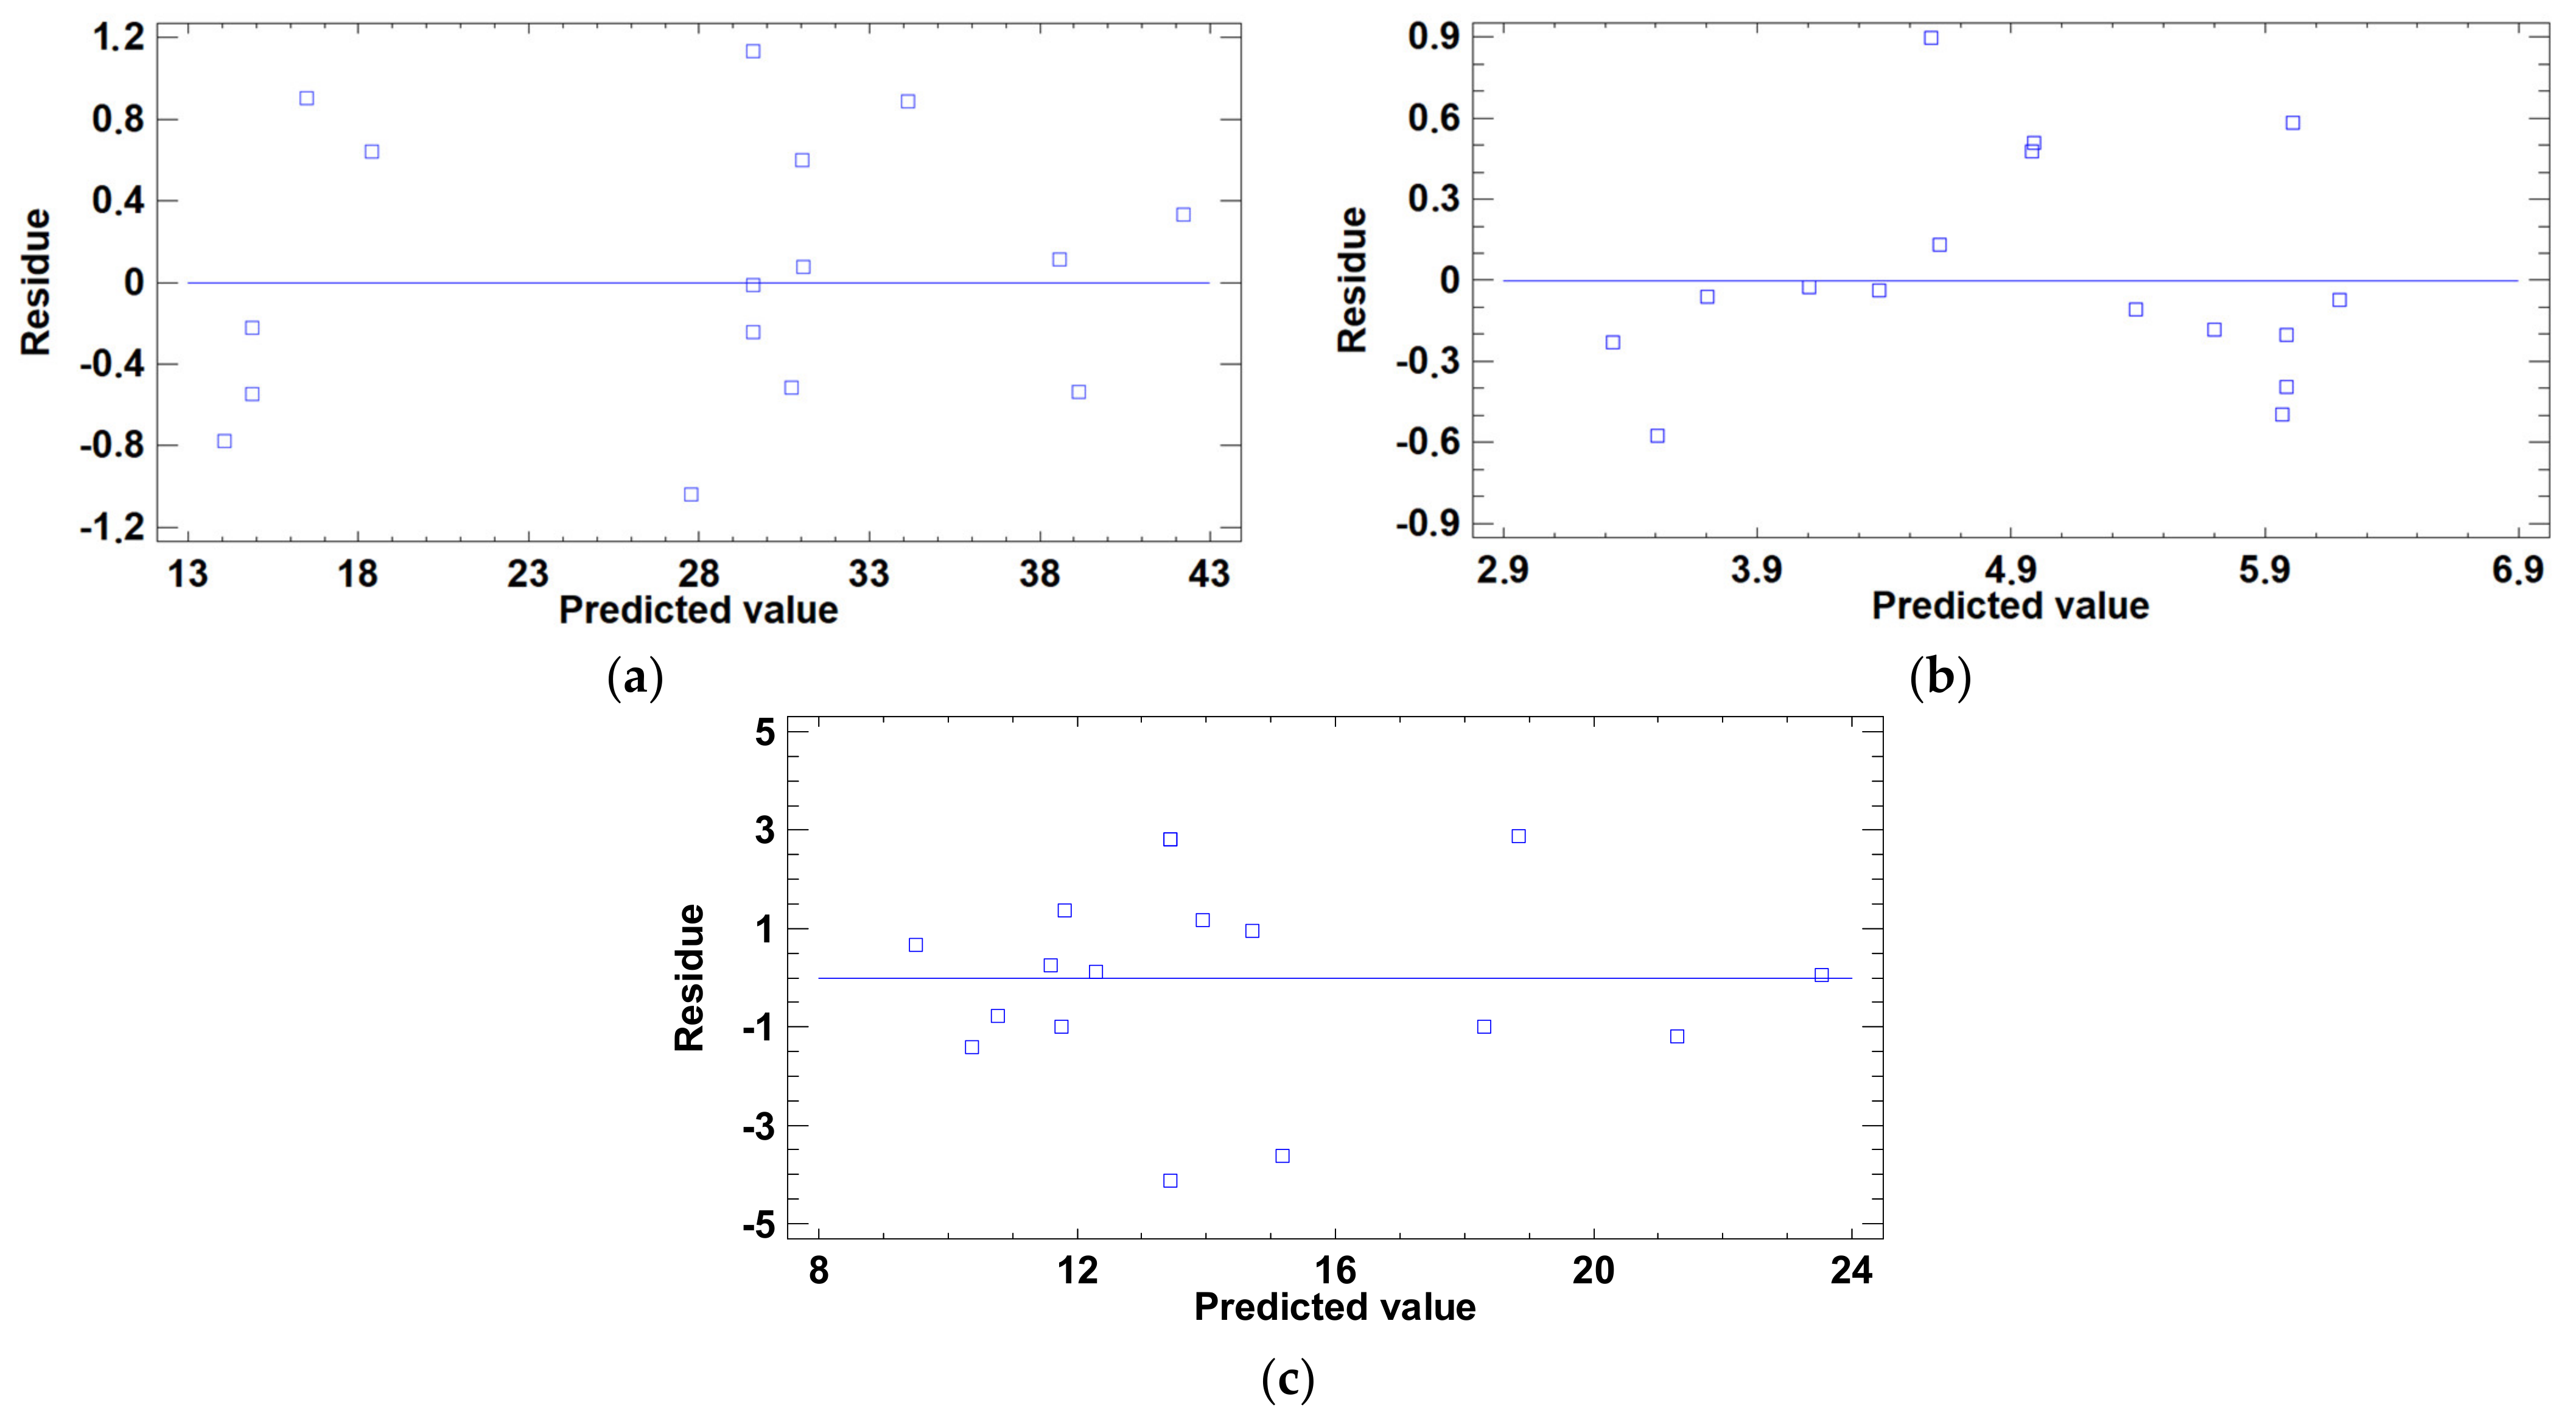
3.3. Estimation of Experimental Error

The goodness of fit of the model was checked using a residual analysis for the different responses. In Figure 2, the residuals of the experimental design are represented with respect to the theoretical results achieved by the nonlinear models (Equations (4)–(6)). As can be seen, the residuals for each response were lower than 5 wt% (biocrude yield: <1.2 wt%, N content <1 wt% and O content <4 wt%), which indicates that the experimental results did not differ significantly from the results predicted by the models. The results also showed no trend indicating systematic experimental errors, so it can be concluded that the selected quadratic model is adequate to adjust the experimental results.

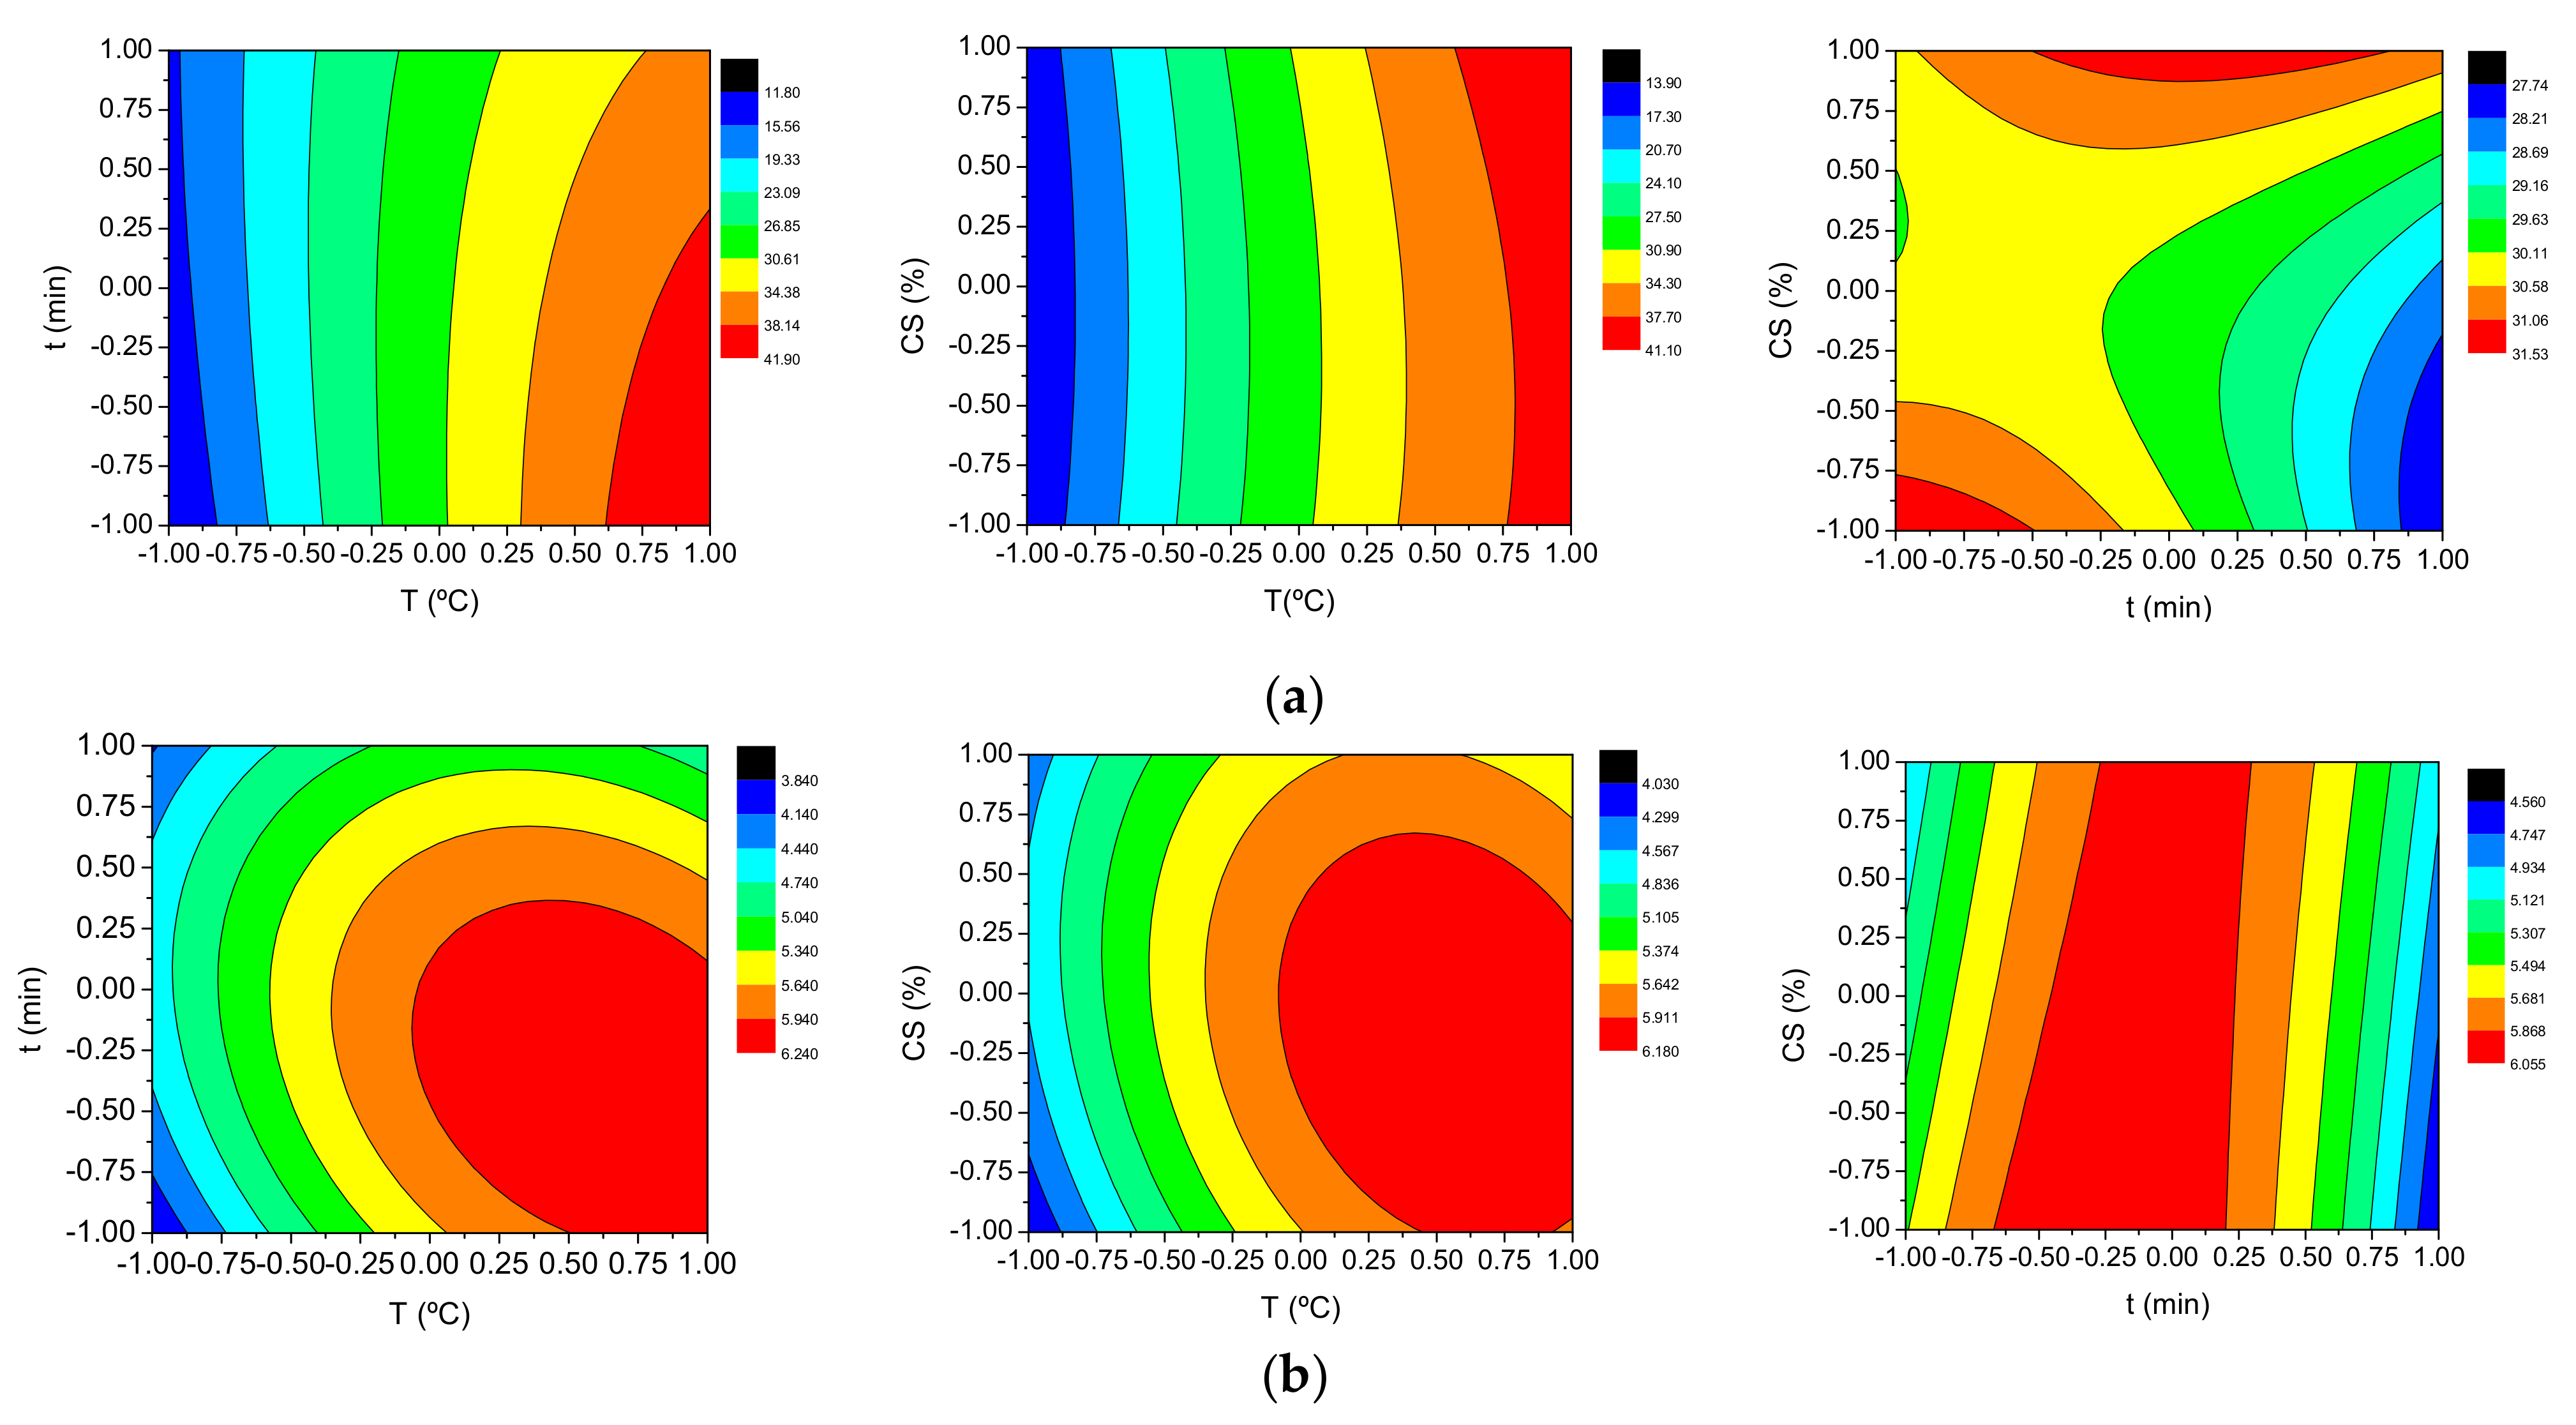
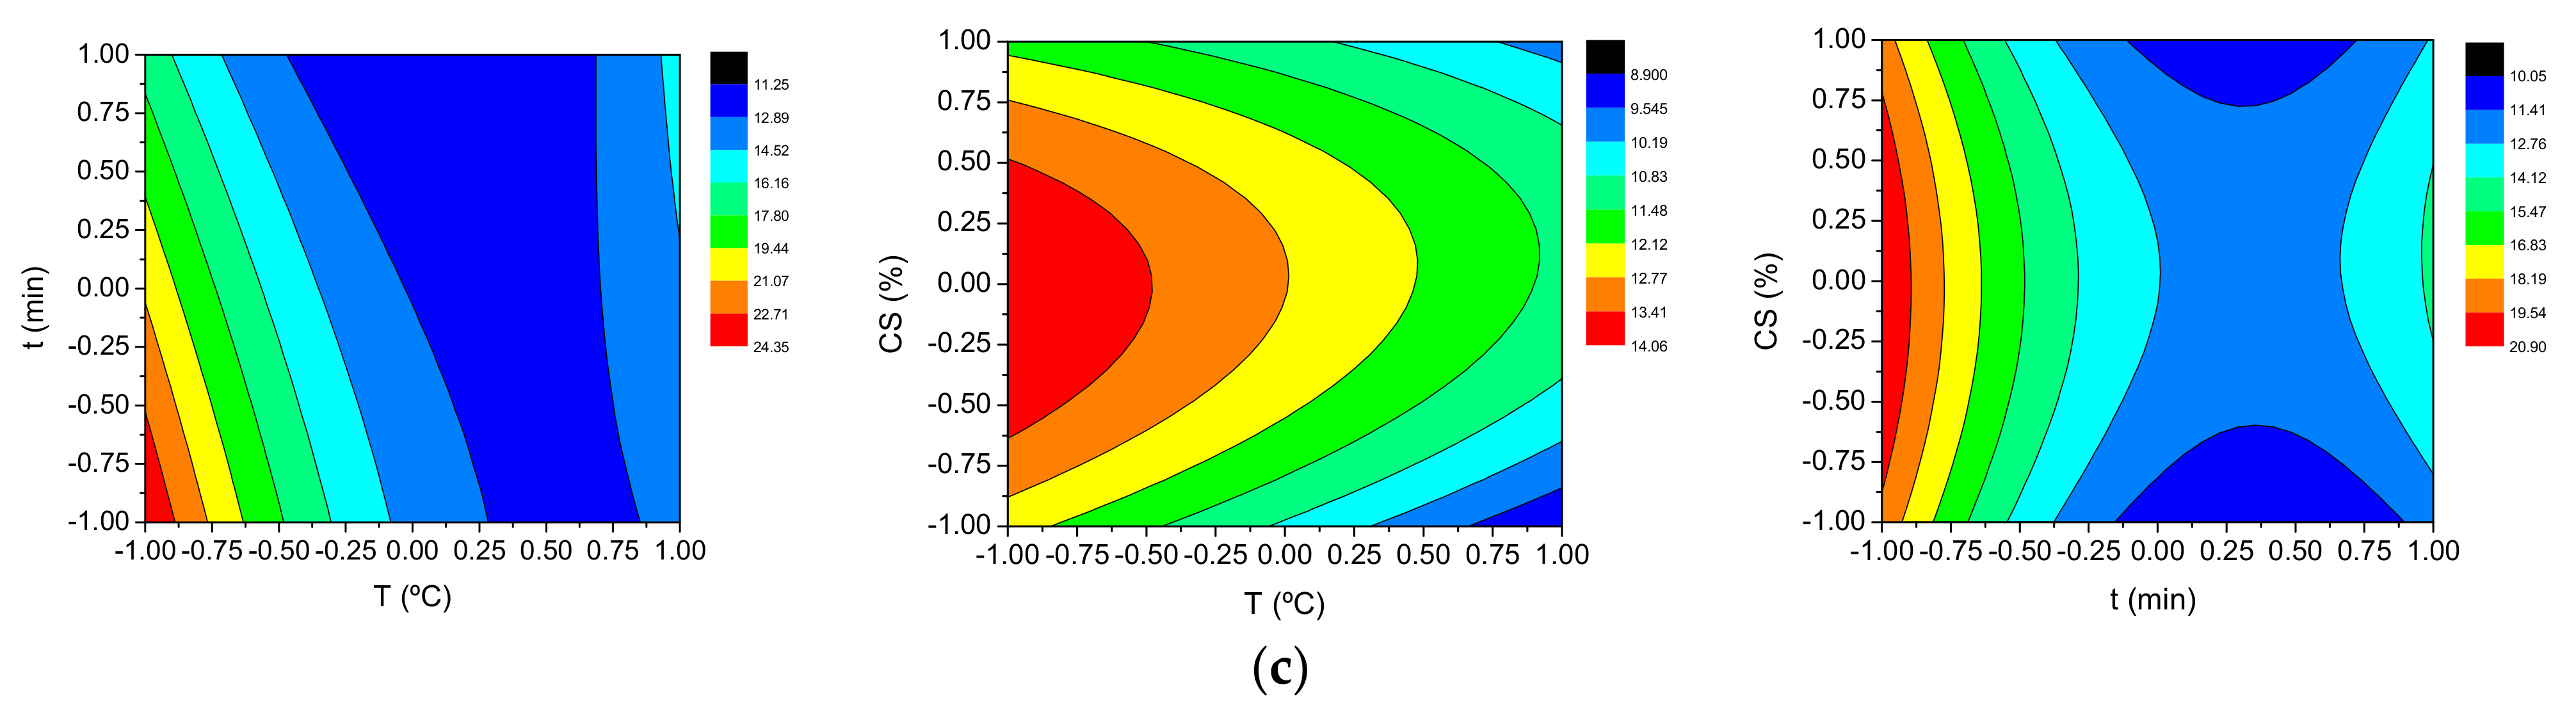
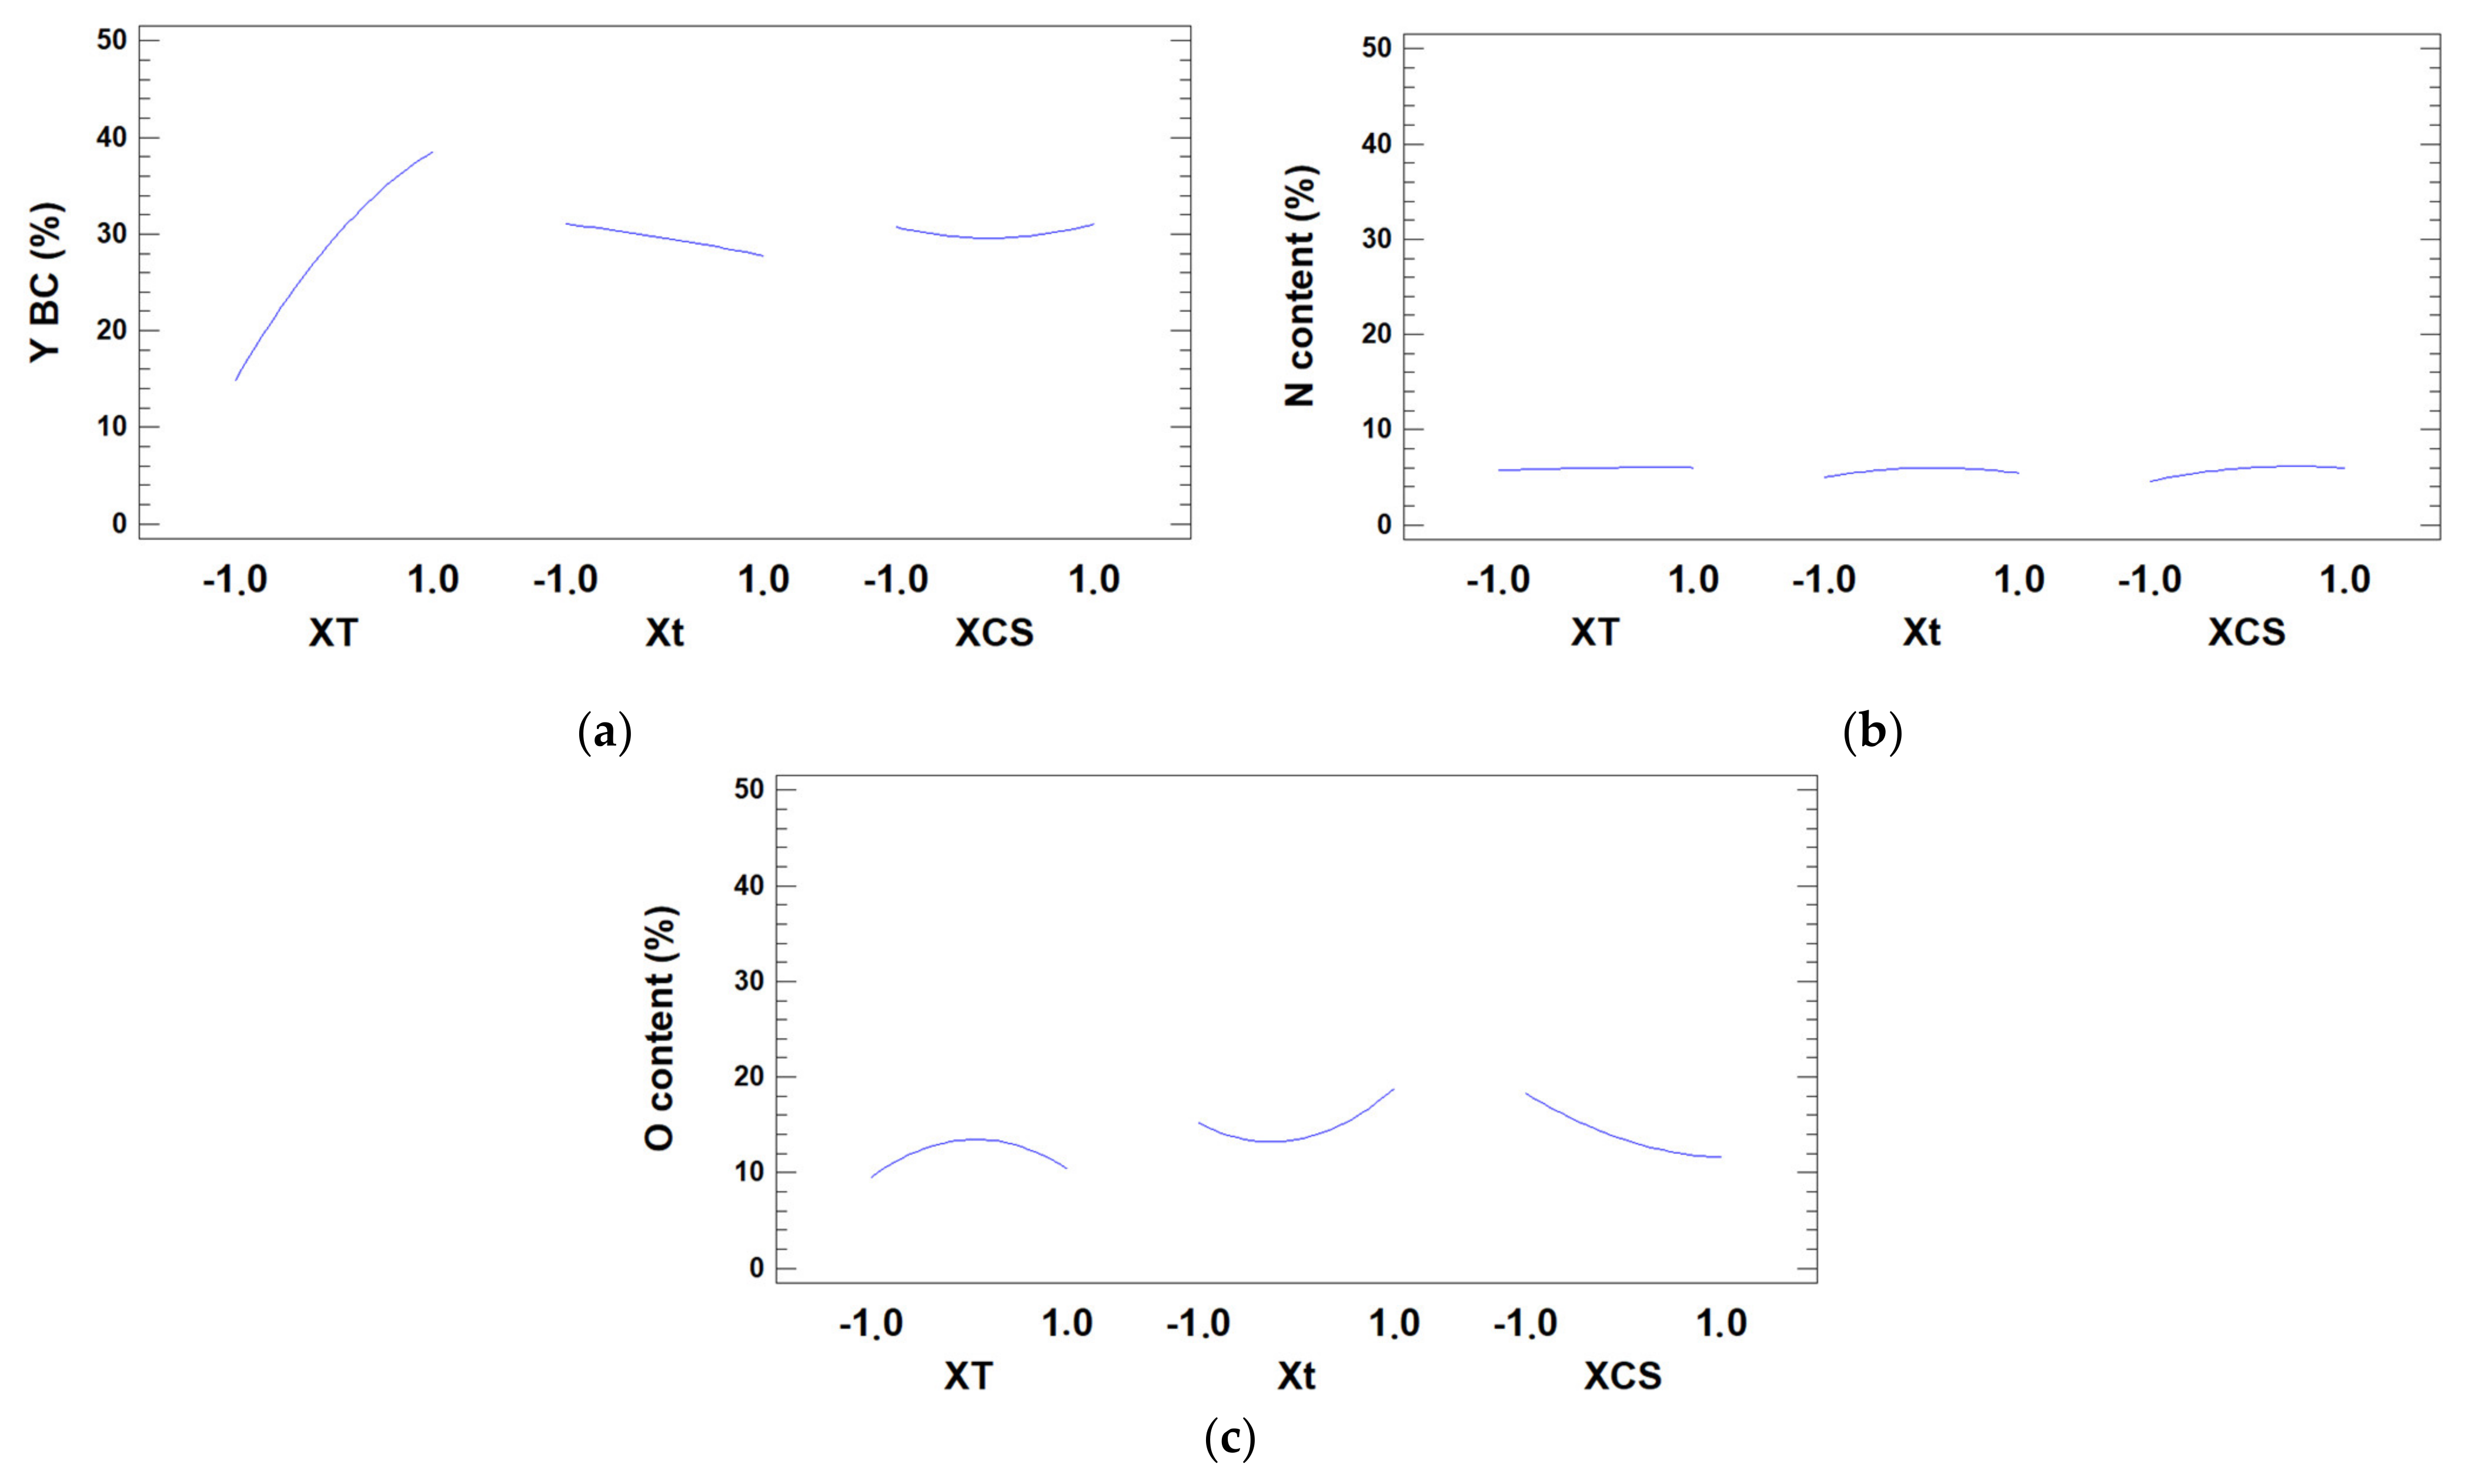
3.4. Influence of the Factors on the Reponses

From the second-order models (Equations (4)–(6)), the influence of each factor on the responses (biocrude yield, and nitrogen and oxygen contents in the biocrude) was represented (Figure 3), and the binary interactions between factors were plotted in Figure 4. Besides, ANOVA analysis (Tables S1–S3, in Supplementary Materials) showed the significant factors and interactions within 95% confidence intervals.
Considering the effect of the three factors on the biocrude yield, Figure 3a shows how the temperature (XT) was a significant factor (p-value = 0.000) and positively influenced the biocrude yield. Therefore, higher yields were obtained at high temperatures. This result is consistent with that described by other authors [27]. Reaction time (Xt) had a significant influence (p-value = 0.0013). However, in this case, the biocrude yield decreased as the reaction time increased. On the other hand, the influence of the biomass concentration (XCS) on the biocrude yield was not significant (p-value = 0.6177). For biocrude yield, the binary interactions of temperature with reaction time and biomass concentration and reaction time-biomass concentration (XTXt, XTXCS and XtXCS, respectively) (Figure 4a) had p values < 0.05 (0.0061, 0.0487, and 0.0042, respectively) and, therefore, they had a significant influence on the response. The binary interaction temperature-reaction time (XTXt) showed a negative influence, while the interactions between temperature-biomass concentration and reaction time-biomass concentration (XTXCS and XtXCS, respectively) were positive. Regarding nonlinearity, only the quadratic term of temperature (XT2) was significant (p-value = 0.0023), with a positive influence on the biocrude yield.
Considering the nitrogen content (Figure 3b), only the main effect of the biomass concentration (XCS) can be regarded as significant (p-value = 0.0087). An increase in the biomass concentration generated a higher concentration of nitrogen in the biocrude, which negatively affects the quality of the biocrude. Besides, the temperature and reaction time did not show a significant effect on the N content (p-value = 0.4511 and 0.3316, respectively). In addition, the binary interactions and the quadratic terms for the nitrogen content (Figure 4b) were not significant (p-values > 0.05).
In the same way, the main factor corresponding to the biomass concentration (XCS) exerted a significant effect (p-value = 0.0101) on the content of oxygen in the biocrude (Figure 3c and Figure 4c), which had a positive impact in reducing the content of this heteroatom in the biocrude, increasing its quality. The results of the ANOVA analysis showed that both the binary interactions and the quadratic terms were not significant since they had p values > 0.05.

3.5. Optimal of Biocrude Production

Table 3 shows the theoretical value based on the adjustments obtained in the statistical equations of the three responses (Equations (4)–(6)). The results showed that the operating conditions maximising biocrude yield and those minimising nitrogen and oxygen contents were not coincident. Therefore, it was decided to continue with the conditions that maximise biocrude yield since it is possible to reduce the heteroatoms with subsequent treatments. According to Table 3, the values that maximised the biocrude yield were: 320 °C, 10 min and a biomass concentration of 10 wt%.
Table 4 shows the yields of the different phases obtained under optimal conditions. The biocrude yield, obtained at the optimal conditions, was 42.3 ± 0.8 wt%, similar to the theoretical result predicted by the model, and comparable to the results found in the literature at similar operating conditions without the use of catalysts (34.4 wt% at 250 °C and 54.2 wt% at 375 °C) [2]. The yield of the gas phase obtained at 320 °C was 18 ± 2 wt%, lower than the 30 wt% measured by Reddy et al. at the same temperature [32]. On the other hand, the value of the yield of WSP was 32 ± 1 wt%. This value was lower than that obtained by Valdez at the same time and similar temperatures (43 wt%) [33]. Regarding the solid residue, the yield obtained was 7.42 ± 0.08 wt%, which is within the usual ranges for this fraction in other microalgae systems [32,33]. This solid residue value was slightly higher than the ash value of the starting biomass (5 wt%), indicating no biomass was left to convert.
The calorific value of the biocrude obtained at the optimum conditions was 35.74 ± 0.02 MJ/Kg. This value was within the range of microalgal biocrudes reported in the literature (30–43 MJ/Kg) [9], and supposed an increase of the calorific power with respect to the microalgae biomass (21.75 MJ/Kg). The energy recovered (63 wt%) was comparable to the values reported in the literature (50–75 wt%) [4,34].
The biocrude analysis showed a carbon content of 73.71 ± 0.08 wt% (Table S4, Supplementary Materials), and 40% of the carbon contained in the starting raw biomass was recovered in that phase. The hydrogen content was 9.18 ± 0.01 wt%, which represented a recovery of 43 wt% in the biocrude. Consistently, the recovery of both carbon and hydrogen was similar since they are generally found in the same compounds. Part of the new molecules formed after the HTL process are soluble in water and, therefore, go to WSP [31]. Regarding heteroatoms, the composition of N and O were 6.12 ± 0.02 wt% and 10.77 ± 0.16 wt%, respectively. These values meant that elimination in biocrude, with respect to the starting biomass, reached 59.5 wt% for nitrogen and 61.92 wt% for oxygen. A low sulfur content (0.32 ± 0.02 wt%) was also measured. The high elimination of nitrogen, oxygen and sulfur in the biocrude produces an improvement in its quality and simplifies their subsequent downstream processing [3]. These values for HCNSO obtained are comparable to those collected by Barreiro et al. for the same microalga at slightly higher temperatures, 375 °C, (9.9 wt%, 74.7 wt%, 5.2 wt%, 0.4 wt% and 8.5 wt% for H, C, N, S and O, respectively) [2].
Biocrude properties are highly dependent on H/C, N/C and O/C atomic ratios. The Van Krevelen diagram shown in Figure 5 shows the values of these atomic ratios in the biocrude obtained at the optimal operating conditions and the starting biomass. The O/C and N/C ratios of the biocrude (0.998 and 0.120, respectively) were remarkably lower than the value of these ratios in the starting microalga (0.9993 and 0.11968, respectively) since N and O compounds are mainly recovered in the aqueous phase. The H/C ratio of the biocrude was also lower than in the initial biomass (1.753) because of the production of water-soluble compounds. These results were similar to those obtained by Tang et al. at 300 °C and 60 min [31]. These authors proposed a consecutive treatment of the product to remove the nitrogen and oxygen entirely.
The organic compounds of the biocrude obtained at the selected optimum operating conditions were determined by GC-MS analysis and grouped into families (Figure 6). The hydrocarbon content in the biocrude was remarkable high (30%), mainly consisting of linear and branched hydrocarbons, with some unsaturations. In comparison, aromatics only accounted for 3% of the total compounds in the biocrude. The hydrocarbon content was higher than that obtained by Li et al. at 260 °C and 60 min of reaction with N. gaditana (28% linear and branched and 0% aromatic hydrocarbons) [19] and those obtained by Tang et al. (<5%) a 300 °C and 60 min for the same biomass [31]. However, the results showed a high content of nitrogen compounds, mainly nitriles (23%), amides (4%) and amines (2%). These compounds were formed after protein hydrolysis [5,31,35]. A ketone content of 25% was measured, explaining the relatively high amount of oxygen in the biocrude.
The volatility of the biocrude was measured by the simulated distillation analysis (Figure 7). The biocrude showed temperatures of 450, 497 and 530 °C for the evaporation of 65, 85 and 95%, respectively. These temperatures were higher than those of a reference type C diesel fulfilling the European regulations (EN-590 standard), i.e., 250, 350 and 370 °C, respectively. Therefore, a post-treatment is necessary to lower the boiling point to make it suitable for heating fuel.
In the water-soluble phase, the recovery of water after the separation of the different fractions was 90 wt%. The pH of this fraction was 8.4 due to the presence of basic compounds formed during the reaction [36]. The carbon content was 1283 ± 4 mg/L, due to soluble organic compounds. It is noteworthy that this phase contained most (>85%) of the metals (Na, K, Mg, Fe) and P from the starting biomass, except for Ca, the content of which in the WSP corresponded to 1 wt% of the initial content in the microalgae. The organic compounds present in the water phase were determined by GC-MS analysis. The results showed a high content of nitrogen compounds (35% amides and 10% amines) from the hydrolysis of proteins and a high content of organic acids (45%), mainly formed by the recombination of molecules produced by hydrolysis and decarboxylation [5,31,35].
The solid residue was a minor phase. It consisted principally of the ashes and minority elements present in the microalga, leaving a small part of the starting microalgae composed mostly of carbon [14].
Finally, the gas phase was composed of CO2 (>95% mol), whereas light hydrocarbons (C2–C4) (<1% mol) and hydrogen (0.2% mol) were detected at low concentrations, similar to values reported in the literature for this microalga [13].

4. Conclusions

The present work studied the effect of temperature, reaction time and microalga concentration to assess and optimise the yield and quality of the biocrude produced by HTL from N. gaditana. A second-order mathematical model with a high degree of confidence was obtained for the three responses chosen, i.e., biocrude yield and nitrogen and oxygen content. Temperature showed a positive effect and was the most significant factor affecting biocrude yield, where the three binary interactions and the quadratic effect of temperature were also significant factors. On the other hand, for the responses of the content of N and O, the only significant factor was the concentration of biomass, which negatively affected the N content and positively the O content. The experimental design results showed that the maximum production of biocrude (43.08 wt%) was attained at 320 °C, 10 min and 10% of microalga, yielding a product with an HHV of 35.74 MJ/kg. Considering the quality of the biocrude obtained under these conditions, it had a low content of N (6.12 wt%) and O (10.77 wt%) as well as a low content of trace elements with respect to the starting microalgal biomass. It is essential to highlight the high content of hydrocarbons (30%) in the HTL biocrude, making it suitable as liquid biofuel after further upgrading.

Supplementary Materials

The following are available online at https://www.mdpi.com/article/10.3390/app11104337/s1, Table S1: ANOVA for biocrude response. Table S2: ANOVA for N content response. Table S3: ANOVA for O content response. Table S4: Elemental composition of biocrude at 320 °C, 10 min and 10 wt% of biomass.

Author Contributions

Conceptualisation, G.V. and L.F.B.; methodology, A.S.-B. and I.M.H.; validation, R.R. and V.M.; formal analysis, A.S.-B.; investigation, A.S.-B.; resources, A.S.-B. and I.M.H.; data curation, R.R. and V.M.; writing—original draft preparation, A.S.-B. and I.M.H.; writing—review and editing, G.V. and L.F.B.; supervision, G.V. and L.F.B. and funding acquisition, G.V. and L.F.B. All authors have read and agreed to the published version of the manuscript.

Funding

This research was financed by the Comunidad de Madrid through the ALGATEC-CM projects (P2018/BAA-4532) and the industrial doctorate with the company AlgaEnergy (IND2017/IND). Additionally, it was partially funded by the Ministry of Economy and Competitiveness of Spain through the BIOHIDROALGA project (ENE2017-83696-R).

Institutional Review Board Statement

Not applicable.

Informed Consent Statement

Not applicable.

Acknowledgments

The authors acknowledge the work carried out by the laboratory technicians: Silvia Melero in the autoclave reactor maintenance work, Jorge W. Parra in the elemental analysis and Mónica Sobrino in the GC-MS analysis.

Conflicts of Interest

The authors declare no conflict of interest.

References

  1. Brennan, L.; Owende, P. Biofuels from microalgae—A review of technologies for production, processing, and extractions of biofuels and co-products. Renew. Sustain. Energy Rev. 2010, 14, 557–577. [Google Scholar] [CrossRef]
  2. López Barreiro, D.; Zamalloa, C.; Boon, N.; Vyverman, W.; Ronsse, F.; Brilman, W.; Prins, W. Influence of strain-specific parameters on hydrothermal liquefaction of microalgae. Bioresour. Technol. 2013, 146, 463–471. [Google Scholar] [CrossRef]
  3. Biller, P.; Ross, A.B. Potential yields and properties of oil from the hydrothermal liquefaction of microalgae with different biochemical content. Bioresour. Technol. 2011, 102, 215–225. [Google Scholar] [CrossRef]
  4. Huang, Y.; Chen, Y.; Xie, J.; Liu, H.; Yin, X.; Wu, C. Bio-oil production from hydrothermal liquefaction of high-protein high-ash microalgae including wild Cyanobacteria sp. and cultivated Bacillariophyta sp. Fuel 2016, 183, 9–19. [Google Scholar] [CrossRef]
  5. Vo, T.K.; Lee, O.K.; Lee, E.Y.; Kim, C.H.; Seo, J.-W.W.; Kim, J.; Kim, S.-S.S. Kinetics study of the hydrothermal liquefaction of the microalga Aurantiochytrium sp. KRS101. Chem. Eng. J. 2016, 306, 763–771. [Google Scholar] [CrossRef]
  6. Elliott, D.C. Historical Developments in Hydroprocessing Bio-oils. Energy Fuels 2007, 21, 1792–1815. [Google Scholar] [CrossRef]
  7. Elliott, D.C.; Biller, P.; Ross, A.B.; Schmidt, A.J.; Jones, S.B. Hydrothermal liquefaction of biomass: Developments from batch to continuous process. Bioresour. Technol. 2015, 178, 147–156. [Google Scholar] [CrossRef] [Green Version]
  8. Megía-Hervás, I.; Sánchez-Bayo, A.; Bautista, L.F.; Morales, V.; Witt-Sousa, F.G.; Segura-Fornieles, M.; Vicente, G. Scale-up cultivation of Phaeodactylum tricornutum to produce biocrude by hydrothermal liquefaction. Processes 2020, 8, 1072. [Google Scholar] [CrossRef]
  9. Xu, D.; Lin, G.; Guo, S.; Wang, S.; Guo, Y.; Jing, Z. Catalytic hydrothermal liquefaction of algae and upgrading of biocrude: A critical review. Renew. Sustain. Energy Rev. 2018, 97, 103–118. [Google Scholar] [CrossRef]
  10. López Barreiro, D.; Prins, W.; Ronsse, F.; Brilman, W. Hydrothermal liquefaction (HTL) of microalgae for biofuel production: State of the art review and future prospects. Biomass Bioenergy 2013, 53, 113–127. [Google Scholar] [CrossRef]
  11. Gu, X.; Martinez-Fernandez, J.S.; Pang, N.; Fu, X.; Chen, S. Recent development of hydrothermal liquefaction for algal biorefinery. Renew. Sustain. Energy Rev. 2020, 121, 109707. [Google Scholar] [CrossRef]
  12. Dandamudi, K.P.R.; Muppaneni, T.; Markovski, J.S.; Lammers, P.; Deng, S. Hydrothermal liquefaction of green microalga Kirchneriella sp. under sub- and super-critical water conditions. Biomass Bioenergy 2019, 120, 224–228. [Google Scholar] [CrossRef]
  13. Gollakota, A.R.K.; Kishore, N.; Gu, S. A review on hydrothermal liquefaction of biomass. Renew. Sustain. Energy Rev. 2018, 81, 1378–1392. [Google Scholar] [CrossRef]
  14. Filipe, R.; Hu, Y.; Shui, H.; Charles, C. Biomass and Bioenergy Hydrothermal liquefaction of biomass to fuels and value-added chemicals: Products applications and challenges to develop large-scale operations. Biomass Bioenergy 2020, 135, 105510. [Google Scholar] [CrossRef]
  15. Patel, B.; Arcelus-Arrillaga, P.; Izadpanah, A.; Hellgardt, K. Catalytic Hydrotreatment of algal biocrude from fast Hydrothermal Liquefaction. Renew. Energy 2017, 101, 1094–1101. [Google Scholar] [CrossRef]
  16. Sánchez-Bayo, A.; Rodríguez, R.; Morales, V.; Nasirian, N.; Bautista, L.F.L.F.; Vicente, G. Hydrothermal liquefaction of microalga using metal oxide catalyst. Processes 2020, 8, 15. [Google Scholar] [CrossRef] [Green Version]
  17. Lubian, L.M. Nannochloropsis gaditana sp. nov., una nueva Eustigmatophyceae marina. Lazaroa 1982, 293, 287–293. [Google Scholar]
  18. López Barreiro, D.; Samorì, C.; Terranella, G.; Hornung, U.; Kruse, A.; Prins, W. Assessing microalgae biorefinery routes for the production of biofuels via hydrothermal liquefaction. Bioresour. Technol. 2014, 174, 256–265. [Google Scholar] [CrossRef]
  19. Li, H.; Liu, Z.; Zhang, Y.; Li, B.; Lu, H.; Duan, N.; Liu, M.; Zhu, Z.; Si, B. Conversion efficiency and oil quality of low-lipid high-protein and high-lipid low-protein microalgae via hydrothermal liquefaction. Bioresour. Technol. 2014, 154, 322–329. [Google Scholar] [CrossRef]
  20. Bligh, E.G.; Dyer, W.J. A rapid method of total lipid extraction and purification. Can. J. Biochem. Physiol. 1959, 37, 911–917. [Google Scholar] [CrossRef] [Green Version]
  21. DuBois, M.; Gilles, K.A.; Hamilton, J.K.; Rebers, P.A.; Smith, F. Colorimetric method for determination of sugars and related substances. Anal. Chem. 1956, 28, 350–356. [Google Scholar] [CrossRef]
  22. Lowry, O.H.; Rosebrough, N.J.; Lewis Farr, A.; Randall, R.J. Protein measurement with the Folin phenol reagent. Anal. Biochem. 1951, 217, 220–230. [Google Scholar] [CrossRef]
  23. Tian, C.; Li, B.; Liu, Z.; Zhang, Y.; Lu, H. Hydrothermal liquefaction for algal biorefinery: A critical review. Renew. Sustain. Energy Rev. 2014, 38, 933–950. [Google Scholar] [CrossRef]
  24. Arvindnarayan, S.; Sivagnana Prabhu, K.K.; Shobana, S.; Kumar, G.; Dharmaraja, J. Upgrading of micro algal derived bio-fuels in thermochemical liquefaction path and its perspectives: A review. Int. Biodeterior. Biodegrad. 2017, 119, 260–272. [Google Scholar] [CrossRef]
  25. Xu, D.; Savage, P.E. Effect of reaction time and algae loading on water-soluble and insoluble biocrude fractions from hydrothermal liquefaction of algae. Algal Res. 2015, 12, 60–67. [Google Scholar] [CrossRef] [Green Version]
  26. Kumar, M.; Olajire Oyedun, A.; Kumar, A. A review on the current status of various hydrothermal technologies on biomass feedstock. Renew. Sustain. Energy Rev. 2018, 81, 1742–1770. [Google Scholar] [CrossRef]
  27. Chen, W.-H.; Lin, B.-J.; Huang, M.-Y.; Chang, J.-S. Thermochemical conversion of microalgal biomass into biofuels: A review. Bioresour. Technol. 2014, 184, 314–327. [Google Scholar] [CrossRef] [PubMed]
  28. Hu, Y.; Gong, M.; Feng, S.; Xu, C.; Bassi, A. A review of recent developments of pre-treatment technologies and hydrothermal liquefaction of microalgae for bio-crude oil production. Renew. Sustain. Energy Rev. 2019, 101, 476–492. [Google Scholar] [CrossRef]
  29. Sun, J.; Yang, J.; Shi, M. Review of Denitrogenation of Algae Biocrude Produced by Hydrothermal Liquefaction. Trans. Tianjin Univ. 2017, 23, 301–314. [Google Scholar] [CrossRef] [Green Version]
  30. Mathimani, T.; Mallick, N. A review on the hydrothermal processing of microalgal biomass to bio-oil—Knowledge gaps and recent advances. J. Clean. Prod. 2019, 217, 69–84. [Google Scholar] [CrossRef]
  31. Tang, X.; Zhang, C.; Li, Z.; Yang, X. Element and chemical compounds transfer in bio-crude from hydrothermal liquefaction of microalgae. Bioresour. Technol. 2015, 202, 8–14. [Google Scholar] [CrossRef] [PubMed]
  32. Reddy, H.K.; Muppaneni, T.; Ponnusamy, S.; Sudasinghe, N.; Pegallapati, A.; Selvaratnam, T.; Seger, M.; Dungan, B.; Nirmalakhandan, N.; Schaub, T.; et al. Temperature effect on hydrothermal liquefaction of Nannochloropsis gaditana and Chlorella sp. Appl. Energy 2016, 165, 943–951. [Google Scholar] [CrossRef] [Green Version]
  33. Valdez, P.J.; Nelson, M.C.; Wang, H.Y.; Lin, X.N.; Savage, P.E. Hydrothermal liquefaction of Nannochloropsis sp.: Systematic study of process variables and analysis of the product fractions. Biomass Bioenergy 2012, 46, 317–331. [Google Scholar] [CrossRef]
  34. Neveux, N.; Yuen, A.K.L.; Jazrawi, C.; Magnusson, M.; Haynes, B.S.; Masters, A.F.; Montoya, A.; Paul, N.A.; Maschmeyer, T.; de Nys, R. Biocrude yield and productivity from the hydrothermal liquefaction of marine and freshwater green macroalgae. Bioresour. Technol. 2014, 155, 334–341. [Google Scholar] [CrossRef] [PubMed]
  35. Madsen, R.B.; Zhang, H.; Biller, P.; Goldstein, A.H.; Glasius, M. Characterizing Semivolatile Organic Compounds of Biocrude from Hydrothermal Liquefaction of Biomass. Energy Fuels 2017, 31, 4122–4134. [Google Scholar] [CrossRef] [Green Version]
  36. Barreiro, D.L.; Gómez, B.R.; Hornung, U.; Kruse, A.; Prins, W. Hydrothermal Liquefaction of Microalgae in a Continuous Stirred-Tank Reactor. Energy Fuels 2015, 29, 6422–6432. [Google Scholar] [CrossRef]
Figure 1. Contour graphs for the thermal HTL process carried out with N. gaditana biomass. (a) biocrude yield (%), (b) nitrogen content (wt%) in the biocrude, and (c) oxygen content (wt%) in the biocrude. Fixed variable in the central point: T = 260 °C, t = 10 min, CS = 30 wt%.
Applsci 11 04337 g001aApplsci 11 04337 g001b
Figure 2. Residual analysis against the values obtained from the mathematical models for the responses: (a) biocrude yield, (b) nitrogen content in the biocrude and (c) oxygen content in the biocrude.
Applsci 11 04337 g002
Figure 3. Effect of main factors on (a) biocrude yield, (b) nitrogen content in the biocrude and (c) oxygen content in the biocrude.
Applsci 11 04337 g003
Figure 4. Binary interactions for: (a) biocrude yield, (b) nitrogen content and (c) oxygen content.
Applsci 11 04337 g004
Figure 5. Van Krevelen diagram: (a) O/C-H/C and (b) N/C-H/C from N. gaditana () and biocrude obtained under optimal conditions: 320 °C, 10 min and 10% of biomass ().
Applsci 11 04337 g005
Figure 6. Chemical composition of biocrude obtained at 320 °C, 10 min and 10 wt% of microalgae.
Applsci 11 04337 g006
Figure 7. Simulated distillation of biocrude obtained at 320 °C, 10 min and 10 wt% of biomass ().
Applsci 11 04337 g007
Table 1. Composition of N. gaditana.
Biological CompositionElemental CompositionTrace Element Composition
Lipids (wt%)35.5 ± 1.2H (wt%)7.1 ± 0.2Na (mg/g)21.00 ± 2.01
Proteins (wt%)43.8 ± 3.5C (wt%)48.7 ± 0.1K (mg/g)3.53 ± 0.09
Carbohydrates (wt%)15.7 ± 3.6N (wt%)6.80 ± 0.04Mg (mg/g)0.90 ± 0.03
Ashes (wt%)4.5 ± 0.8S (wt%)0.90 ± 0.04Ca (mg/g)0.08 ± 0.01
O (wt%)36.5 ± 0.20P (mg/g)6.43 ± 0.02
Table 2. Experimental design matrix and experimental results.
Exp.XTXtXCST
(°C)
t
(min)
CS 1 (wt%)YB 2
(wt%)
CO 3
(wt%)
CN 4
(wt%)
1−1112001805017.4010.015.46
2−11−12001801014.6720.113.10
3−1−11200105013.2912.424.34
4−1−1−1200101019.0315.124.08
51113201805038.6010.776.12
611−13201801035.0323.603.64
71−11320105042.5513.184.75
81−1−1320101042.3515.662.93
9000260953029.5816.255.78
10000260953029.3516.255.78
11000260953030.739.325.59
12−100200953014.3210.175.52
13100320953038.688.976.59
140102601803026.7121.725.28
150−10260103031.6411.575.50
16001260955031.1311.855.47
1700−1260951030.2017.315.48
1 CS: biomass concentration; 2 YB: biocrude yield; 3 CO: oxygen content; 4 CN: nitrogen content.
Table 3. Theoretical values to maximise the biocrude yield and minimise de N and O content.
Real ValueCodified ValueTheoretical Response
T
(°C)
t (min)CS (wt%)T (°C)t
(min)
CS (wt%)YBC (wt%)CO (wt%)CN (wt%)
Max YBC3201010320101043.1514.713,.1
Min CN200180102001801014.8921.303.33
Min CO20093.55020093.55015.607.935.50
Table 4. Experimental yields at the optimum conditions (320 °C, 10 min and 10 wt% biomass concentration) for N. gaditana.
YB (wt%)YWSP (wt%)YGP (wt%)YSR (wt%)YLP (wt%)
42.3 ± 0.832 ± 118 ± 27.42 ± 0.0892.58 ± 0.07
Publisher’s Note: MDPI stays neutral with regard to jurisdictional claims in published maps and institutional affiliations.

