Article

Combination of Dual-Energy X-ray Transmission and Variable Gas-Ejection for the In-Line Automatic Sorting of Many Types of Scrap in One Measurement

1
College of Mechanical & Electrical Engineering, Nanjing University of Aeronautics and Astronautics, Nanjing 210016, China
2
College of Mechanical & Electrical Engineering, Sanjiang University, Nanjing 210012, China
*
Authors to whom correspondence should be addressed.
Appl. Sci. 2021, 11(10), 4349; https://doi.org/10.3390/app11104349
Submission received: 26 March 2021 / Revised: 1 May 2021 / Accepted: 7 May 2021 / Published: 11 May 2021
(This article belongs to the Section Environmental Sciences)

Abstract

:
As an important part of pretreatment before recycling, sorting has a great impact on the quality, efficiency, cost and difficulty of recycling. In this paper, dual-energy X-ray transmission (DE-XRT) combined with variable gas-ejection is used to improve the quality and efficiency of in-line automatic sorting of waste non-ferrous metals. A method was proposed to judge the sorting ability, identify the types, and calculate the mass and center-of-gravity coordinates according to the shading of low-energy, the line scan direction coordinate and transparency natural logarithm ratio of low energy to high energy (R_value). The material identification was satisfied by the nearest neighbor algorithm of effective points in the material range to the R_value calibration surface. The flow-process of identification was also presented. Based on the thickness of the calibration surface, the material mass and center-of-gravity coordinates were calculated. The feasibility of controlling material falling points by variable gas-ejection was analyzed. The experimental verification of self-made materials showed that identification accuracy by count basis was 85%, mass and center-of-gravity coordinates calculation errors were both below 5%. The method proposed features high accuracy, high efficiency, and low operation cost and is of great application value even to other solid waste sorting, such as plastics, glass and ceramics.

1. Introduction

1.1. Background

In view of the prominent problems of environmental protection, economy, resources, landfill site and safety, it is urgent to recycle solid waste with high quality, high proportion and high efficiency, especially for those such as scrapped vehicles, waste household appliances, waste electronic products, waste building materials and domestic waste. Consequently, whether in developed or developing countries, solid waste recycling is becoming a common concern. As an important step of pretreatment in the process of solid waste recovery, sorting is of great significance to energy conservation, environmental impact, secondary resource market balance, and the improvement of efficiency and quality. As far as present sorting is concerned, there are manual sorting and automatic sorting methods. Manual sorting still exists in developing countries with low labor costs. However, with the gradual increase in labor cost and concerns for health, automatic sorting is becoming popular [1,2,3,4,5,6]. Automated waste sorting technology can be classified into two types: direct sorting and indirect sorting [1]. Direct sorting includes: air separation, the dense medium method, eddy current separation (ECS), magnetic separation, the electrostatic method, magnetic levitation, etc. [2,7,8,9,10,11,12] These methods rely on the different physical properties of the materials and directly separate solid waste by buoyancy, electromagnetic force, electric field force, etc. Indirect sorting involves two steps, the first step is identification, dependent on various sensors such as color or grayscale machine vision, X-ray transmission (XRT), X-ray fluorescence (XRF), laser-induced breakdown spectroscopy (LIBS), electromagnetic sensor (EMS), spectroscopy, etc. [4,13,14,15,16]. The second step is separation based on the identification results. There is another classification with respect to sorting, that is dry sorting and wet sorting [1]. Wet sorting includes the medium density method, the chemical extraction method, etc. Wet sorting usually consumes much liquid and its media. What is more troublesome is that the amount of liquid mixture from wet sorting is difficult to handle and causes secondary pollution. Compared with wet sorting, dry sorting is more environmentally friendly. No matter whether direct or indirect, dry or wet sorting, the physical properties mostly used include density, atomic number, conductivity, permeability, morphology, mechanical, thermal, and optical properties, etc.
With respect to scrapped vehicles and household appliances, a series of dry sorting methods can be used and the general sorting process is as follows [3,6,15,17,18]: (i) disassemble reusable parts by hand and remove lubricating oil, fuel oil, batteries and other liquids or dangerous goods from them. (ii) Shred by machine and obtain shredded solid mixtures. Light floats such as plastic foam, plastic film, etc., can be separated from the mixtures by winnowing. After the removal of dust and fine particles, most of the remaining mixtures are independently bulk (generally they are not covered or adhered to each other) and sometimes graded by screen size. (iii) Sort out ferromagnetic materials from these bulk mixtures by magnetic separation. (iv) The remaining bulk mixtures are sorted by ECS to obtain non-ferrous metal mixtures and non-metallic mixtures, which can be further sorted by one or more indirect methods based on sensors. The finer the classification is, the better the recovery quality.
Among indirect sorting methods, color-sorting is the most widely used [4]. This method can identify materials by obtained material characteristics such as color, texture, shape, spatial relationship, etc. However, the method has its weakness in that it is vulnerable to surface pollution and light source changes. Likewise, when it comes to materials with similar apparent color, such as SS (stainless steel), Al (aluminum) and its alloy, Mg (magnesium) and its alloy, etc., the sorting for them becomes more difficult. Both XRF and LIBS can obtain the surface characteristics of materials, so they are also easily affected by the surface pollution of materials to be sorted [6]. In addition, the essence of EMS is to employ the principle of electromagnetic induction. According to this principle, excitation coils generate a variable excitation magnetic field which interacts with the materials to be measured, resulting in an eddy current effect. Meanwhile, the eddy current generates an anti-magnetic field which interacts with the excitation magnetic field to change the impedance of the excitation coils. EMS is suitable for sorting NM-SS (non-magnetic stainless steel) with very small electrical conductivity [5]. However, impedance change is not only closely related to the conductivity and permeability of the measured material, but also affected by many uncontrollable factors, such as excitation frequency, excitation coil structure, material shape, internal mechanical defects and material-to-sensor distance, etc. Therefore, there are many difficulties in the industrial application of EMS sorting.
Compared with methods above-mentioned, the XRT method theoretically has the following advantages [5,19,20,21,22,23,24,25,26]: (i) no specific requests for materials, (ii) less sensitive to surface pollution, (iii) not easily affected by the material shape (including hollow pipes) and detection environment, (iv) without residue or secondary pollution. Meanwhile, as one of the dry-type sorting methods, XRT can realize rapid detection and large throughput. Furthermore, DE-XRT can identify materials on the basis of the high correlation between transmission value, once detecting the effective atomic number of materials, and obtaining certain shape features too. It has become one of the most promising sorting methods in the field of solid waste sorting. The main content of this study is the application of DE-XRT to the in-line automatic sorting of non-ferrous waste metals.

1.2. Correlative Theory

The technique of X-ray transmission is widely used in such domains as medicine, security inspection, industry, etc. When an ideal narrow beam, single energy and monochromatic X-ray penetrates through a material with thickness t, its energy intensity is attenuated exponentially in accordance with the Beer−Lambert Law [19] as follows:
I = I 0 e μ t = I 0 e μ m ρ t
where I0 (keV) and I (keV) are, respectively, the measured values of X-ray energy intensity before and after penetration, μ (cm−1) is the linear attenuation coefficient, t (cm) is the material thickness, μm (cm2/g) is the mass attenuation coefficient, ρ (g/cm3) is the material density, and ρt (g/cm2) is also called mass thickness.
From Equation (1), it can be concluded that:
ln ( I 0 / I ) = μ t = σ ( Z , E ) N A A ρ t
where σ (cm2/atom) is cross-section, NA (atom/mole) is Avogadro constant, and A (g/mole) is relative atomic mass. The cross-section σ is a function of atomic number Z and energy E [27].
For dual-energy monochromatic X-ray transmission, it can be obtained from Equation (2) that:
{ ln ( I 10 / I 1 ) = μ 1 t = σ ( Z , E 1 ) N A A ρ t ln ( I 20 / I 2 ) = μ 2 t = σ ( Z , E 2 ) N A A ρ t
The R_value of dual-energy monochromatic XRT is defined as follows:
R = ln ( I 1 / I 01 ) ln ( I 2 / I 02 ) = ln ( I 01 / I 1 ) ln ( I 02 / I 2 ) = μ 1 μ 2 = σ ( Z , E 1 ) σ ( Z , E 2 )
where I01 and I1 are, respectively, the measured values of the energy intensity of monochromatic X-ray before and after attenuation of energy E1, I02 and I2 are, respectively, the measured values of the energy intensity of monochromatic X-ray before and after attenuation of energy E2. The two ratios of I1/I01 and I2/I02 can be obtained by measurement. E1 and E2 are the energy of known constant monochromatic X-ray. The R_value is the ratio of the attenuation cross-section of two kinds of energy, which changes monotonously with Z. From Equation (4), it can be seen that the R_value has nothing to do with the mass density and thickness of the material. Therefore, the atomic number Z of materials can be identified by R_value, so as to identify the material types.
For continuous spectrum X-rays that pass through a homogeneous material, using an energy-integrating detector, the value of the transmitted signal after passing through the object is:
T = 0 E i n N ( E ) P d ( E ) E e μ ( E ) t d E
where E is the energy of X-ray photons, Ein is the highest energy of input continuous spectrum, N (E) is the number of X-ray photons between E and dE, Pd (E) is the probability (efficiency) of photon detection with energy E, B (E) is the accumulation factor, μ (E) is the linear attenuation coefficient. For dual-energy X-ray transmission with maximum energy EH and EL, there are the following nonlinear integral equations:
{ T L = 0 E L N ( E ) P d ( E ) E e μ ( E ) t d E T H = 0 E H N ( E ) P d ( E ) E e μ ( E ) t d E
Similarly, the R_value of continuous spectrum DE-XRT is defined as:
R = ln ( T L / T L 0 ) ln ( T H / T H 0 )
where TL0 and TH0 are, respectively, the measured values of low-energy and high-energy integral of transmission signal before attenuation. TL/TL0 and TH/TH0 are defined as low-energy and high-energy transparency, respectively. The following R_values are defined by Equation (7). Because of the influence of integration, both the coefficient of integration term and the linear attenuation coefficient in exponential term in Equation (6) are functions of energy E of integration variable, so the calculation of the R_value in Equation (7) cannot remove the influence of thickness t, that is, the R_value is not only related to the atomic number Z, relative atomic mass A and density ρ, but also related to the thickness t of the material. Therefore, DE-XRT method cannot directly identify the atomic number and the material according to the R_value calculated by Equation (7), and the influence of thickness needs to be removed.
In view of the convenience of the following processing and narration, we additionally define the shading of low-energy SL and the shading of high-energy SH, which are consistent with the monotonous change of the mass thickness, as:
S L = T L 0 T L T L 0 , S H = T H 0 T H T H 0
The correlative theory of XRT is detailed in Appendix A.

1.3. Previous Work

Many scholars have done a lot of meaningful work on X-ray material identification. Mesina et al. [5] of Delft University of Technology used DE-XRT combined with EMS to sort non-ferrous metals such as Alc (cast aluminum alloy), Alw (wrought aluminum alloy), Mg, Cu (copper), SS and brass. Their DE-XRT method used L-H plane measured by low-energy (75 kV) and high-energy (150 kV) for classification, while the EMS used voltage amplitude and phase shift U-φ polar coordinate plane measured by excitation magnetic field with frequency of 700 Hz and 5 kHz for classification. Takezawa et al. [19] used DE-XRT combined with the eddy current test (ECT, same as EMS in Reference [5]) to refine aluminum alloy classification with seven kinds in the laboratory. Their DE-XRT carried out tests of the multi-energy and multi-thickness combination of copper sheets by dual-energy detector, and the results from the ECT were classified in the polar coordinate plane with amplitude values represented by radius and phase angle. Unfortunately, the experimental conditions of this method are rather strict, and there are still considerable difficulties in practical industrial application. Mazoochi et al. [20] used dual-source DE-XRT in security inspections. They adopted the Simpson complex method to calculate the integral value of Equation (6) by subsections, solved a series of equations by MATLAB series quadratic programming (SQP), empirically selected a pair of specific low-energy and high-energy area attenuation ratios as the R_value, and simulated X-ray with MCNP (Monte Carlo N-Particle). The essence of the algorithm was to discretize the continuous spectrum by segments, and select a pair of high- and low-energy values to calculate the R_value, that is, approximately extracting the dual-energy monochromatic R_value from the continuous spectrum, so as to remove thickness effect. However, the algorithm is more sophisticated. In recent years, it has been demonstrated that Monte Carlo radiation transport tools are so useful for designing and optimizing photon (X-ray and gamma) radiation based systems [28,29,30,31]. These tools can speed up the development or research process and save experimental costs, so they are favored by researchers. Neubert et al. [21] established the relationship between energy attenuation of DE-XRT and rare element enrichment, ore size and spatial distribution in mineral processing of rare elements. Ketelhodt et al. [22] also used DE-XRT to realize coal preparation. Bezati et al. [13] used XRF technology to realize the recognition of a variety of plastics.
X-ray is also widely used in the field of security inspection [23,24,25,26]. Pourghassem et al. [24] used two-dimensional low-high energy (L-H) plane to identify hazardous materials. Beldjoudi et al. [25] used an X-ray photon counting detector to propose an optimized material identification method suitable for a photon counting detector and energy integration detector, so as to realize the identification of hazardous materials. Kimoto et al. [26] also used an X-ray photon counting detector to realize accurate material identification when the X-ray spectrum hardened, and simulated an X-ray spectrum with MCNP.
In recent years, research on the applications of high-energy (over MeV) X-ray in the field of container security inspection has gradually increased [27,28,29,30,31,32]. Li et al. [27] used MeV-level dual-energy X-ray so-called α-curve to identify dangerous or smuggled goods in containers.
Recently, in addition to X-ray research, some scholars have explored some new methods for material sorting. Wang et al. [4] realized the recognition of copper and aluminum by color-sorting, and discussed and compared several intelligent optimization algorithms such as PCA-SVM (principal component analysis–support vector machines). They also optimized parameters such as gas pressure, line speed, material height, separation distance and gas-ejection elevation angle by using the response surface methodology with FLUENT simulation. Otoole et al. [15] used magnetic induction spectroscopy to classify Cu, Al and brass. Picon et al. [16] used spectral and spatial features to classify non-ferrous metals. Koyanaka et al. [6,33,34] used a 3D (three-dimensional) laser sensor and weight sensor to identify light scrap such as Alc, Alw and Mg in accordance with multivariate analysis which combined apparent density of materials with other 3D parameters. They also used a neural network to improve the identification accuracy of scrap from several shredder factories, and used portable XRF to conduct element analysis experiments on identified materials to verify the application in the automobile industry. Nevertheless, in this method, the shredder equipment, the shredder process, original hollow or tubular materials and other factors may have a greater impact on the classification accuracy. Cuce et al. [35] used the thermal conductivity measurement to identify materials, and carried out experimental verification on Cu, brass, SS and Al. The reported error of identification was less than 5%, and even the measurement error of aluminum thermal conductivity was only 0.56%. In fact, the method is still in the laboratory stage, and it is difficult to apply in engineering.
In addition, X-ray dual energy CT (computed tomography) can be seen in medicine or industry, but it has some evident defects, including low speed, low efficiency, complex processing, and high cost [36]. There are also some beneficial attempts in XRT multi-energy fusion [37].
The previous research has provided support for this study. However, the XRT application theories above-mentioned are mostly limited to material identification combined with other sensors; and the identification results are still to be improved. For example, in the field of security inspection, when detecting prohibited explosives, the identification only shows an approximate range of atomic number [24]. On the other hand, many theories have not yet been clarified in detail with respect to thickness removal effect, or lack of feasibility in practical engineering application. For example, (i) the integral coefficient term in Equation (5) or Equation (6) is not easy to obtain accurately; (ii) the SQR algorithm used in Reference [20] is complicated; (iii) the energy selection of the final dual-energy monochromatic R_value is empirical; (iv) the XRT of MeV energy is mostly used for large-scale container customs’ clearance and security inspections, by which the identification of industrial bulk materials will overconsume the occupation and the cost of protection and equipment; (v) the main problem of dual-energy CT is its relatively slow speed for detection. In short, many existing methods cannot be completely applied to industry due to their severe application conditions. Established theories above-mentioned have not yet made comprehensive focus on industrial applications either, so as to fail to improve identification accuracy and sorting efficiency.

1.4. Problems in the Application of DE-XRT

For the application of single-source continuous spectrum DE-XRT in practical engineering, there are problems, such as overexposure, underexposure, measurement noise, fan-shaped effect, low identification accuracy and low sorting efficiency.

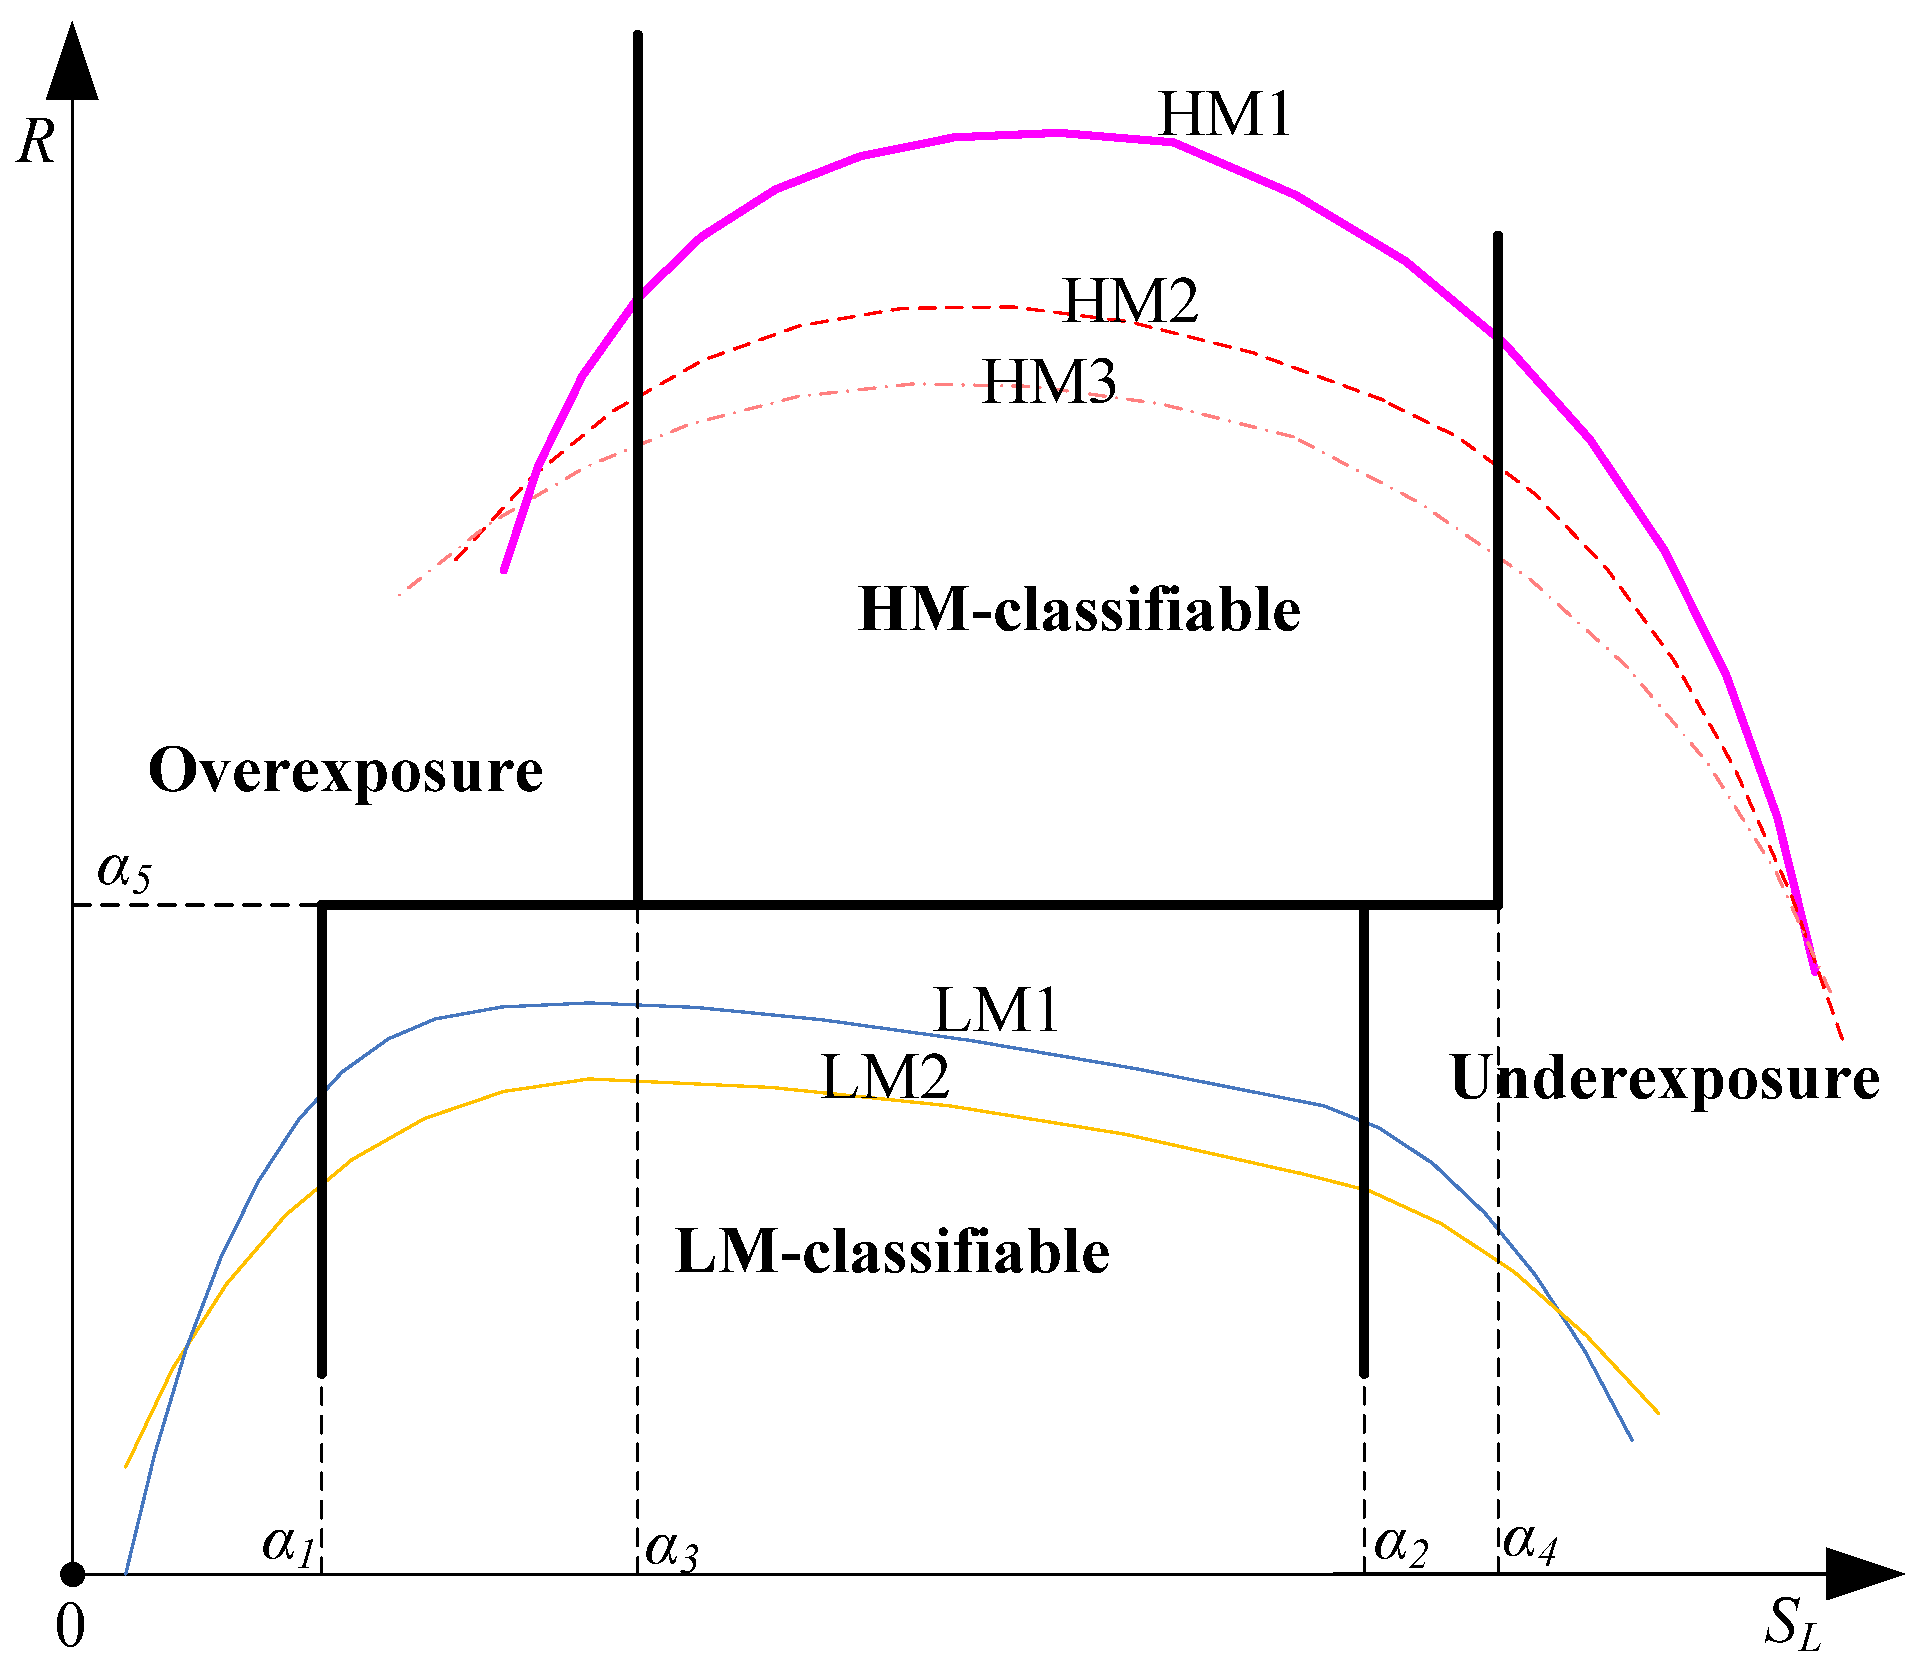
1.4.1. Overexposure and Underexposure

There are two kinds of non-normal exposure effects of XRT, including overexposure and underexposure. Overexposure is represented by high transparency, low shading, low contrast of background against material images, which is caused by the high energy of the ray source, the small atomic number of materials, or smaller thickness, allowing most rays of the penetrated materials to reach the detector. Conversely, underexposure takes on low transparency, high shading, large contrast of background against material images, which is the result of low energy of the ray source, the large atomic number of the materials, or greater thickness, allowing few rays of the penetrated materials to reach the detector. Based on actual measurement and analysis, this study has found that both overexposure and underexposure have a great impact on random quantization errors and R_value calculation accuracy, which makes the R_value curves of various materials cross so as to affect material identification. It is more appropriate to use the threshold of low-energy shading to judge overexposure and underexposure. The relevant impacts are shown in Table 1.
Due to their lighter weight, thinner wall, and being the more complicated parts of automobiles, home appliances and other products, Cu, SS, and brass parts still exist, so overexposure and underexposure are usually inevitable during a single measurement of DE-XRT. If that is neglected, misinformation will appear, resulting in the increase in measurement errors, which will affect the identification accuracy. Therefore, it is indispensable to resolve problems of overexposure and underexposure.

1.4.2. Measurement Noise

DE-XRT detection noise may arise from the following aspects: (i) random normal distribution noise, including random distribution of ray number (intensity), random noise of detector circuit, random noise of environmental background, etc.; (ii) X-ray source noise from power fluctuation and environmental influence; (iii) cross-talk noise of low and high energy caused by the processing and transmitting data of the interconnection system from the circuits of the fixed detector position [38]. All of those will affect identification accuracy and so should be improved.

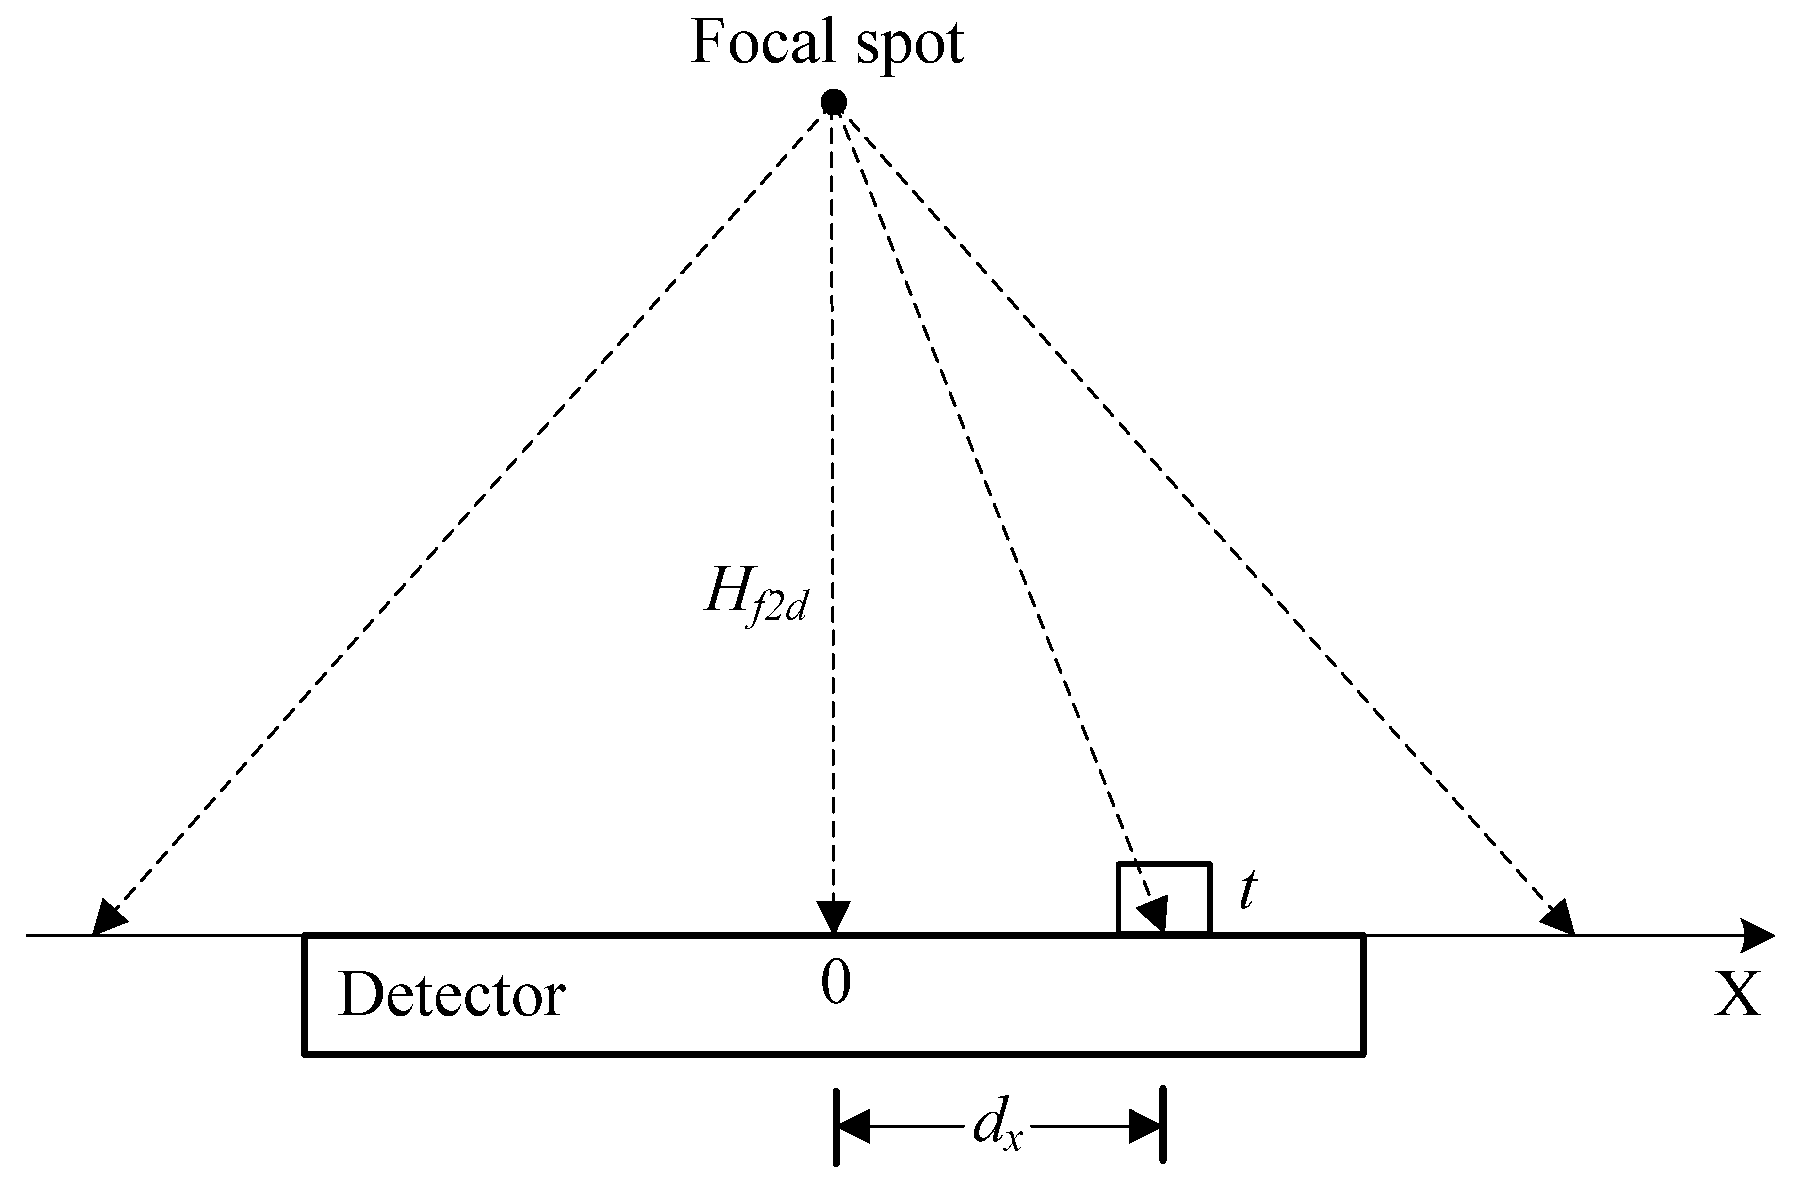
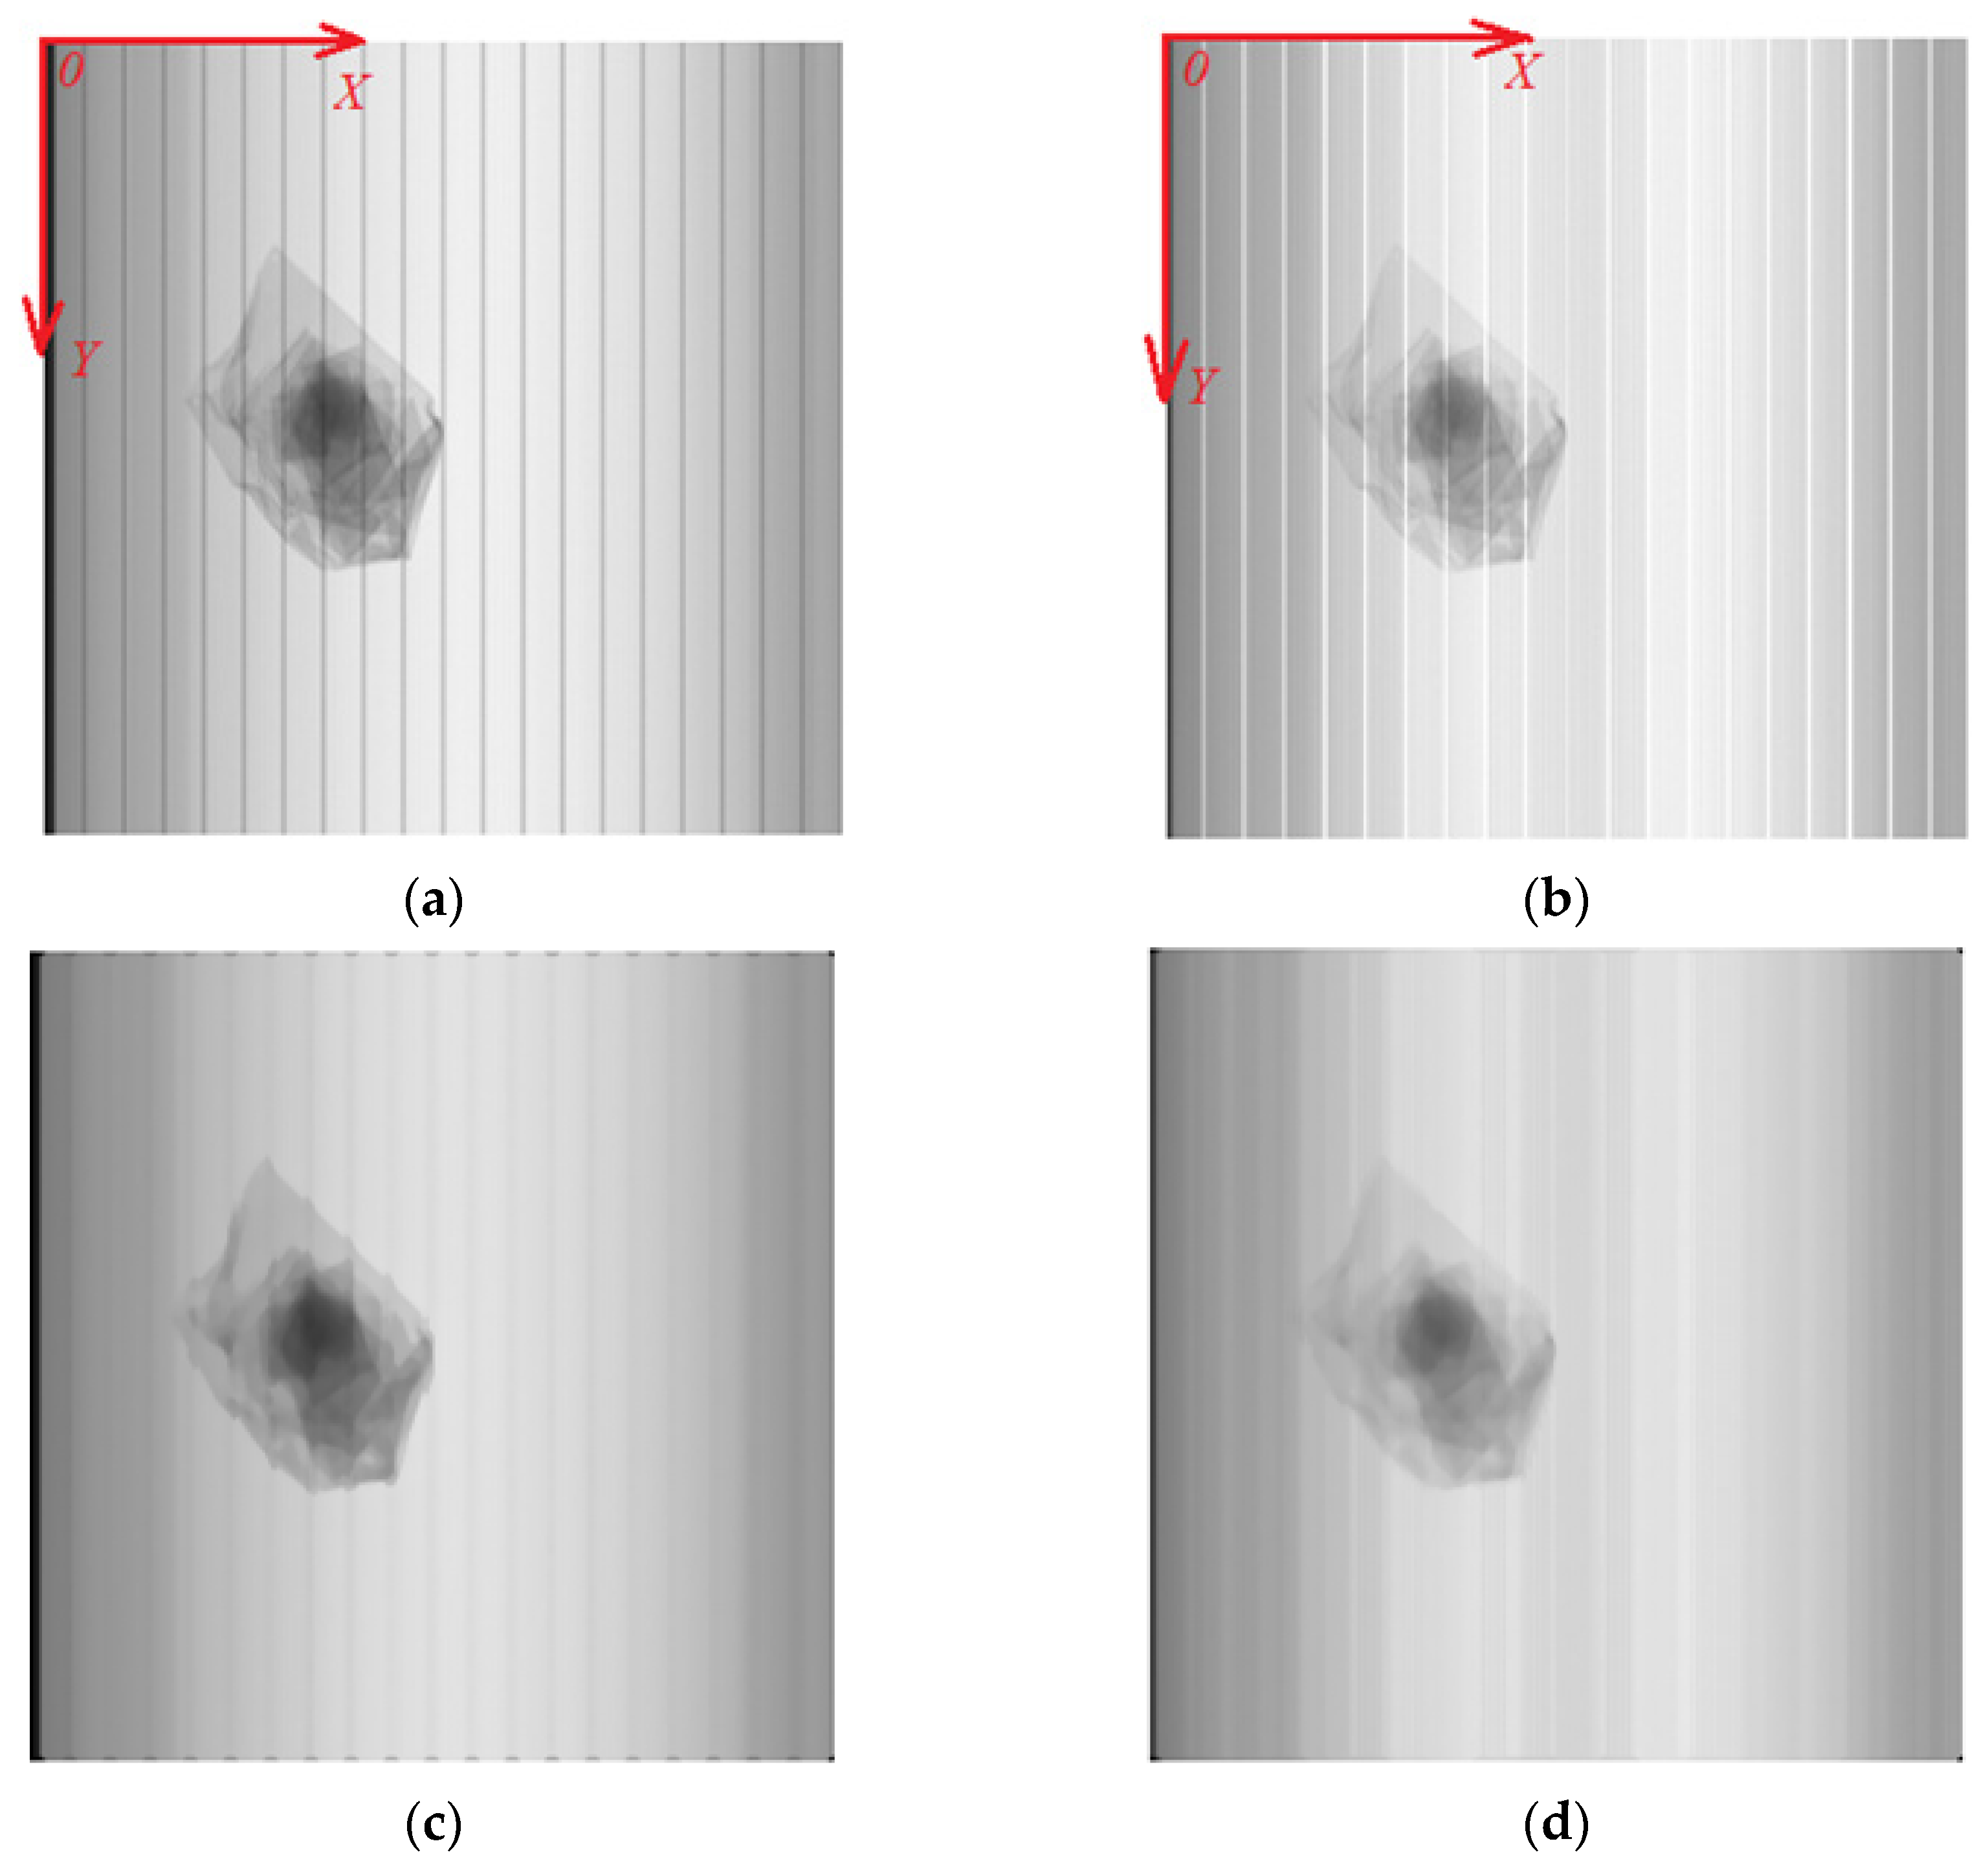
1.4.3. Fan-Shaped Effect

The fan-shaped effect is shown in Figure 1. The X-ray source is approximate to a point light source. The change of the distance dx from the detector directly below its focus will cause the detected signal to change, which mainly brings about the following influences: (i) the greater the dx is, the greater the ray energy attenuation due to distance. The larger the dx is, the more the thickness of the penetrated material increases compared to the actual material thickness, which leads to more attenuation of the detected signal. (ii) The larger the dx is, the greater the increase in thickness of the penetrated materials compared with the actual material thickness due to the relationship between the right side of a right triangle and the hypotenuse, which will cause more attenuation of the detected signal. (iii) Similarly, the difference in the dx leads to a change in thickness of X-ray penetrating copper sheets between the low and high energy due to the relationship between the right side of a right triangle and the hypotenuse, which will vary filtering of low-energy signals. This has a certain impact on the R_value, mass and center-of-gravity coordinates calculation.

1.4.4. Identification Accuracy

X-ray used in industry is not monochromatic while the R_value in continuous spectrum DE-XRT decreases with the increase of thickness. For this reason, judgment only based on R_value will be prone to overlap and the materials will not be identified. For example, the R_value of a thick and heavy metal may be equal to or even less than that of a thin and light metal. Even after the introduction of SL-R plane curve, the same thing will happen. In conclusion, foregoing factors such as overexposure, underexposure, measurement noise, fan-shaped effect, etc., will affect identification accuracy. Therefore, due to poor identification of the effective atomic number of materials, DE-XRT is usually limited to classification of heavy/light metals or explosives/non-explosives. It is difficult to use single DE-XRT for more delicate sorting in application.

1.4.5. Sorting Efficiency

Rejected−accepted sorting is used in most engineering applications. If multiple materials are to be sorted, multistage sorting is required. However, the existing technology basically does not satisfy multimaterial sorting by single detection, its sorting efficiency is usually poor.

1.5. Purpose and Content

Indirect sorting is generally divided into three steps: detection, identification and separation. Improving their quality, efficiency and coordination can comprehensively enhance actual sorting quality. Our previous work explained the problems of detection, identification, separation and coordination in the system control process [39].
High-quality monochromatic dual-energy X-ray is generally not feasible for industrial application because it can only be obtained on synchrotron, while continuous spectrum dual-energy X-ray is relatively easy to obtain. Therefore, single-source dual-energy X-ray systems with energy-integrating detectors are more popular due to high efficiency and low cost, which also have great significance for research.
On the basis of exciting research and problems in practice, this paper employs the single-source continuous spectrum DE-XRT to conduct the in-line identification of materials. Non-ferrous metals can be sorted according to the R_value calibration surface of SL-x-R and a feasible sorting process is given. The identification quality is improved by means of effective point selection based on the judgment of overexposure and underexposure of low-energy shading and comparing the average distance with a series of calibration surfaces. In addition, the separation of multiple materials at a time can be realized, helped by a combination of variable gas-ejection (average pressure and/or action time) separation with in-line automatic calculation of material mass and center-of-gravity coordinates on the basis of converted and integrated low-energy shading from the thickness of the calibration surface of SL-x-t. Despite the high fixed cost of DE-XRT system equipment, this study can fully improve the performance and efficiency of DE-XRT identification and sorting without combining other sensors, which can reduce the system’s running costs. Therefore, it is of great practical value.
The remainder of this paper are arranged as follows: Section 2 is Materials and Methods, which briefly presents the composition and control method of the DE-XRT experimental sorting system, experimental sample materials, data acquisition and image preprocessing; puts forward the material identification methods and process, the calculation methods of the material mass and center-of-gravity coordinates; introduces the shading of low-energy to the judgement of unidentifiable materials because of overall underexposure and overexposure; selects the effective points for identifiable materials to improve identification accuracy; and theoretically analyzes the variable gas-ejection method to control the separation falling point. Section 3 is Results and Discussion, which verifies the effectiveness of the DE-XRT material identification on the basis of R_value calibration surface of SL-x-R and calculation accuracy of material mass and center-of-gravity coordinates. Section 4 is the Conclusion, which summarizes the full text.

2. Materials and Methods

2.1. Materials

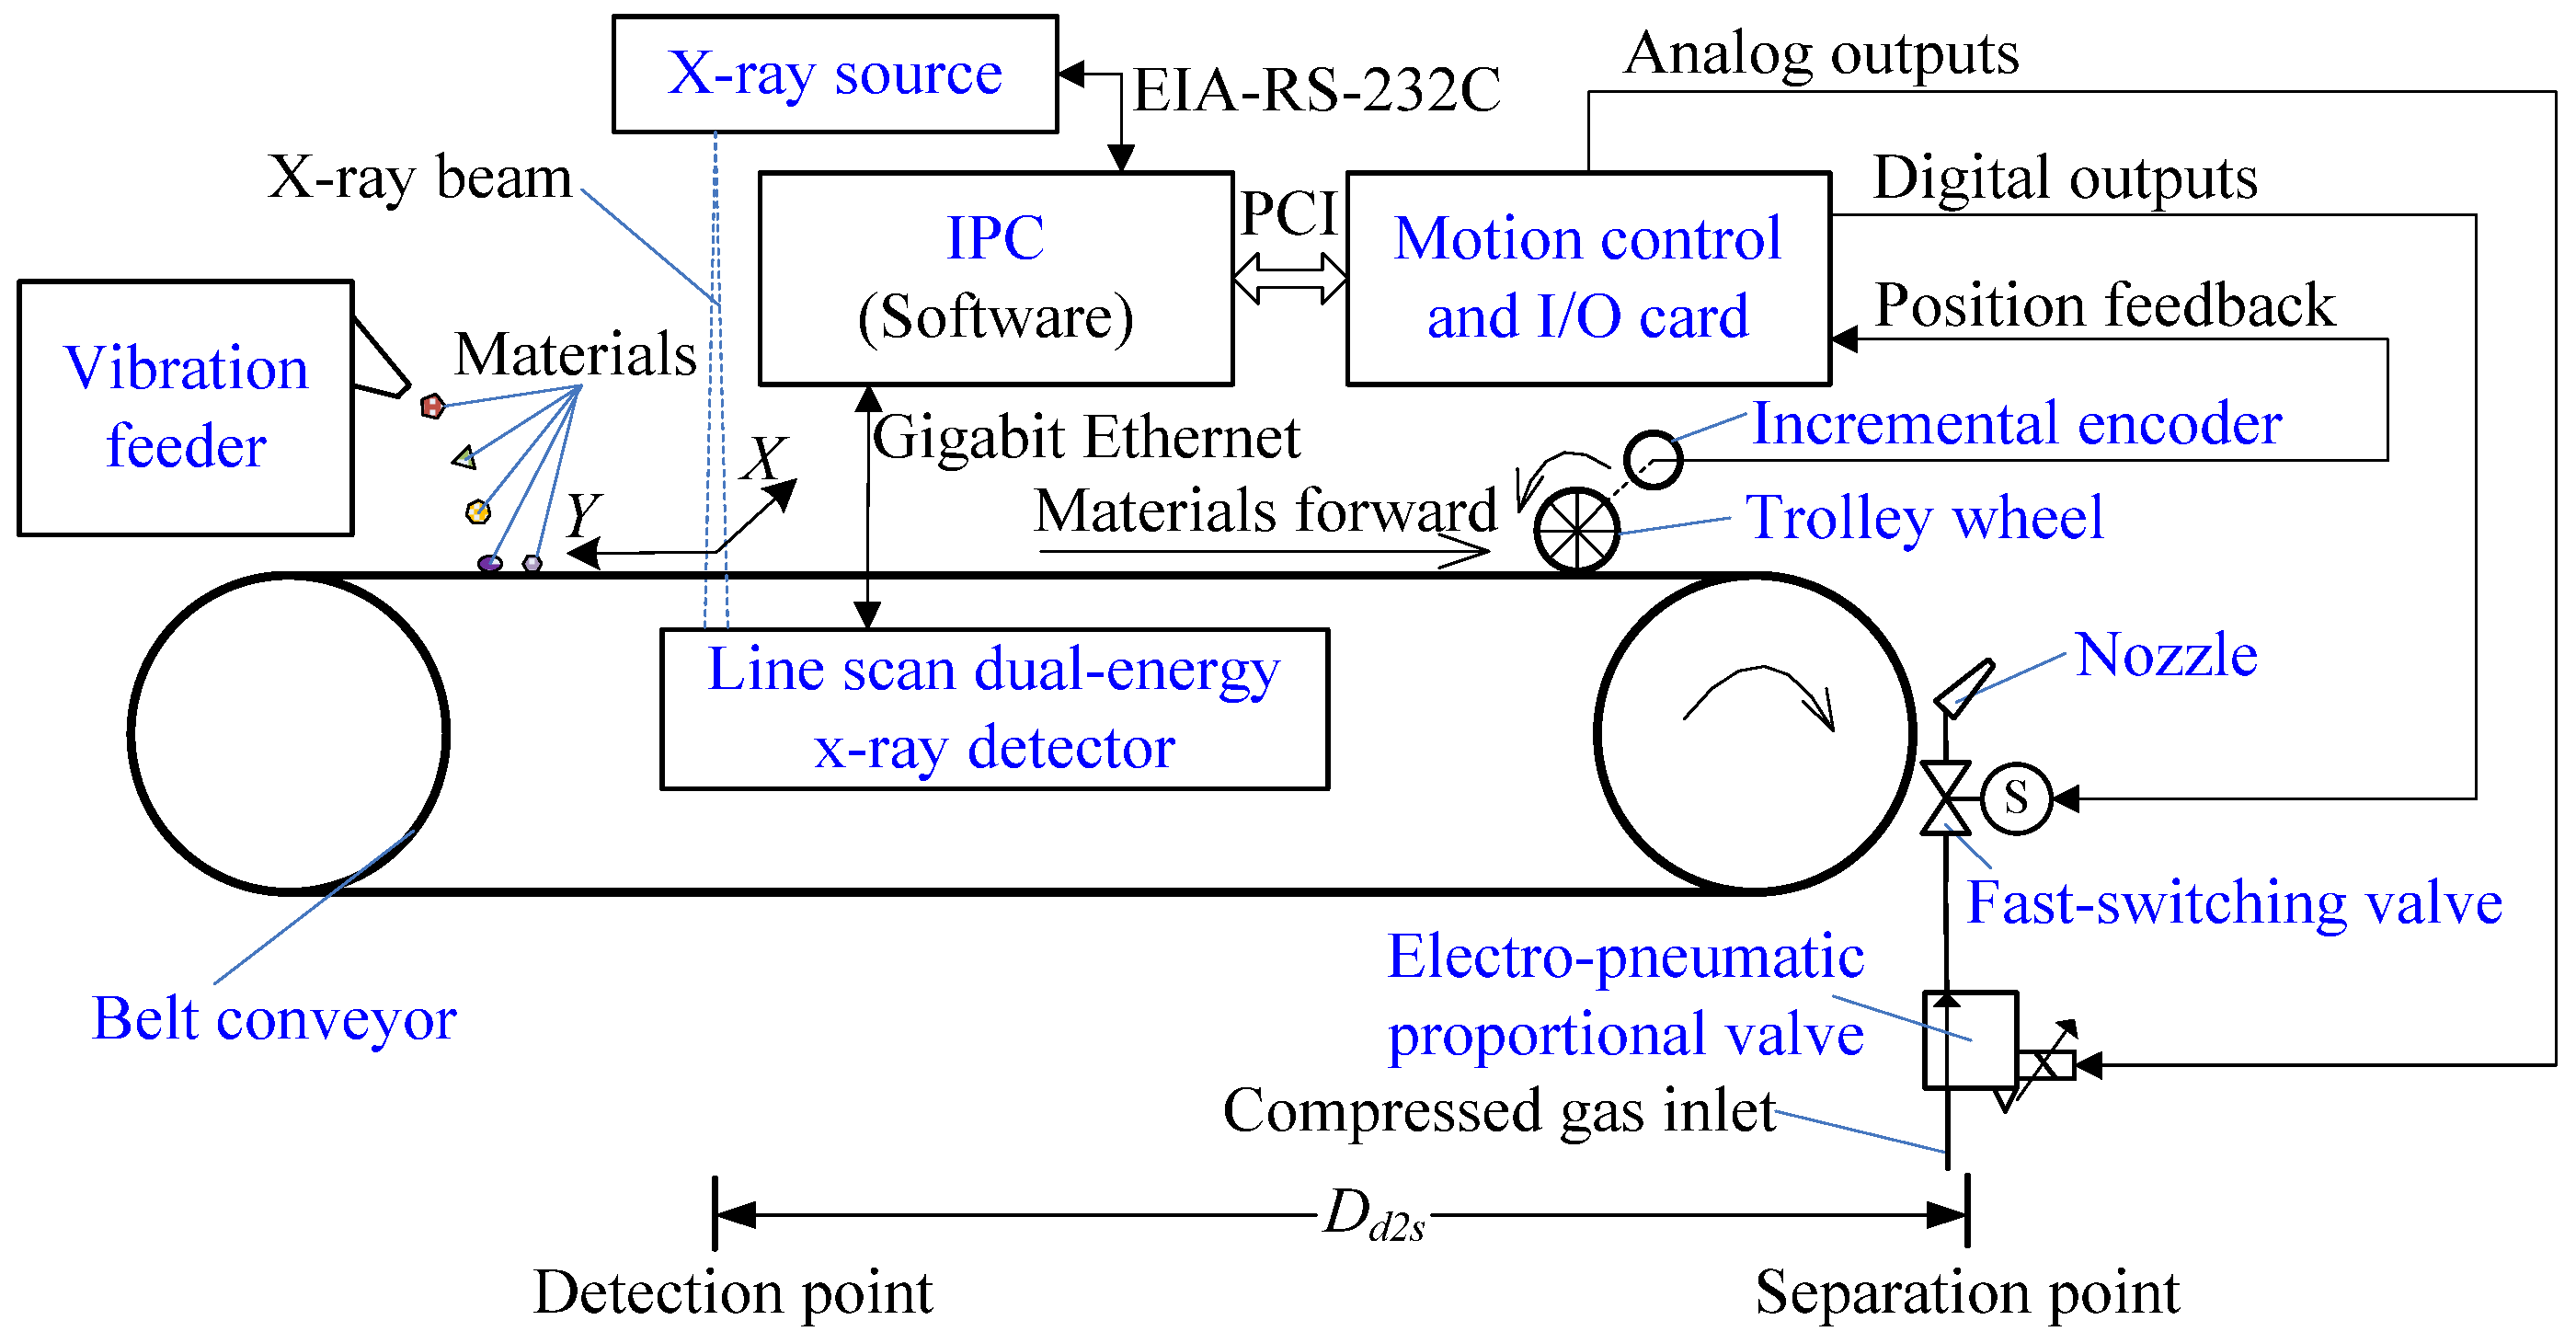
2.1.1. Setup and Control Method of the Automatic Sorting System

A single-source DE-XRT system with energy integrating detector was used in this study. The system consisted of a vibration feeder mechanism, belt conveyor, X-ray source, line scan dual-energy detector, incremental encoder and trolley wheel component, control system, line array of gas-ejection separation component (electro-pneumatic proportional valve, fast-switching valve and ejector) and a gas supply system, etc. The part for detection and identification is similar to security inspection equipment. The schematic diagram of the system is shown in Figure 2. A SRB401 X-ray source of Spellman Company was used with 100–220 kV adjustment range of tube voltage, 0.5–2 mA at 200 kV adjustment range of tube current, 400 W maximum power, 85° × 4° collimated fan beam, tungsten-made anode target with 0.8 mm × 0.5 mm focal size, and 390 mm height between focus and detector Hf2d. A LINX-1605-301 X-ray linear detector array of Sens-Tech Company was used with 1.6 mm x-accuracy (pitch), 320 pixel for both low-energy channels and high-energy channels, 10–50,000 μs settable integration time, 1.875–15 with 8 sections settable channel gain. It is sandwich-like with three layers, including an upper layer of low-energy scintillator Gadox B (Gd2S2O), a middle layer of 3 mm-thickness copper sheet, and a lower layer of high-energy scintillator CdWO4. An Advantech (Taiwan, China) IPC-610 industrial PC (IPC) equipped with a GTS-400-PV-PCI MCIO (motion control and I/O) card of Googoltech (Shenzhen, China) through PCI (peripheral component interconnect) bus was utilized. A rotary incremental encoder with 10,000 pulse counts per revolution was installed over a 63.6 mm-diameter trolley wheel. Its values were read by IPC through an MCIO card. When the encoder fed back a pulse, the conveyor belt advanced about 0.02 mm. The 400 mm-width belt was driven by a deceleration servo motor at a 0–3 m/s adjustable speed. A line array of gas-ejection separation components was used to separate materials. The operation parameters are summarized in Table 2, and the design principles can be found in Reference [39].
The accelerated high-speed cathode rays (electron) in the X-ray source bombarded the anode target to produce bremsstrahlung continuous spectrum X-rays. The X-rays then formed a fan-shaped beam after filtering and collimating. After the X-ray beam reached and interacted with the material, part of the X-rays was absorbed or scattered by the material, and the rest reached the detector through the material. The X-rays attenuated by the material first interacted with the detector’s low-energy scintillator (sensitive to low-energy rays) and the detector circuit converted and integrated them into energy signal TL. The transmitted X-rays continued to interact with the middle-layer copper sheet. Most of the low-energy X-rays were absorbed or scattered by the copper sheet, and the rest of the X-rays (high energy) reached and interacted with the high-energy scintillator. Similarly, the detector circuit converted and integrated them into the energy signal TH. After each set integration time, the detector could acquire a line of low-energy and high-energy signals at the same time.
Under the PC (personal computer) general OS (operating system) Windows 7, the software was developed with the C language of Visual Studio 2012. The system achieved accurate and coordinated control, and integrated data reading, image processing, identification, logic control separation, communication and HMI (human-machine interface) [39].

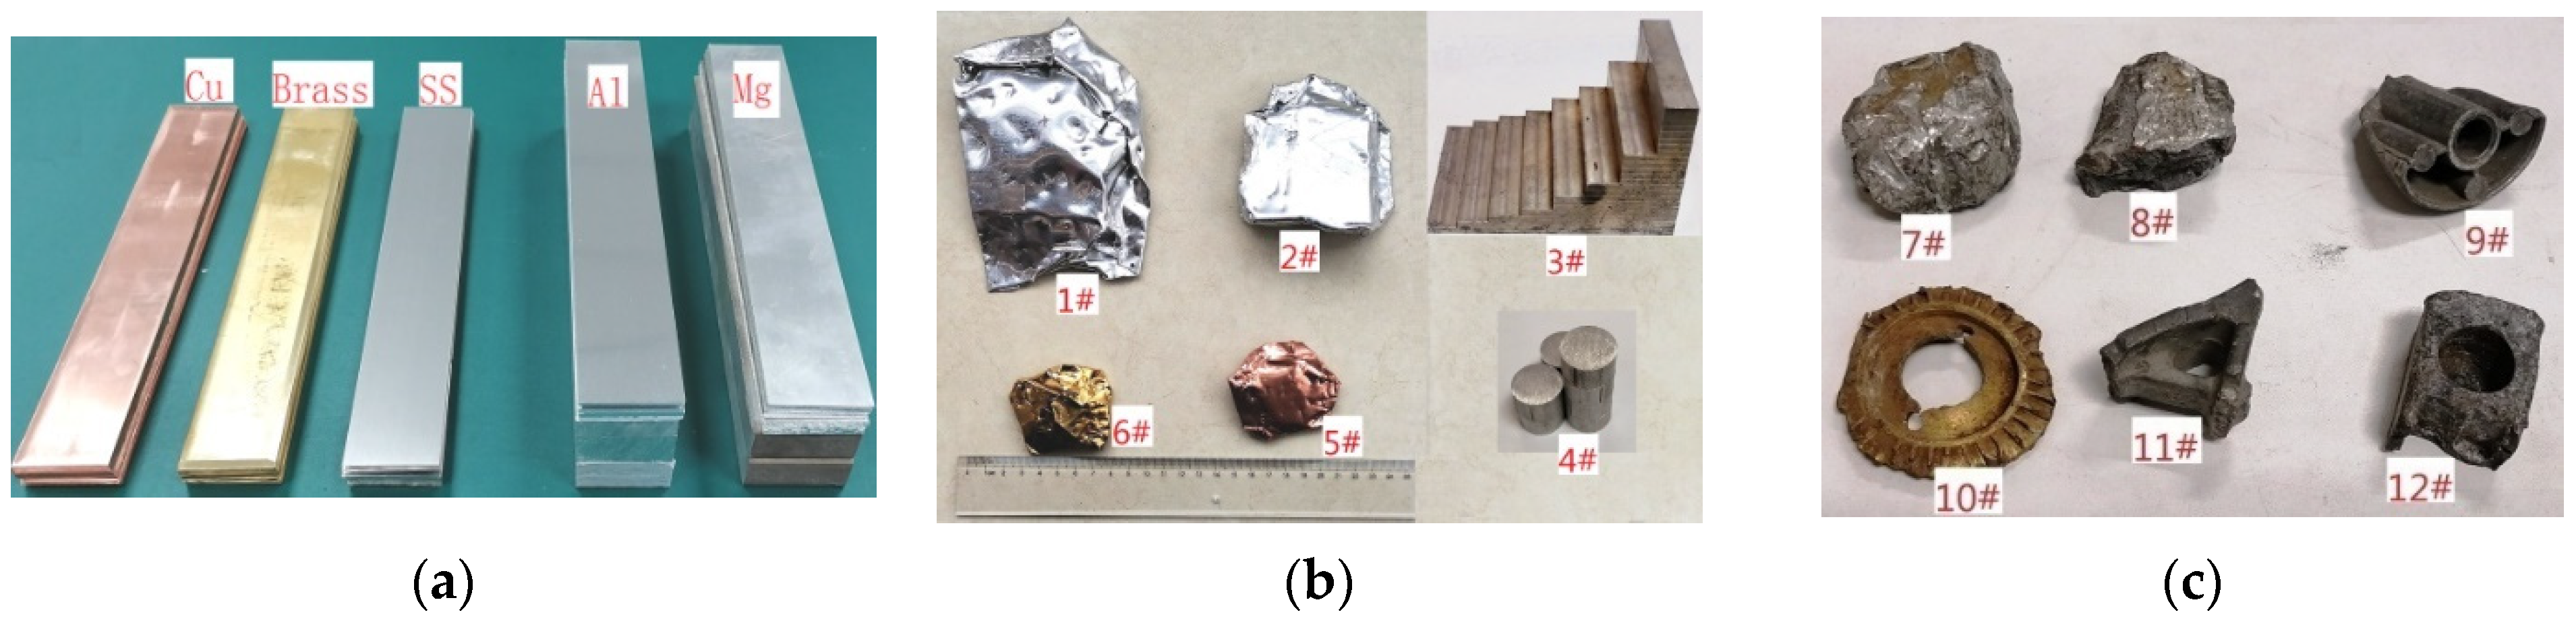
2.1.2. Sample Materials

Some experimental samples are shown in Figure 3: (a) standard grade samples (50 mm × 300 mm) of Cu (C11000), SS (304), brass (C28000), Al (1060) and Mg (AZ31B) with different thickness sheets are used as the calibration materials. (b) Self-made materials 1#–6#. (c) Actual scrap from waste vehicles or household appliances 7#–12#. The 1# to 6# test samples were placed on the belt line in different positions and postures for a multiple sets of data by repeated tests. In addition, a small amount of Ti (GR2) was used as the calibration sample.

2.2. Data Acquisition and Image Preprocessing

Under the parameter settings of this paper, the sampling value of each channel was the result of averaging 4 sub-samples. One thousand background signal (with radiation but without materials) values and one thousand transmission signal values of X-rays through each calibration sample were collected and averaged for calibration. As a result, the measurement value of low-energy integral of transmission signal before attenuation TL0, the measurement value of high-energy integral of transmission signal before attenuation TH0, measurement value of low-energy integral of transmission signal after attenuation TL and measurement value of high-energy integral of transmission signal after attenuation TH of most line-scan-direction channels could be obtained.
For the actual in-line data acquisition, when the acquisition of a frame (320 lines) of an image was completed, the real-time value of the Y-direction encoder was read immediately for position correction. Then the next frame of image acquisition was continued immediately. This was repeatedly conducted.
The image data need to be preprocessed. First, background noise should be removed from all collected original data. Second, the images should be filtered, which can be realized by using the adjacent data substitution method to filter the cross-talk noise of the fixed channels and then median filtering for the random salt-and-pepper noise of the whole image. Third, the initial low-energy TL0 and high-energy TH0 should be obtained before production begins. In order to reduce the influence on R_value calculation caused by ray-source fluctuation, the TL0 and TH0 of a certain number of real-time image data outside the range of materials should be averaged, that is, updating them by moving and filtering the mean value. Fourth, images should be segmented for threshold judgment and binary processing by low-energy shading SL. After that, the projection of each material in the X-Y plane can be considered as a material range and should be numbered. Then TL, TH and SL values of each pixel within the material range can be obtained to calculate R_value of each pixel according to Equation (7).

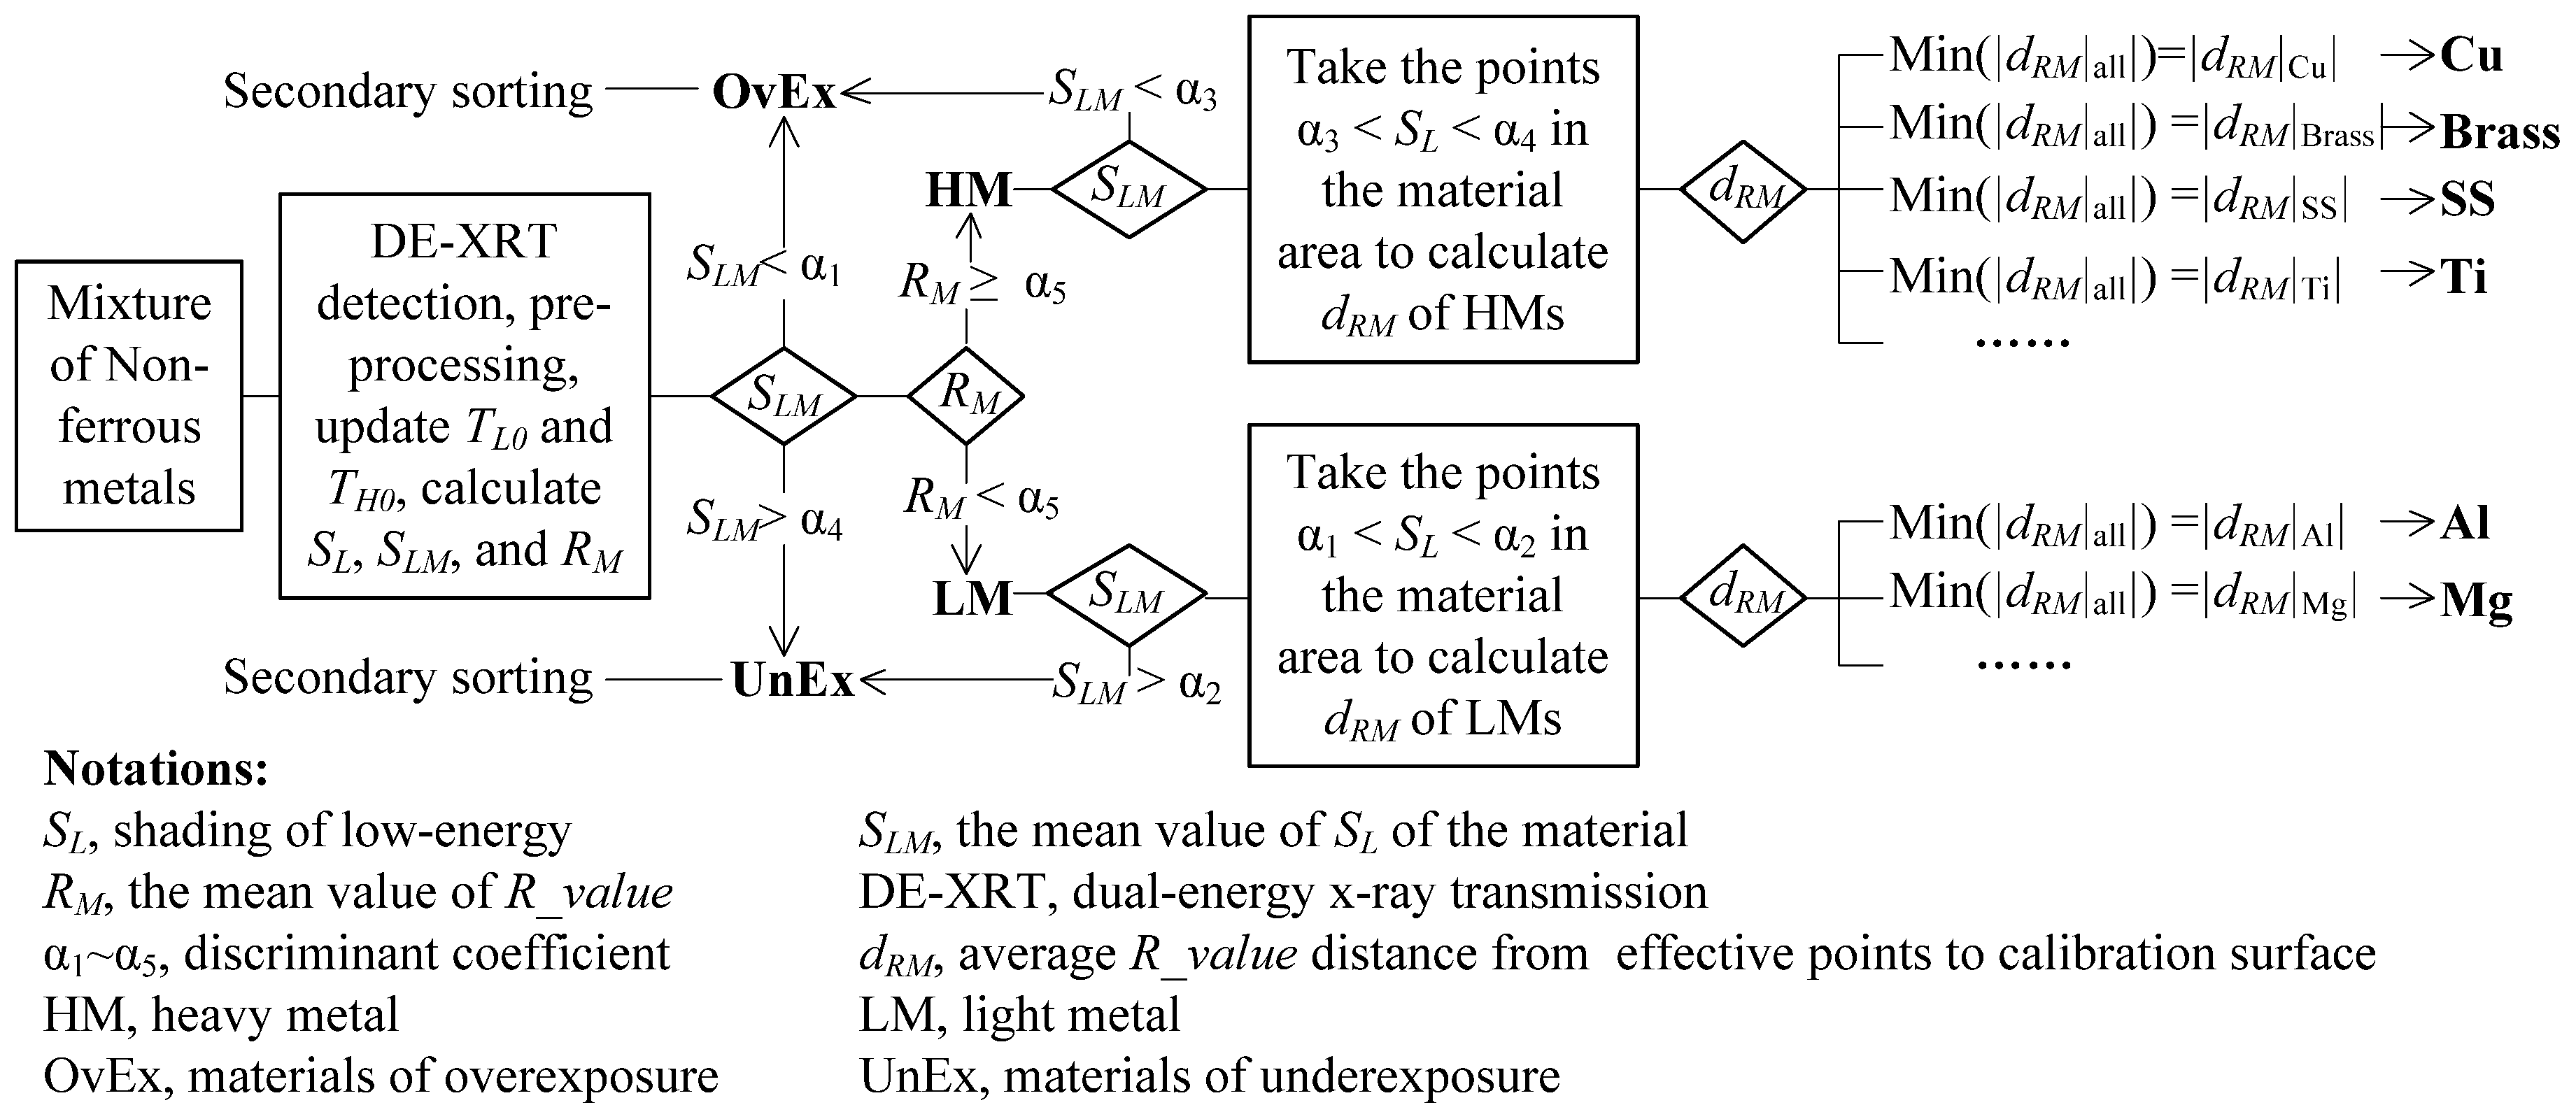
2.3. Material Identification

2.3.1. Identification by SL-x-R

For the sorting of bulk solid waste, material identification is a critical step. The schematic diagram of non-ferrous metal identification in this study is shown in Figure 4. As can be seen, material identification on the SL-R plane became easier. However, for heavy metals (HM) or light metals (LM), a small distance among R_value curves caused poor sorting. Taking the above difficulty into account, we used SL to judge the threshold, that is, over-small SL meant overexposure whereas over-large SL meant underexposure. Then we averaged the SL value of all pixels in the material range to obtain SLM, on the basis of which materials of overexposure and underexposure could be screened for secondary sorting because of their temporary unidentifiability. The effective (non-overexposed or non-underexposed) pixels (EP) in the material range were also selected for calculation of the difference between EP R_value and calibration-curve R_value. The result is defined as the signed distance, that is, the upper of curves is positive whereas the lower is negative. The method comparing the mean value of the above difference to identify materials (detailed in Section 2.3.3 below) can improve identification accuracy. Therefore, the SL-R plane can be divided into such four regions as overexposure, underexposure, HM-classifiable and LM-classifiable. On the basis of SL, unidentifiable materials with overexposure and underexposure were judged and screened, effective points within identifiable materials were selected for comparation of the mean value of R_value difference, all of which could solve an inaccurate R_value calculation caused by overexposure and underexposure in Section 1.4.1 and noise in Section 1.4.2 to a certain extent, so as to improve identification accuracy in Section 1.4.4.
Due to the fan-shaped effect (described in Section 1.4.3), different x-coordinates lead to a different X-ray spectrum composition which affects the R_value. Therefore, this paper introduces the coordinate value of line scan direction (channel number) x as a feature parameter for identification. In order to improve the identification accuracy, the SL-R-plane classification curve is extended to SL-x-R three-dimensional classification surface within the normal separable range. The data are calibrated in the SL-x-R space and fitted by nonlinear polynomial to form SL-x-R three-dimensional fitting calibration surface. If the points of the R_value calculated in the three-dimensional space are at or close to a certain calibration surface, the material can be identified as the one corresponding to the calibration surface, which can compensate for the fan-shaped effect.

2.3.2. Calibration

In this study, the standard grade materials of Cu, brass, SS, Ti, Al and Mg were used to collect the data of each channel under different thicknesses for calibration. The calibration procedure of SL-x-R three-dimensional fitting surface for a certain material is as follows: the multiple value points (SL, x, R) of the material with different thickness collected at different positions in X-direction are fitted by binary (SL, x) nonlinear polynomial with “rstool” instruction of MATLAB, and then the binary function fR (SL, x) of R_value calibration surface can be obtained.
Similarly, for calibration of material thickness, the above (SL, x, R) calibration data are changed to (SL, x, t). Then the binary function ft (SL, x) of thickness of the calibration surface can be obtained by using multiple data points (SL, x, t) collected from different materials with known thickness at different positions in the X-direction for binary nonlinear polynomial fitting.
Six coefficients of β1–β6 can be obtained by executing the “rstool” instruction of MATLAB, and the fitting equation is as follows:
S L = f R / t ( S L , x ) = β 1 + β 2 S L + β 3 x + β 4 S L x + β 5 S L 2 + β 6 x 2

2.3.3. R_Value Calibration Surface Nearest Neighbor Identification

According to the above judgment method of overexposure and underexposure (described in Section 2.3.1), the effective points (EP) within the material range can be selected.
Then, the algebraic mean value of the distance between EP R_value and the calibration surface can be evaluated, that is, the R_value at all effective points subtracts the R_value fR (SL, x) at the corresponding calibration surface and then the difference is averaged for mean value. The expression is shown in Equation (10). A series of dRM can be obtained according to Equation (10), and the material type is determined as that corresponding to the calibration surface with the minimum absolute value of dRM, which is the R_value calibration surface nearest neighbor identification.
d R M = 1 n E P ( R | S L , x f R ( S L , x ) )

2.3.4. Flow-Process of Identification

The identification flow-process diagram of this study is shown in Figure 5. After shredding, air separation, magnetic separation and eddy current separation, the bulk non-ferrous metal mixtures were further sorted by DE-XRT. When sorting, the values of TL0 and TH0 were updated continuously. For each material of the mixture scattered on the belt line, TL, TH and SL of each pixel in the material range, the mean of the shading of low-energy SLM and mean of R_value RM were all calculated. If SLM was less than threshold α1, the material was judged as an overexposed material (OvEx). If SLM was greater than threshold α4, the material was judged as an underexposed material (UnEx). The rest of the materials were judged as light metals (LM) if RM was less than the threshold value α5, otherwise they were judged as heavy metals (HM). For light metals, if SLM was greater than threshold α2, the material was determined as OvEx. Furthermore, the effective points with SL between α1 and α2, which were neither overexposed nor underexposed, were selected in the material range. According to different (SL, x), the mean signed distance dRM from them to the series of R_value calibration surfaces was calculated. The lower of the calibration surface was negative, whereas the upper was positive. The material type corresponding to the minimum calibration surface of dRM absolute value was judged as the material type to be identified. Similarly, for heavy metals, if the SLM was less than threshold α3, the material was determined as UnEx. Furthermore, the effective points with SL between α3 and α4 within the material range, which were neither overexposed nor underexposed, were taken to calculate the mean value of the series signed distance dRM and identify the material. The OvEx and UnEx could be secondary sorted. The threshold coefficient α1–α5 could be determined by the experimental results of material calibration combined with experience.

2.4. Mass and Center-of-Gravity Cordinates Calculation

According to material-type identification results, the SL-x-t thickness calibration surface function ft (SL, x) of each material could be assigned. According to this function, the mass and center-of-gravity coordinates of the material could be approximately calculated, and the calculation results are very important for the variable gas-ejection method in this paper to control the falling points of materials.
The shading of low-energy of all pixels in the material range can be used for approximate calculation of material mass, whose essence is to integrate the thickness t (expressed by function ft (SL, x)) of the material in the projection area of material (PAM) on the X-Y plane, and then multiply the integration evaluation by density and related constants of sorting system. The equation is as follows:
m = P A M ρ P x P y f t ( S L , x )
where Px is X-direction resolution of image, Py is Y-direction resolution of image, and ρ is density.
Calculation accuracy of approximate center-of-gravity coordinates on the X-Y plane can avoid posture change caused by material overturning in the process of gas-ejection, making the falling point more difficult to control. The calculation equations of center-of-gravity coordinates are as follows:
{ x = P A M x f t ( S L , x ) P A M f t ( S L , x ) y = P A M y f t ( S L , x ) P A M f t ( S L , x )

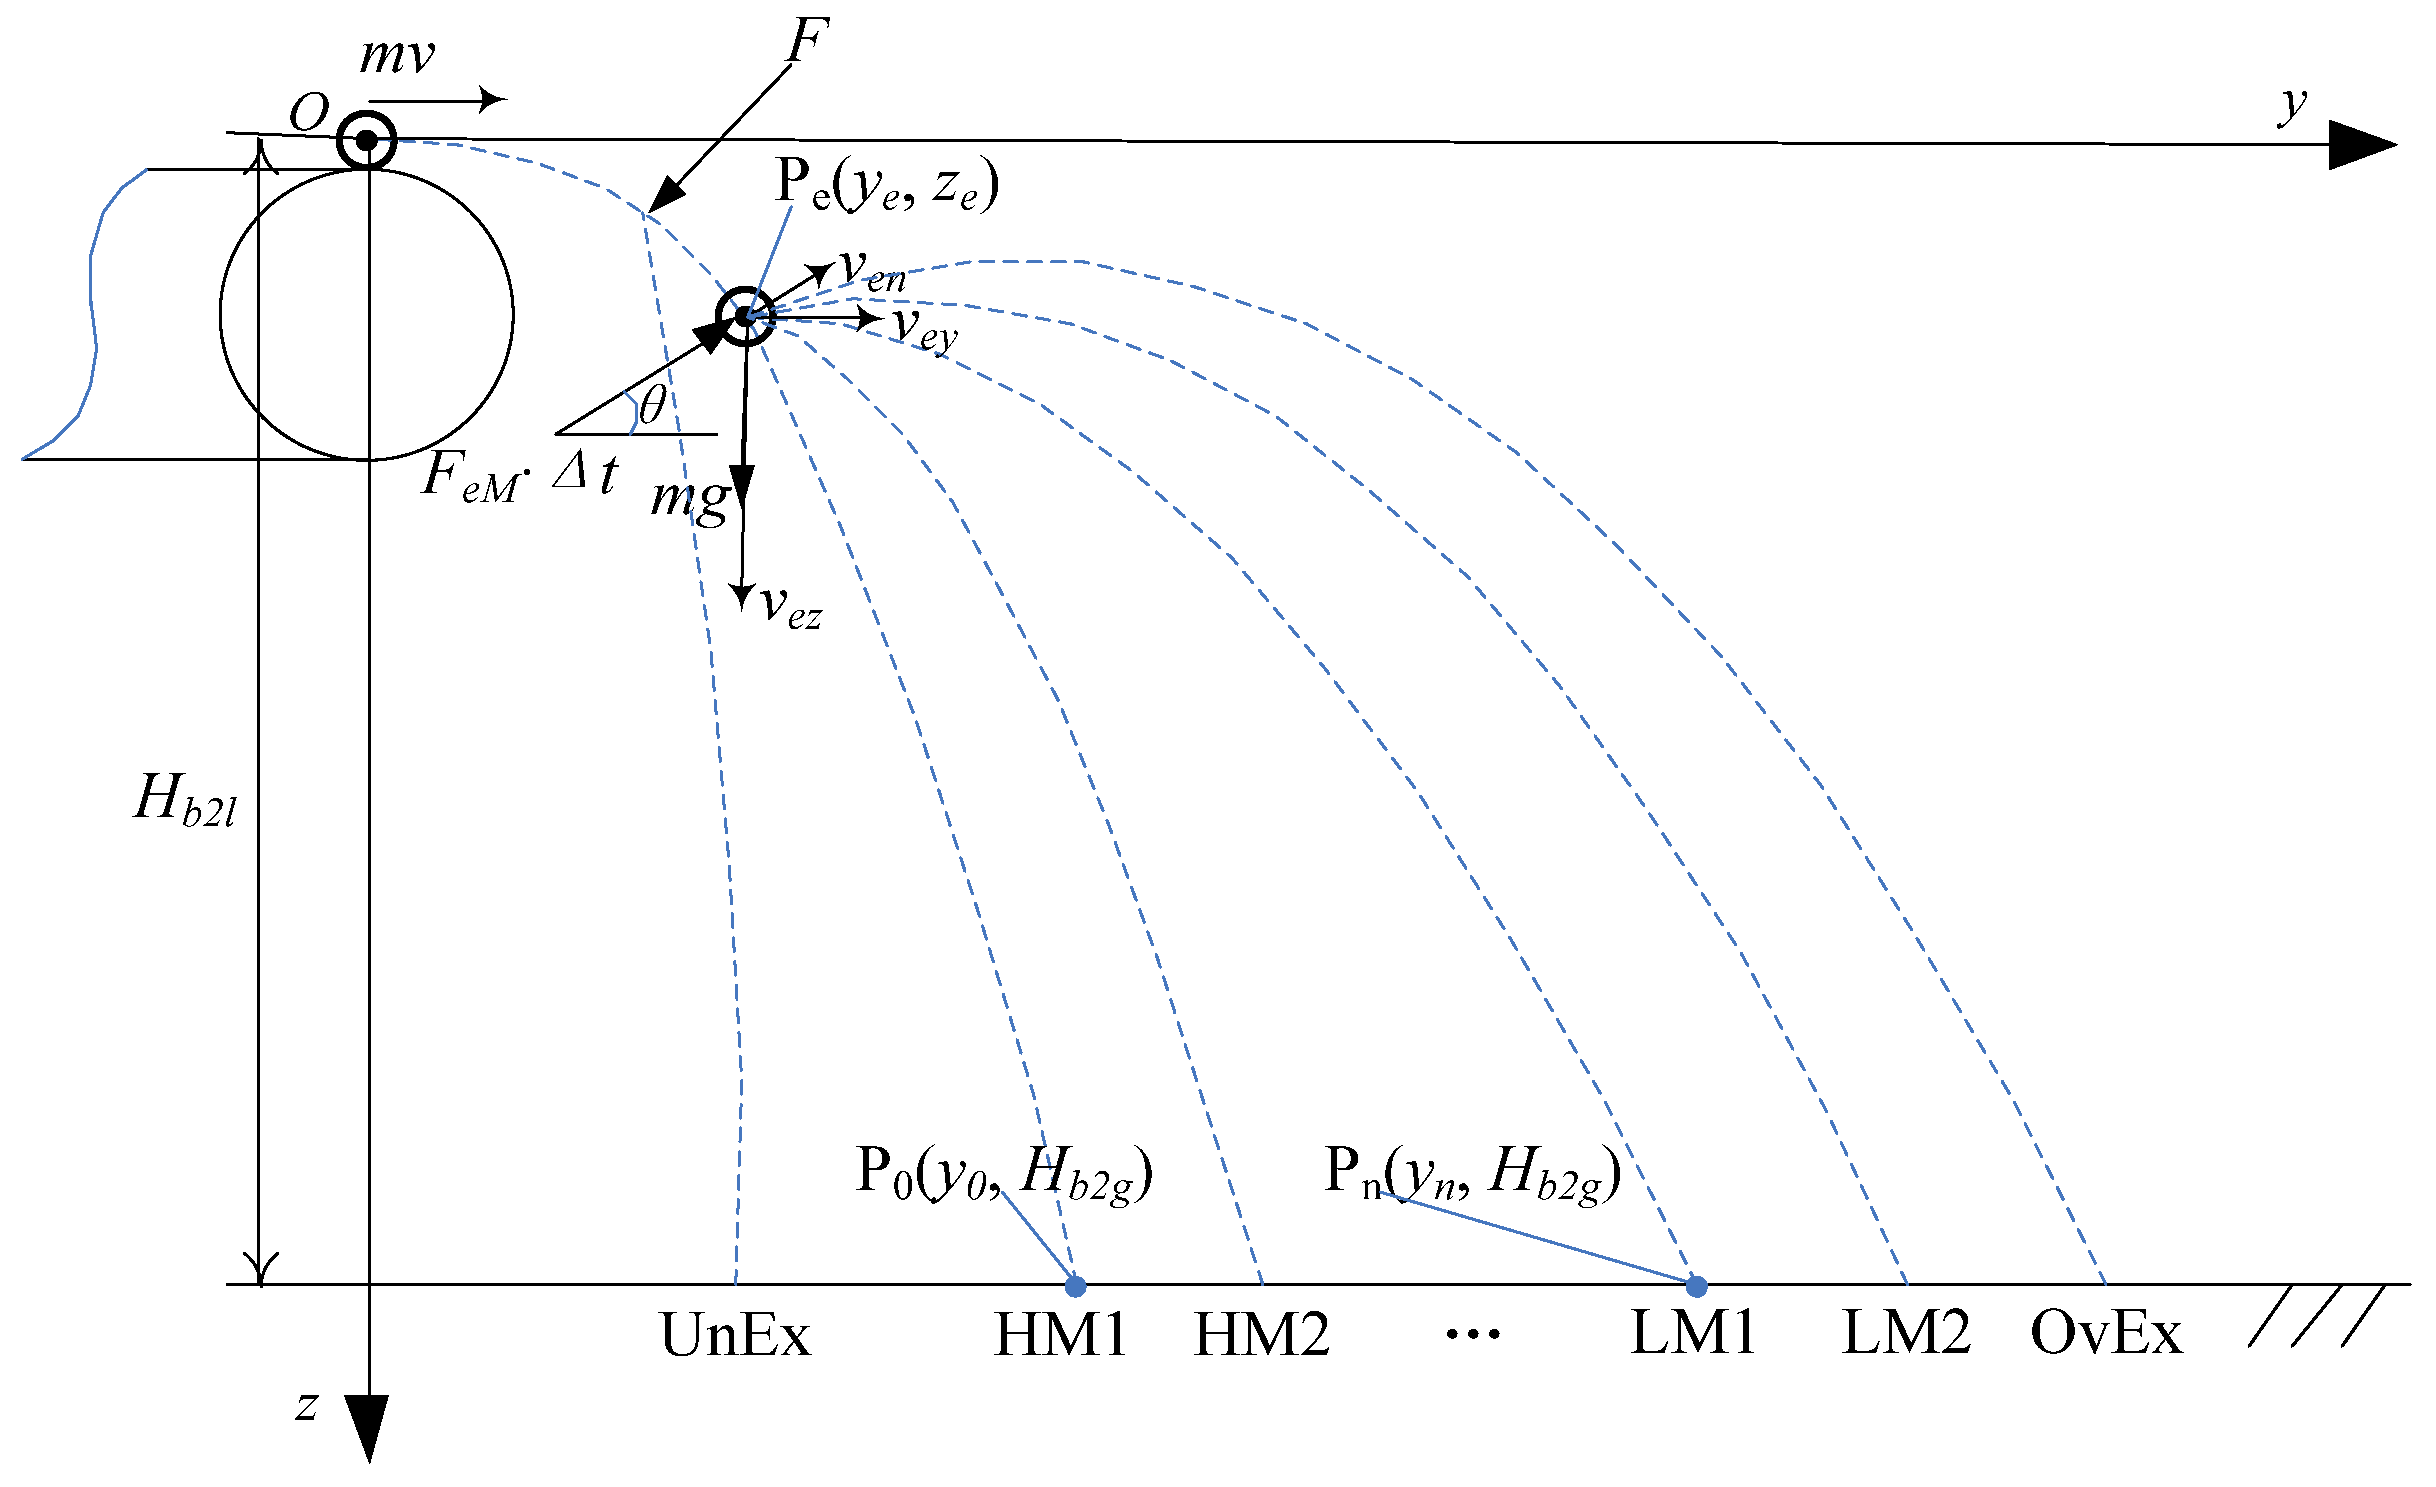
2.5. Separation of Variable Gas-Ejection

In-line separation is nearly as important as identification. For lighter materials, gas-ejection separation is most popular. As mentioned above, because the shading of low-energy and thickness calibration can be used to calculate the mass and center-of-gravity coordinates of materials, with which combines the variable gas-ejection, it is possible to achieve the in-line automatic sorting of multicategory scrap in one single measure, which would be a great solution to the sorting efficiency described in Section 1.4.5. In order to improve the traditional rejected−accepted method and realize identification and separation of multicategory materials in one detection, the variable gas-ejection separation method is used to control the falling point range of multicategory materials. The schematic diagram is shown in Figure 6.
Position synchronization and variable action on a range of materials during gas-ejection were also expounded comprehensively in our previous research work [39]. Here, variable gas pressure and/or variable action time were used to change the action impulse of gas-ejection, by which the falling points of various materials could be well controlled and one-time separation of various materials also could be realized. The operation principles are as follows: (i) gas pressure can be changed by means of analog signal to control the electro-pneumatic proportional valve. (ii) Action time can be changed by means of changing the ejection range of materials mentioned in Reference [39] because the action range of gas-ejection is directly proportional to the action time at constant line speed. For the shredded bulk materials, in general, the lower the density, the lighter the weight. Therefore, the falling point by gas-ejection of lower density materials should be usually controlled a little further. The action direction of gas-ejection at the ejection point was the normal direction of its trajectory, and the elevation angle of gas-ejection was θ.
If gas-ejection impulse Ie = FeM × △t, FeM is the mean action force of gas-ejection and △t is the action time of gas-ejection, the gas-ejection impulse Ie under the condition of preset separation distance yn is determined by the following equation:
I e = b b 2 4 a c 2 a
where,
D = g 2 t e 2 + v 2 a = 2 D m g ( t e 2 v 2 t e v y n g t e 2 H b 2 l ) b = 2 D 2 m 2 ( g 2 t e 2 y n + t e v 3 g 2 t e 3 v v 2 y n 2 g t e H b 2 l ) c = D 3 m 3 ( g y n 2 g t e 2 v 2 2 v 2 H b 2 l ) + g t e 2
where v is line speed of belt conveyor, te is time from material off belt to ejection point, Pe (ye, ze) is ejection point and its coordinates, P0 (y0, Hb2l) is free parabolic falling point and its coordinates, Pn (yn, Hb2l) is preset falling point and its coordinates, g is acceleration of gravity, Hb2l is vertical height of belt to falling point and m is mass of material, and the following equation holds:
t e = v g tan θ
y 0 = v 2 H b 2 l g
The mathematical derivation of the above conclusions is detailed in Appendix B.

3. Results and Discussion

When material (1# sample) was used for our experiment, its low-energy raw image, high-energy raw image, low-energy image with filtering and high-energy image with filtering are shown in Figure 7a–d, respectively. Each image selected is grayscale image featured by 320 × 320 pixels and 16-bit pixel depth data intercepted by high 8 bits of each pixel. Among them, the longitudinal dark stripes in the low-energy raw image (a) and the longitudinal light stripes in the high-energy raw image (b) were caused by the inherent cross-talk noise of the detector. From the filtered images in (c) and (d), it can be seen that median filtering (with 5 × 5 observation window) benefitted the filtering of cross-talk noise and random noise and protect edge information, improving material identification to a certain extent.

3.1. Shading of Low Energy

The shading of the low-energy image of sample 1# is shown in Figure 8a, and the shading of the high-energy image is shown in Figure 8b, both of which are grayscale images processed with shading (0–1) and converted into 8-bit depth. From Figure 8, it can be seen that the image of shading of low-energy SL was clear and smooth, close to real material mass thickness and almost free from cross-talk noise; while the image of shading of high-energy SH was different. In this paper, low-energy shading SL was selected as the parameter of material identification, mainly for the following reasons: (i) the random quantization error was small caused by low-energy X-ray without absorption of the intermediate copper sheet and hardening. (ii) The positive correlation crossing origin between SL and mass thickness was convenient for the calculation of thickness, mass, and center-of-gravity coordinates, which was clearer than negative correlation between SL and measurement value of low-energy integral of transmission signal after attenuation TL and less affected by X-ray source fluctuations. (iii) As the ratio value of shading degree, SL directly reflected material attenuation characteristics. Compared with the decreased value of energy integral of transmission signal Td, it reduced the fan-shaped effect to a certain extent. In short, the distortion out of the fan-shaped effect of the X-ray source and the cross-talk noise could be reduced to a certain extent by the shading of low-energy SL.

3.2. Overexposure and Underexposure

The SL-R calibration curves of several metals selected from the actual measurement data of a certain channel are shown in Figure 9, indicating that the separation degree of each curve corresponding to each metal in the SL-R plane was equivalent to the sorting ability of each. From Figure 9, it can be seen that though there was an evident discrimination between heavy metals and light metals, a tendency to an intersection of those still existed within the areas of the low SL and the high SL. The sorting ability was limited to a certain scope whatever the discrimination existed in several heavy metals or in several light metals, and always accompanied by a fluctuation of the curve or intersection within areas of the low SL and the high SL. One of the reasons for that was the unavoidable sensitivity of fluctuating measurement data in areas of overexposure and underexposure to the R_value calculation, so the easiest method to eliminate it was to remove the data during identification.
As a matter of fact, the fluctuation of the measurement value of the energy integral of transmission signal T is inevitable. When an overly small SL means overexposure with small SNR (signal to noise ratio), small CR (contrast ratio), T/T0 approaching to 1 and ln(T/T0) approaching 0, R_value is subject to large fluctuation in the measurements. Conversely, an overly large SL means underexposure. In that case, T/T0 tends to 0 and ln(T/T0) has a large slope at this value point; correspondingly, SNR is also large. As a result, the R_value will fluctuate greatly too. Experiments have found that whether SL is overly small or overly large, the R_value will be inaccurately calculated and each curve of SL-R image will intersect, possibly leading to false identification.
The discriminant coefficients of overexposure and underexposure relate to the equipment, and can be obtained according to experiment and experience. In this paper, the discriminant coefficients α1, α2, α3, and α4 were, respectively, taken as 0.2, 0.8, 0.3, and 0.9, which were combined with the mean value of shading of low-energy SLM to judge materials of overexposure or overexposure. Due to the overall mass thickness of the material as judgment basis, it was more convenient and reasonable than mechanical size screening. Meanwhile, overexposure and underexposure could also be used for judgment of effective points during material identification. The binary image of the effective points of a material is shown in Figure 10. Effective points are those which have disposed of the overexposed and the underexposed points in the material range. The differential values between each effective point R_value and corresponding calibration surface R_value were summed by algebra and averaged, whose mean value was used for material identification. Due to the application of the mean value, overexposed and underexposed points during identification could be eliminated and the chance of judgment depending on the R_value of individual pixels was avoided, which was equivalent to mean value filtering and consequently improved identification accuracy.

3.3. SL-x-R Calibration Surface Considering Fan-Shaped Effect

The SL-x-R calibration surface of light metals (Al, Mg) is shown in Figure 11, and that of heavy metals (Cu, brass, SS) is shown in Figure 12, from which it can be seen in the sortable range, the R_value was mainly related to SL and somewhat related to the position in the X-direction, that is, the fan-shaped effect also had a certain influence on it. For light metals, the overall R_value was less than 1.7, and the calibration surfaces of Al and Mg were close to each other; for heavy metals, the overall R_value was between 1.7 and 2.4, and the calibration surfaces of Cu, brass and SS were also close to each other. That shows when the discrimination coefficient α5 for light metals and heavy metals is taken by 1.7, it is easier to sort light metals from heavy metals but relatively difficult for identification of light metals or heavy metals.
Table 3 shows SL-x-R calibration surface coefficients with binary nonlinear polynomial and RMSE (root mean square error) of 5 materials (Mg, Al, SS, brass, and Cu). The RMSE between 0.018 and 0.027 was relatively small compared with the distance between fitting surfaces, indicating that each fitting surface was featured by sufficiently high accuracy.

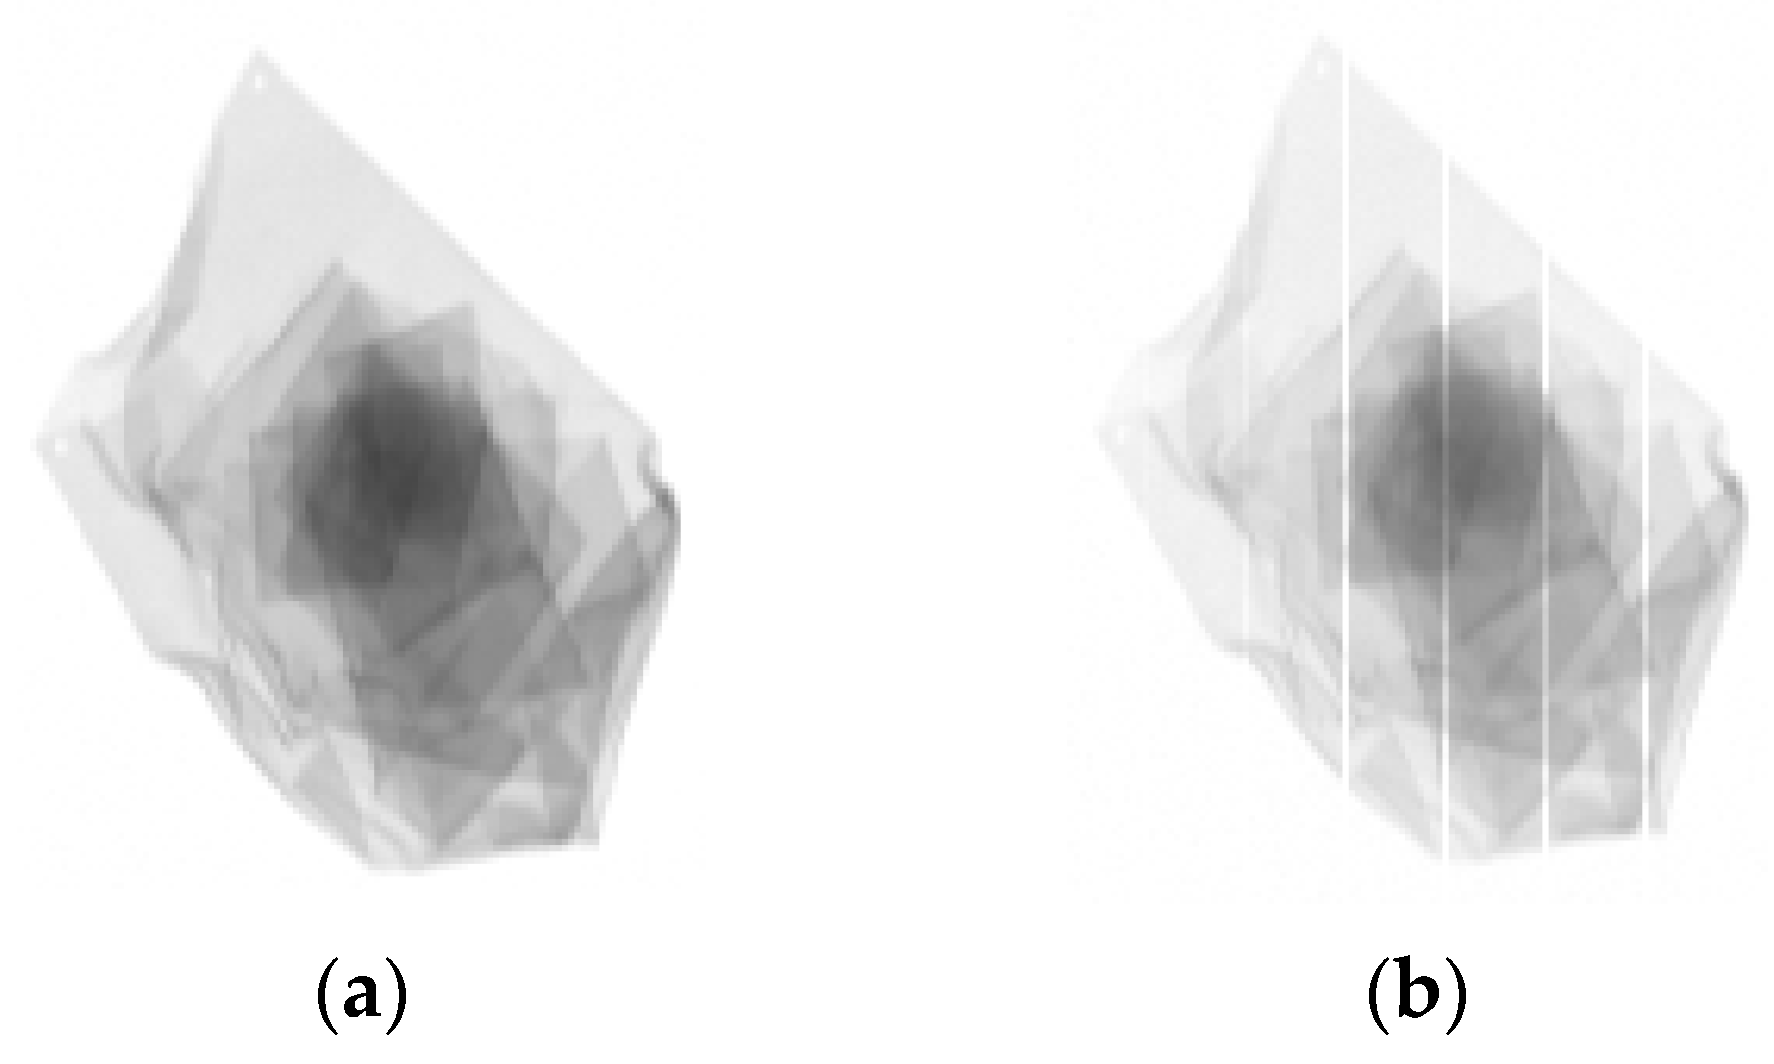
3.4. Identification by Nearest Neighbor Algorithm of Effective Points to R_Value Calibration Surfaces

The collected DE-XRT image data was input into our software for identification experiments by means of comparing mean distance between R_value of effective points and R_value calibration surface. Table 4 shows the statistical data for 1# sample, obtained from its position and posture in Figure 7 and calculated dRM according to Equation (10). For 1# sample identification, 2934 effective points out of 7618 points by means of Section 2.3.1 were judged. When dRM from Al calibration surface was less than that from Mg calibration surface, Al can be identified. The more effective the points were, the less random the error, indicating the mean effect of effective point dRM can improve identification accuracy.
Table 5 shows the identification statistics of self-made samples. The laboratory identification accuracy by count basis was 85.2%. If the accuracy was evaluated by weight, the identification results were as followed: 83.8% of Al recovered with 91% purity; 66.7% of Mg recovered with 39.7% purity; 85.7% of Cu recovered with 90.7% purity; and 70% of brass recovered with 68.4% purity. Among them, the purity grade of Mg was particularly low because the weight of 3# sample reached 1458 g, much heavier than those of 1#, 2# and 4# samples. The data of actual waste identification in Table 6 are correct according to experience and visual inspection.

3.5. Mass Culculation

The fitting of the thickness calibration surfaces of Al and Mg are shown in Figure 13. The coefficients of the polynomial fitting function for thickness calibration of Al and Mg are shown in Table 7. The mean values of the material mass after the calibration calculation and the actual mass data measured by electronic scale are shown in Table 8. The mass calculation results of the actual materials in different positions and postures were stable (including overexposed and underexposed points), whose error was less than 5% compared with the mass by electronic scale. When the calculated mass of sample 1# was 172 g (about 5% higher than the actual mass of 163.81 g), and the preset falling point distance yn was 600 mm, the calculated distance was 586 mm (θ = 45°, Hb2l = 0.8 m, v = 1 m/s, g= 9.8 m/S2) with 2.3% error according to Equation (A26), which is acceptable in application.

3.6. Center-of-Gravity Coordinates Calculation

The center-of-gravity coordinates of sample 1# calculated by the program and marked are shown in Figure 14a. The center of gravity G and center of form C of the material did not coincide. Two holes were drilled at positions A and B in the figure for rope suspension. The center of gravity measured and determined by the rope suspension method is shown in Figure 14b, the measurement static data are shown in Table 9. Comparing the distances from the center of gravity to hole A and hole B by calculation with those by the actual rope suspension method, the error was about 3.5%.
As shown in the above experimental results, the DE-XRT shading of low-energy as an important discriminant parameter can reduce the influence of fan-shaped effect, cross-talk noise and X-ray source noise on identification to a certain extent, and can judge overexposure and underexposure. The mean shading of low-energy of the material can be used to judge and select the overall overexposed materials and underexposed materials, both of which are difficult to identify under certain conditions. The selected effective points within the material range according to the shading threshold, combined with comparison of the R_value mean distance with the R_value calibration surface of SL-x-R, can identify the material, reduce the fan-shaped effect caused by the DE-XRT point X-ray source and improve the identification accuracy. The overall laboratory sample identification accuracy by count basis was 85%, and the identification accuracy of heavy and light metals reached 100%, which was good enough for the DE-XRT without other sensor fusion. The material mass and the center-of-gravity coordinates could be calculated combining the material identification with the integral calculation method of the SL-x-t thickness calibration surface, which is beneficial for the separation of identified materials and control of falling point distance by the gas-ejection method with variable gas pressure and/or action time. Therefore, it is possible to realize the automatic sorting of many kinds of bulk materials by DE-XRT at one time, and sorting quality and efficiency will be improved. Taking non-ferrous metal sorting throughput as an example, it is estimated at 50 ton/h with our method and it would increase accordingly when belt line width and line speed are both increased.
The method in this paper could make identification more accurate and refined, compared with security inspections limited to qualitative classification for explosives and non-explosives (see References [23,24,25]). It is simpler and easier to apply than the SQP algorithm in Reference [20], and does not need equipment parameters, such as accurate detection probability, accumulation factor, photon number, etc., which are usually difficult to obtain. It is featured by an identification accuracy equivalent to that of Delft University of Technology [5], but does not need to be equipped with sensors such as EMS. It uses part of the morphological features to calculate the mass and center-of-gravity coordinates and employs gas-ejection to realize in-line multicategory scrap identification and separation with one measurement. It is not affected by the previous shredding processes and equipment, though its overall identification accuracy by count basis is slightly lower than 90% compared with that from the method adopted by Koyanaka et al. [6]. It has strong material adaptability due to less influence from the thin layer contamination of the material surface, compared with color sorting [4], XFR [13] and LIBS [14]. It is closer to the practical engineering application than the methods of heat conduction [35] and magnetic induction [15,19]. The initial investment of this method is relatively higher than that proposed by Koyanaka et al. [6] or the color-sorting method; however, it has higher efficiency and lower long-term operation costs, due to multiple sorting at one measurement.
The method cannot make sorting of different aluminum alloys such as Alc and Alw more refined as reported by Koyanaka et al. [6], Delft University of Technology [5] and Takezawa et al. [19], which is mainly caused by the sole relationship between DE-XRT and Z. For further sorting, it is necessary to measure and acquire other physical properties including density, electrical conductivity, magnetic permeability, mechanical properties, etc., whereas the methods in the above literature all combine more than two kinds of sensors, which can make the sorting refined. There are several problems in our method to be further solved. For example, the material calibration required in the method leads to high costs in time and work. The resolution of the detector, the differences in the scintillators and their processing units, cross-talk noise, and random X-ray noise have a great influence on the recognition accuracy. In addition, there are many challenges for the identification of materials with close atomic numbers. For example, it is still difficult for industrial realization of large-scale identification and classification between Al and Mg, and between Cu, brass and SS. Therefore, enough effective points in the material range, good filtering, intelligent algorithms and equipment accuracy will be particularly important factors.
The simulation study on the control of gas-ejection falling point was conducted and the optimal ejection elevation angle was 40°, which can be seen in Reference [4]. The control of the falling point of variable gas-ejection may be affected by such factors as the ratio of shape characteristics of the material, mean thickness to area, the relationship between compressed gas pressure and time, air resistance, shape and diameter of nozzles, the opening and closing process of high frequency valves, etc. Because FLUENT simulation and related actual experiments are in progress, this paper is only for theoretical proof. Meanwhile, with respect to materials with overexposure and underexposure that need secondary sorting, the variable X-ray energy and recalibration with the same method in this paper can be taken into account, so as to further expand the sorting range, which is worthy of further research and experiment. For example, for secondary sorting, a reduction of tube voltage or tube current could be used for overexposed materials while an increase in the tube voltage or tube current should be considered for underexposed materials. Furthermore, an improvement in the adjustment range of the tube voltage and tube current of the X-ray source and the resolution of the detector could further expand the sorting range and facilitate the research into variable X-ray energy. In addition, there are some other optional research directions for the future, including research into the influence of copper sheet thickness between the low-energy scintillator and high-energy scintillator, research on the filter design, research on identification accuracy improvement by AI (artificial intelligence) algorithm or by training and correction of calibration surface coefficients according to newly marked material measurement data, etc.
The method proposed is particularly suitable for the sorting of pretreatment for non-ferrous metals of shredded scrapped vehicles and home appliances, which can improve the quality and efficiency of the sorting. It can also be extended to the sorting of non-metals such as glass, ceramics, plastics and other solid waste. Therefore, it has a good industrial application value and prospect.

4. Conclusions

In this study, the technology of DE-XRT combined with variable gas-ejection realized an in-line automatic sorting process for multicategory scrap of bulk non-ferrous metals in one measurement. The main findings and innovation are as follows:
  • By selecting the shading of low-energy as the main characteristic parameter, combined with the coordinates of detector line scan direction and comparing the mean distance between the R_value of each effective point within the material shadows and SL-x-R R_value calibration surface to identify non-ferrous metals, it can eliminate the influence of material thickness and the fan-shaped effect of the X-ray source, and thus improve material identification accuracy.
  • By means of threshold judgment of the low-energy shading, it can select unidentifiable overexposed and underexposed materials for secondary sorting.
  • By means of threshold judgment of low-energy shading, it can improve identification accuracy by screening effective points within the material shadows, which can be supported by laboratory results, including 85% identification accuracy by count basis, 100% identification accuracy of heavy and light metals.
  • Taking full advantage of additional morphological features from DE-XRT, it uses SL-x-t calibration surface thickness to calculate material mass and center-of-gravity coordinates, with the former error less than 5% and the latter error less than 4%. Meanwhile, the application of the variable gas-ejection can realize the measurement and identification of in-line automatic separation for multicategory materials at one time, and thus improve sorting efficiency.
The method in this paper can be applied to sort bulk solid waste with fixed shape and deformation resistance, as a result of its features of high accuracy, high efficiency, low operation cost, dry-type sorting and zero secondary pollution. In the future, identification accuracy and classification of solid waste sorting will be improved by a combination of DE-XRT and other sensors, which is worthy of further research. Therefore, this technology has fair potential and competitive power in industrial applications.

Author Contributions

Conceptualization, T.X. and W.Y.; methodology and software, T.X.; validation, T.X. and X.X.; formal analysis and investigation, T.X. and X.X.; resources, T.X.; data curation, T.X.; writing—original draft preparation, T.X.; writing—review and editing, T.X.; visualization, T.X.; supervision, X.X.; project administration and funding acquisition, W.Y. All authors have read and agreed to the published version of the manuscript.

Funding

This research was funded by the Jiangsu Provincial Key Research & Development Program of China, grant number BE2020779 and BE2018722; the Jiangsu Provincial Science and Technology Support Program of China, grant number BE2013715; and the Jiangsu Provincial Special Fund for Transformation of Scientific and Technological Achievements of China, grant number BA2014067.

Institutional Review Board Statement

Not applicable.

Informed Consent Statement

Not applicable.

Data Availability Statement

Data form this study can be made available upon request to the corresponding author after executing appropriate data sharing agreement.

Conflicts of Interest

The authors declare no conflict of interest.

Abbreviations

DE-XRTDual-energy X-ray Transmission
ECSEddy Current Aeparation
ECTEddy Current Test
XRTX-ray Transmission
XRFX-ray Fluorescence
LIBSLaser-induced Breakdown Spectroscopy
EMSElectromagnetic Sensor
SQPSequential Quadratic Programming
MCNPMonte Carlo N-Particle
SSStainless Steel
NM-SSNon-magnetic Stainless steel
AlAluminum
AlcWrought Aluminum Alloy
AlwCast Aluminum Alloy
MgMagnesium
CuCopper
TiTitanium
PCA-SVMPrincipal Component Analysis-Support Vector Machines
3DThree-dimensional
CTComputed Tomography
SDStandard Deviation
SNRSignal to Noise Ratio
CRContrast Ratio
IPCIndustrial Personal Computer
MCIOMotion Control and Input/Output
PCIPeripheral Component Interconnect
GigEGigabit Ethernet
PCPersonal Computer
OSOperating System
HMIHuman−machine Interface
LMLight Metal
HMHeavy Metal
OvExMaterials of Overexposure
UnExMaterials of Underexposure
EPEffective Points
PAMProjection Area of Material
RMSERoot Mean Square Error
G (xgc, ygc)center-of-gravity and its coordinates
Pe (ye, ze)ejection point and its coordinates
Pn (yn, Hb2g)preset falling point and its coordinates
P0 (y0, Hb2g)free parabolic falling point and its coordinates
Ienergy intensity after attenuation
I0energy intensity before attenuation
μlinear attenuation coefficient
tthickness of material
μmmass attenuation coefficient
ρdensity
ρtmass thickness
σcross-section
NAAvogadro’s constant
Arelative atomic mass
Zatomic number
Zeffeffective atomic number
Eenergy
σpecross-section of photoelectric effect
σsccross-section of photon scattering
R/R_valuetransparency natural logarithm ratio of low energy to high energy
Tenergy integral value of transmission signal
Tddecrease value of energy integral of transmission signal
TLlow-energy integral value of transmission signal after attenuation
THhigh-energy integral value of transmission signal after attenuation
TL0low-energy integral value of transmission signal before attenuation
TH0high-energy integral value of transmission signal before attenuation
SLshading of low-energy
SHshading of high-energy
N (E)photon number from E to dE
Pd (E)photon detection probability (efficiency) under energy E
Hf2dthe shortest distance from focus to detector
dxthe distance from the detected pixel to the focus foot point on the detector
xchannel serial number in X direction
fR (SL, x)R_value fitting binary function of SL and x
ft (SL, x)thickness fitting binary function of SL and x
Beta1~Beta6fitting coefficient of binary nonlinear polynomial surface
dRMmean of R_value distance from effective points to R_value calibration surface
RMmean of R_value
α1overexposure discrimination threshold coefficient of light metals
α2underexposure discrimination threshold coefficient of light metals
α3overexposure discrimination threshold coefficient of heavy metals
α4underexposure discrimination threshold coefficient of heavy metals
α5discrimination threshold coefficient of light metals and heavy metals
SLMmean of shading of low-energy
Pxthe x-accuracy (pitch) of the line scan detector, i.e., the resolution of the detector
Pythe y-accuracy of the line scan detector
mmass
gacceleration of gravity
Hb2lvertical height from belt to falling point
vline speed of belt conveyor
tetime from material off belt to ejection point
θelevation angle of gas-ejection
Ieimpulse of gas-ejection
FeMthe mean action force of gas-ejection
△tthe action time of gas-ejection

Appendix A

The technique of X-ray transmission is widely used in such domains as medicine, security inspection, industry, etc. When an ideal narrow beam, single energy and monochromatic X-ray penetrates through a material with thickness t, its energy intensity is attenuated exponentially in accordance with the Beer−Lambert Law [19] as follows:
I = I 0 e μ t = I 0 e μ m ρ t
where I0 (keV) and I (keV) are, respectively, the measured values of X-ray energy intensity before and after penetration, μ (cm−1) is the linear attenuation coefficient, μm (cm2/g) is mass attenuation coefficient, t (cm) is material thickness, ρ (g/cm3) is the material density, and ρt (g/cm2) is also called mass thickness. For μ and μm, the equations are as follows:
μ = σ N A ρ A
μ m = μ ρ = σ N A ρ A
where σ (cm2/atom) is cross-section, NA (atom/mole) is Avogadro constant, and A (g/mole) is relative atomic mass. For medium and low energy (below 800 keV) X-ray transmission, the total cross-section can be composed of a photoelectric effect cross-section σpe and photon scattering cross-section σsc. The photoelectric effect cross-section is a function of atomic number Z and energy E [27], which is proportional to Z4~5 and inversely proportional to E3. The photon scattering cross-section is proportional to E, i.e.,
σ ( Z , E ) = σ p e ( Z 4 ~ 5 , E 3 ) + Z σ S C ( E )
It should be noted that for high energy (MeV level) X-ray transmission [27,32], the cross-section also includes that of electron pair effect σpp, which is proportional to Z2. High energy X-ray is generally used in security inspection systems such as containers, and this paper will not discuss it.
From the Equations (A1) and (A2), it can be concluded that:
ln ( I 0 / I ) = μ t = σ ( Z , E ) N A A ρ t
For dual-energy monochromatic X-ray transmission, it can be obtained from Equation (A5) that:
{ ln ( I 10 / I 1 ) = μ 1 t = σ ( Z , E 1 ) N A A ρ t ln ( I 20 / I 2 ) = μ 2 t = σ ( Z , E 2 ) N A A ρ t
The R_value of dual-energy monochromatic XRT is defined as follows:
R = ln ( I 1 / I 01 ) ln ( I 2 / I 02 ) = ln ( I 01 / I 1 ) ln ( I 02 / I 2 ) = μ 1 μ 2 = σ ( Z , E 1 ) σ ( Z , E 2 )
where I01 and I1 are, respectively, the measured values of the energy intensity of monochromatic X-ray before and after attenuation of energy E1, I02 and I2 are, respectively, the measured values of the energy intensity of monochromatic X-ray before and after attenuation of energy E2. The two ratios of I1/I01 and I2/I02 can be obtained by measurement. E1 and E2 are the energy of known constant monochromatic X-ray. The R_value is the ratio of the attenuation cross-section of two kinds of energy, which changes monotonously with Z. From Equation (A7), it can be seen that the R_value has nothing to do with the mass density and thickness of the material; in the low energy (10–100 kV) range, the photoelectric effect is dominant and the R_value is strongly related to Z; in the medium energy (100–300 kV) region, the Compton effect is dominant and the R_value is weakly related to Z. Therefore, the atomic number Z of materials can be identified by R_value, so as to identify material types.
In engineering, the ideal narrow beam and monochromatic X-ray are not easy to obtain, and the bremsstrahlung X-ray source produced by cathode rays bombarding an anode target accelerated by electric field is the most common. This X-ray is a continuous spectrum whose maximum energy (keV) is equal to the tube voltage (kV) in value and the former is determined by the latter. For continuous spectrum X-rays that pass through a homogeneous material, using an energy-integrating detector, the value of the transmitted signal after passing through the object is:
T = 0 E i n N ( E ) P d ( E ) E e μ ( E ) t d E
where E is energy of X-ray photons, Ein is the highest energy of the input continuous spectrum, N (E) is the number of X-ray photons between E and dE, Pd (E) is the probability (efficiency) of photon detection with energy E, B (E) is the accumulation factor, μ (E) is the linear attenuation coefficient. For dual-energy X-ray transmission with maximum energy EH and EL, there are the following nonlinear integral equations:
{ T L = 0 E L N ( E ) P d ( E ) E e μ ( E ) t d E T H = 0 E H N ( E ) P d ( E ) E e μ ( E ) t d E
Similarly, the R_value of continuous spectrum DE-XRT is defined as:
R = ln ( T L / T L 0 ) ln ( T H / T H 0 )
where TL0 and TH0 are, respectively, the measured values of the low-energy and high-energy integral of the transmission signal before attenuation. TL/TL0 and TH/TH0 are defined as low-energy and high-energy transparency, respectively. The following R_values are defined by Equation (A10). Because of the influence of integration, both the coefficient of the integration term and the linear attenuation coefficient in exponential terms in Equation (A9) are functions of energy E of integration variable, so the calculation of R_value in Equation (A10) cannot remove the influence of thickness t, that is, the R_value is not only related to the atomic number Z, relative atomic mass A and density ρ, but also related to the thickness t of the material. Therefore, DE-XRT method cannot directly identify the atomic number and the material according to the R_value calculated by Equation (A10), and the influence of thickness needs to be removed.
For a homogeneous compound or mixture, if the percentage content of each element constituting the object is ωi, the corresponding mass attenuation coefficient of each element is μmi, the corresponding atomic number of each element is Zi, and its effective atomic number is Zeff, one of the calculation methods of the effective atomic number and its mass attenuation coefficient are as follows [40]:
Z e f f = i ω i Z i
μ m = i ω i μ m i
Therefore, the above Equation (A10) is also applicable to homogeneous compounds or mixtures, that is, for known mixtures or compounds, the DE-XRT method based on the R_value of Equation (A10) can also be used for material identification.

Appendix B

As shown in Figure 6, the gas-ejection of the ejection point is along normal line of the material trajectory, where the elevation angle of gas-ejection is θ, and the line speed of belt conveyor is v. Supposing that te is the time from material off the belt to ejection point, Pe (ye, ze) is the ejection point and its coordinates, P0 (y0, Hb2l) is the free parabolic falling point and its coordinates, Pn (yn, Hb2l) is the preset falling point and its coordinates, and g is acceleration of gravity, then there are:
y e = v t e , z e = g t e 2 2
tan θ = v g t e t e = v g tan θ
cos θ = 1 1 + tan 2 θ = g t e g 2 t e 2 + v 2
sin θ = cos θ tan θ = v g 2 t e 2 + v 2
where Hb2l is the vertical height of belt to falling point, t0 is the free parabolic falling time. Then there are:
H b 2 l = 1 2 g t 0 2 t 0 = 2 H b 2 l g
y 0 = v t 0 = v 2 H b 2 l g
The velocity vey in Y-direction and the velocity vez in Z-direction before the gas ejection at gas-ejection point have the following equation:
v e y = v , v e z = g t e
If the gas-ejection impulse Ie = FeM × Δt, FeM is the average force of gas-ejection, Δt is the action time of gas-ejection and m is mass of the material, then, according to the momentum theorem, the normal velocity after ejection at the gas-ejection point is:
I e = F e M Δ t = m v e n v e n = I e m
The velocity vpey in Y-direction and the velocity vpez in Z-direction after the gas ejection at gas-ejection point have the following equations:
{ v p e y = v e n cos θ + v e y v p e z = v e z v e n sin θ
Placing Equations (A14)−(A16), (A19) and (A20) into Equation (A21), we obtain
{ v p e y = g t e I e m g 2 t e 2 + v 2 + v v p e z = g t e v I e m g 2 t e 2 + v 2
Supposing that the time from the material off the belt to landing (falling point) is tn, then there are trajectory equations:
{ y = v t z = 1 2 g t 2 , t [ 0 , t e ]
{ y = v p e y ( t t e ) + y e z = v p e z ( t t e ) + 1 2 g ( t t e ) 2 + z e , t [ t e , t n ]
Placing Equation (A22) into Equation (A24), we obtain:
{ y = ( g t e I e m g 2 t e 2 + v 2 + v ) ( t t e ) + v t e z = ( g t e v I e m g 2 t e 2 + v 2 ) ( t t e ) + 1 2 g ( t t e ) 2 + g t e 2 2 , t [ t e , t n ]
Equations (A23) and (A25) constitute the trajectory equations of material off belt to falling point. When actually controlling gas-ejection, the distance yn of falling point to be controlled is placed into the first equation of Equation (A25), we obtain:
y n = ( g t e I e m g 2 t e 2 + v 2 + v ) ( t n t e ) + v t e
Thus, the variable tn can be solved as follows:
t n = g t e 2 I e + m y n g 2 t e 2 + v 2 g t e I e + m v g 2 t e 2 + v 2
Placing Equation (A27) into the second equation of Equation (A25), we can obtain:
z ( t n ) = H b 2 l = ( g t e v I e m g 2 t e 2 + v 2 ) ( g t e 2 I e + m y n g 2 t e 2 + v 2 g t e I e + m v g 2 t e 2 + v 2 t e ) + 1 2 g ( g t e 2 I e + m y n g 2 t e 2 + v 2 g t e I e + m v g 2 t e 2 + v 2 t e ) 2 + g t e 2 2
In Equation (A28), Hb2l, g and v are all constants; te can be calculated according to Equation (A14) and is also a constant because the gas-ejection elevation angle θ is constant; and m can be calculated after material identification.
Let be
D = g 2 t e 2 + v 2 a = 2 D m g ( t e 2 v 2 t e v y n g t e 2 H b 2 l ) b = 2 D 2 m 2 ( g 2 t e 2 y n + t e v 3 g 2 t e 3 v v 2 y n 2 g t e H b 2 l ) c = D 3 m 3 ( g y n 2 g t e 2 v 2 2 v 2 H b 2 l ) + g t e 2
We can obtain the quadratic equation of one unknown variable of gas-ejection impulse Ie:
a I e 2 + b I e + c = 0
Then, the root Ie of Equation (A29) is
I e = b ± b 2 4 a c 2 a
Since ye < yn, and such parameters as D, m, g, te, v and Hb2l are all greater than 0, then
a = 2 D m g [ t e v ( t e v y n ) g t e 2 H b 2 l ] = 2 D m g [ t e v ( y e y n ) g t e 2 H b 2 l ] < 0
and because Ie > 0, when Hb2l > ze, so there is a unique solution of Ie:
I e = b b 2 4 a c 2 a

References

  1. Gundupalli, S.P.; Hait, S.; Thakur, A. A review on automated sorting of source-separated municipal solid waste for recycling. Waste Manag. 2017, 60, 56–74. [Google Scholar] [CrossRef] [PubMed]
  2. Smith, Y.R.; Nagel, J.R.; Rajamani, R.K. Eddy current separation for recovery of non-ferrous metallic particles: A comprehensive review. Miner. Eng. 2019, 133, 149–159. [Google Scholar] [CrossRef]
  3. Kaya, M. Recovery of metals and nonmetals from electronic waste by physical and chemical recycling processes. Waste Manag. 2016, 57, 64–90. [Google Scholar] [CrossRef] [PubMed]
  4. Wang, C.; Hu, Z.; Pang, Q.; Hua, L. Research on the classification algorithm and operation parameters optimization of the system for separating non-ferrous metals from end-of-life vehicles based on machine vision. Waste Manag. 2019, 100, 10–17. [Google Scholar] [CrossRef] [PubMed]
  5. Mesina, M.B.; Jong, T.P.R.; Dalmijn, W.L. Automatic sorting of scrap metals with a combined electromagnetic and dual energy X-ray transmission sensor. Int. J. Miner. Process. 2007, 82, 222–232. [Google Scholar] [CrossRef]
  6. Koyanaka, S.; Kobayashi, K. Automatic sorting of lightweight metal scrap by sensing apparent density and three-dimensional shape. Resour. Conserv. Recycl. 2010, 54, 571–578. [Google Scholar] [CrossRef]
  7. Bi, H.; Zhu, H.; Zu, L.; Bai, Y.; Gao, S.; Gao, Y. A new model of trajectory in eddy current separation for recovering spent lithium iron phosphate batteries. Waste Manag. 2019, 100, 1–9. [Google Scholar] [CrossRef]
  8. Ruan, J.; Dong, L.; Zheng, J.; Zhang, T.; Huang, M.; Xu, Z. Key factors of eddy current separation for recovering aluminum from crushed e-waste. Waste Manag. 2017, 60, 84–90. [Google Scholar] [CrossRef] [PubMed]
  9. Salama, A.; Richard, G.; Medles, K.; Zeghloul, T.; Dascalescu, L. Distinct recovery of copper and aluminum from waste electric wires using a roll-type electrostatic separator. Waste Manag. 2018, 76, 207–216. [Google Scholar] [CrossRef]
  10. Richard, G.; Touhami, S.; Zeghloul, T.; Dascalescu, L. Optimization of metals and plastics recovery from electric cable wastes using a plate-type electrostatic separator. Waste Manag. 2017, 60, 112–122. [Google Scholar] [CrossRef]
  11. Zhao, P.; Xie, J.; Gu, F.; Sharmin, N.; Hall, P.; Fu, J. Separation of mixed waste plastics via magnetic levitation. Waste Manag. 2018, 76, 46–54. [Google Scholar] [CrossRef] [PubMed]
  12. Jordao, H.; Sousa, A.J.; Carvalho, M.T. Optimization of wet shaking table process using response surface methodology applied to the separation of copper and aluminum from the fine fraction of shredder ELVs. Waste Manag. 2016, 48, 366–373. [Google Scholar] [CrossRef]
  13. Bezati, F.; Froelich, D.; Massardier, V.; Maris, E. Addition of X-ray fluorescent tracers into polymers, new technology for automatic sorting of plastics: Proposal for selecting some relevant tracers. Resour. Conserv. Recycl. 2011, 55, 1214–1221. [Google Scholar] [CrossRef] [Green Version]
  14. Cho, M.; Park, S.; Kwon, E.; Jeong, S. A waste metal sorting system using LIBS classification. In Proceedings of the 2019 IEEE 28th International Symposium on Industrial Electronics (ISIE), Vancouver, BC, Canada, 12–14 June 2019; pp. 451–454. [Google Scholar]
  15. Otoole, M.D.; Karimian, N.; Peyton, A.J. Classification of Nonferrous Metals Using Magnetic Induction Spectroscopy. IEEE Trans. Ind. Inform. 2018, 14, 3477–3485. [Google Scholar] [CrossRef] [Green Version]
  16. Picon, A.; Ghita, O.; Whelan, P.F.; Iriondo, P.M. Fuzzy Spectral and Spatial Feature Integration for Classification of Nonferrous Materials in Hyperspectral Data. IEEE. Trans. Ind. Inform. 2009, 5, 483–494. [Google Scholar] [CrossRef]
  17. Cossu, R.; Lai, T. Automotive shredder residue (ASR) management: An overview. Waste Manag. 2015, 45, 143–151. [Google Scholar] [CrossRef] [PubMed]
  18. Buekens, A.; Zhou, X. Recycling plastics from automotive shredder residues: A review. J. Mater. Cycles Waste Manag. 2014, 16, 398–414. [Google Scholar] [CrossRef]
  19. Takezawa, T.; Uemoto, M.; Itoh, K. Combination of X-ray transmission and eddy-current testing for the closed-loop recycling of aluminum alloys. J. Mater. Cycles Waste Manag. 2015, 17, 84–90. [Google Scholar] [CrossRef]
  20. Mazoochi, A.; Rahmani, F.; Davani, F.A.; Ghaderi, R. A novel numerical method to eliminate thickness effect in dual energy X-ray imaging used in baggage inspection. Nucl. Instrum. Methods Phys. Res. A 2014, 763, 538–542. [Google Scholar] [CrossRef]
  21. Neubert, K.; Wotruba, H. Investigations on the Detectability of Rare-Earth Minerals Using Dual-Energy X-ray Transmission Sorting. J. Sustain. Metall. 2017, 3, 3–12. [Google Scholar] [CrossRef]
  22. Ketelhodt, L.; Bergmann, C. Dual energy X-ray transmission sorting of coal. J. S. Afr. Min. Metall. 2010, 110, 371–378. [Google Scholar]
  23. Mouton, A.; Breckon, T.P. A review of automated image understanding within 3D baggage computed tomography security screening. J. X-ray Sci. Technol. 2015, 23, 531–555. [Google Scholar] [CrossRef] [Green Version]
  24. Pourghassem, H. A novel material detection algorithm based on 2D GMM-based power density function and image detail addition scheme in dual energy X-ray images. J. X-ray Sci. Technol. 2012, 20, 213–228. [Google Scholar] [CrossRef] [PubMed]
  25. Beldjoudi, G.; Rebuffel, V.; Verger, L.; Kaftandjian, V.; Rinkel, J. An optimised method for material identification using a photon counting detector. Nucl. Instrum. Methods Phys. Res. A 2012, 663, 26–36. [Google Scholar] [CrossRef]
  26. Kimoto, N.; Hayashi, H.; Asahara, T.; Mihara, Y.; Kanazawa, Y.; Yamakawa, T.; Yamamoto, S.; Yamasaki, M.; Okada, M. Precise material identification method based on a photon counting technique with correction of the beam hardening effect in X-ray spectra. Appl. Radiat. Isot. 2017, 124, 16–26. [Google Scholar] [CrossRef]
  27. Li, L.; Li, R.; Zhang, S.; Zhao, T.; Chen, Z. A dynamic material discrimination algorithm for dual MV energy X-ray digital radiography. Appl. Radiat. Isot. 2016, 114, 188–195. [Google Scholar] [CrossRef] [PubMed]
  28. Roshani, M.; Phan, G.; Roshani, G.H.; Hanus, R.; Nazemi, B.; Corniani, E.; Nazemi, E. Combination of X-ray tube and GMDH neural network as a nondestructive and potential technique for measuring characteristics of gas-oil–water three phase flows. Measurement 2021, 168, 108427. [Google Scholar] [CrossRef]
  29. Tomaru, R.; Done, C.; Ohsuga, K.; Odaka, H.; Takahashi, T. The thermal-radiative wind in low-mass X-ray binary H1743− 322–II. Iron line predictions from Monte Carlo radiation transfer. Mon. Not. R. Astron. Soc. 2020, 494, 3413–3421. [Google Scholar]
  30. Roshani, M.; Phan, G.T.; Ali, P.J.; Roshani, G.H.; Hanus, R.; Duong, T.; Corniani, E.; Nazemi, E.; Kalmoun, E.M. Evaluation of flow pattern recognition and void fraction measurement in two phase flow independent of oil pipeline’s scale layer thickness. Alex. Eng. J. 2021, 60, 1955–1966. [Google Scholar] [CrossRef]
  31. Salgado, W.L.; Dam, R.S.D.F.; Teixeira, T.P.; Conti, C.C.; Salgado, C.M. Application of artificial intelligence in scale thickness prediction on offshore petroleum using a gamma-ray densitometer. Radiat. Phys. Chem. 2020, 168, 108549. [Google Scholar] [CrossRef]
  32. Rogers, T.W.; Jaccard, N.; Morton, E.J.; Griffin, L.D. Automated X-ray image analysis for cargo security: Critical review and future promise. J. X-ray Sci. Technol. 2017, 25, 33–56. [Google Scholar] [CrossRef] [Green Version]
  33. Koyanaka, S.; Kobayashi, K. Incorporation of neural network analysis into a technique for automatically sorting lightweight metal scrap generated by ELV shredder facilities. Resour. Conserv. Recycl. 2011, 55, 515–523. [Google Scholar] [CrossRef]
  34. Koyanaka, S.; Kobayashi, K.; Yamamoto, Y.; Kimura, M.; Rokucho, K. Elemental analysis of lightweight metal scraps recovered by an automatic sorting technique combining a weight meter and a laser 3D shape-detection system. Resour. Conserv. Recycl. 2013, 75, 63–69. [Google Scholar] [CrossRef]
  35. Cuce, E.; Cuce, P.M.; Guclu, T.; Besir, A.; Gokce, E.; Serencam, U. A novel method based on thermal conductivity for material identification in scrap industry: An experimental validation. Measurement 2018, 127, 379–389. [Google Scholar] [CrossRef]
  36. Hu, J.; Zhao, X. A practical material decomposition method for x-ray dual spectral computed tomography. J. X-ray Sci. Technol. 2016, 24, 407–425. [Google Scholar] [CrossRef] [PubMed]
  37. Liu, B.; Han, Y.; Pan, J.; Chen, P. Multi-energy image sequence fusion based on variable energy X-ray imaging. J. X-ray Sci. Technol. 2014, 22, 241–251. [Google Scholar] [CrossRef]
  38. Chen, M.C. Experimental study on characteristics in linear array detectors. Nondestruct. Test. 2014, 36, 42–43. [Google Scholar]
  39. Xiong, T.; Ye, W. A PC-based control method for high-speed sorting line integrating data reading, image processing, sequence logic control, communication and HMI. AIP Adv. 2021, 11, 015123. [Google Scholar] [CrossRef]
  40. Bonnin, A.; Duvauchelle, P.; Kaftandjian, V.; Ponard, P. Concept of effective atomic number and effective mass density in dual-energy X-ray computed tomography. Nucl. Instrum. Methods Phys. Res. B 2014, 22, 223–231. [Google Scholar] [CrossRef]
Figure 1. X-ray transmission fan-shaped effect.
Applsci 11 04349 g001
Figure 2. Diagrammatic sketch of DE-XRT sorting system.
Applsci 11 04349 g002
Figure 3. (a) Calibration samples. (b) Self-made samples. (c) Waste samples.
Applsci 11 04349 g003
Figure 4. Diagrammatic sketch of identification by SL-R of DE-XRT.
Applsci 11 04349 g004
Figure 5. Flow-process diagram of non-ferrous metal identification by DE-XRT.
Applsci 11 04349 g005
Figure 6. Schematic diagram of falling point control by separation of variable gas-ejection.
Applsci 11 04349 g006
Figure 7. (a) Raw low-energy image; (b) raw high-energy image; (c) low-energy image with filtering; (d) high-energy image with filtering.
Applsci 11 04349 g007
Figure 8. (a) Shading of low-energy image; (b) shading of high-energy image.
Applsci 11 04349 g008
Figure 9. DE-XRT SL-R calibration curve of one channel.
Applsci 11 04349 g009
Figure 10. Binary image of effective points.
Applsci 11 04349 g010
Figure 11. SL-x-R R_value calibration surface of light metals Al and Mg.
Applsci 11 04349 g011
Figure 12. SL-x-R R_value calibration surface of heavy metals Cu, brass and SS.
Applsci 11 04349 g012
Figure 13. SL-x-t thickness calibration surface of Al and Mg.
Applsci 11 04349 g013
Figure 14. (a) Calculation mark of center of gravity and center of form; (b) Measuring the center-of-gravity with rope Scheme 9. Center-of-gravity calculation and measurement.
Applsci 11 04349 g014
Table 1. Influence of XRT parameters on measurement.
Shading of Low-EnergyExposureMass ThicknessSNRContrastT/T0Impact on R_ValueSorting-Ability
Too smallOverexposureSmallSmallSmallLargeLargePoor
Too largeUnderexposureLargeLargeLargeSmallLargePoor
Table 2. Experimental parameters.
Parameter (Unit)ValueParameter (Unit)Value
x-accuracy Px (mm/pixel)1.6Tube voltage (kV)200
y-accuracy Py (mm/pixel)1.2Tube current (mA)2
Line speed v (m/s)1Hf2d (mm)390
Image resolution (pixel)320 × 320
Table 3. R_value calibration surface coefficients.
Materialβ1β2β3β4β5β6RMSE
Mg1.3900.3862.375 × 10−51.500 × 10⁻⁴−0.5233.970 × 10−70.018
Al1.5610.1032.601 × 10−4−6.220 × 10⁻⁴−0.3526.937 × 10−70.020
SS0.9373.6641.332 × 10−43.177 × 10⁻⁵−3.092−1.950 × 10−70.027
Brass1.4132.5722.108 × 10−44.249 × 10⁻⁴−2.445−1.290 × 10−60.023
Cu1.3103.488−1.636 × 10⁻⁵−1.680 × 10⁻⁴−3.2161.238 × 10−60.026
Table 4. Identification data of sample 1#.
Total PointsEffective PointsdRM|AldRM|MgRMSLMIdentifi. Class
761829340.0390.1211.6300.283Al
Table 5. Identification results of different self-made materials.
Sample No.1#2#3#4#5#6#Grade (%)
Img. quantity22203122110
Actual classAlAlAlMgCuBrass
Identif. Mg11180072.7
Identif. Al2119240091.3
Identif. Cu000018290
Identif. Brass00003770
Identif. SS000001
Recovery (%)91.166.785.770
Table 6. Identification results of different waste materials.
Sample No.7#8#9#10#11#12#
Img. quantity111111
Identif. classAlAlAlBrassAlAl
Table 7. Thickness calibration surface coefficients.
Materialβ1β2β3β4β5β6RMSE
Mg0.808−9.3530.2300.01162.3771.057 × 10−40.731
Al0.441−2.4430.0158.812 × 10−336.290−5.329 × 10−50.279
Table 8. Mass calculation.
Sample No.Mass of Calculation (g)Mass of Measurement (g)Error (%)
1#171.12163.814.46
2#152.54145.684.71
5#NA52.57NA
6#NA48.74NA
Table 9. Center-of-gravity calculation and measurement.
Sample No.Calculated Distance of AG (mm)Actual Distance of AG (mm)Error of AG (%)Calculated Distance of BG (mm)Actual Distance of BG (mm)Error of BG (%)
1#88.9863.494.3913.6
Publisher’s Note: MDPI stays neutral with regard to jurisdictional claims in published maps and institutional affiliations.

