
Insight into the Structure of TMA-Hectorite: A Theoretical Approach


Institute of Inorganic Chemistry, Slovak Academy of Sciences, Dúbravská cesta 9, SK-845 36 Bratislava, Slovakia
Minerals 2021, 11(5), 505; https://doi.org/10.3390/min11050505
Submission received: 5 April 2021
/
Revised: 6 May 2021
/
Accepted: 7 May 2021
/
Published: 11 May 2021
(This article belongs to the Special Issue Recent Advances in Molecular Modeling of Clay Minerals Interfaces)
Abstract
:An ab initio density functional theory method (DFT) with D3 dispersion corrections (DFT-D3) was employed to study the 64 possible models of the structure of hectorite intercalated with tetramethylammonium (TMA) cations with the aim to find the additional information about the structure for the energetically most suitable mutual arrangement of the TMA cations. The complex analysis of total energies showed small differences among the structural models with the lowest (L model) and the highest (H model) total energy (~50 kJ/mol). The analysis of the calculated vibrational spectrum of the L model of the TMA-H structure was conducted in detail.
1. Introduction
Natural or synthetic smectites, like hectorites, are important, widely abundant and low-cost materials with unique physicochemical properties, such as swelling, intercalation and ion-exchange properties. Synthetic hectorites are especially applicable, e.g., in catalytic processes [1] or matrices in polymer nanocomposites, because of their controlled pore size distribution and composition in comparison to natural minerals [2]. The characteristics mentioned above also predetermine the hectorites for application in medicine and pharmacology, e.g., for drug delivery purposes [3,4] or as a potential sorbent of waste compounds [5]. In spite of the wide use of the smectites (also hectorites) in the industry, the structural characterization of clays and afterwards organoclays is very difficult because of a poor crystallinity of these materials. The information obtained from the powder X-ray measurements are very often insufficient. The positions of hydrogen atoms are missing, hence the information about hydrogen bonds of the intercalated molecules is lacking, except for quite rare experiments based on neutron powder diffraction [6,7,8]. To investigate the clay surface and to characterize the interactions between organic compounds and clay minerals, some experimental methods, such as Fourier transform infrared spectroscopy (FTIR) [9], Ultraviolet-visible (UV-vis) spectroscopy [10], contact angle measurement [11], atomic force microscopy [12], NMR [13] and He-ion imaging experiments [14] have been employed.
The computational methods help to eliminate the deficiency of suitable information about organoclays structures, to complete the experimental data and to find more and more applications in the fields of organoclays [15,16,17,18,19,20,21,22,23,24,25] and mineralogy [26,27,28,29,30]. In addition to the refined atomic positions, e.g., hydrogen atoms, which enable the study of hydrogen bonds, it is also possible to analyze the vibrational modes of the individual functional groups in these structures and to help with analyzing the overlapped vibrational bands in the experimentally measured spectrum [31,32,33,34]. When using computational methods, the proposing of a suitable representative model of the organoclay structure is an important factor. In addition to the charge of the intercalated organic cations in the interlayer space, the substitutions in the clay structure also have to be taken into consideration during the construction of the model [35]. The determination of the atomic positions of the intercalated molecules/cations might be problematic as well [36], because the further experimental refinement of the atomic positions of the intercalated species is not possible. This is also the case for the structural refinement of the TMA hectorite (TMA-H) intercalate [37,38], where the authors used the results obtained for TMA vermiculite intercalate [39] and results from the theoretical modeling of TMA vermiculite [40] for the refinement of the TMA-H structure. The final refinement of the structure of TMA-H was, however, unstable and the structure solution in P1 symmetry was unsuccessful. Even if the host lattice was 3D ordered and showed no rotational and/or translational stacking faults, structure refinement of the interlayer species in that TMA-H remained difficult [38].
The present work is a systematical study of this TMA-H structure with the aim to find additional information about the structure by means of the density functional theory (DFT) method in solid state.
2. Computational Details and Models
2.1. Computational Details
DFT calculations were performed using the Vienna Ab initio Simulation Package (VASP) program [41,42]. The exchange-correlation energy was expressed in the framework of the generalized gradient approximation (GGA) using the DFT functional proposed by Perdew, Burke and Ernzerhof (PBE) [43]. The Kohn–Sham equations were solved using a variational method in a plane-wave (PW) basis set with an energy cut-off of 500 eV. The electron–ion interactions were described using the projector-augmented-wave (PAW) method [44,45]. Brillouin-zone sampling was restricted to the gamma point. The atomic positions were relaxed in the restricted experimentally obtained unit cell parameters. The relaxation criteria were 10−5 eV/atom for the total energy change and 0.005 eV/Å for the maximum force acting on any atom.
Normal modes of vibrations were calculated within the fixed optimized cell using a finite difference method and harmonic approximation. The Hessian was constructed from single point energy calculations on the 6N structures generated from the optimized structures by displacing each of the Nth atoms in the cell in a positive and negative direction along the three Cartesian directions x, y, and z [46]. DFT calculations were performed involving dispersion corrections using a D3 scheme, as recommended for the PBE functional [47].
2.2. Computational Models
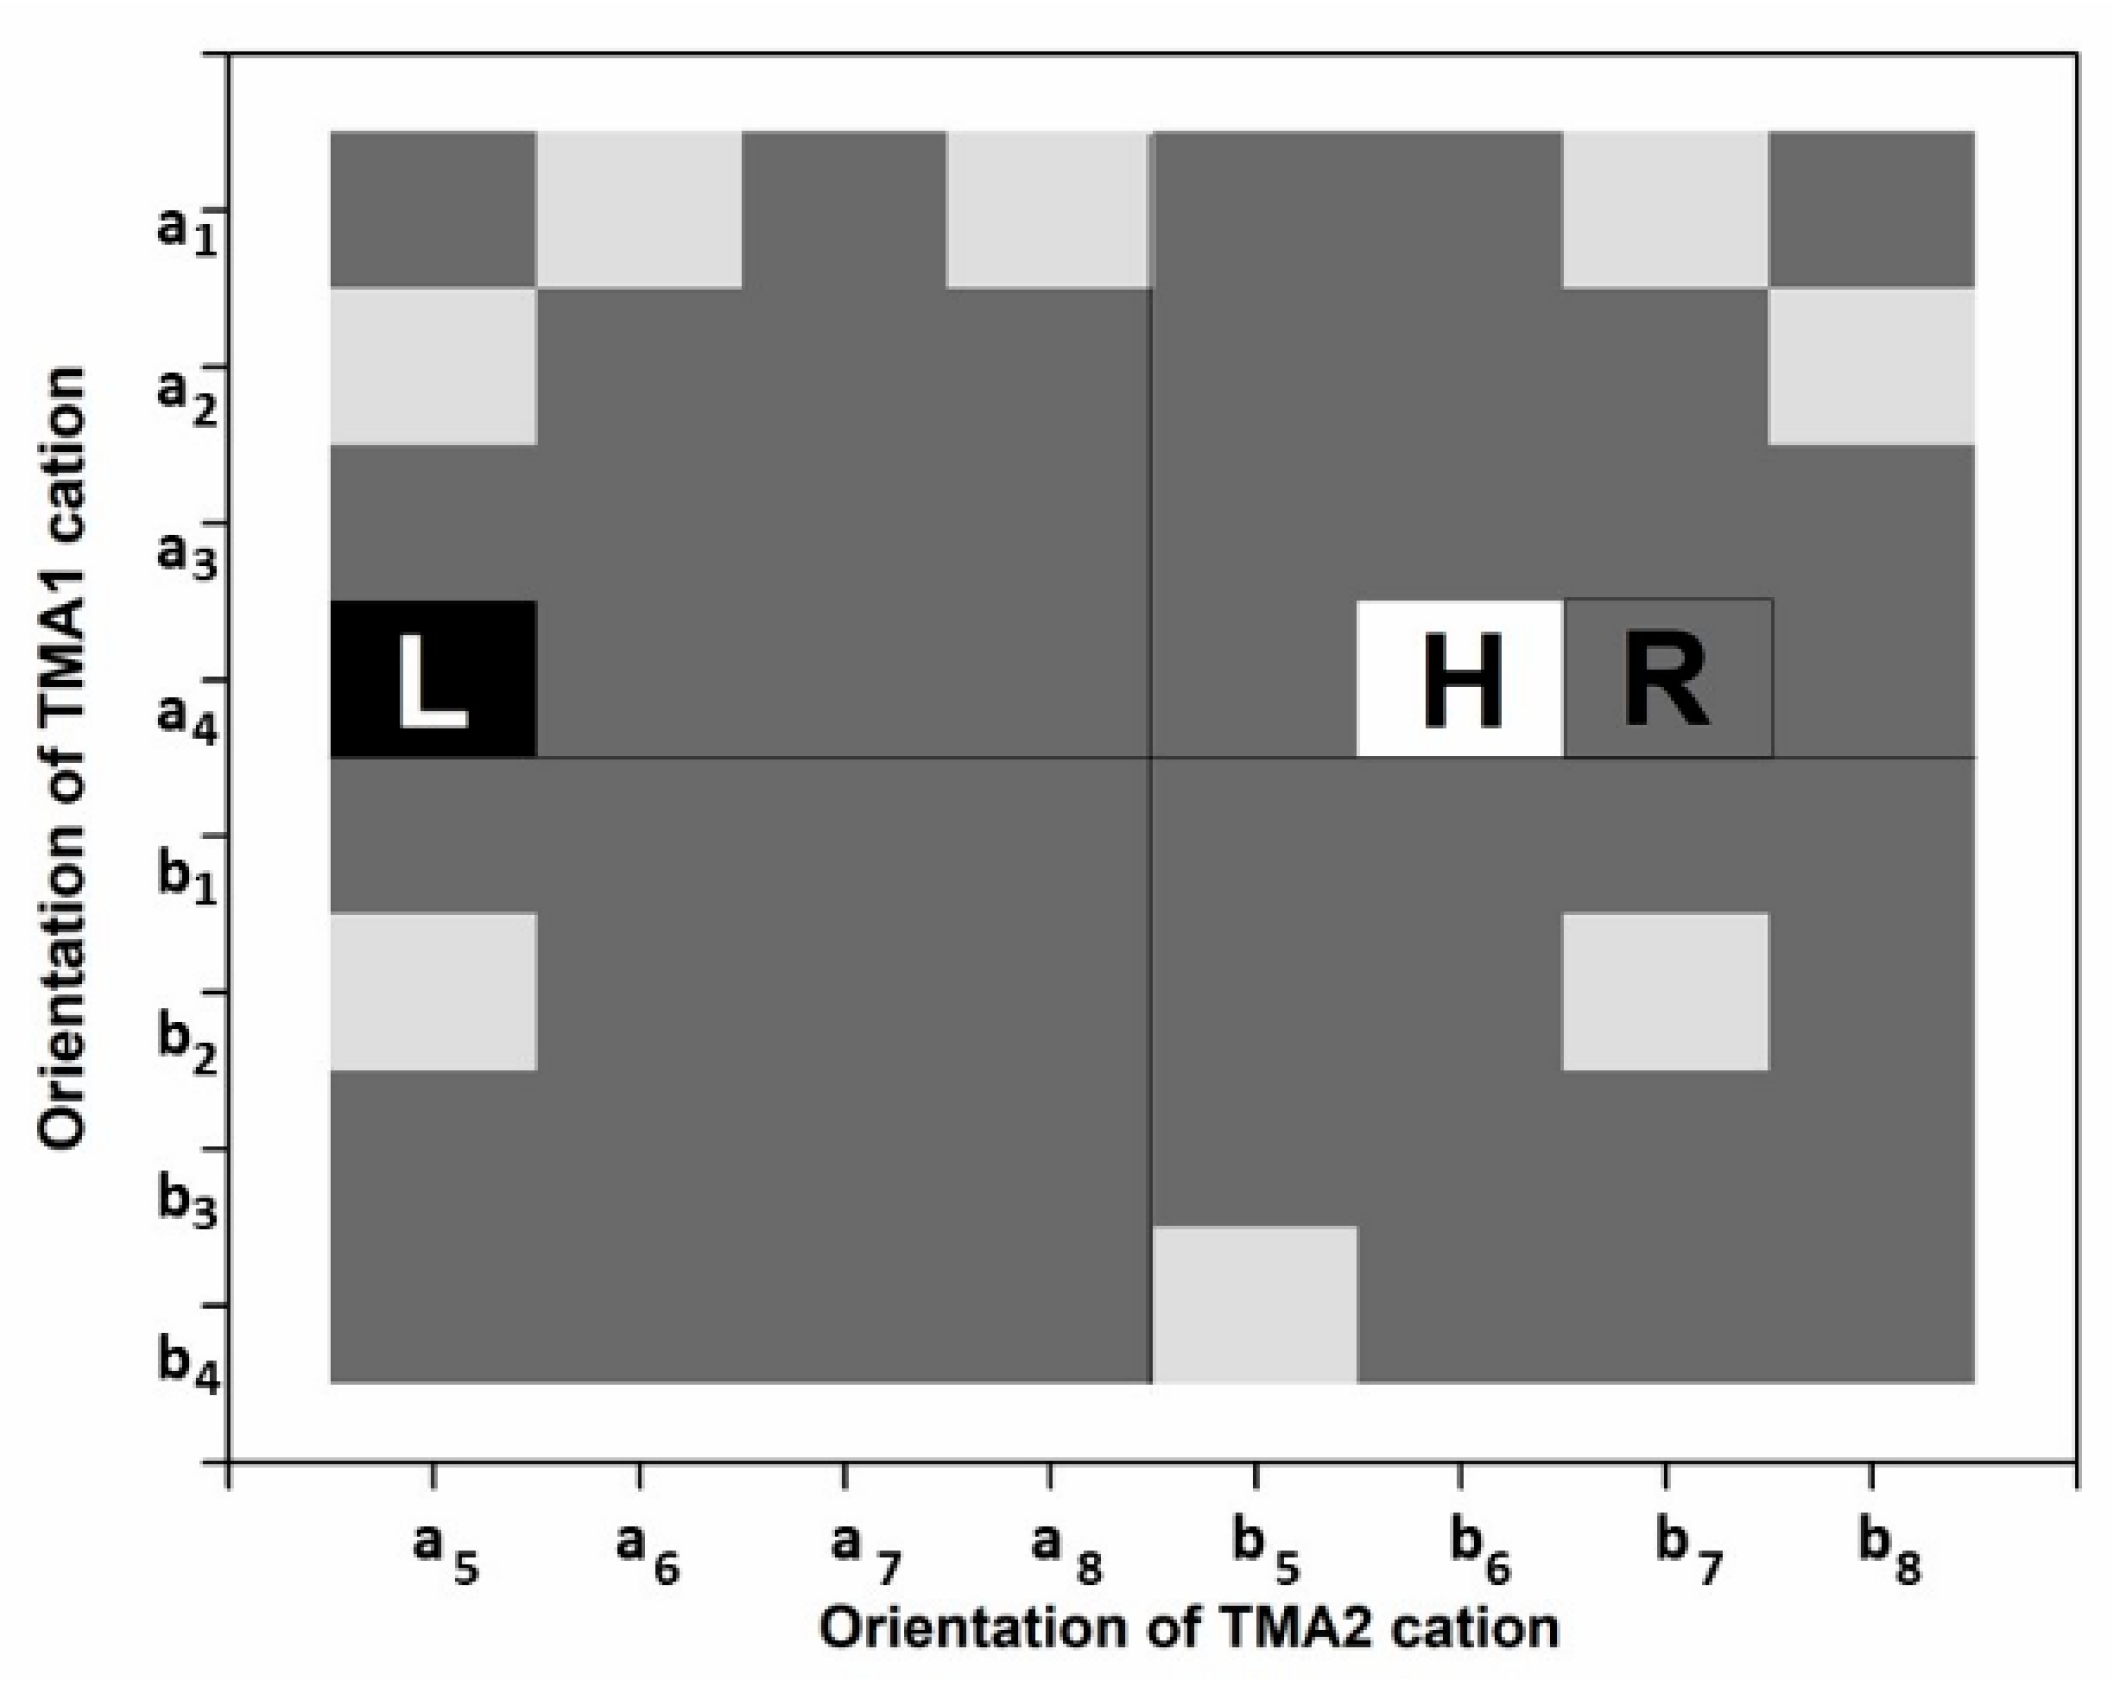
Computational models were based on the structural data suggesting two possible orientations of TMA cations with similarly low occupancies (0.09 and 0.08) [38]. It is evident that with such a low value, it is not possible to keep a reasonable size of the computational cell and mimic the refined occupancies at the same time. The proposed models are thus based on the assumption that in a computational (a, b, c) cell there are, along with the 2:1 layer, two TMA cations, whose central nitrogen atoms could only appear in any of the positions constrained in the original space group (C2/m) to the 8j Wyckoff position, WP (Table 1). In the P1 space group, they are, however, free to translate and rotate, though all of that movement is restricted by the potential field generated by the surrounding atoms. In order to sample the space of mutual orientations, a simple believably sufficient strategy was suggested. The strategy of positioning of the cations labeled here as A and B could best be explained the by using an 8 × 8 table made of four 4 × 4 quadrants. The design of such a table is provided in Table 2 where the “instructions” on how to generate the individual configurations are available. For instance, if only one type (A or B) of TMA cations is to appear in the upper left quadrant of the 8x8 configurations table, one takes X = Y = A and combines it with the sequential number of the symmetry operation of the general 8j WP. The configurations based on the B cation are in the lower right part of the configurations table, i.e., X = Y = B. Quite naturally, the lower left corner is generated by taking X = B and Y = A, while in the upper right one the order is reversed, i.e., X = A and Y = B. The auxiliary labels for respective A (a1–a8) and B (b1–b8) TMA-cations were added for better clarity, i.e., which X, Y positions were used for A and/or B types of TMA cation in the respective model (Table 1). In such a way, all 64 computational models were formed. In each case, the formula was [C8N2H24]Inter[ Mg4Li2]Oct[Si8]Tet[O20F4] (72 atoms). The computational cell had the lattice parameters a = 5.274 Å, b = 9.117 Å, c = 13.561 Å and β = 97.69°.
Finally, three optimized models were selected for the next considerations: L model with the lowest total energy (Figure 1), H model with the highest energy and R model as the randomly chosen energy, representing the group of configurations with close energies higher than in the L model and lower than in the H model.
3. Results and Discussion
3.1. Structure and Total Energy Analysis
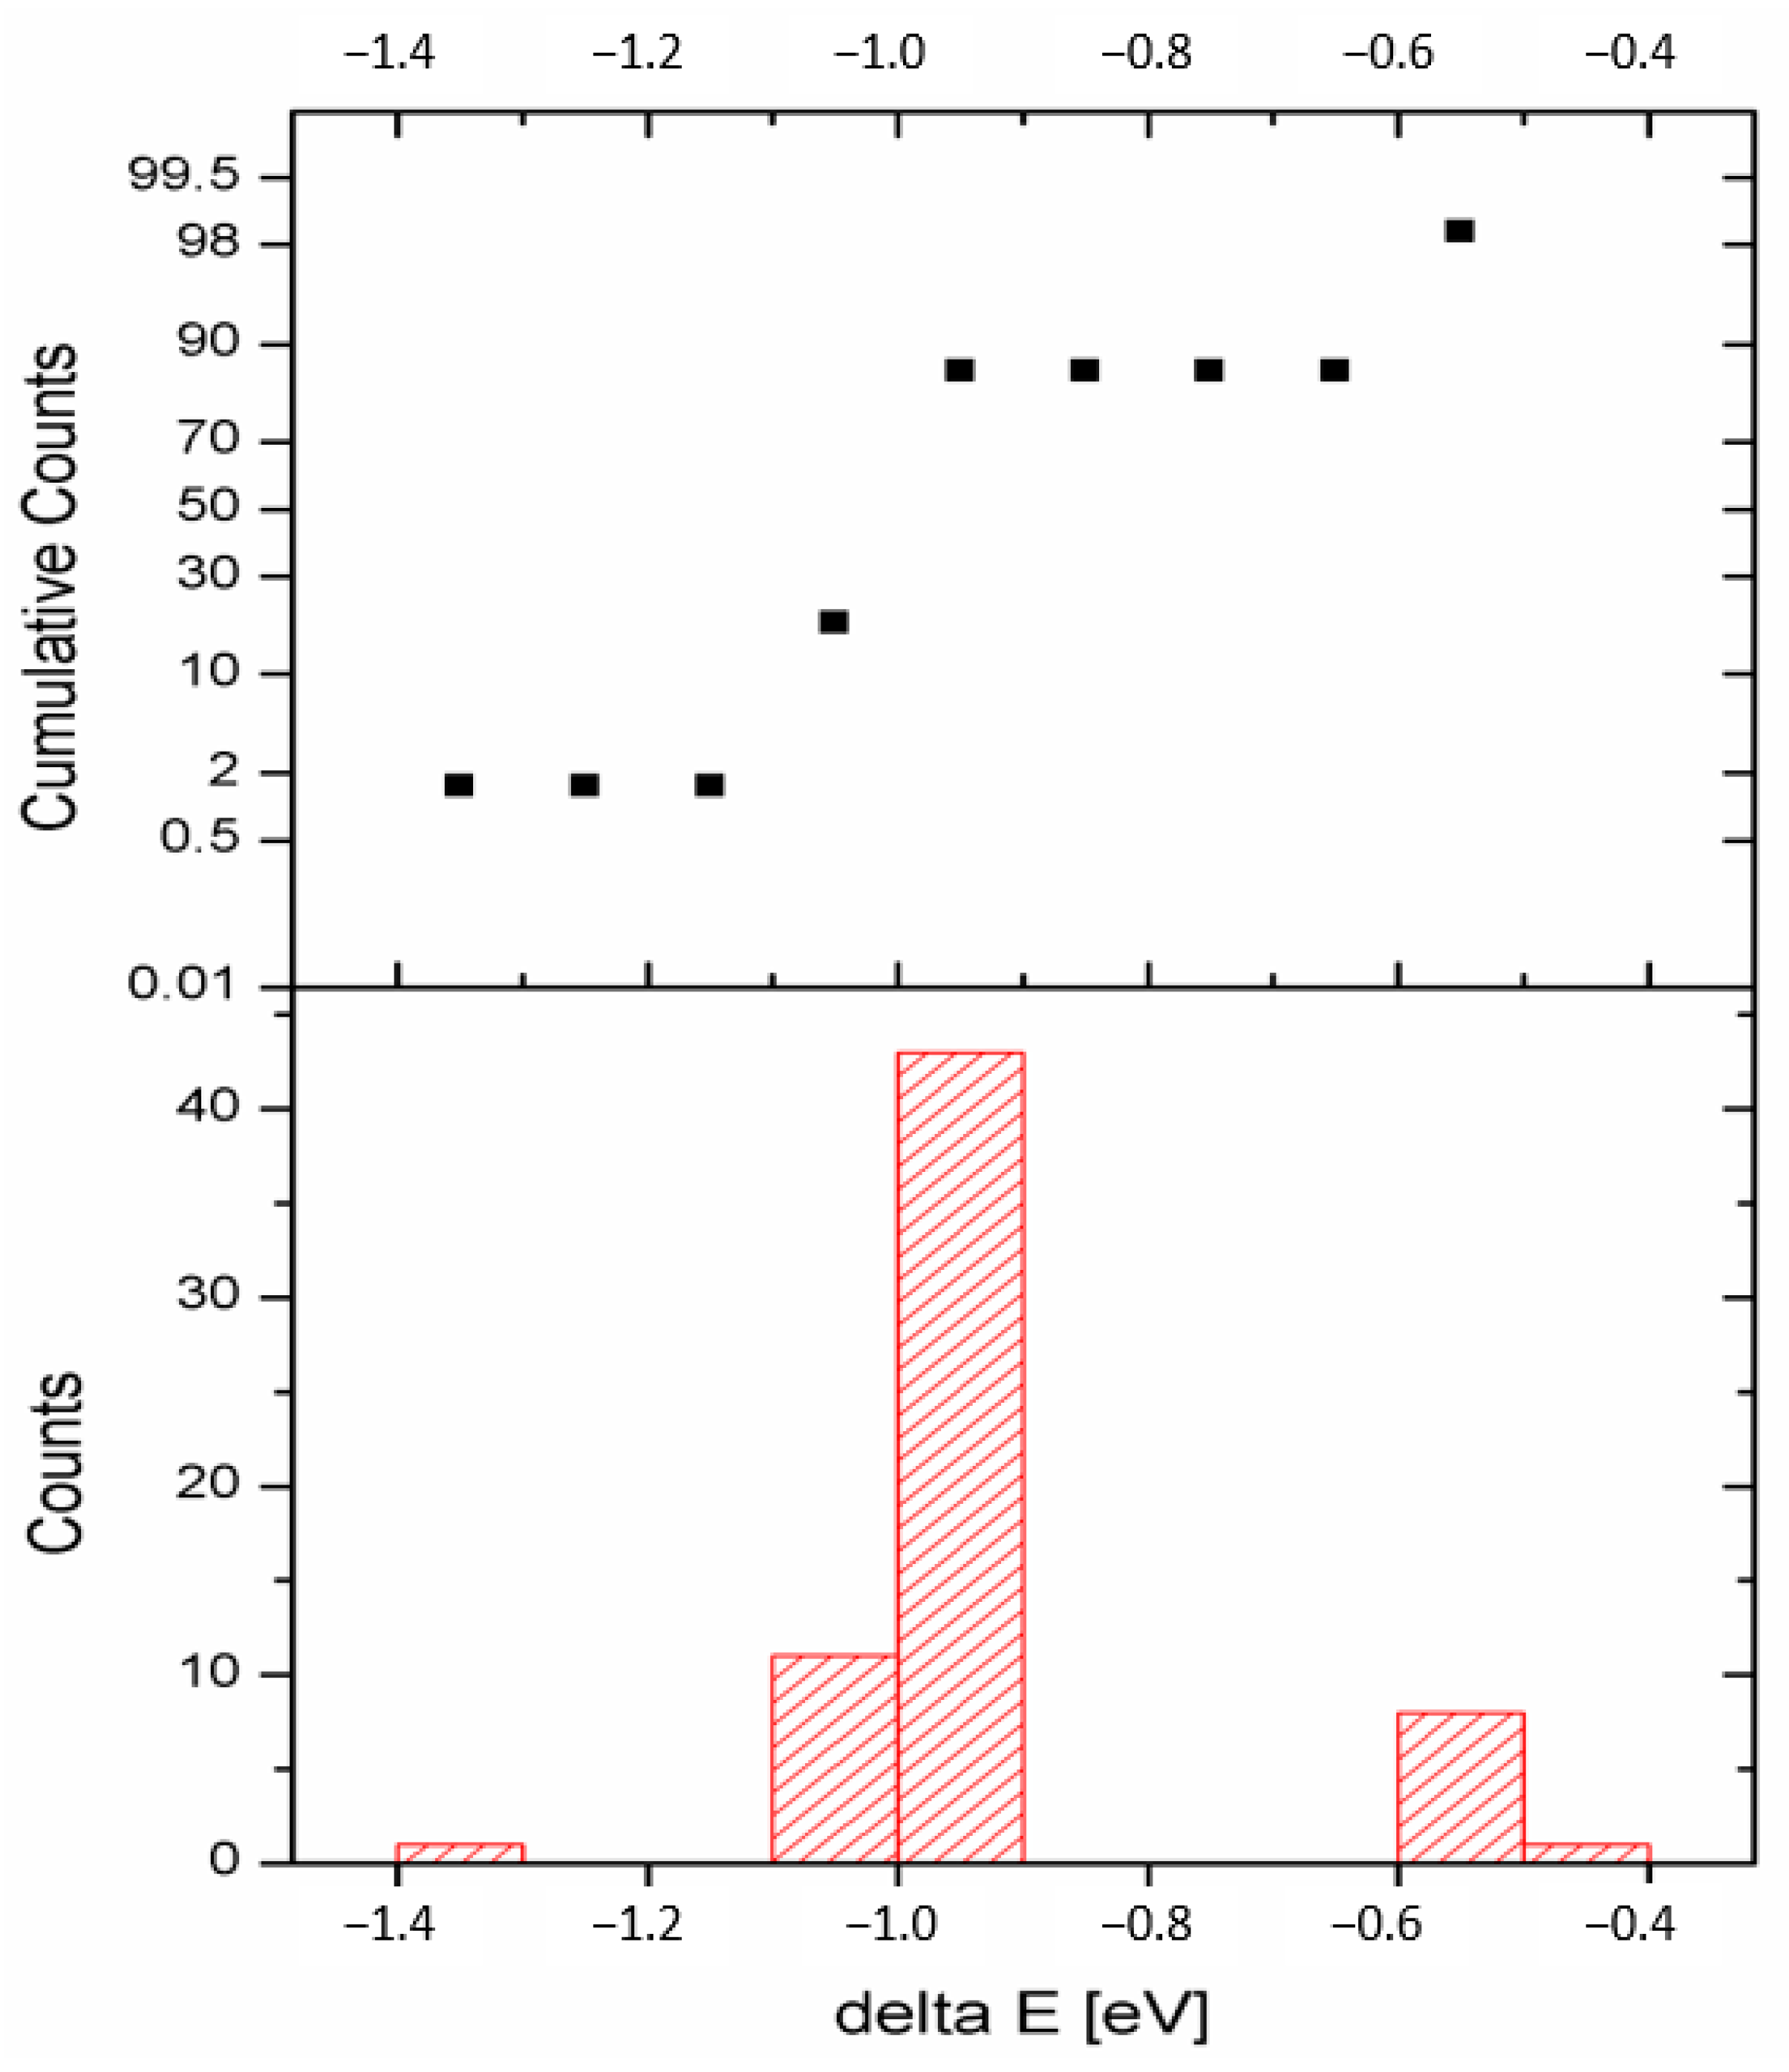
Atomic coordinates in 64 models were fully optimized and graphical distribution of the resulting total energies is presented in Figure 2. There are only very small differences in energy among the majority of the models. The difference between the highest and lowest energy was ~0.5 eV (~50 kJ/mol). Approximately 70% of configurations (43 models) depicted in the histogram (Figure 3, down) fell into the region with very close energies and differentiation between configurations is not easy, if even possible. This fact was also confirmed by cumulative counts’ graph (Figure 3, up) where the percentage of the counts for respective bar (including all bars with smaller values of the response variable) is presented. The respective percentage of cumulative counts for the bar with 43 models was 85% (55 models). Three models were selected for the next considerations as mentioned in the previous paragraph: L model with the lowest total energy, −451.248 eV, WP of N atom of TMA (1) cation is 4X (a4 for A type) and for TMA(2) cation is 5Y (a5 for A type), i.e., 4X5Y in left upper quadrant; H model with the highest energy, −450.715 eV, WPs 4X6Y in right upper quadrant (a4 for A and b6 for B); and R model (−451.235 eV) with randomly chosen energy levels representing the group of configurations with close energies that are higher than in the L model and lower than in the H model, WPs 4X7Y in the right upper quadrant corresponding with a4 for A and b7 for B types of TMA cation (Table 3, Figure 2).
The analysis of the optimized structural parameters showed that the bond distances within the 2:1 layer were very close to experimental data reported by Seidl and Breu (2005) [38] for all selected models. The optimized bond distances for the L model, as an example, compared to experimental data differed in the hundredths of Å (Table 4).
3.2. Hydrogen Bonds
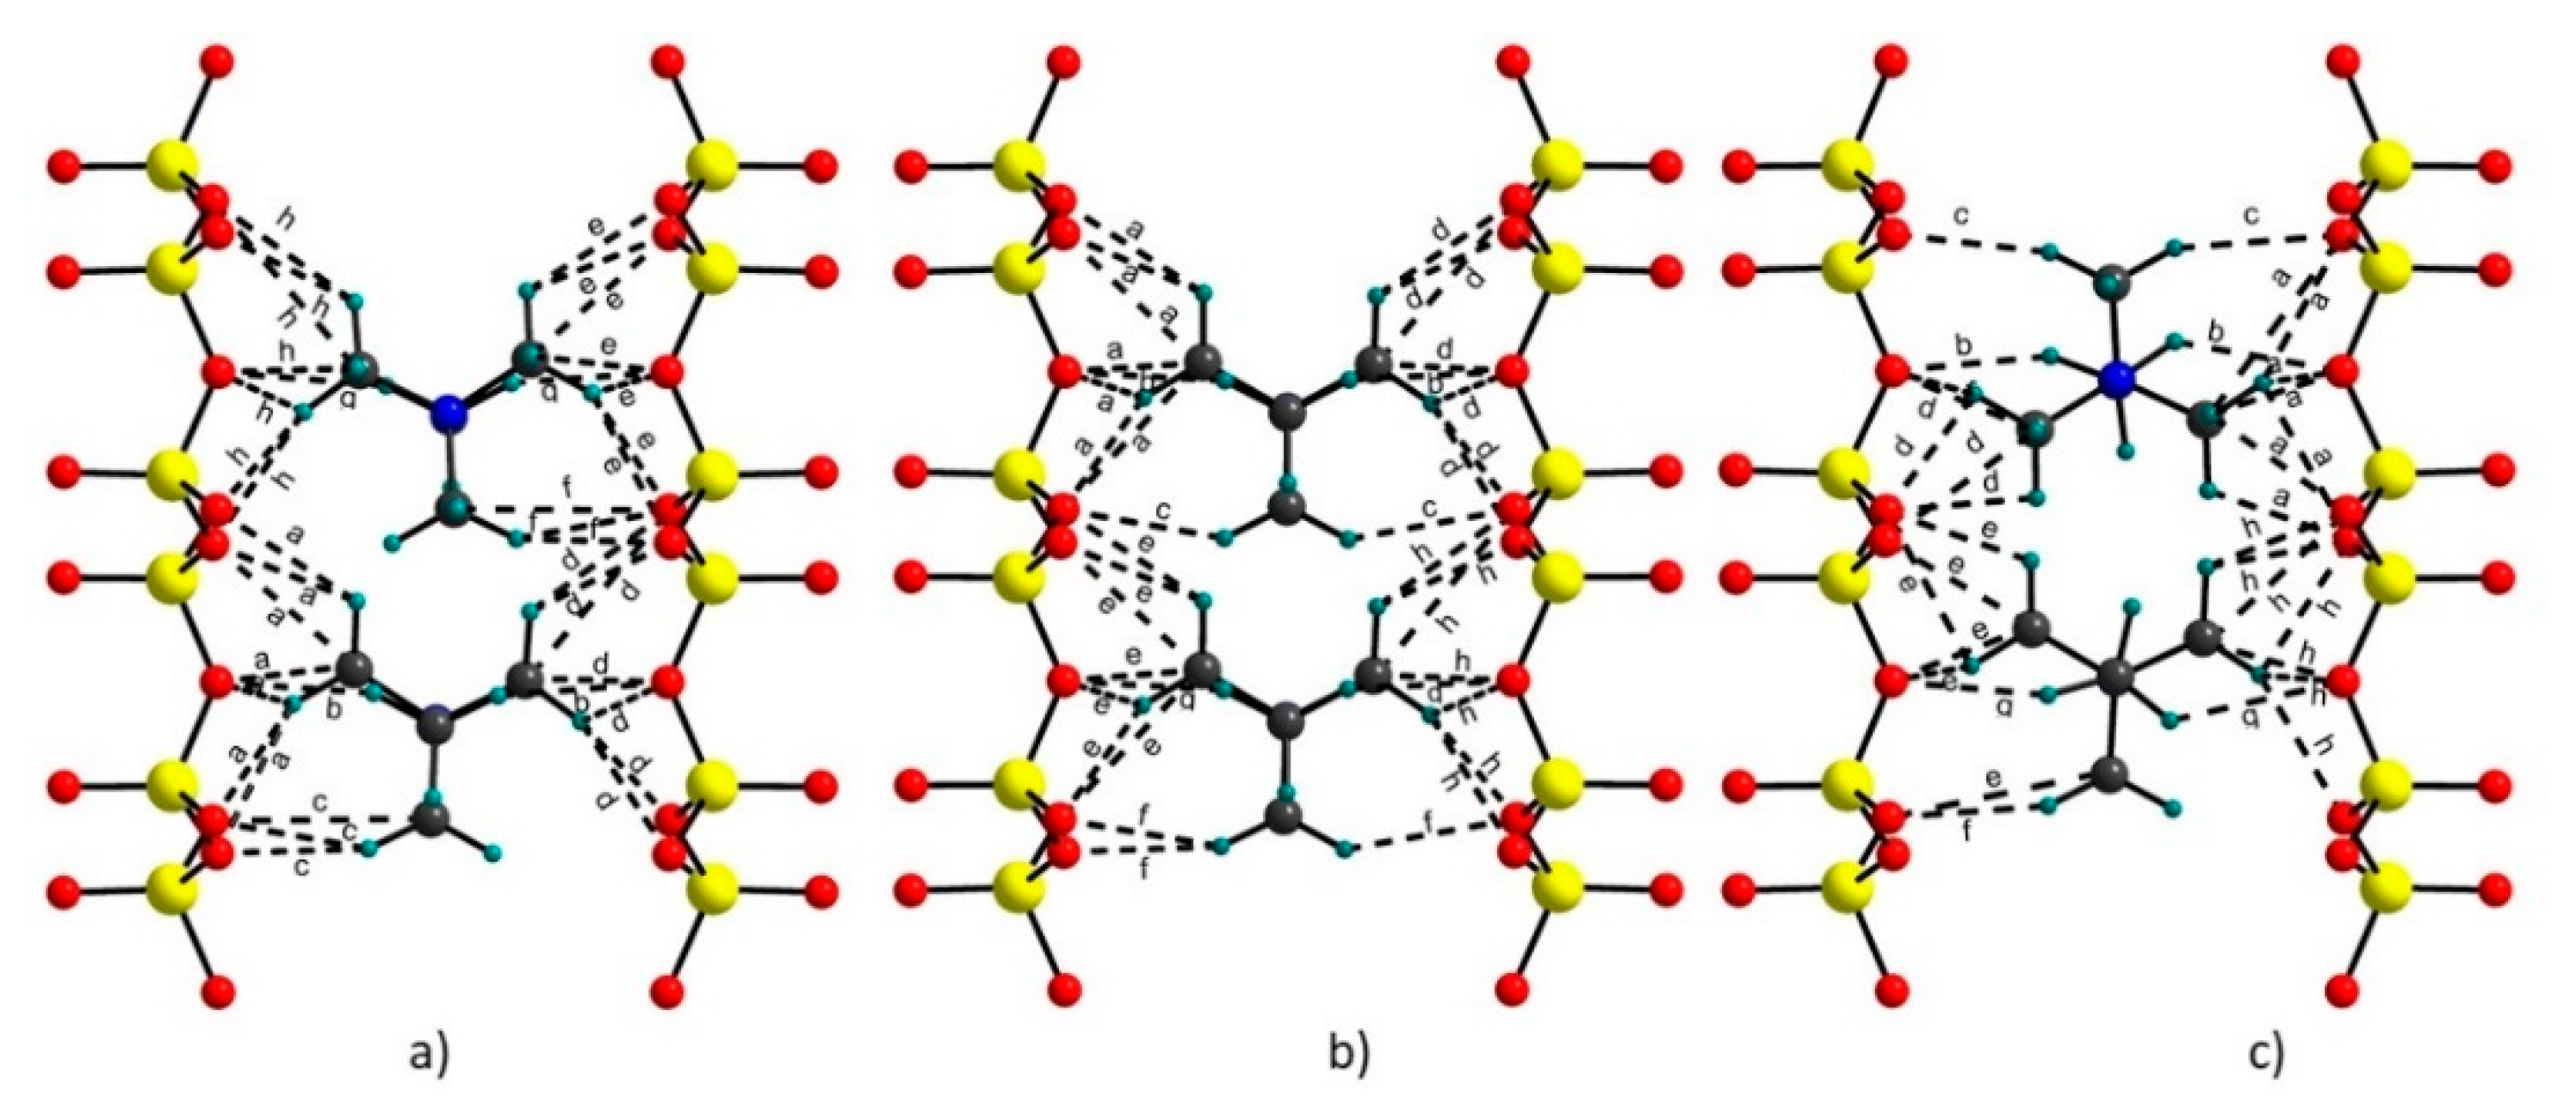
Calculated C···O (Donnor···Acceptor) distances for the TMA cations for selected models and the distances published by Seidl and Breu (2005) [38] are given in Table 5. These C···O contact distances belong to the weak hydrogen bonds [48,49]. A comparison of the hydrogen bonds among the models showed that their character and strength did not differ much, as should be expected. The differences were mainly in the mutual orientation of the both TMA cations, as the numbers and strength of hydrogen bonds slightly decreased with the total energy of the respective models (Figure 4a–c, Table 3 and Table 5). Some hydrogen bonds were two centered. Total energy as a measure of stability of the models correlated well with the values of the C-H···O (Donnor-Hydrogen···Acceptor) angles in the hydrogen bonds. In general, the sharper the angle was, the weaker the hydrogen bond became. The strength of the bonds decreased from the L model towards the energetically less stable H model (Table 3).
3.3. Powder Diffraction Patterns
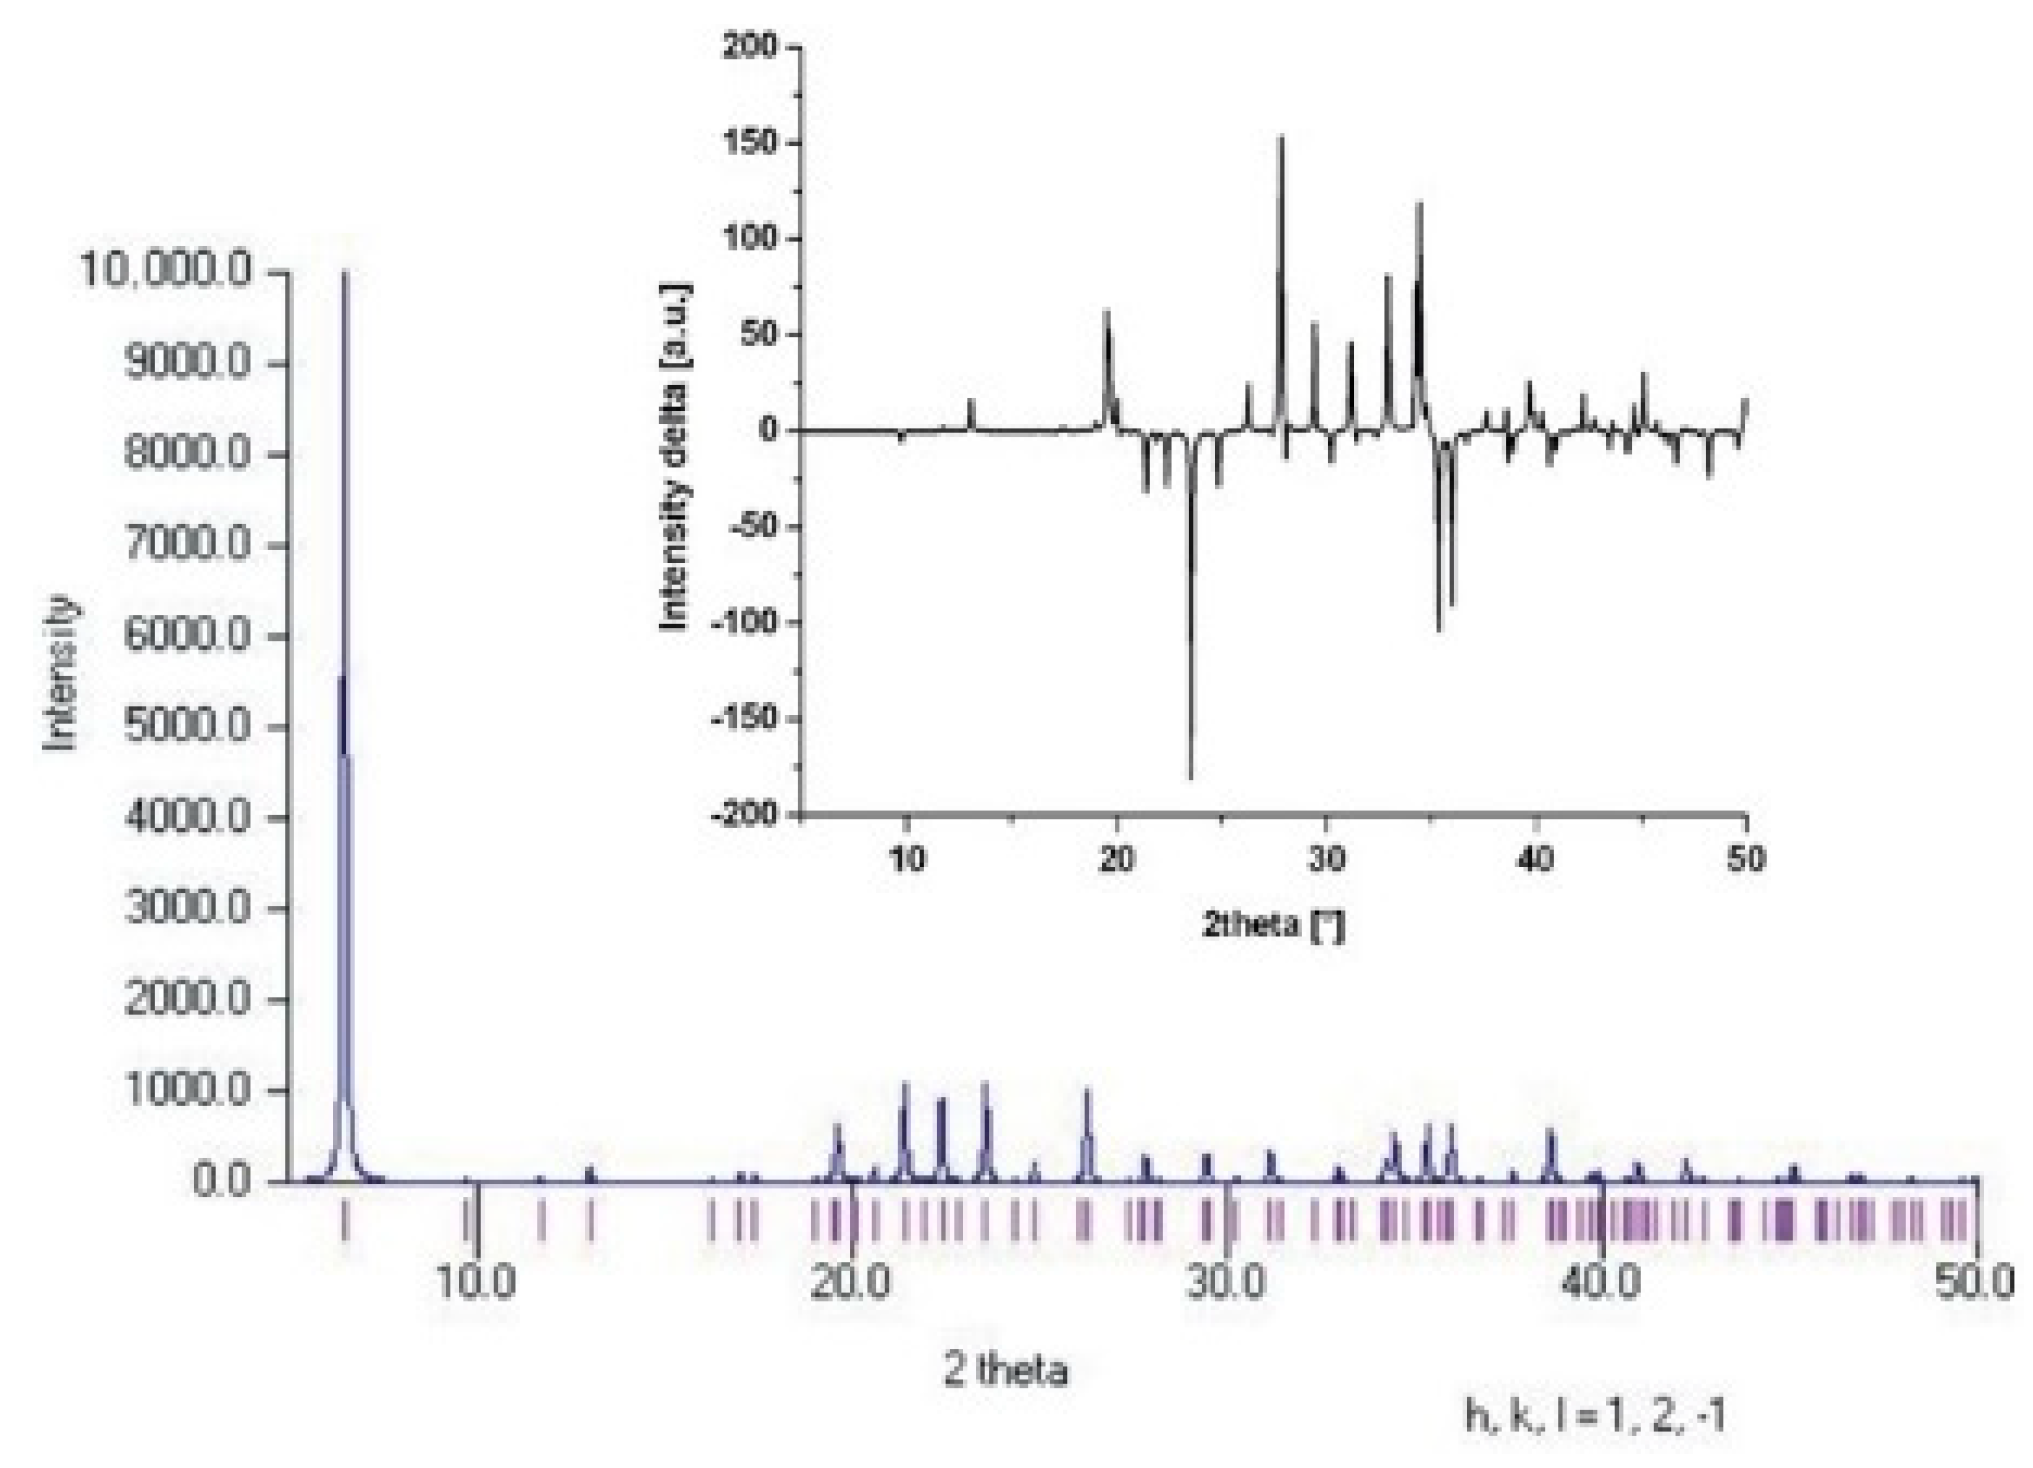
Theoretical powder diffraction patterns were also calculated for the L and H models in order to find possible differences reflecting the changes in the mutual orientations of TMA cations in the models. Again, one should not expect that different mutual positions of TMA cations produce very different energies of the structures. Considering that the majority of the TMA models give very similar energies, the changes in the powder diffraction patterns should be very small as well. This hypothesis was confirmed, as can be seen in Figure 5. Comparison of both calculated powder diffraction patterns for the L and H model structures showed that the differences were almost negligible and the distinguishing of these two structures is impossible.
3.4. TMA Cations Anchoring
To compare the optimized atomic positions of the TMA cations in the L model with experimental data, the optimized atomic positions of relevant atoms were transformed to the initial x, y, z WP atomic position (Table 1) published by Seidl and Breu (2005) [38]. Comparison of the optimized atomic positions with experimental data showed a good agreement. The differences among the experimental and optimized atomic positions of respective atoms were very small for both the hectorite structure (Table 6) and TMA cations (Table 7). The optimized atomic positions of the hydrogen atoms are presented in Table 8 to complete the structural information on the TMA cations in the interlayer space of hectorite.
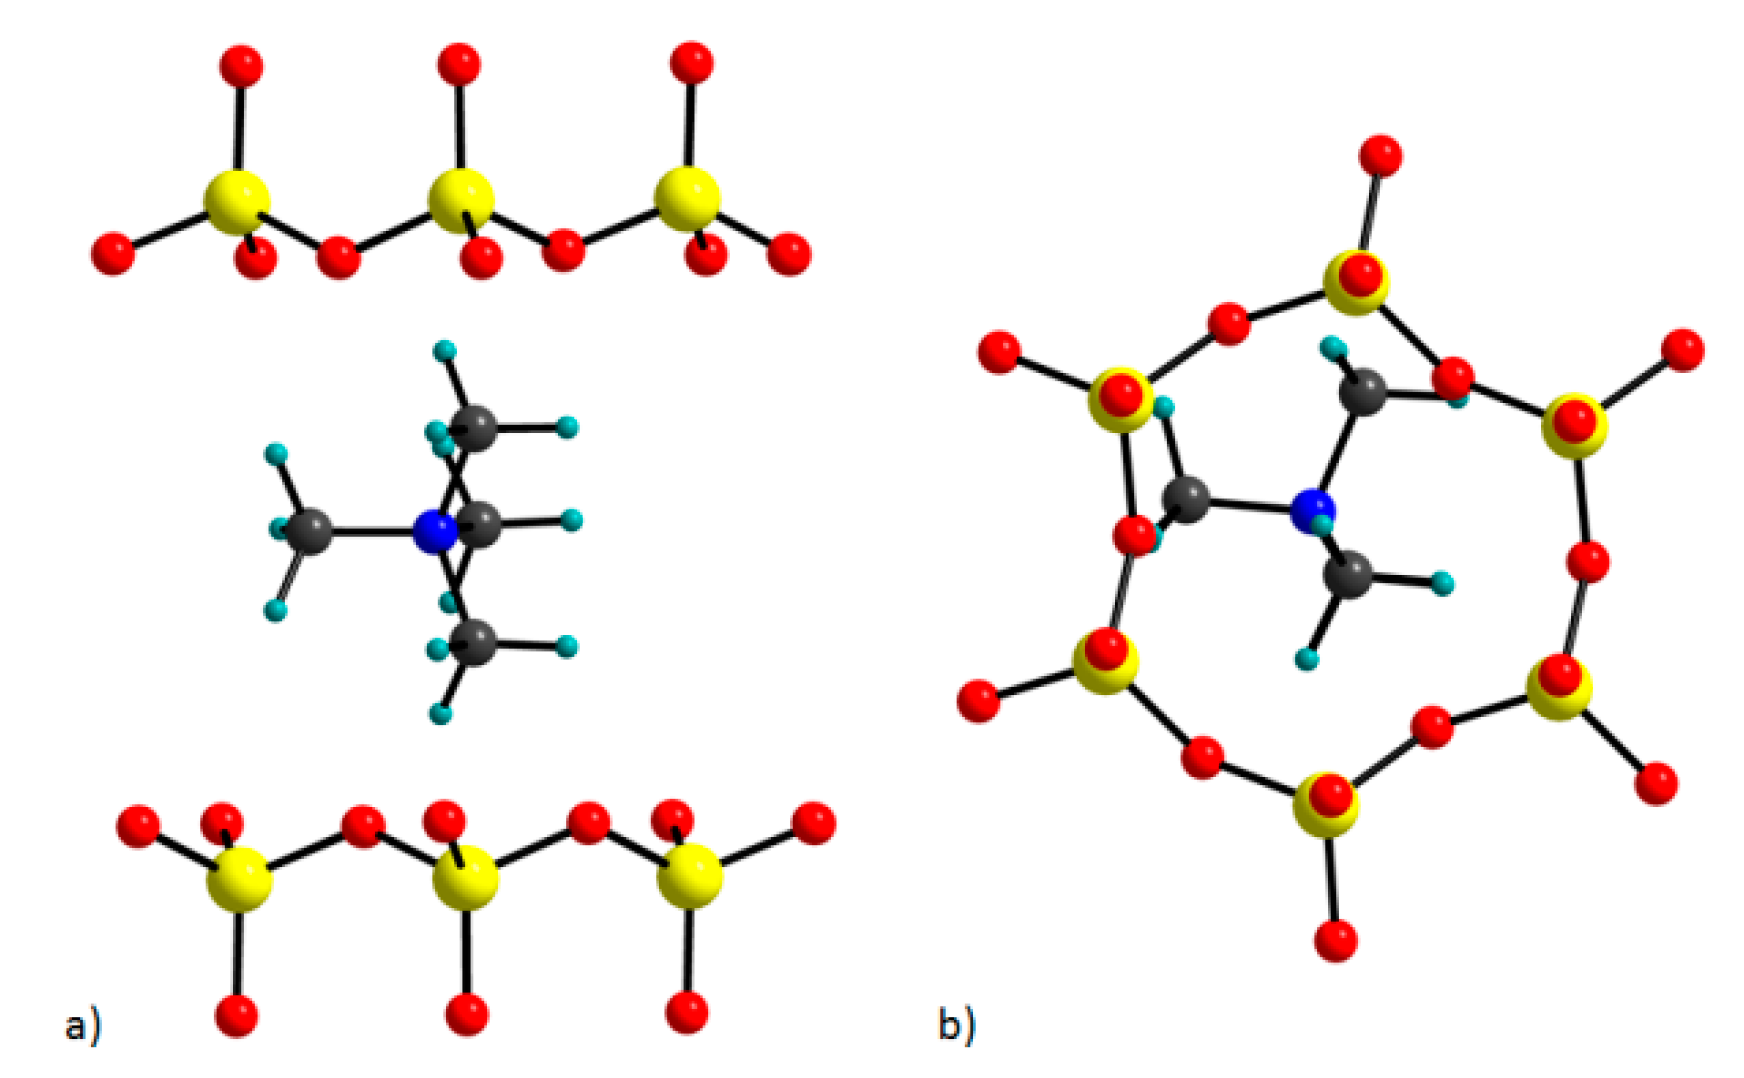
Further, the position of TMA cations in the interlayer space is similar to the one in the refined model in the work of Seidl and Breu (2005) [38]. That means that TMA cations are positioned in the middle of the interlayer space. Two of the methyl groups lie in the ab plane, whereas the remaining two methyl groups point up and down (Figure 6a) and they are centered in the ditrigonal hole (Figure 6b).
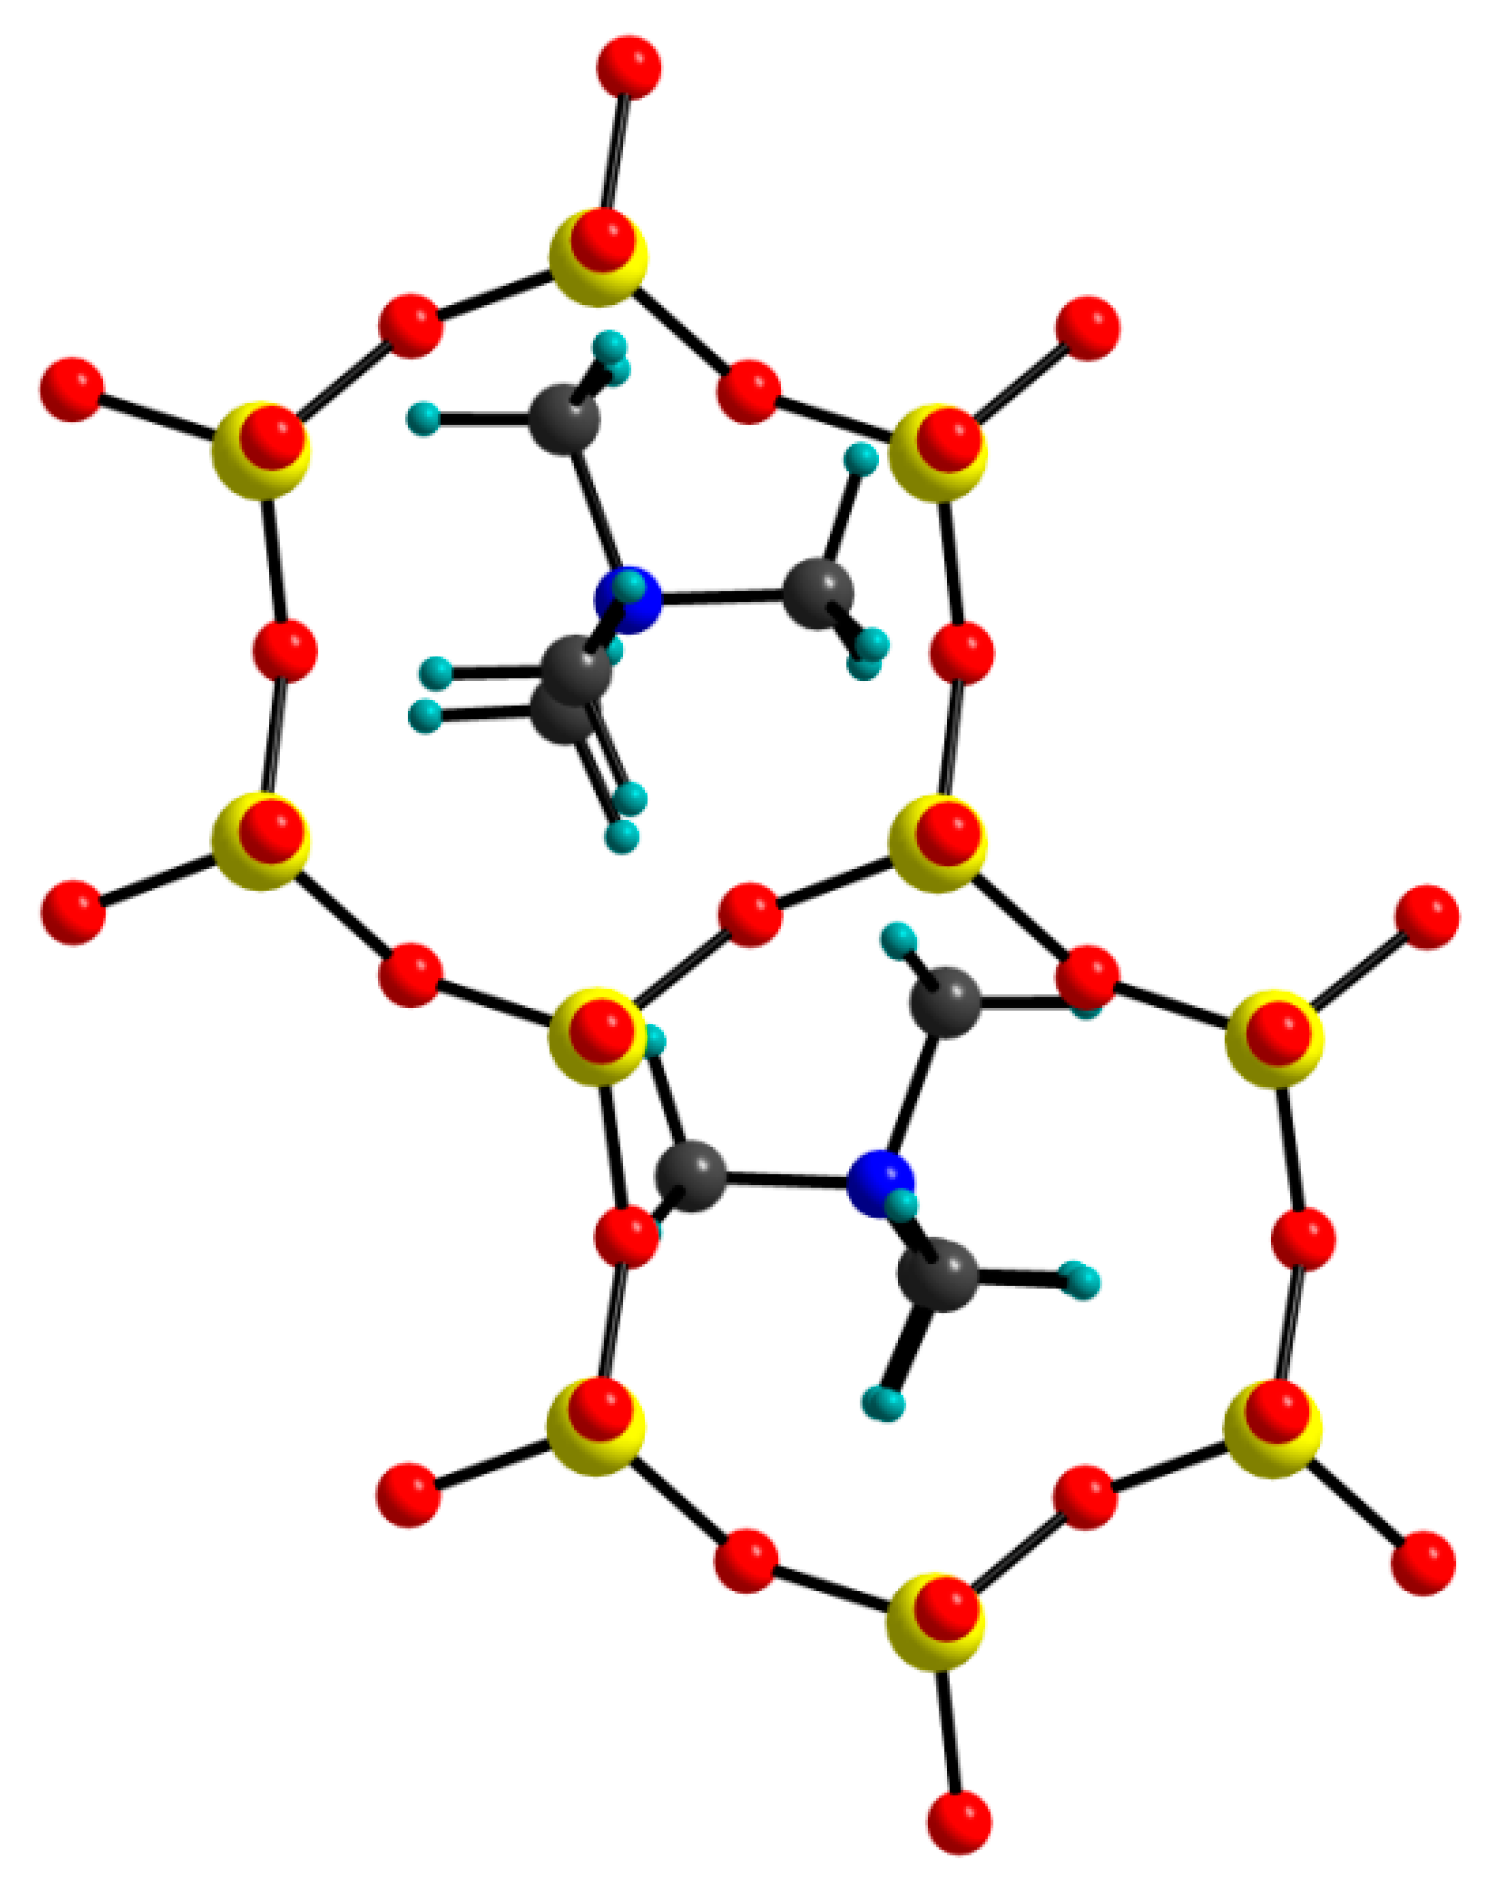
The mutual configuration of the two TMA cations in the optimized TMA-H structure (L model) is presented in Figure 7. Neighboring cations are rotated in order to avoid unrealistically close contacts. N···Obasal distances vary in the range of 3.84–4.71 Å. Both cations are anchored into the silicate tetrahedral sheets on both sides and in this way cross-link the interlayer space through hydrogen bonds discussed in the previous paragraph (Figure 4a).
3.5. Vibrational Spectra
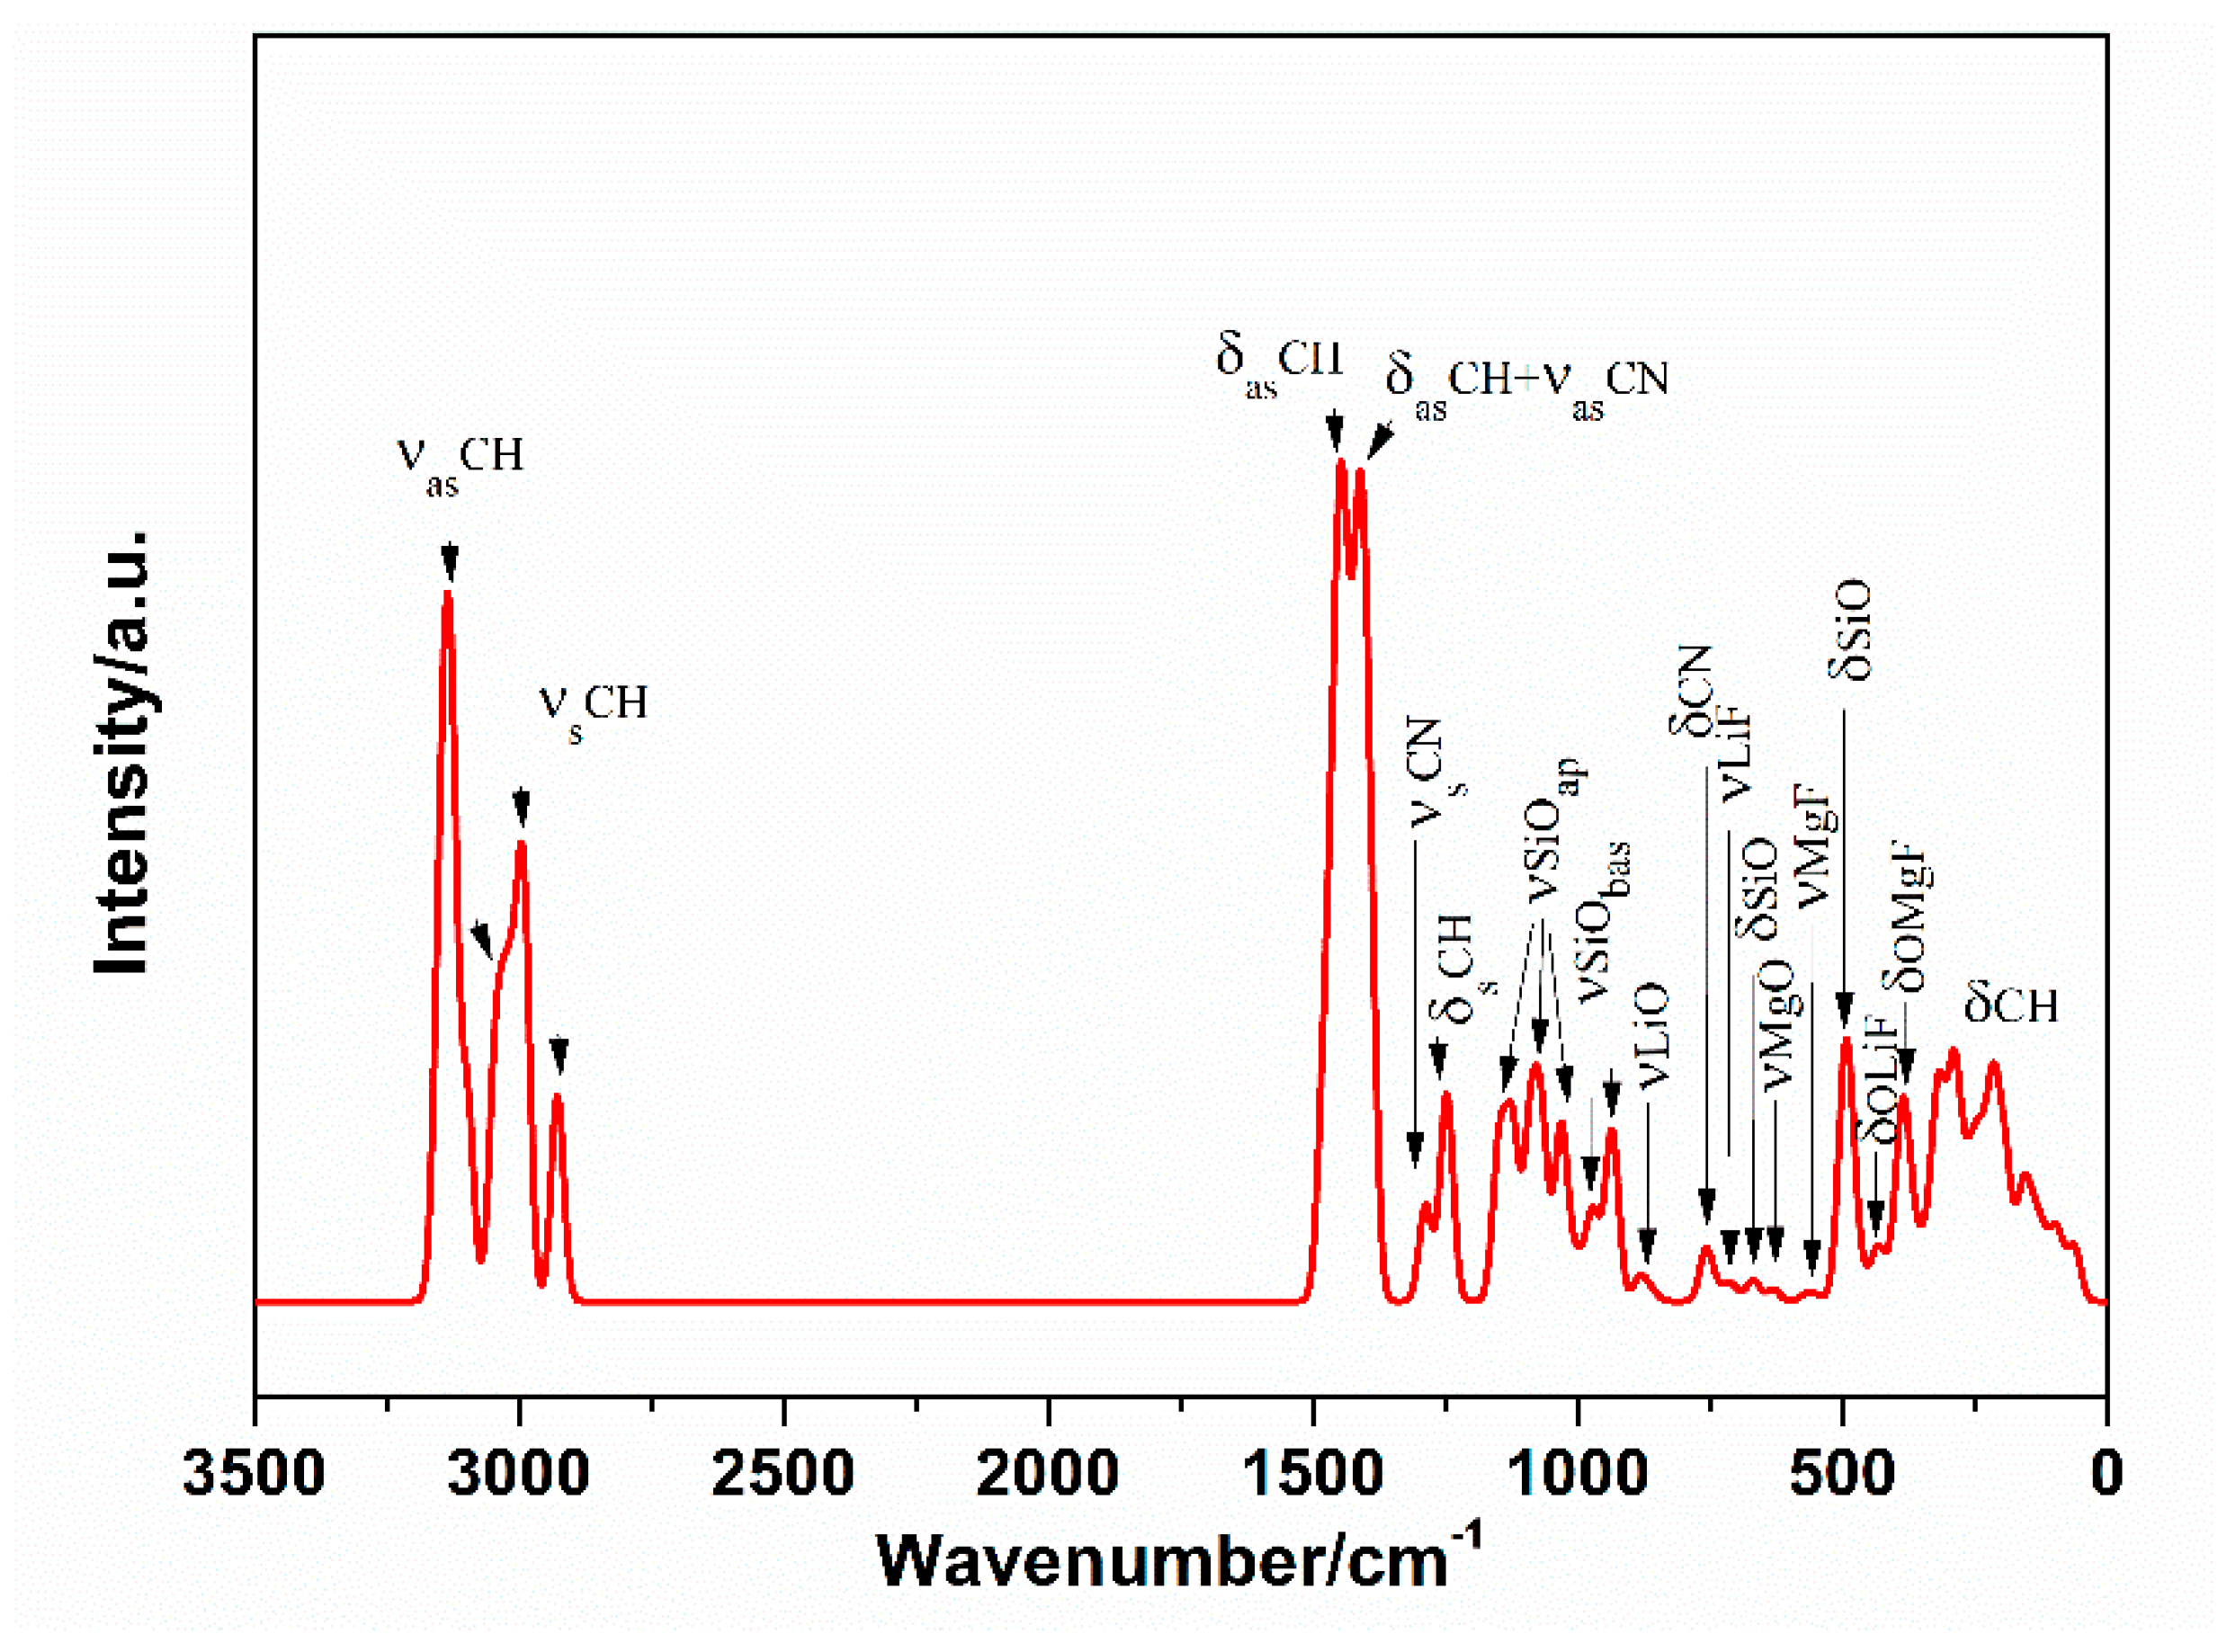
To complete the information about the TMA-H structure, the vibrational spectrum for the L model was calculated (Figure 8). The respective calculated unscaled vibrational bands can be formally divided into two regions: the first is 3250–2750 cm−1 and the second is below 1500 cm−1.
Three main bands are present in the first region and one of them has a shoulder. The detailed analysis of the individual calculated vibrational modes showed that the highest energy band in the calculated spectrum of the L model corresponds with the C-H asymmetric stretching vibrations, with a maximum at 3136 cm−1. The C-H symmetric stretching vibrations are present in the rest of two bands, with the maximum energy at 2995 cm−1 (shoulder at 3034 cm−1) and at 2927 cm−1.
In the second region, the highest energy band is an association of the two bands with a maximum at 1450 cm−1 for C-H asymmetric bending vibration and at 1410 cm−1 for common vibrations of C-N (asymmetric stretching) and C-H (asymmetric bending) groups. The C-N symmetric stretching appears at 1287 cm−1 and C-H symmetric bending at 1240 cm−1. Si-Oapical stretching vibrations (out of plane) are typical at 1104 cm−1 and Si-Obasal (in plane) at 1026 cm−1. A lot of overlapped vibrational modes exist in the range below 1000 cm−1. Behind the stretching of Si-Obasal (972, 939 cm−1), the Si-Obasal bending and skeletal vibrations of the clay (668, 490, 215, 90 cm−1), the small bands at 870 cm−1 represent the Li–O stretching, C-N bending (760 cm−1), Li-F stretching (713 cm−1), Mg-O and Mg-F stretching (625 and 560 cm−1), Li-F bending (436 cm−1), Mg-F and Mg-O bending (397 cm−1) and TMA rocking vibrations (320, 285, 200, 155, 90 and 60 cm−1) that were recognized.
4. Conclusions
An ab initio DFT-D3 method was employed for examination of possible mutual orientations (64 models) of TMA cations in the hectorite interlayer space (TMA-H) with the aim to supply new information about the structure of TMA-H organoclays, such as a final refinement of hydrogen atoms positions. From systematical study of 64 models of the TMA-H modified clay, only very small differences in total energy among the majority of the models were found (~50 kJ/mol as the maximum). Powder diffraction patterns of the models with the highest (H) and lowest energy (L) were not distinguishable. The strength of the weak C···O hydrogen bonds presented in the interlayer space of the hectorite slightly decreases with the total energy of the studied systems. Calculated vibrational modes for the energetically most stable L model of TMA-H organoclay were discussed in detail.
Funding
This research was funded by Vedecká Grantová Agentúra MŠVVaŠ SR a SAV (VEGA, grant number 2/0021/19) and Agentúra na Podporu Výskumu a Vývoja (APVV18-0075 and APVV-19-0487).
Data Availability Statement
Important structural data are presented directly in the manuscript.
Acknowledgments
ES is grateful for the financial support from the Scientific Grant Agency VEGA (Grant 2/0021/19) and the Slovak Research and Development Agency (Grants APVV-18-0075 and APVV-19-0487), and to BHS for the stimulating discussions.
Conflicts of Interest
The author declares no conflict of interest.
References
- Zimowska, M.; Palkova, H.; Madejova, J.; Dula, R.; Pamin, K.; Olejniczak, Z.; Gil, B.; Serwicka, E.M. Laponite-derived porous clay heterostructures: III. The effect of alumination. Microporous Mesoporous Mater. 2013, 175, 67–75. [Google Scholar] [CrossRef]
- Zhang, Q.S.; Zha, L.S.; Ma, J.H.; Liang, B.R. A novel route to the preparation of poly(N-isopropylacrylamide) microgels by using inorganic clay as a cross-linker. Macromol. Rapid Commun. 2007, 28, 116–120. [Google Scholar] [CrossRef]
- Joshi, G.V.; Pawar, R.R.; Kevadiya, B.D.; Bajaj, H.C. Mesoporous synthetic hectorites: A versatile layered host with drug delivery application. Microporous Mesoporous Mater. 2011, 142, 542–548. [Google Scholar] [CrossRef]
- Dos Santos, E.C.; Gates, W.P.; Michels, L.; Juranyi, F.; Mikkelsen, A.; da Silva, G.J.; Fossum, J.O.; Bordallo, H.N. The pH influence on the intercalation of the bioactive agent ciprofloxacin in fluorohectorite. Appl. Clay Sci. 2018, 166, 288–298. [Google Scholar] [CrossRef]
- Calamai, L.; Pantani, O.; Pusino, A.; Gessa, C.; Fusi, P. Interaction of rimsulfuron with smectites. Clays Clay Min. 1997, 45, 23–27. [Google Scholar] [CrossRef]
- Tenorio, R.P.; Engelsberg, M.; Fossum, J.O.; da Silva, G.J. Intercalated Water in Synthetic Fluorhectorite Clay. Langmuir 2010, 26, 9703–9709. [Google Scholar] [CrossRef]
- Carrado, K.A.; Thiyagarajan, P.; Song, K. A study of organo-hectorite clay crystallization. Clay Miner. 1997, 32, 29–40. [Google Scholar] [CrossRef]
- Malikova, N.; Cadene, A.; Dubois, E.; Marry, V.; Durand-Vidal, S.; Turq, P.; Breu, J.; Longeville, S.; Zanotti, J.M. Water diffusion in a synthetic hectorite clay studied by quasi-elastic neutron scattering. J. Phys. Chem. C 2007, 111, 17603–17611. [Google Scholar] [CrossRef]
- Madejova, J. FTIR techniques in clay mineral studies. Vib. Spectrosc. 2003, 31, 1–10. [Google Scholar] [CrossRef]
- Xu, C.Q.; Gu, F.L.; Wu, H.H. BiOCl-montmorillonite as a photocatalyst for highly efficient removal of Rhodamine B and Orange G: Importance of the acidity and dissolved oxygen. Appl. Clay Sci. 2017, 147, 28–35. [Google Scholar] [CrossRef]
- Sun, K.; Shi, Y.; Wang, X.Y.; Rasmussen, J.; Li, Z.H.; Zhu, J.X. Organokaolin for the uptake of pharmaceuticals diclofenac and chloramphenicol from water. Chem. Eng. J. 2017, 330, 1128–1136. [Google Scholar] [CrossRef]
- Wei, H.Z.; Yang, G.; Wang, B.Y.; Li, R.W.; Chen, G.; Li, Z.Z. E. coli interactions, adhesion and transport in alumino-silica clays. Colloids Surf. B Biointerfaces 2017, 154, 82–88. [Google Scholar] [CrossRef]
- Bowers, G.M.; Hoyt, D.W.; Burton, S.D.; Ferguson, B.O.; Varga, T.; Kirkpatrick, R.J. In Situ C-13 and Na-23 Magic Angle Spinning NMR Investigation of Supercritical CO2 Incorporation in Smectite-Natural Organic Matter Composites. J. Phys. Chem. C 2014, 118, 3564–3573. [Google Scholar] [CrossRef]
- Loganathan, N.; Ferguson, B.O.; Arey, B.; Argersinger, H.E.; Bowers, G.M. A Mechanistic Exploration of Natural Organic Matter Aggregation and Surface Complexation in Smectite Mesopores. J. Phys. Chem. A 2020, 124, 9832–9843. [Google Scholar] [CrossRef]
- Cygan, R.T.; Greathouse, J.A.; Heinz, H.; Kalinichev, A.G. Molecular models and simulations of layered materials. J. Mater. Chem. 2009, 19, 2470–2481. [Google Scholar] [CrossRef]
- Heinz, H.; Koerner, H.; Anderson, K.L.; Vaia, R.A.; Farmer, B.L. Force field for mica-type silicates and dynamics of octadecylammonium chains grafted to montmorillonite. Chem. Mater. 2005, 17, 5658–5669. [Google Scholar] [CrossRef]
- Scholtzova, E.; Tunega, D.; Nagy, L.T. Theoretical study of cation substitution in trioctahedral sheet of phyllosilicates. An effect on inner OH group. J. Mol. Struct. Theochem 2003, 620, 1–8. [Google Scholar] [CrossRef]
- Szczerba, M.; Klapyta, Z.; Kalinichev, A. Ethylene glycol intercalation in smectites. Molecular dynamics simulation studies. Appl. Clay Sci. 2014, 91–92, 87–97. [Google Scholar] [CrossRef] [Green Version]
- Teppen, B.J.; Rasmussen, K.; Bertsch, P.M.; Miller, D.M.; Schafer, L. Molecular dynamics modeling of clay minerals.1. Gibbsite, kaolinite, pyrophyllite, and beidellite. J. Phys. Chem. B 1997, 101, 1579–1587. [Google Scholar] [CrossRef]
- Zhu, R.; Hu, W.; You, Z.; Ge, F.; Tian, K. Molecular dynamics simulation of TCDD adsorption on organo-montmorillonite. J. Colloid Interface Sci. 2012, 377, 328–333. [Google Scholar] [CrossRef] [PubMed]
- Scholtzová, E.; Jankovič, L.; Tunega, D. Stability of Tetrabutylphosphonium Beidellite Organoclay. J. Phys. Chem. C 2018, 122, 8380–8389. [Google Scholar] [CrossRef]
- Scholtzova, E.; Madejova, J.; Tunega, D. Structural properties of montmorillonite intercalated with tetraalkylammonium cations-Computational and experimental study. Vib. Spectrosc. 2014, 74, 120–126. [Google Scholar] [CrossRef]
- Scholtzova, E.; Smrcok, L. On recognition of FA/NMFA-dickite intercalates—Total energy vs intensity data. Acta Crystallogr. Sect. A Found. Crystallogr. 2007, 63, s272–s273. [Google Scholar] [CrossRef] [Green Version]
- Matusik, J.; Scholtzova, E.; Tunega, D. Influence of synthesis conditions on the formation of a kaolinite-methanol complex and simulation of its vibrational spectra. Clays Clay Miner. 2012, 60, 227–239. [Google Scholar] [CrossRef]
- Scholtzova, E.; Madejova, J.; Jankovic, L.; Tunega, D. Structural and spectroscopic characterization of montmorillonite intercalated with n-butylammonium cations (n = 1–4)—Modeling and experimental study. Clays Clay Miner. 2016, 64, 401–412. [Google Scholar] [CrossRef]
- Churakov, S.V. Structural position of H2O molecules and hydrogen bonding in anomalous 11 angstrom tobermorite. Am. Miner. 2009, 94, 156–165. [Google Scholar] [CrossRef]
- Coveney, P.V.; Humphries, W. Molecular modelling of the mechanism of action of phosphonate retarders on hydrating cements. J. Chem. Soc. Faraday Trans. 1996, 92, 831–841. [Google Scholar] [CrossRef]
- Scholtzova, E.; Tunega, D.; Speziale, S. Mechanical properties of ettringite and thaumasite-DFT and experimental study. Cem. Concr. Res. 2015, 77, 9–15. [Google Scholar] [CrossRef]
- Scholtzova, E. DFT study of Rb-TFA structure after high-pressure action. Phys. Chem. Miner. 2011, 38, 819–824. [Google Scholar] [CrossRef]
- Kalinichev, A.G.; Wang, J.; Kirkpatrick, R.J. Molecular dynamics modeling of the structure, dynamics and energetics of mineral–water interfaces: Application to cement materials. Cem. Concr. Res. 2007, 37, 337–347. [Google Scholar] [CrossRef]
- Balan, E.; Lazzeri, M.; Delattre, S.; Meheut, M.; Refson, K.; Winkler, B. Anharmonicity of inner-OH stretching modes in hydrous phyllosilicates: Assessment from first-principles frozen-phonon calculations. Phys. Chem. Miner. 2007, 34, 621–625. [Google Scholar] [CrossRef]
- Tosoni, S.; Doll, K.; Ugliengo, P. Hydrogen bond in layered materials: Structural and vibrational properties of kaolinite by a periodic B3LYP approach. Chem. Mater. 2006, 18, 2135–2143. [Google Scholar] [CrossRef]
- Scholtzova, E.; Smrcok, L. Hydrogen bonding and vibrational spectra in kaolinite-dimethylsulfoxide and -dimethylselenoxide intercalates—A solid-state computational study. Clays Clay Miner. 2009, 57, 54–71. [Google Scholar] [CrossRef]
- Scholtzova, E.; Tunega, D.; Madejova, J.; Palkova, H.; Komadel, P. Theoretical and experimental study of montmorillonite intercalated with tetramethylammonium cation. Vib. Spectrosc. 2013, 66, 123–131. [Google Scholar] [CrossRef]
- Scholtzová, E.; Smrčok, Ľ. On local structural changes in lizardite-1T: {Si4+/Al3+}, {Si4+/Fe3+}, [Mg2+/Al3+], [Mg2+/Fe3+] substitutions. Phys. Chem. Miner. 2005, 32, 362–373. [Google Scholar] [CrossRef]
- Scholtzova, E.; Benco, L.; Tunega, D. A model study of dickite intercalated with formamide and N-methylformamide. Phys. Chem. Miner. 2008, 35, 299–309. [Google Scholar] [CrossRef]
- Breu, J.; Seidl, W.; Stoll, A. Disorder in smectites in dependence of the interlayer cation. Z. Fur Anorg. Allg. Chem. 2003, 629, 503–515. [Google Scholar] [CrossRef]
- Seidl, W.; Breu, J. Single crystal structure refinement of tetramethylammonium-hectorite. Z. Für Krist. 2005, 220, 169–176. [Google Scholar] [CrossRef]
- Vahedi-Faridi, A.; Guggenheim, S. Crystal structure of tetramethylammonium-exchanged vermiculite. Clays Clay Miner. 1997, 45, 859–866. [Google Scholar] [CrossRef]
- Capkova, P.; Burda, J.V.; Weiss, Z.; Schenk, H. Modelling of aniline-vermiculite and tetramethylammonium-vermiculite; Test of force fields. J. Mol. Modeling 1999, 5, 8–16. [Google Scholar] [CrossRef]
- Kresse, G.; Furthmuller, J. Efficient iterative schemes for ab initio total-energy calculations using a plane-wave basis set. Phys. Rev. B 1996, 54, 11169–11186. [Google Scholar] [CrossRef]
- Kresse, G.; Hafner, J. Ab-initio molecular-dynamics for open-shell transition-metals. Phys. Rev. B 1993, 48, 13115–13118. [Google Scholar] [CrossRef] [PubMed]
- Perdew, J.P.; Burke, K.; Wang, Y. Generalized gradient approximation for the exchange-correlation hole of a many-electron system. Phys. Rev. B 1996, 54, 16533–16539. [Google Scholar] [CrossRef] [PubMed] [Green Version]
- Blochl, P.E. Projector augmented-wave method. Phys. Rev. B 1994, 50, 17953–17979. [Google Scholar] [CrossRef] [PubMed] [Green Version]
- Kresse, G.; Joubert, D. From ultrasoft pseudopotentials to the projector augmented-wave method. Phys. Rev. B 1999, 59, 1758–1775. [Google Scholar] [CrossRef]
- Hafner, J. Vibrational spectroscopy using ab initio density-functional techniques. J. Mol. Struct. 2003, 651–653, 3–17. [Google Scholar] [CrossRef]
- Grimme, S.; Ehrlich, S.; Goerigk, L. Effect of the Damping Function in Dispersion Corrected Density Functional Theory. J. Comput. Chem. 2011, 32, 1456–1465. [Google Scholar] [CrossRef] [PubMed]
- Castellano, R.K. Progress toward understanding the nature and function of C-H center dot center dot center dot O interactions. Curr. Org. Chem. 2004, 8, 845–865. [Google Scholar] [CrossRef]
- Desiraju, G.; Steiner, T. The Weak Hydrogen Bond in Structural Chemistry and Biology, 2nd ed.; Oxford University Press: Oxford, UK, 2006. [Google Scholar]
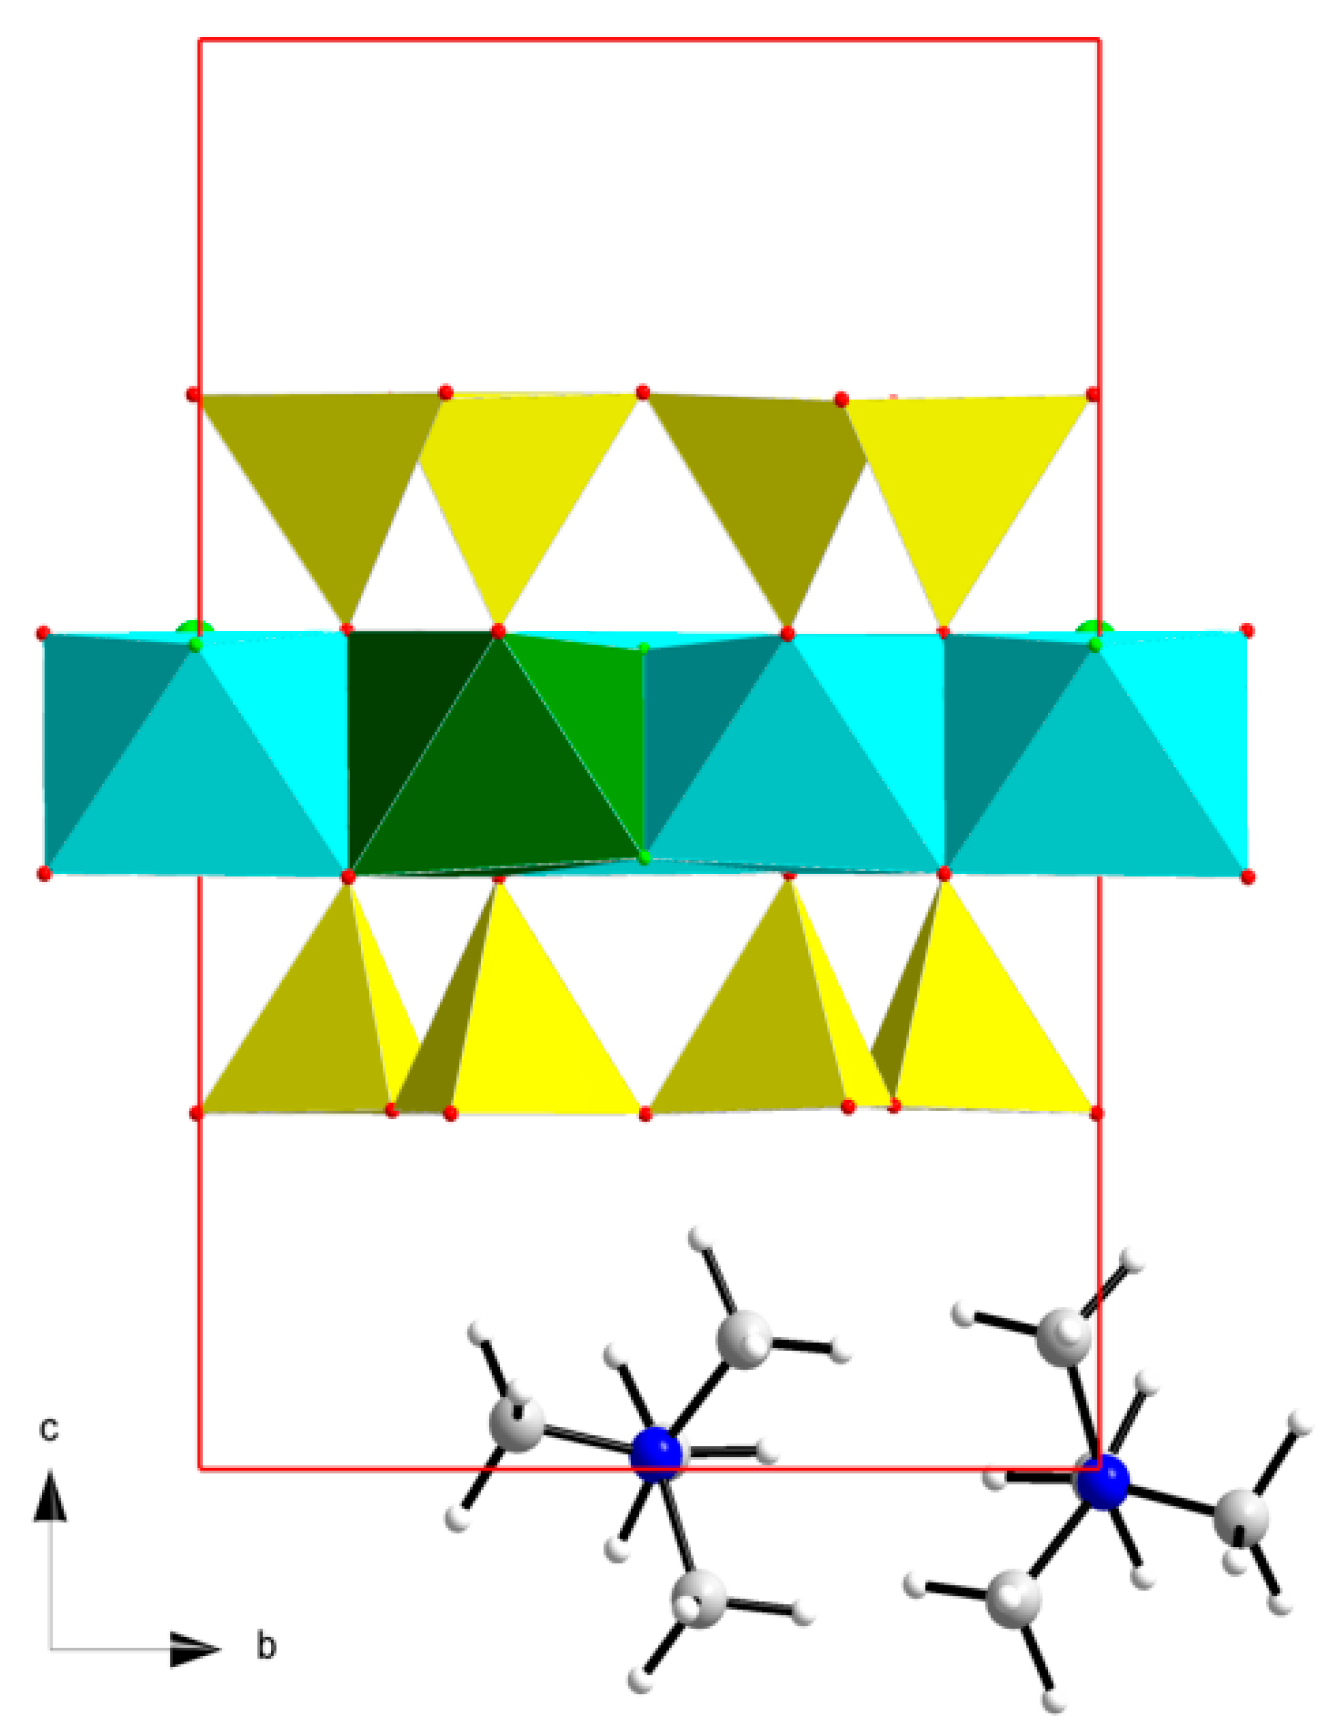
Figure 1.
Optimized L model of the TMAH structure: (−x, −y, −z) Wyckoff position of the first TMA cation (a4 for A type), (x + 0.5, y + 0.5, z) Wyckoff position of the second TMA cation (a5 for A type) as an example (Si-tetrahedra in yellow, Mg-octahedra in cyan and Li-octahedra in green. N atoms in blue, C-atoms in light grey, O atoms in red, H atoms in white and F atoms in light green).

Figure 2.
Graph of total energies’ differences of all 64 models of TMAH, in [eV], L-model with the lowest total energy, H-model with the highest total energy, R-randomly chosen model with a total energy higher than for the L model and lower than for the H model.
Figure 2.
Graph of total energies’ differences of all 64 models of TMAH, in [eV], L-model with the lowest total energy, H-model with the highest total energy, R-randomly chosen model with a total energy higher than for the L model and lower than for the H model.

Figure 3.
Histogram of total energy distribution (down) and cumulative counts’ graph (up) for 64 models of the TMAH structure.
Figure 3.
Histogram of total energy distribution (down) and cumulative counts’ graph (up) for 64 models of the TMAH structure.

Figure 4.
Hydrogen bonds in TMA-hectorite models: (a) L model; (b) R model and (c) H model.

Figure 5.
Calculated powder diffraction profile of the L model and difference of powder diffraction profiles for L and H models (right up).
Figure 5.
Calculated powder diffraction profile of the L model and difference of powder diffraction profiles for L and H models (right up).

Figure 6.
The position of TMA cation in the interlayer space of hectorite: (a) b view; (b) c* view.

Figure 7.
The mutual configuration of the two TMA cations in the optimized TMA-H structure, c* view, L model.
Figure 7.
The mutual configuration of the two TMA cations in the optimized TMA-H structure, c* view, L model.

Figure 8.
Calculated vibrational modes for the TMAH structure.


Table 1.
X, Y Wyckoff position, 8j, for atoms in A and/or B types of TMA cation, respectively.
| X, Y Position | A Cation | B Cation | Symmetry Code |
|---|---|---|---|
| 1 | a1 | b1 | x, y, z |
| 2 | a2 | b2 | −x, y, −z |
| 3 | a3 | b3 | x, −y, z |
| 4 | a4 | b4 | −x, −y, −z |
| 5 | a5 | b5 | x + 0.5, y + 0.5, z |
| 6 | a6 | b6 | −x + 0.5, y + 0.5, −z |
| 7 | a7 | b7 | −x + 0.5, −y + 0.5, −z |
| 8 | a8 | b8 | x + 0.5, −y + 0.5, z |
Table 2.
Scheme of the positions of the TMA cations in the computational models; X and Y are positions of TMA cations; the numerals are the sequential numbers of the symmetry operation in the Wyckoff position 8j.
Table 2.
Scheme of the positions of the TMA cations in the computational models; X and Y are positions of TMA cations; the numerals are the sequential numbers of the symmetry operation in the Wyckoff position 8j.
| 1X,5Y | 1X,6Y | 1X,7Y | 1X,8Y |
| 2X,5Y | 2X,6Y | 2X,7Y | 2X,8Y |
| 3X,5Y | 3X,6Y | 3X,7Y | 3X,8Y |
| 4X,5Y | 4X,6Y | 4X,7Y | 4X,8Y |
Table 3.
Total energies and C-H···O bond angle ranges for TMA-H models. The ranges are given as <minimum; median; maximum>.
Table 3.
Total energies and C-H···O bond angle ranges for TMA-H models. The ranges are given as <minimum; median; maximum>.
| Model | Total Energy [eV] | C-H···O Bond Angle [°] |
|---|---|---|
| L | −451.248 | <122; 127; 171> |
| R | −451.235 | <120; 130; 165> |
| H | −450.715 | <102; 135; 161> |
Table 4.
Selected bond lengths for the L model of TMA-H.
| Bond | Exp. 1 [Å] | Calc. [Å] |
|---|---|---|
| Si-O | 1.618(2)–1.640(2) | 1.598–1.670 |
| Mg1-F | 2.023(2) | 2.051 |
| Mg2-F | 2.013(2) | 1.989 |
| Li-F | - | 1.945 |
| Mg1-O | 2.084(2) | 2.057 |
| Mg2-O | 2.088(2) | 2.086 |
| Li-O | - | 2.067 |
| N-C | - | 1.499 |
| C-H | - | 1.093 |
1 Seidl and Breu (2005) [38].
Table 5.
Hydrogen bonds (HB): D···A distances in TMA-H models, [Å].
| HB | TMA(1) | Exp. 1 | L Model | R Model | H Model |
|---|---|---|---|---|---|
| a | C1-Obas | 3.32(2)–3.50(3) | 2.97–3.47 | 3.02–3.48 | 2.71–3.46 |
| b | C3-O3 | 3.43(3)–3.45(1) | 3.30–3.54 | 3.38–3.51 | 3.37–3.48 |
| c | C2-O4 | 3.53(4)–3.54(2) | 3.37–3.56 | 3.49–3.58 | 3.55–3.61 |
| d | C4-Obas | 3.32(2)–3.45(3) | 3.13–3.54 | 3.10–3.56 | 2.86–3.17 |
| TMA(2) | |||||
| e | C5-Obas | 3.30(2)–3.53(3) | 2.95–3.50 | 3.04–3.48 | 2.76–3.54 |
| f | C6-O4 | 3.42(1)–3.45(2) | 3.33–3.56 | 3.49–3.61 | 3.49 |
| g | C7-O3 | 3.47(1)–3.51(2) | 3.32–3.52 | 3.37–3.54 | 3.24–3.49 |
| h | C8-Obas | 3.29(2)–3.47(3) | 3.10–3.51 | 3.15–3.51 | 2.92–3.6 |
1 Seidl and Breu (2005) [38].
Table 6.
Optimized atomic positions in the energetically most stable L model of the TMA-H structure in comparison to the experimental structure [38].
Table 6.
Optimized atomic positions in the energetically most stable L model of the TMA-H structure in comparison to the experimental structure [38].
| Atoms | xexp | xcalc | yexp | ycalc | zexp | zcalc |
|---|---|---|---|---|---|---|
| Si | 0.0981(1) | 0.09642 | 0.1668(1) | 0.19602 | 0.2960(1) | 0.29687 |
| Mg1 | 0.5 | 0.48659 | 0.1666(1) | 0.19975 | 0.5 | 0.50139 |
| Li1 | 0.5 | 0.48582 | 0.1666 | 0.12004 | 0.5 | 0.50128 |
| Mg2 | 0 | 0.01272 | 0 | −0.02868 | 0.5 | 0.50112 |
| Li2 | 0 | 0.01396 | 0 | 0.17757 | 0.5 | 0.50127 |
| F | −0.3570(3) | −0.36033 | 0 | 0.02869 | 0.4258(1) | 0.42536 |
| O1 | 0.1383(3) | 0.11491 | 0.1670(2) | 0.19741 | 0.4164(1) | 0.41551 |
| O3 | 0.0785(4) | 0.07299 | 0 | 0.02915 | 0.2512(1) | 0.24804 |
| O4 | −0.1645(3) | −0.15418 | 0.2523(2) | 0.30663 | 0.2509(1) | 0.24811 |
Table 7.
Comparison of optimized atomic positions for TMA cations in the L model to the experimental structure [38].
Table 7.
Comparison of optimized atomic positions for TMA cations in the L model to the experimental structure [38].
| Atoms | xexp | xcalc | yexp | ycalc | zexp | zcalc |
|---|---|---|---|---|---|---|
| N1 | 1.390(3) | 1.42085 | 1.060(2) | 0.96358 | 1.001(1) | 0.99458 |
| C1 | 1.473(6) | 1.51387 | 0.989(4) | 0.80877 | 0.910(3) | 0.98854 |
| C2 | 1.445(5) | 1.47737 | 1.219(2) | 1.04967 | 1.000(3) | 0.90491 |
| C3 | 1.108(4) | 1.14058 | 1.035(3) | 0.95770 | 1.000(2) | 0.99373 |
| C4 | 1.532(5) | 1.53764 | 0.991(5) | 1.03788 | 1.093(2) | 1.09142 |
| N2 | 1.474(6) | 1.44884 | −1.080(2) | −1.03362 | 1.000(4) | 0.99211 |
| C5 | 1.468(10) | 1.50579 | −0.983(8) | −0.95037 | 0.911(7) | 0.90225 |
| C6 | 1.676(5) | 1.54216 | −1.193(4) | −1.19151 | 0.999(3) | 0.98618 |
| C7 | 1.217(5) | 1.16693 | −1.153(4) | −1.04229 | 0.998(3) | 0.99103 |
| C8 | 1.527(8) | 1.56383 | −0.989(8) | −0.96780 | 1.093(7) | 1.08908 |
Table 8.
Optimized atomic positions of hydrogen atoms in TMA cations in the L model.
| H Atom | xcalc | ycalc | zcalc |
|---|---|---|---|
| H18A | 1.4148 | 0.7603 | 0.9202 |
| H18B | 1.4734 | 0.7526 | 1.0560 |
| H18C | 1.7201 | 0.8082 | 0.9853 |
| H28A | 1.3878 | 0.9948 | 0.8374 |
| H28B | 1.6840 | 1.0551 | 0.9038 |
| H28C | 1.3971 | 1.1596 | 1.9085 |
| H38A | 1.0886 | 1.0071 | 1.0624 |
| H38B | 1.0761 | 0.8426 | 0.9913 |
| H38C | 1.0449 | 1.0115 | 0.9259 |
| H48A | 1.7461 | 1.0351 | 1.0954 |
| H48B | 1.4851 | 0.9647 | 1.1528 |
| H48C | 1.4601 | 1.1421 | 1.0975 |
| H13A | −1.7116 | −1.9437 | −0.9018 |
| H13B | −1.4223 | −1.8409 | −0.9049 |
| H13C | −1.4180 | −1.0064 | −0.8347 |
| H23A | −1.5020 | −1.2472 | −0.0537 |
| H23B | −1.7478 | −1.1914 | −0.9828 |
| H23C | −1.4423 | −1.2395 | −0.9179 |
| H33A | −1.1037 | −1.1574 | −0.9884 |
| H33B | −1.0724 | −1.9884 | −0.9233 |
| H33C | −1.1155 | −1.9930 | −0.0597 |
| H43A | −1.5118 | −1.0347 | −0.1506 |
| H43B | −1.4868 | −1.8575 | −0.0949 |
| H43C | −1.7728 | −1.9644 | −0.0931 |
Publisher’s Note: MDPI stays neutral with regard to jurisdictional claims in published maps and institutional affiliations. |
© 2021 by the author. Licensee MDPI, Basel, Switzerland. This article is an open access article distributed under the terms and conditions of the Creative Commons Attribution (CC BY) license (https://creativecommons.org/licenses/by/4.0/).
Share and Cite
MDPI and ACS Style
Scholtzová, E. Insight into the Structure of TMA-Hectorite: A Theoretical Approach. Minerals 2021, 11, 505. https://doi.org/10.3390/min11050505
AMA Style
Scholtzová E. Insight into the Structure of TMA-Hectorite: A Theoretical Approach. Minerals. 2021; 11(5):505. https://doi.org/10.3390/min11050505
Chicago/Turabian StyleScholtzová, Eva. 2021. "Insight into the Structure of TMA-Hectorite: A Theoretical Approach" Minerals 11, no. 5: 505. https://doi.org/10.3390/min11050505
Note that from the first issue of 2016, this journal uses article numbers instead of page numbers. See further details here.