
Carbonation Reaction Mechanisms of Portlandite Predicted from Enhanced Ab Initio Molecular Dynamics Simulations


1
Laboratoire SUBATECH (UMR 6457–Institut Mines-Télécom Atlantique, Université de Nantes, CNRS/IN2P3), 44307 Nantes, France
2
International Laboratory for Supercomputer Atomistic Modelling and Multiscale Analysis, National Research University Higher School of Economics, 123458 Moscow, Russia
*
Author to whom correspondence should be addressed.
Minerals 2021, 11(5), 509; https://doi.org/10.3390/min11050509
Submission received: 21 March 2021
/
Revised: 4 May 2021
/
Accepted: 6 May 2021
/
Published: 11 May 2021
(This article belongs to the Special Issue First Principles Calculations of Minerals and Related Materials)
Abstract
:Geological carbon capture and sequestration (CCS) is a promising technology for curbing the global warming crisis by reduction of the overall carbon footprint. Degradation of cement wellbore casings due to carbonation reactions in the underground CO2 storage environment is one of the central issues in assessing the long-term success of the CCS operations. However, the complexity of hydrated cement coupled with extreme subsurface environmental conditions makes it difficult to understand the carbonation reaction mechanisms leading to the loss of well integrity. In this work, we use biased ab initio molecular dynamics (AIMD) simulations to explore the reactivity of supercritical CO2 with the basal and edge surfaces of a model hydrated cement phase—portlandite—in dry scCO2 and water-rich conditions. Our simulations show that in dry scCO2 conditions, the undercoordinated edge surfaces of portlandite experience a fast barrierless reaction with CO2, while the fully hydroxylated basal surfaces suppress the formation of carbonate ions, resulting in a higher reactivity barrier. We deduce that the rate-limiting step in scCO2 conditions is the formation of the surface carbonate barrier which controls the diffusion of CO2 through the layer. The presence of water hinders direct interaction of CO2 with portlandite as H2O molecules form well-structured surface layers. In the water-rich environment, CO2 undergoes a concerted reaction with H2O and surface hydroxyl groups to form bicarbonate complexes. We relate the variation of the free-energy barriers in the formation of the bicarbonate complexes to the structure of the water layer at the interface which is, in turn, dictated by the surface chemistry and the degree of nanoconfinement.

1. Introduction
The development of effective and sustainable approaches for the reduction of global carbon footprint is crucial for combating climate change and its negative effects. The technology of geological carbon capture and sequestration (CCS) has demonstrated an enormous potential in this respect [1,2,3,4,5]. This technology, however, poses several scientific questions which are important for its long-term success. One of the major concerns is the degradation of cement wellbore casings which are used to prevent migration of fluids to the surface through leakage pathways [6,7,8,9,10,11,12]. Although leakage pathways can occur in wells due to faulty construction and other mechanical defects, geochemical reactions induced by the injected fluids could cause cement degradation, resulting in damage of wells and the development of leaks [6,7,13,14,15]. Therefore, to make accurate and reliable assessments of the near- and long-term performance of wellbore cements when exposed to injected CO2, it is important to understand geochemical interactions between CO2 and cement at relevant subsurface operation conditions.
The carbonation reactions of the injected CO2 with wellbore cement pose serious well integrity issues because of the acid attack on cement [16]. CO2-saturated fluids are thermodynamically incompatible with cement, since cement is highly alkaline (pH > 12.5) and not in chemical equilibrium with the acidic CO2-rich fluids (pH < 6) [17]. Depending on the subsurface conditions (e.g., temperature, pressure, salinity), studies report different degrees of cement degradation due to CO2-rich fluids [11,13,18,19,20,21]. For instance, in dry supercritical CO2 (scCO2) conditions, carbonation of cement results in decrease of permeability and a slight increase in hydrated cement strength [19,20,22]. On the other hand, in the presence of water and/or brine, cement undergoes a progressive decalcification process, which leads to a drastic loss of mechanical strength and an increase of permeability [19,20,22,23,24,25]. Nevertheless, due to the complexity of the subsurface environmental conditions, it is difficult to experimentally disentangle various factors controlling the carbonation of wellbore cement. In this regard, atomistic computer simulation approaches have proven to be very useful because of their ability to provide atomic-scale quantitative information about the physical and chemical processes occurring during carbonation [26,27,28,29].
The degradation of cement due to carbonation reactions mainly affects portlandite (Ca(OH)2) and calcium silicate hydrate (C-S-H) phases, which both constitute about 70–85% of hydrated cement [17]. In this work, we have focused on the reactivity of CO2 with the portlandite phase. Portlandite is a hydrous mineral which is very reactive with CO2, making it a good model for understanding carbonation reaction mechanisms in cement and in other hydrous minerals with similar structure (e.g., Mg(OH)2). The carbonation reaction mechanism of portlandite has been a subject of many recent studies using experimental [30,31,32,33,34,35,36,37,38] and atomistic simulation [28,39] techniques. It is proposed that carbonation of portlandite is based on either a solid-state mechanism [34,37,40] or via coupled dissolution-precipitation reaction mechanism in a water-rich environment [31]. Although the reaction products are well known, the rate at which these two reaction mechanisms proceed critically depends on the presence of water, pressure and temperature [40]. Galan et. al [37] highlight that at ambient conditions, gas-solid carbonation reaction is self-arresting due to the formation of a protective carbonate layer around the portlandite crystal. The same observation is reported by Longo et. al [29] on the carbonation of wollastonite (CaSiO3). In contrast, Vance et. al [30] suggests that so long as suitable reaction conditions are provisioned, the direct carbonation of Ca(OH)2 and ordinary Portland cement (OPC) can progress substantially due to the volume change accompanying the reaction and the release of water which favors advancement of the reaction.
To provide a better understanding of the carbonation reaction mechanism of portlandite, this work examines and compares the reactivity of basal and edge surfaces of portlandite with scCO2 and H2O/CO2 mixture using enhanced ab initio molecular dynamics (AIMD) simulations. In AIMD simulations, the forces are calculated on-the-fly from accurate electronic structure calculations, and thus the technique is a reliable approach to predict reaction pathways and the energetics of CO2–portlandite interactions. However, AIMD calculations are computationally very demanding, which limits the model system size to only a few hundred atoms and the timescales to only a few tens of picoseconds. Since the picosecond timescale is appropriate to simulate only barrierless processes, the dynamics of the rare reaction events was accelerated by means of the metadynamics approach [41,42]. This method allows us to compute the free-energy landscape for the carbonation reaction of CO2 with the portlandite surfaces. We show that in dry scCO2 conditions, the edge surfaces of portlandite undergo a rapid barrierless carbonation reaction resulting in the formation of a carbonate surface layer. In contrast, the presence of water hinders direct interaction of CO2 with portlandite surface, with the free-energy barrier being governed by the thickness of the interfacial water layer.
2. Methods
2.1. Computational Details
To model the reaction mechanisms of CO2 with portlandite crystals, we used the ab initio molecular dynamics (AIMD) simulation technique [43,44,45]. AIMD is a versatile tool which combines both first principles and molecular dynamics concepts where the interatomic forces are calculated based on quantum mechanics (electronic structure theory) and the motion of the nuclei is described classically according to Newton’s mechanical laws. This allows realistic simulations to be performed without adjustable parameters. Nevertheless, an accurate description of the processes is highly dependent on the different approximations employed in the electronic structure calculations, such as the exchange-correlation functional approximation, the description of the dispersive (van der Waals) interactions as corrections, and the basis set limitations.
The characteristic times accessible by AIMD simulations are small—on the order of picoseconds—and thus are not often sufficient to capture chemical reactions which occur as are rare events at longer timescales. To overcome this potential limitation, the metadynamics enhanced sampling method [41,42,46,47,48] was used to facilitate the reaction events and evaluate the free energy of the CO2 carbonation reactions. Metadynamics enables the acceleration of conformational transitions by iteratively filling the potential energy surface by a sum of Gaussians centered along the trajectory of a set of collective variables [48]. Thus, its effectiveness depends on the appropriate choice of collective variables defined to describe the processes of interest.
The AIMD simulations were performed within the density functional theory (DFT) using the Gaussian and plane-wave basis approach, as implemented in the CP2K simulation code [49]. The core electrons were described using the Goedecker-Teter-Hutter (GTH) [50] pseudopotentials and the valence density was developed on a double-zeta valence polarized (DZVP) basis set along with an auxiliary plane-wave basis set with cutoff energy of 400 Ry obtained after a series of convergence tests (see Figure S1 in the supporting information). The generalized gradient approximation (GGA) parametrized by Perdew, Burke and Ernzerholf (PBE) [51] was used for the exchange-correlation terms with the dispersion interactions included using the Grimme D3 [52] corrections. The nuclei dynamics was treated within the Born-Oppenheimer approximation and the convergence on forces was chosen to be 10−6 a.u. The timestep for the integration of the equations of motion was set to 0.5 fs. All calculations were performed in the NVT statistical ensemble (constant temperature T, volume V, and the number of particles N) at a temperature of 323 K which is maintained using the Canonical Sampling through Velocity Rescaling (CSVR) thermostat [53]. The systems were pre-equilibrated for 5 ps before a production run of 30 ps was performed for further statistical property analysis.
The metadynamics technique was used to calculate the reaction free energies using the PLUMED code [54]. To predict the reactivity of CO2 molecules with the portlandite surfaces in pure supercritical state and in a CO2/H2O mixture, we chose the carbon atom (for all the CO2 molecules) coordination number (CN) to oxygen atoms of both the surface hydroxyls (Oh) and of the neighboring H2O molecules (Ow) as the collective variable (CV). This choice of the collective variable ensures that the reaction barrier for sp3 hybridization of the carbon atom is estimated and does not include any proton transfers in the general reaction coordinates. The calculation of the atom coordination numbers is defined by the switching function, Cij(rij):
where rij is the instantaneous distance between atoms i and j, r0 is the distance beyond which the bond is considered to be broken and d0 is the central value of the switching function (i.e., Cij(d0) = 1). m and n are parameters of the switching function chosen in such a way that Cij(rij) tends to zero beyond r0. Gaussian hills with the width of 0.02 and an initial height of 3.3 kJ/mol were added every 50 fs. The metadynamics simulations were ran for 30 ps, during which only forward reactions were observed. However, the free energy surface (FES) curves were constructed till the first barrier crossings and therefore the free-energy barrier is estimated from the bias potential accumulated after a single barrier-crossing event. This implies that while the reactant regions of the paths are reproduced properly by the bias potential, the product regions do not feature their real depths. This strategy of cutting the FES at the moment of crossing commonly used in DFT-based metadynamics simulations is aimed at dealing with hysteresis (where the barrier keeps going down once the system is in the product well) [55]. The information on the variation of the CVs with time is provided in the supporting information (Figure S2). The free energy (F) within the different states in the FES is obtained by integrating the (FES) F(s), with respect to the collective variables (s) as follows [41,56]:
where , is the Boltzmann constant, T the temperature of the system and F(s) defines the free-energy surface.
To determine the portlandite surfaces exposed to the environment, the surface energies (γ) of various low-index surfaces were calculated. The surface energies were calculated from the energies obtained in the DFT calculations of the bulk portlandite crystal and the surface slabs using the following relation:
where Eslab is the total energy of the slab and Ebulk is the bulk total energy, n is the number of bulk unit cells used to construct the slab, A is the area of the generated surfaces and the factor of 2 accounts for the two equivalent surfaces in the slab. Based on the Wulff theorem [57], the equilibrium morphology of the portlandite crystal was obtained from a polar plot of the surface energy versus the orientation of the surface normal vector using the WulffMaker software [58]. The relative contribution of a crystal facet to the morphology is dependent not only on the surface energy but also on its orientation [57,59].
2.2. Atomistic Models
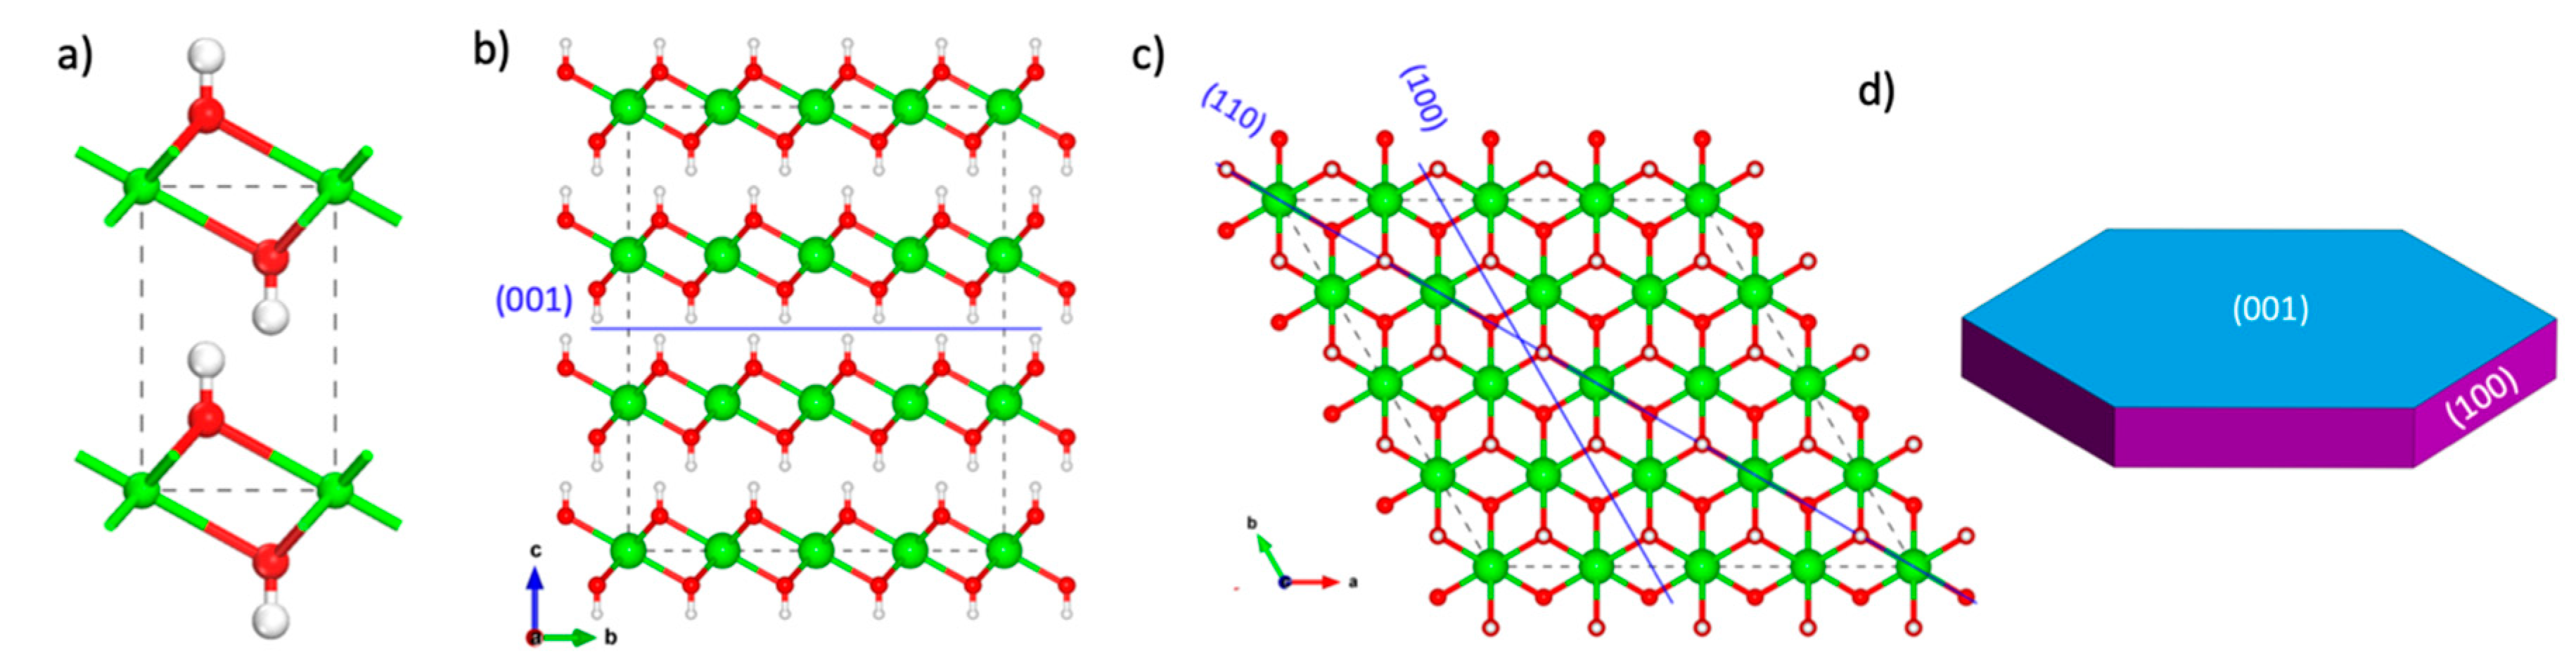
Portlandite, Ca(OH)2, is a layered mineral, with the layers consisting of distorted edge-sharing CaO6 polyhedra. Each hydroxyl group is connected to three calcium atoms in its layer and surrounded by three other hydroxyl groups belonging to the adjacent layer (see Figure 1a). The portlandite crystal model used in this work is characterized by the hexagonal crystal structure with lattice parameters a = b = 3.589 Å, c = 4.911 Å, α = β = 90° and γ = 120° [60]. The lattice parameters obtained after optimization are a = b = 3.696 Å, c = 5.147 Å, α = β = 90° and γ = 120°, within 5% of the experimental parameters.
To build the surface models, supercells representing the crystal were created by multiplying the unit cell by 4 × 4 × 3 along the a, b, and c crystallographic directions, respectively. The supercells were then cleaved along the planes (001), (100), , (110), (101) and , exposing various crystal facets to investigate the relative surface stability and crystal morphology in vacuum conditions. The created surfaces were separated by a vacuum space of 10 Å along the surface normal.
According to Equation (2), the calculated surface energies are 0.042, 0.336, 0.338, 0.544, 0.796, and 0.781 J/m2 for the (001), (100), , (110), (101) and surfaces, respectively. We note that the (100) and cleavages expose the same surface atoms hence they have very similar values for the surface energies. The (001) surface which results from cleaving the crystal through the weakly interacting hydroxyl layers (Figure 1b) has the lowest surface energy. No chemical bonds were broken during the cleavage of the (001) surface and the calcium atoms remain fully coordinated. The 0.042 J/m2 value obtained in our calculations compares well with the 0.051 J/m2 value obtained from other DFT simulations [61], 0.073 J/m2 by molecular mechanics calculations [62] and 0.107 J/m2 from theoretical studies [63]. Indeed, experiments predict a perfect cleavage along the (001) plane [64] for a naturally occurring portlandite mineral. For the second most stable surface; the (100), the surface calcium atoms are five-fold coordinated, while they are four-fold coordinated for the (110) surface. It is important to note that the trend of the relative surface energies follows the degree of under-coordination of the calcium atoms at the surface and the presence of kinks and steps. The position of the cleavage planes for the low surface energy planes is illustrated in Figure 1b,c.
The equilibrium morphology of portlandite based on the calculated surface energies and Wulff construction is a hexagonal platelet (Figure 1d). The basal (001) surface is dominant with the (100) surfaces constituting the thin edges. The platelet morphology of portlandite is typical for cementitious materials hydrated in the presence of sulfates [65,66,67] and naturally occurring portlandite minerals [64]. The (001), (100) and (110) faces are chosen for our carbonation analysis due to their high surface stability and variation of surface chemistry.
To develop a clear picture of the carbonation reaction of CO2 with portlandite surfaces, we analyzed two scenarios: portlandite nanopores filled with pure scCO2 and a H2O/CO2 mixture. The portlandite/scCO2 and portlandite/H2O/CO2 atomistic models were built by inserting the CO2 and H2O/CO2 molecules within the 10 Å vacuum space of the (001), (100) and (110) pores. The choice of the pore size ensures that the systems are within the range of few hundred atoms, thus limiting the computational cost of the DFT calculations, while it is already large enough for the simulations to realistically model not only the first coordination sphere of the reacting interfacial fluids molecules, but also their second coordination sphere. The number of molecules is selected such that the densities of the pore solution are 0.78 g/cm3 and 0.95 g/cm3 for the pure scCO2 and H2O/CO2 mixture, respectively (Table 1). To ensure that the pore fluids are at supercritical conditions, the simulations were performed at a temperature and pressure values of 323 K and 90 bar, respectively. Consequently, all the systems were first pre-equilibrated by performing classical MD simulations in the isothermal-isobaric (NPT) statistical ensemble for 2 ns to acquire the desired pressure conditions. The classical MD simulations were performed using the LAMMPS [68] package and the atomic interaction parameters were described by the ClayFF [69] force field. The force field parameters for the CO2 molecules were taken from the work by Cygan et. al [70]. The timestep was set to 0.5 fs and the Coulomb interactions are modelled using the PPPM method [71] with a precision of 10−5 and a cutoff distance of 10 Å for pair interactions. Periodic boundary conditions were applied in all the three dimensions. The final snapshots of the equilibrated trajectories were then taken as input models for the AIMD simulations.
3. Results and Discussion
3.1. The Reactivity of Pure ScCO2 with Portlandite Surfaces
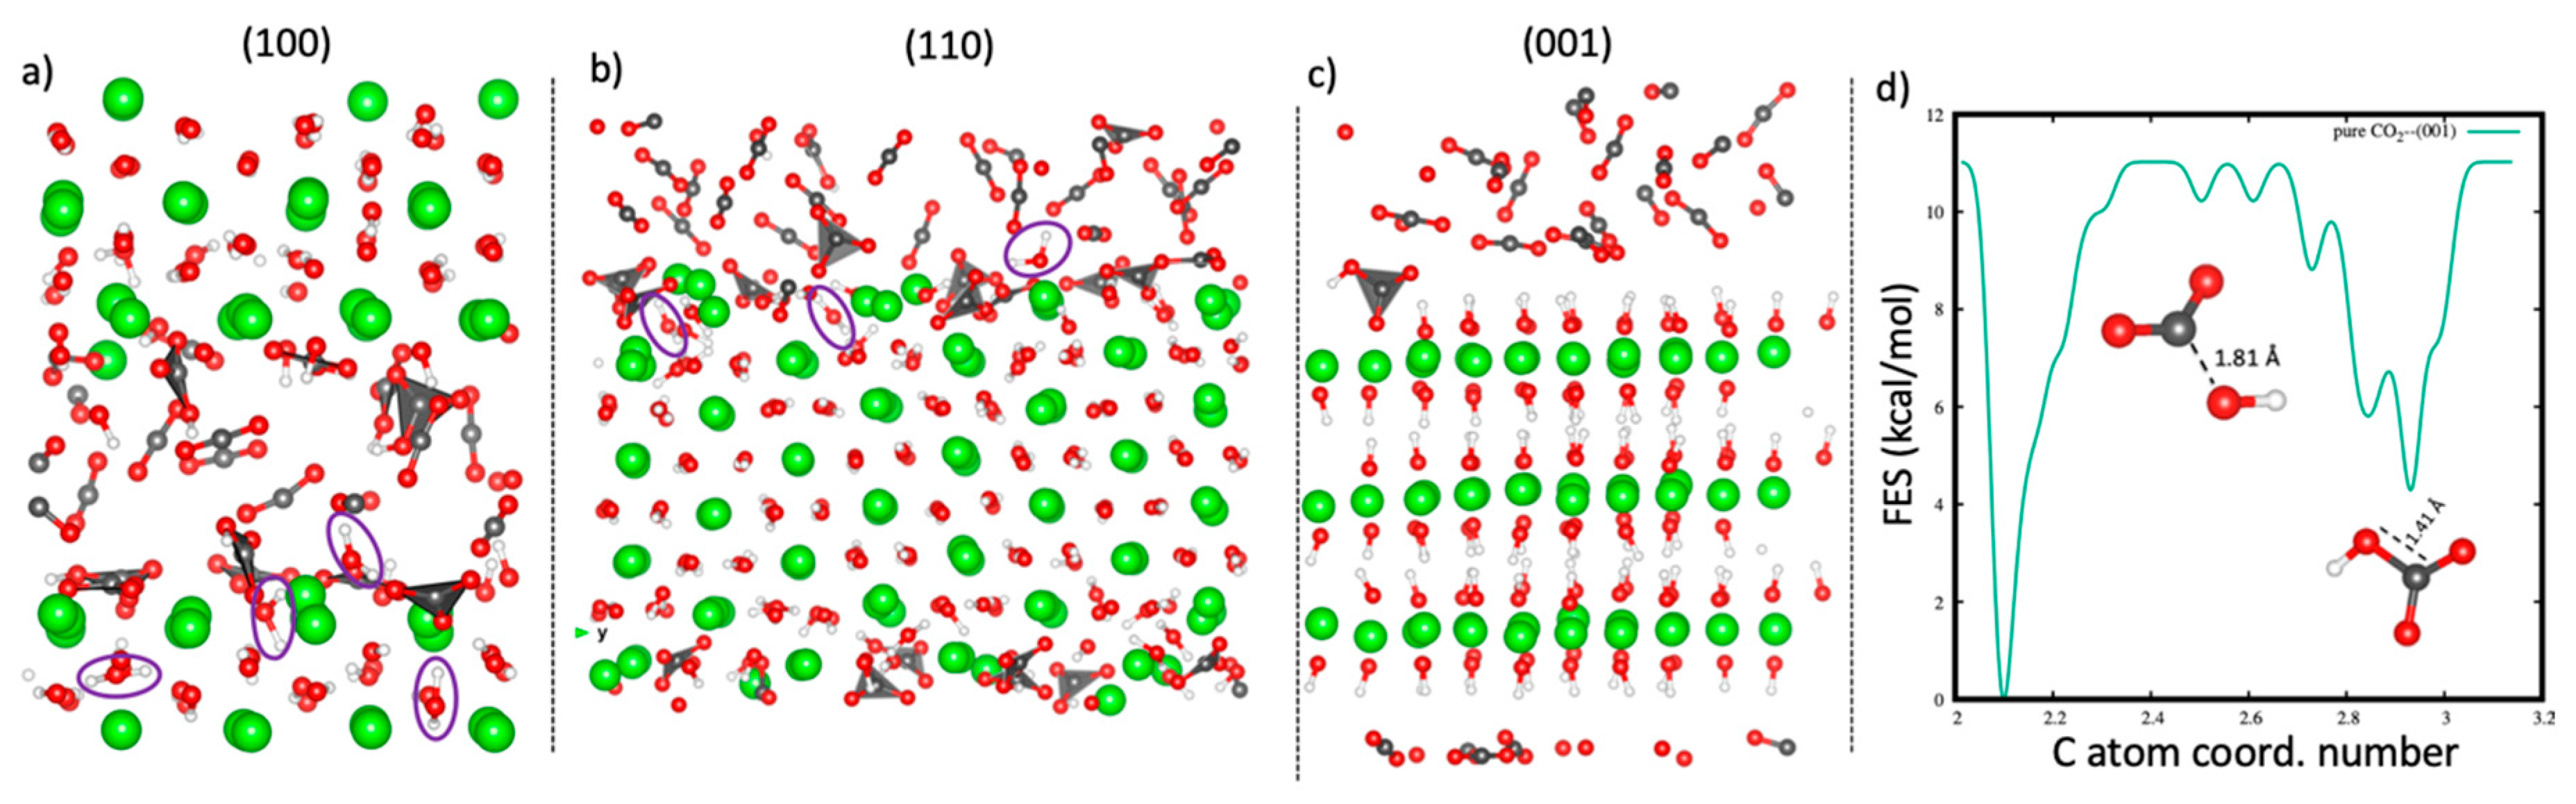
Due to the absence of water within the portlandite pores, the carbonation reaction of portlandite described in this section corresponds to a solid-state reaction [32,33,40], which thermodynamically proceeds as shown in equation (3). On exposing a portlandite crystal to scCO2, various crystal facets react at different reaction rates. Our results show that the (100) and the (110) surfaces undergo a rapid barrierless reaction to form (bi)carbonate complexes on the surfaces within the first 5 ps of equilibration (see Figure 2a,b for the snapshots of the reacted surfaces). The spontaneous reaction is ascribed to the defects in the local coordination environment of the two surfaces as the reactivity of atoms surrounding a vacant site is reported to increase due to their reduced coordination state. [72]. The carbonation reaction occurs through a concerted C-O bond formation with the surface oxygen atoms (sp3 hybridization of the C atom) and a proton transfer to form an H2O molecule. Some protons hop to the adjacent layers in the bulk region, facilitating formation of H2O molecules within the layers. The water produced from the reaction has been shown to impact the carbonation reaction by facilitating the dissolution of the calcium atoms, thus allowing further carbonation reactions [39,73,74,75,76]:
After a few ps of AIMD simulations, the (100) and the (110) surfaces are saturated with the (bi)carbonate complexes, which occupy the positions formerly occupied by the surface hydroxyl groups. The surface (bi)carbonate complexes form a carbonate layer which acts as a barrier to further intake of CO2. Consequently, the carbonation reaction ceases, in accordance with previous studies [37,73,74,77,78]. There is no penetration of CO2 molecules into the bulk crystal, and thus a surface-only reaction is observed. Therefore, the rate-limiting step of the solid-state carbonation reaction on the (100) and (110) surfaces is interpreted as the formation of a carbonate surface barrier. On the other hand, the (001) basal surface does not react spontaneously with scCO2 like the edge surfaces, and no reaction was observed during the equilibration time. This implies that fully hydroxylated surfaces suppress the formation of carbonate ions, hence, a higher reactivity barrier for CO2 with the (001) surface in comparison to the (100) and (110) surfaces. Indeed, the probability of carbonation of the (001) surface in solid-state form has been reported to be very low under ambient conditions [28] and experimental results have indicated that almost no carbonation occurs in the absence of water [73,79].
To enhance the sampling of the configurational space and estimate the free-energy barrier of the carbonation reaction within the (001) pore, a metadynamics calculation was set up with the coordination number of C atoms to all surface O atoms as the collective variable. As shown in Figure 2c, the metadynamics calculations activate the reaction of CO2 with the (001) surface to form a bicarbonate ion. The free-energy reaction barrier for the reaction
is calculated as 11.07 kcal/mol (Figure 2d). This result is in good agreement with previous metadynamics simulations [80,81] and the 11.5 kcal/mol value observed experimentally [82]. The resultant bicarbonate ion formed from the reaction is stable and remains coordinated to the surface. No transformation to carbonate ion was observed during the entire simulation time. This could be attributed to the high energy cost required to dehydroxylate the (001) surface.
3.1.1. Structural and Dynamical Analysis of ScCO2 within Portlandite Pores
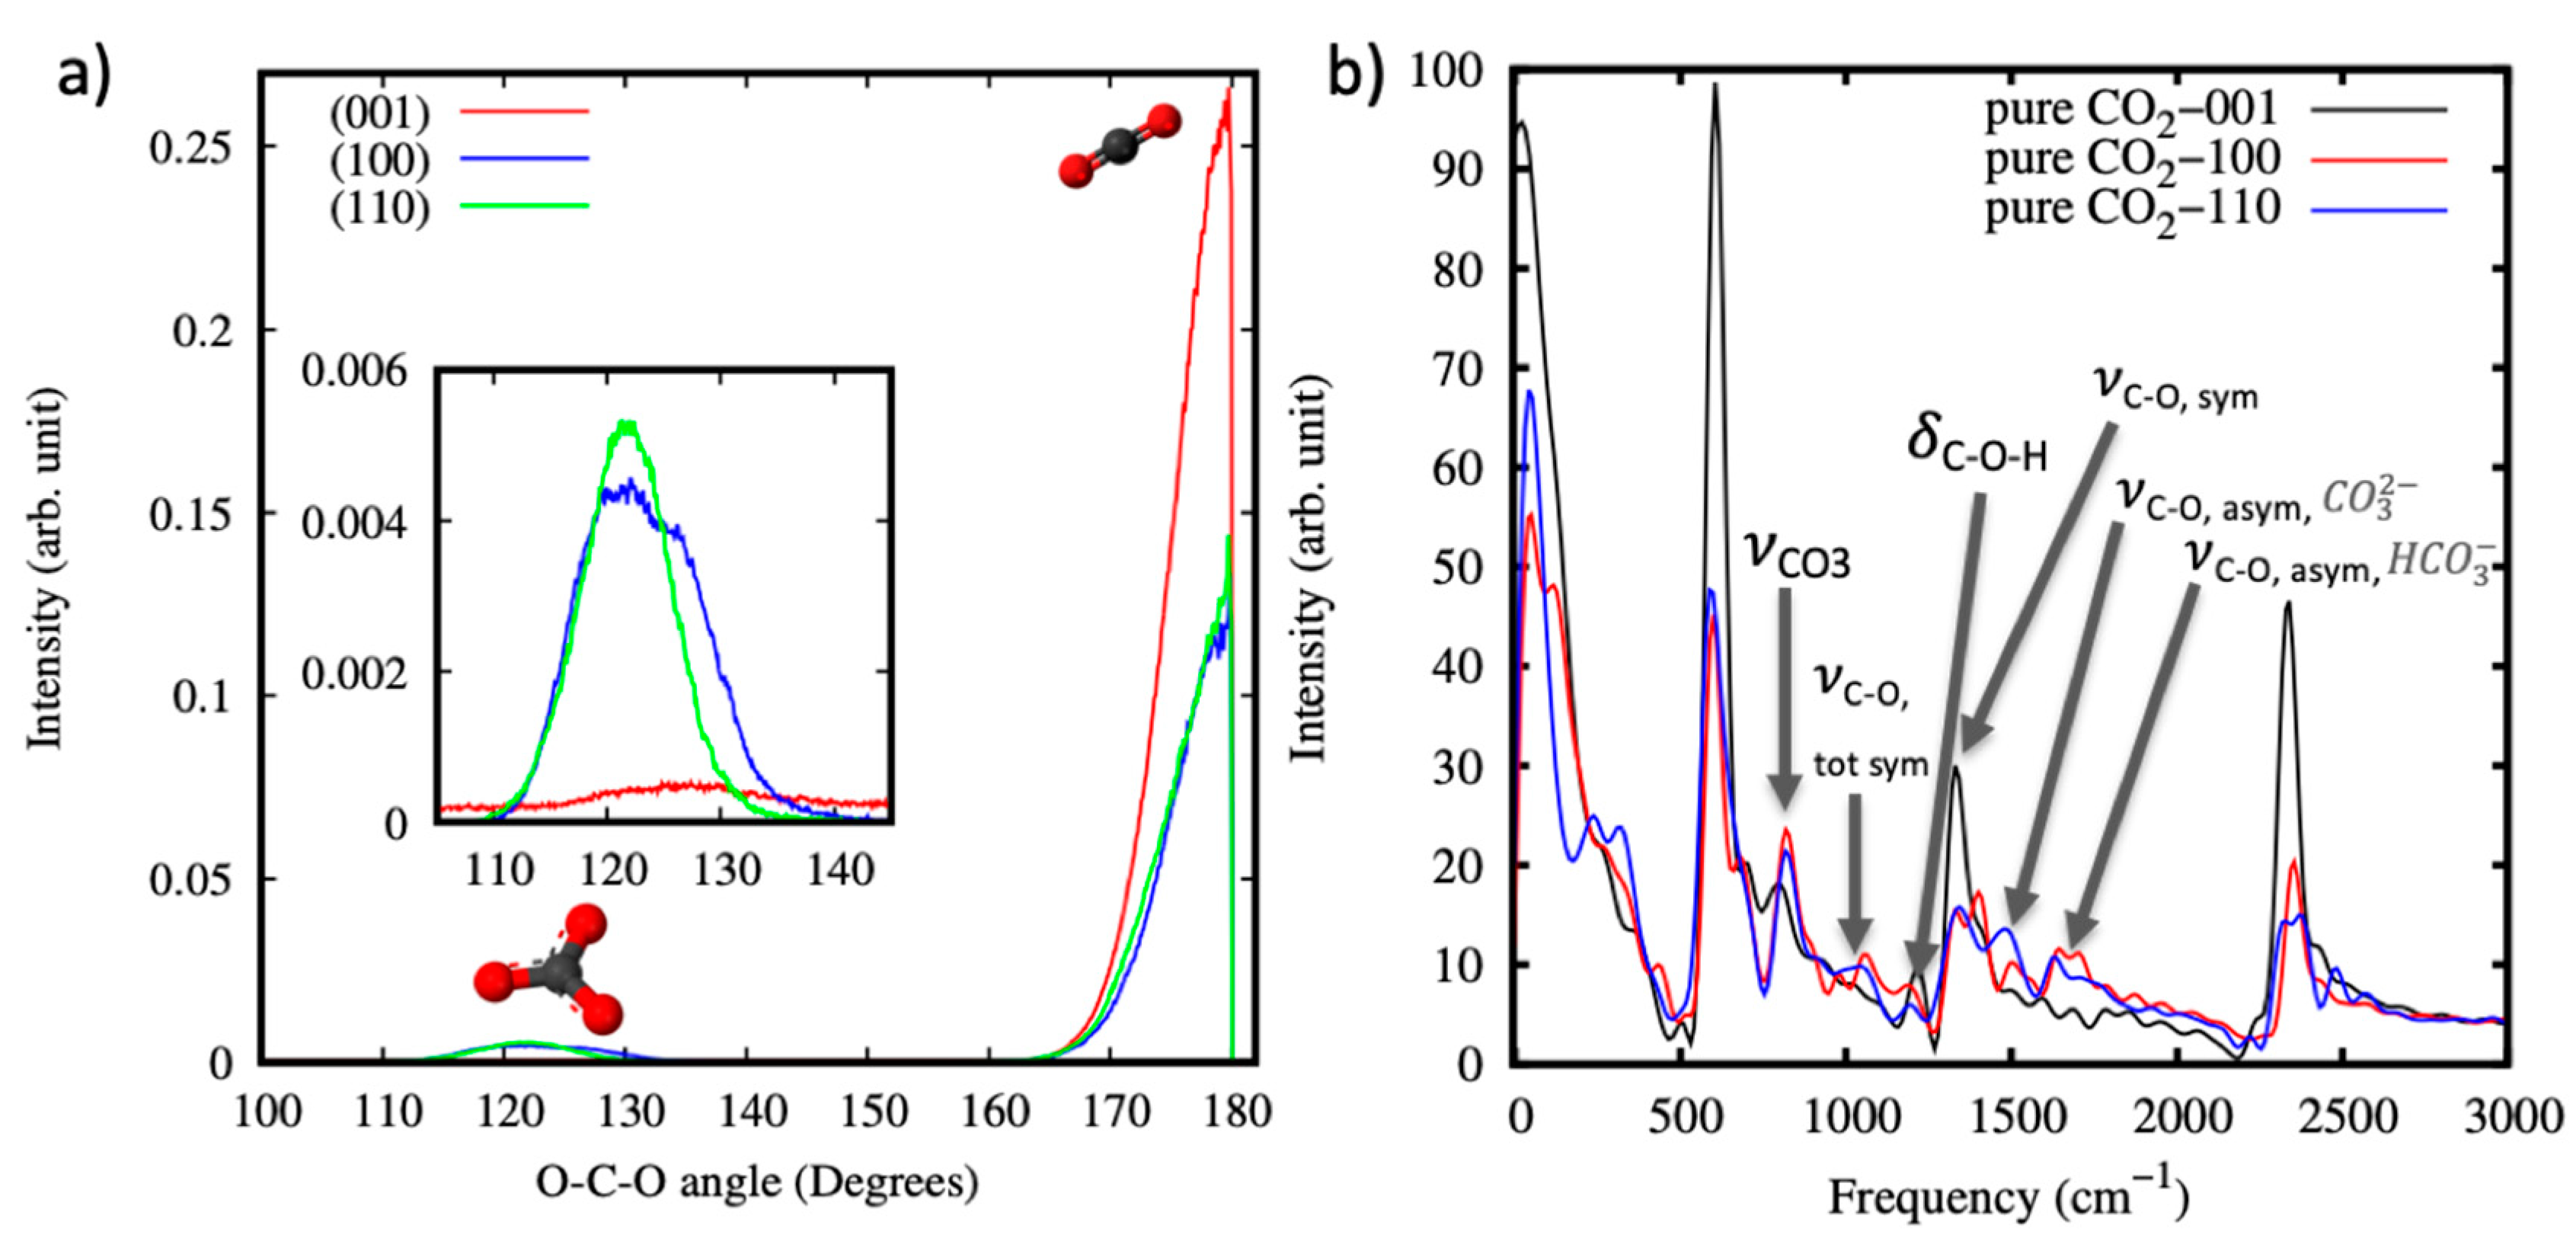
To further analyze the reaction products from the carbonation reactions, the probability distribution of the angle O-C-O was plotted, as shown in Figure 3a. For all the surfaces, most of the CO2 molecules remain unreacted as demonstrated by the high peaks at ~180°. The reacted (bi)carbonate ions produced on carbonation present a peak at ~120°. Additionally, vibrational modes of the formed (bi)carbonate ions were calculated from the power spectra, obtained by Fourier transformation of the velocity-velocity auto correlation function of the CO2 molecules. The vibrational modes of interest here are the modes associated with the carbonate or bicarbonate ions and are highlighted with arrows in Figure 3b. In the region between 800 and 900 cm−1, carbonates exhibit out-of-plane and in-plane bending absorptions () [83,84]. These bending modes are present in all the three systems at 802 cm−1, 818 cm−1 and 823 cm−1 for the (001), (100) and (110) surfaces, respectively. The weaker bands referred to as the totally symmetric stretching frequency, (, tot sym) are IR active only when the D3h symmetry of the carbonate anion is broken, and it is hydrogen bonded or directly coordinated to the surface or to protons [84]. In our calculations, the symmetry of the formed carbonate anions is expected to degrade from D3h to C1 asymmetries in the local hydrogen bonding environment, and this is demonstrated by the occurrence of the tot sym bands at 1047 cm−1 and 1052 cm−1 for the (100) and (110) surfaces, respectively.
The C–O–H bending vibration (), symmetric C-O stretch () and asymmetric C–O stretch () bands experimentally assigned to the formation of a bicarbonate ion on hydroxylated surfaces at 1220, 1410, and 1622 cm−1 [85,86], respectively, are exhibited at 1218, 1413, and 1640 cm−1 for the (001) surfaces. The calculated frequencies agree with the experimental values within 20 cm−1. For the (100) and (110) surfaces, the vibrational mode is shifted to ~1195 cm−1—an indication that the adsorbed bicarbonate ions form a bridged structure on the surface [85]. The bridged structure has previously been proposed to best represent the bonding mode of bicarbonate anion adsorbed on aluminum oxide and iron oxide surfaces, and other hydroxylated metal oxides that have similar vibrational spectra [85]. The presence of distinct and vibrational bands associated with the carbonate anion is an indication that the D3h symmetry of the anion is broken by coordination to cations [84]. For the (100) and (110) surfaces, the band is situated at ~1332 and 1342 cm−1 and the band at ~1480 and 1500 cm−1. This implies that the formed carbonate anions are strongly bound to the portlandite surfaces through interaction with the surface calcium cations.
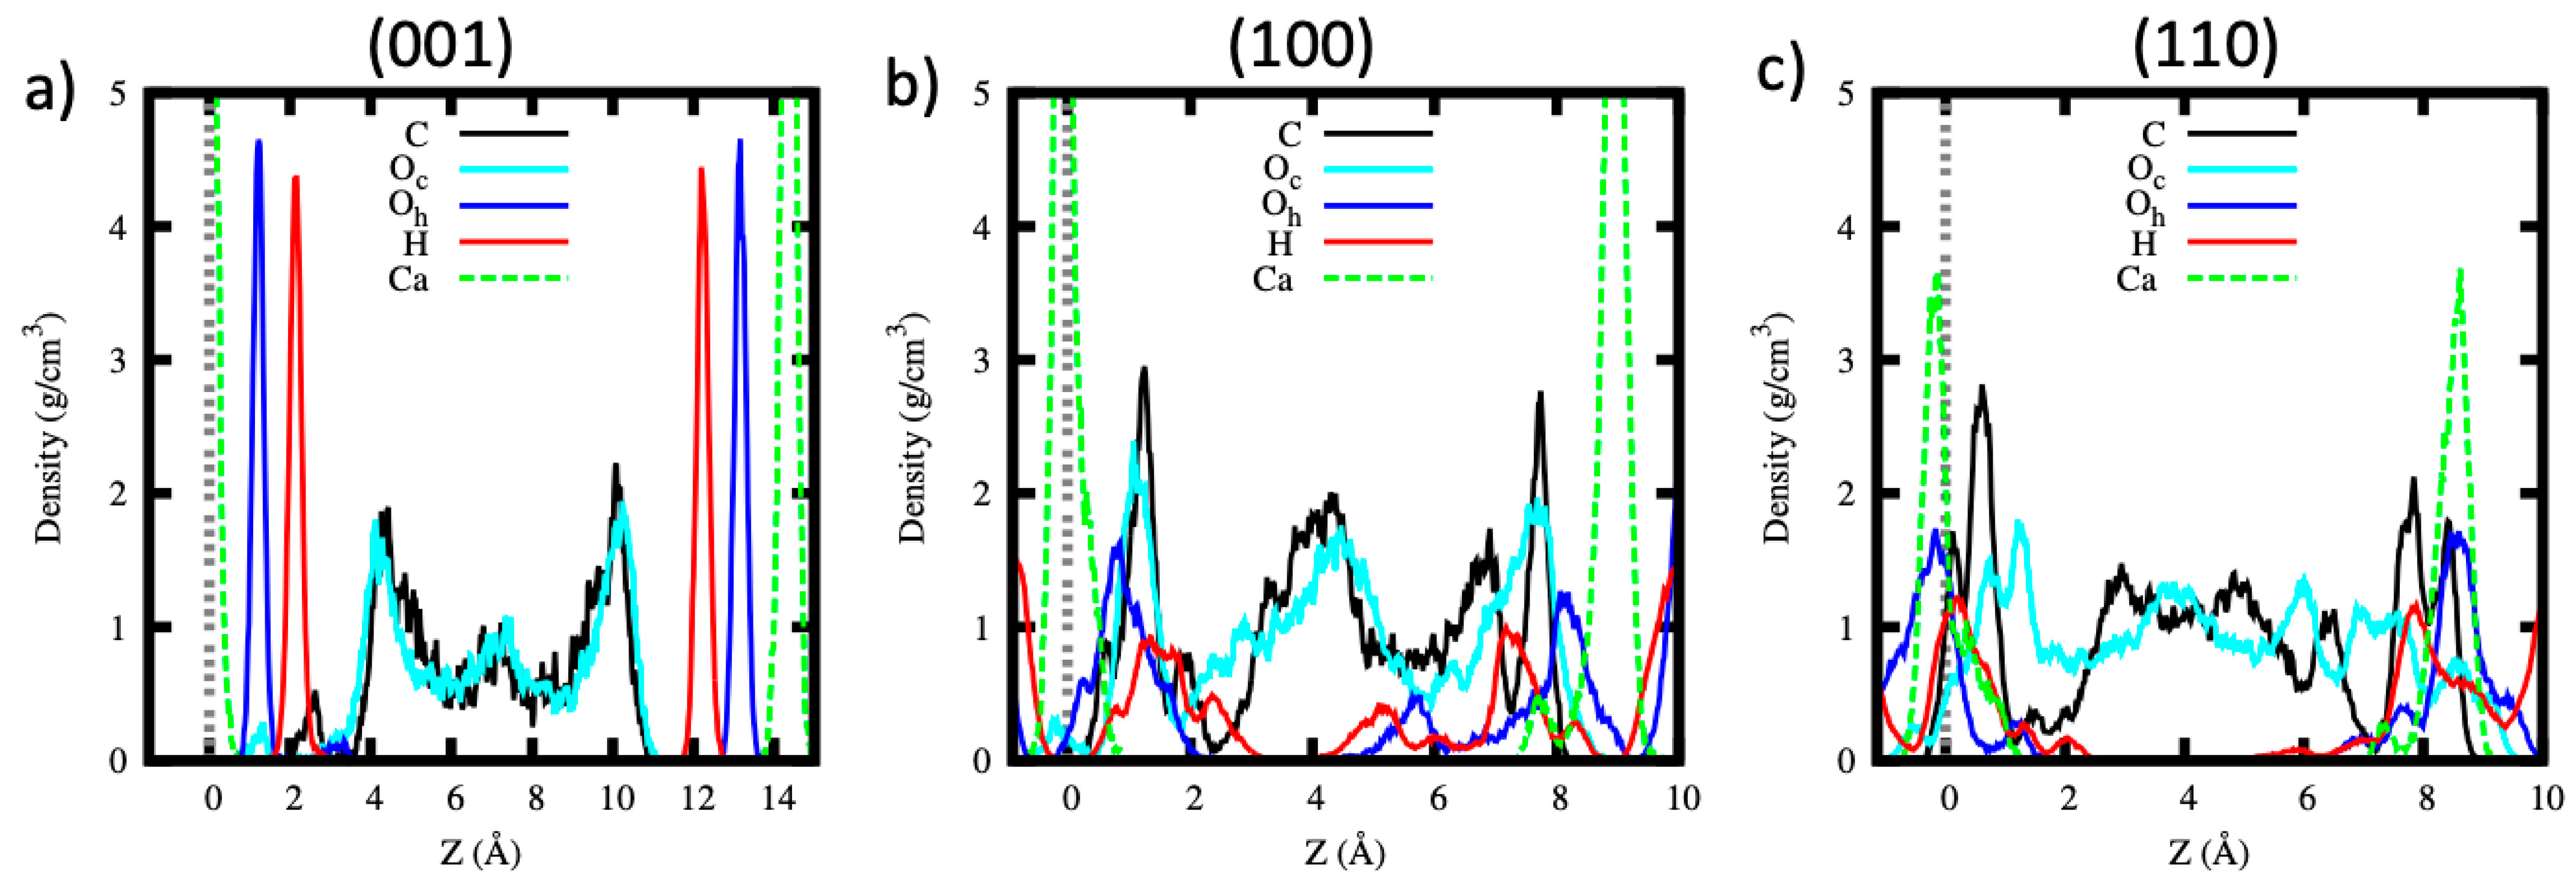
The atomic density profiles of the CO2 carbon (C), CO2 oxygen (Oc), hydroxyl oxygen (Oh), hydroxyl hydrogen (H) and calcium (Ca) atoms along the z direction are shown in Figure 4 for the (001), (100) and (110) pores. For the (001) pore, both the oxygen and hydrogen atoms of the surface hydroxyls show sharp peaks (Figure 4a), implying that they mostly remain undistorted on interaction with pure scCO2 and their density profile corresponds to their crystallographic positions. Similarly, the CO2 molecules are highly ordered as indicated by the formation of one distinct peak near the surface and a small peak in the middle of the pore. The first CO2 molecule peak is located at ~4 Å from the surface (the surface is defined by the average position of the surface calcium atoms) and both C and Oc atomic density peaks are coinciding, which suggests that the CO2 molecules are lying almost parallel to the surface. The small peaks of the C and Oc atoms, whose positions coincide with the hydroxyl groups, represent the reacted bicarbonate ion.
On the other hand, for the (100) and (110) pores, the atomic density profile of the hydroxyl groups forms peaks (see Figure 4b,c) that are less sharp in comparison to the (001) case. This feature highlights a distorted local structure, in contrast to the sharply defined maxima of the density profiles characteristic of the crystal atoms, shown here for the (001) surface. The C and Oc peaks strongly overlap with the surface Oh and H atom peaks. We attribute the C and Oc peaks on the surface region to the reacted (bi)carbonate ions while the peaks beyond ~2 Å from the surface to the unreacted CO2 molecules. Based on the density profiles, we deduce that the (bi)carbonate ions formed by the carbonation reaction do not diffuse away from the surface. Furthermore, no dissolution of the calcium atoms is observed during our simulations. The slight distortion of the calcium atoms positions in the (100) and (110) surfaces is attributed to their rearrangement due to the saturation of the (bi)carbonate ions on these surfaces.
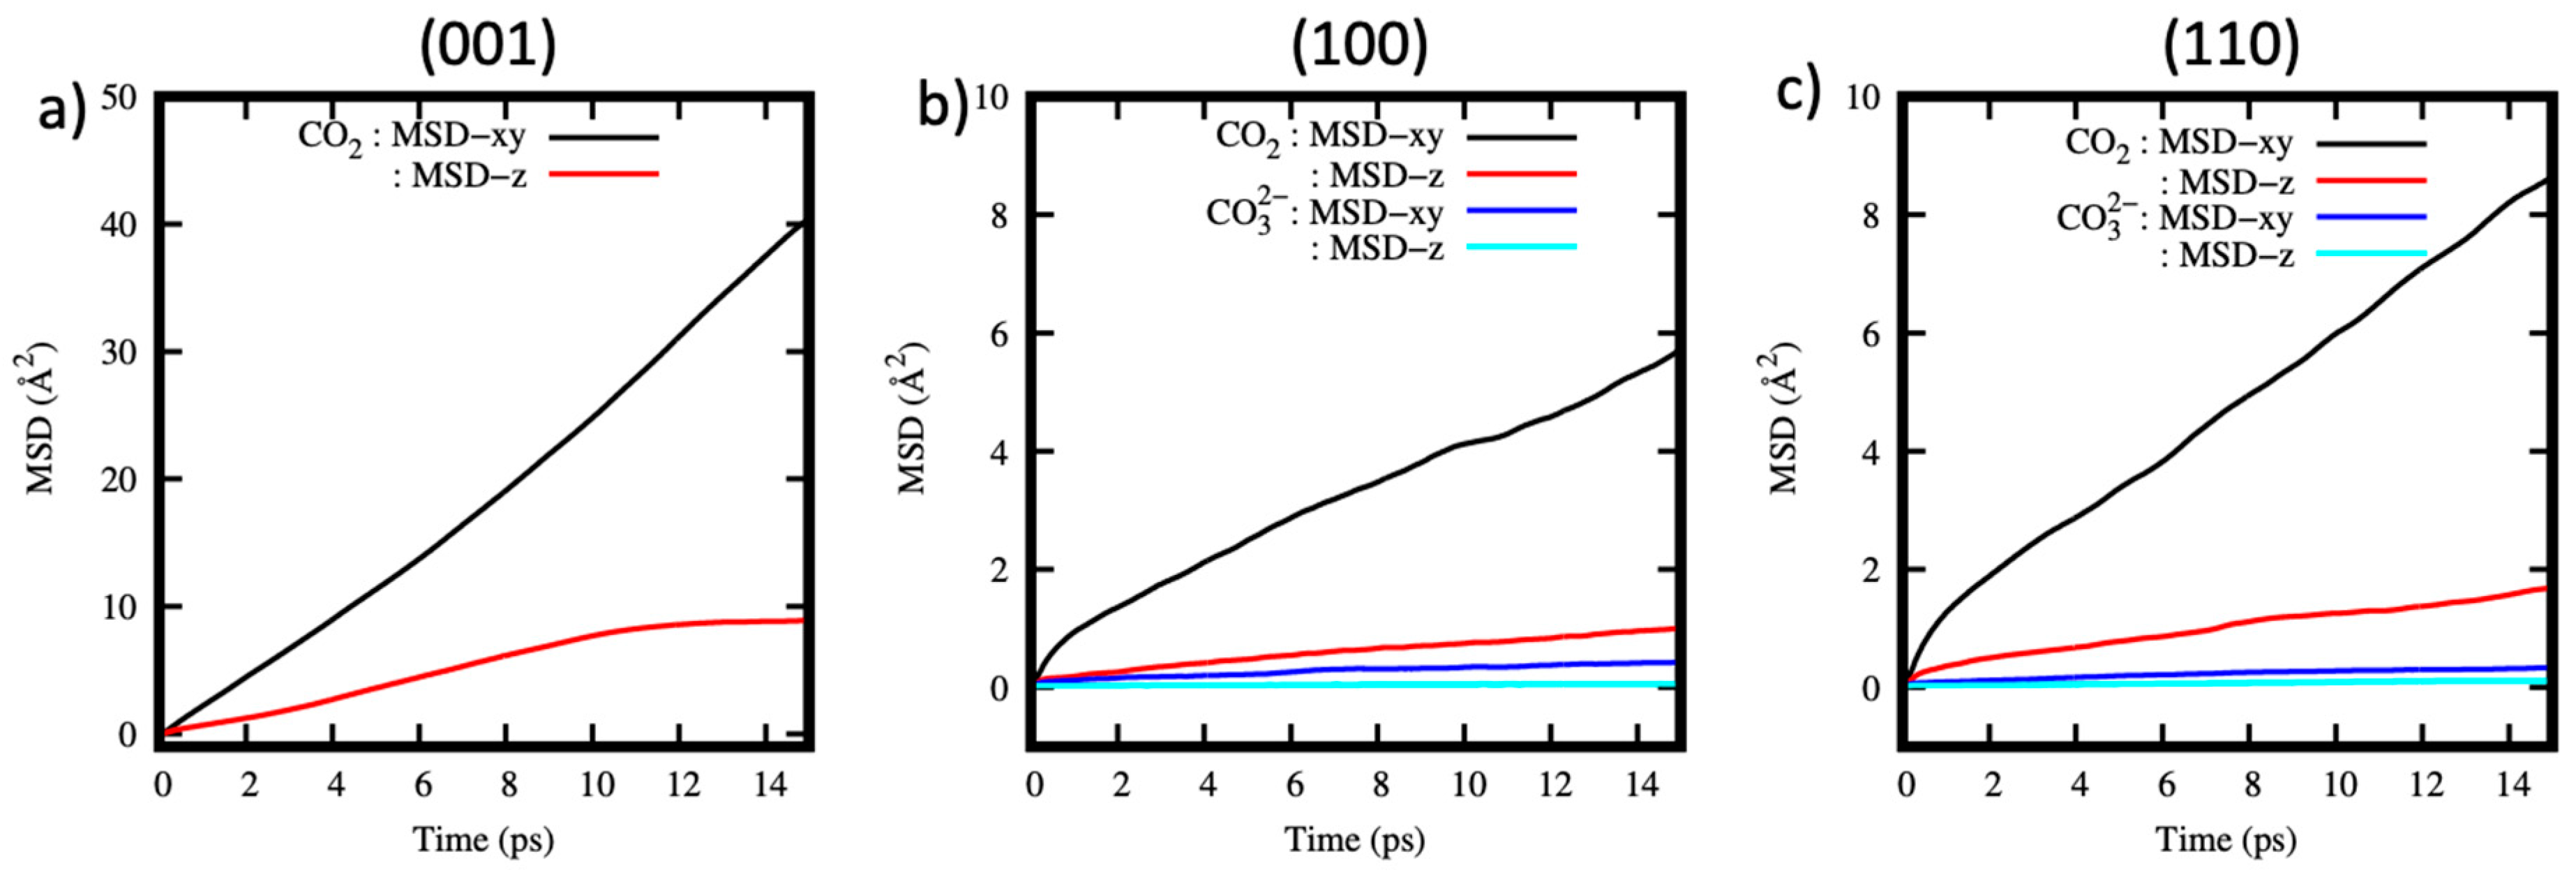
The diffusivity of CO2 molecules and anions formed after the carbonation reaction is analyzed by plotting the mean square displacement (MSD) as a function of time for all simulated systems (Figure 5a–c). The results show that the CO2 molecules diffuse mainly within the xy plane as indicated by the linear relationship between the MSD and time. The slow diffusivity along the z direction is a typical feature of fluids in nanoconfinement [87,88,89,90,91,92].
Of the three systems considered, CO2 diffusion within the (001) pore is faster in comparison to the (100) and (110) pores. This behavior could be explained by the weak interactions of CO2 molecules with the (001) surface, as well as their location ~4 Å away from the surface, as shown in the density profiles, Figure 4a. The implication of this finding to fluid transport of CO2-rich fluids within cement is that CO2 will diffuse faster within the pores of this nature, without necessarily readily reacting. The MSD of the ions within the (100) and (110) systems shown in Figure 5b,c is flat both in xy and z directions. This indicates that the diffusion of the ions is very slow, and it can be concluded that these ions are static, at least within the time scales of our simulations.
3.2. The Reactivity of H2O/CO2 Mixture with Portlandite Surfaces
3.2.1. Density Profiles and H2O Molecular Orientation
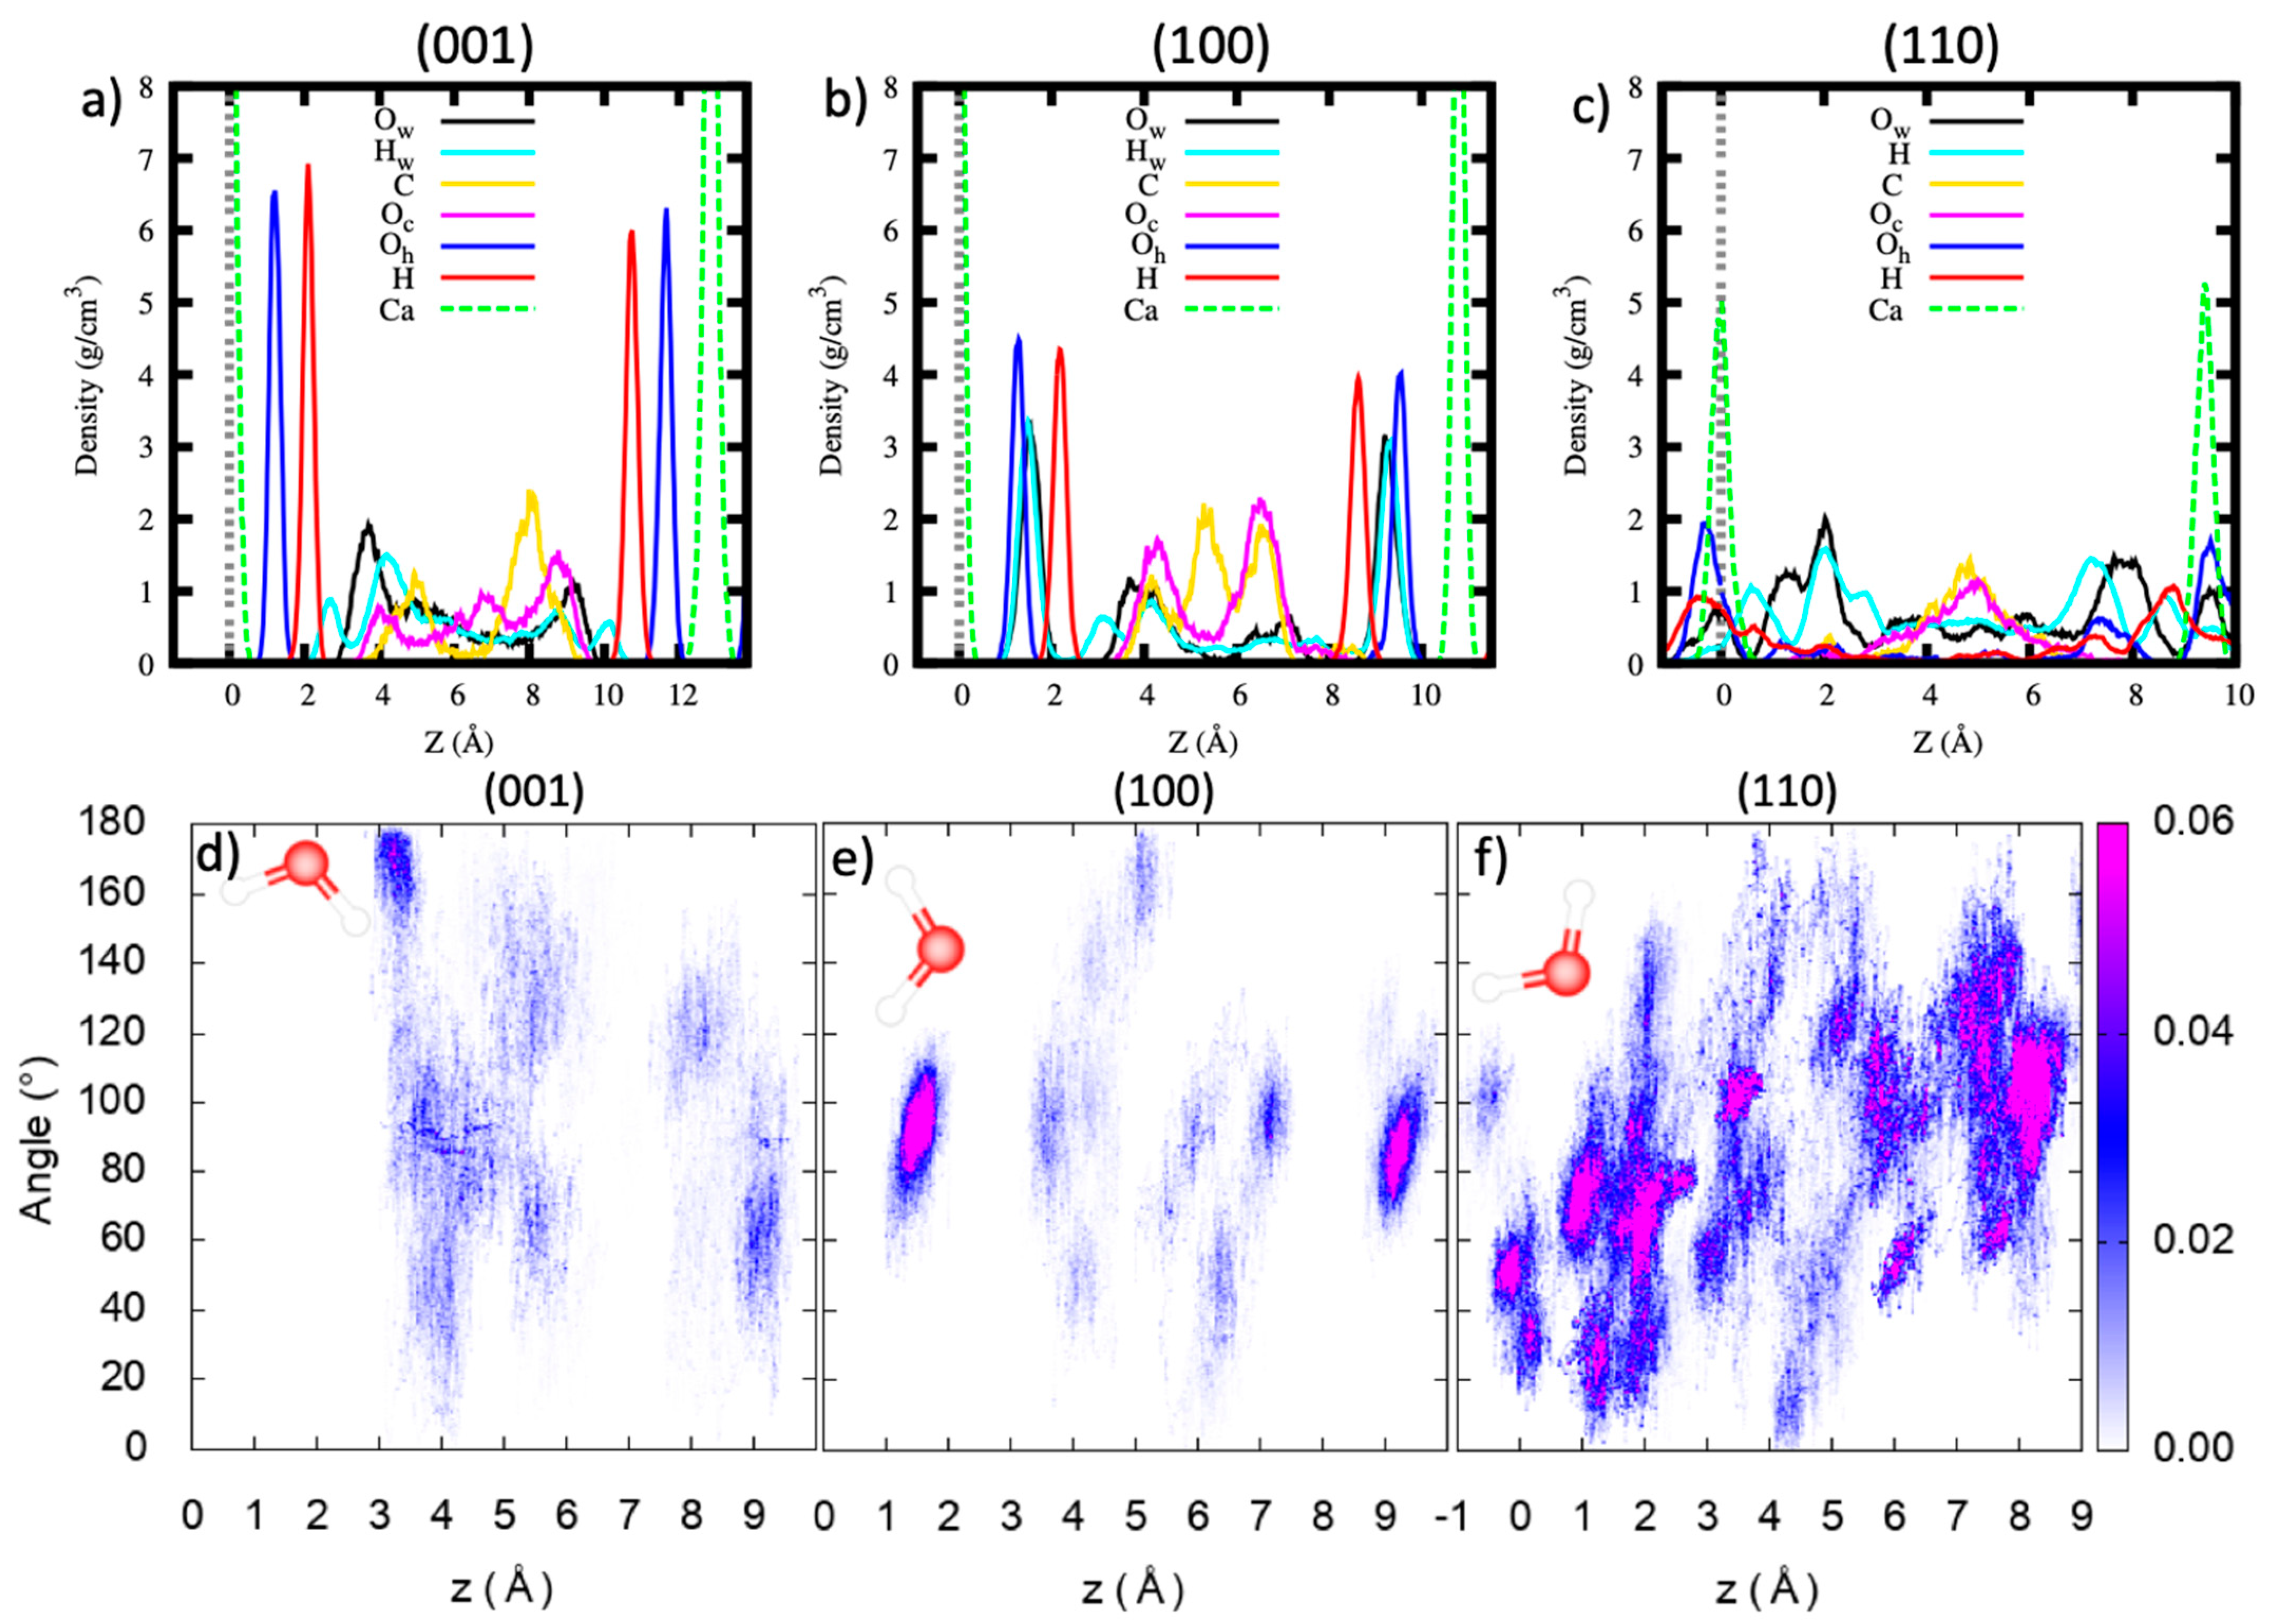
The inclusion of water within the pores modifies the interaction of CO2 molecules with portlandite surfaces, as shown by the density profile plots (Figure 6a–c). For the (001) surface, the density profile of the water oxygen (Ow) and hydrogen (Hw) atoms show the first peak at 3.76 Å and 2.68 Å from the surface, respectively. The orientation of the dipole vector of H2O molecules in the first layer is ~170° with respect to the surface normal (Figure 6d). Given their location and orientation, it implies that the water molecules in the first layer interact directly with the (001) surface by donating a hydrogen bond to the oxygen atoms of the portlandite surface, in agreement with previous atomistic simulations of portlandite/water interface [62,93]. CO2 molecules occupy the central region of the pore at ~5 Å from the surface (Figure 6a), hence, they do not alter the local coordination environment of H2O molecules at the portlandite (001) surface. The small peaks displayed by the C atoms density profile indicate that the CO2 molecules have a well-defined ordering on the H2O/CO2 interface. There is only a negligible distortion of the surface hydroxyl groups and calcium atoms as demonstrated by the highly ordered sharp peaks of Oh, H, and Ca atomic density profiles.
For the (100) surface, the Ow and Hw atomic density profiles of the H2O molecules show sharp peaks located between the surface oxygen and hydrogen atoms (Figure 6b). These water molecules occupy the surface sites created by the missing hydroxyl groups due to the five-fold coordination of the calcium atoms on the (100) surface. As shown in Figure 6e, the corresponding H2O molecules lie flat, parallel to the surface, their dipole vectors forming ~90° with the surface normal. Since these water molecules occupy surface sites and thus physically bound to the surface, they are not expected to hinder the interaction of the CO2 molecules with the (100) surface. The second peak of the water oxygen atoms is located at ~4 Å, coinciding with that of the C and Oc atoms. Therefore, there is no formation of a well-defined water layer between the (100) surface and the CO2 molecules. Consequently, this could imply a more facile reactivity of CO2 with the (100) portlandite surface. The CO2 molecules occupy the central region of the pore and, similar to the (001) pore, their density profile shows peaks suggesting a definite ordering. The surface atom density profiles (Oh, H, and Ca) exhibit well-ordered sharp peaks (Figure 6b) and it is concluded that the H2O/CO2 mixture within the (100) pore does not significantly affect the surface structure.
In contrast, the density profile calculated for the (110) pore demonstrates a highly distorted surface, indicated by the surface hydroxyl group density profile (Figure 6c). Some of the hydroxyl groups show peaks in the middle of the pore. The migration of the surface hydrogen atoms up to the center of the pores is understood to follow a Grotthuss-type mechanism, through proton transfers mediated by the H2O molecules. Water molecules form two distinct peaks at z = 0 Å and z = 2.05 Å with a shoulder at z = 1.32 Å. We interpret the water Ow atom peak at z = 0 Å and the shoulder at z = 1.32 Å to be formed by H2O molecules coordinating directly with the undercoordinated surface calcium atoms. The orientation of the H2O dipole vector with respect to the surface normal of the water molecules contributing to the first peak is ~50°, while for the shoulder and the second peak it is ~70° (Figure 6f). In the middle of the pore, the density profile of the H2O molecules displays a uniform distribution, although it is somewhat less than the bulk water density of ~1 g/cm3. The CO2 molecules form a peak at the central region of the pore and, similar to the (001) and (100) pores, no dissolution of the calcium atoms is observed.
3.2.2. Free-Energy Calculations
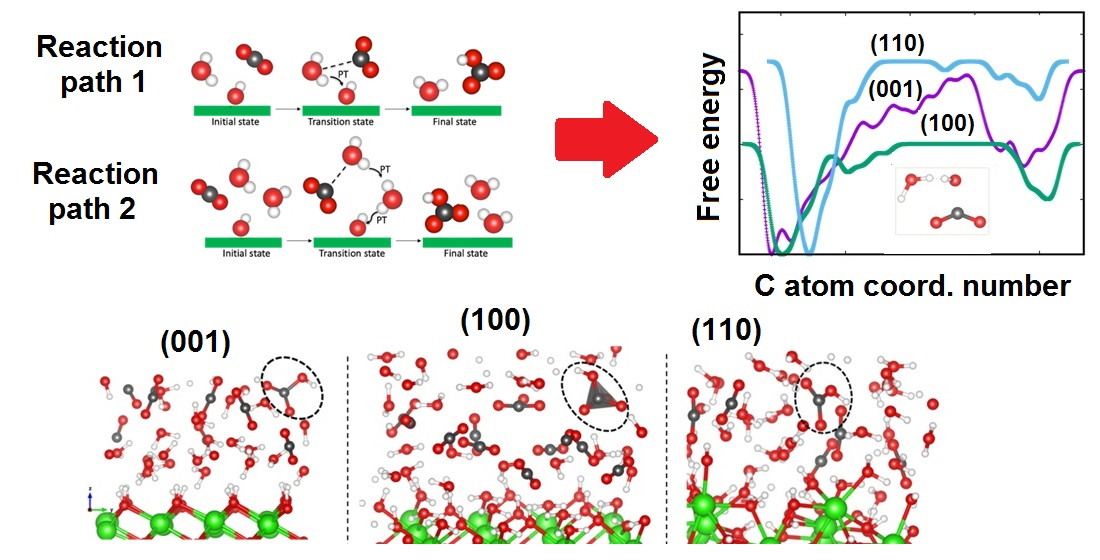
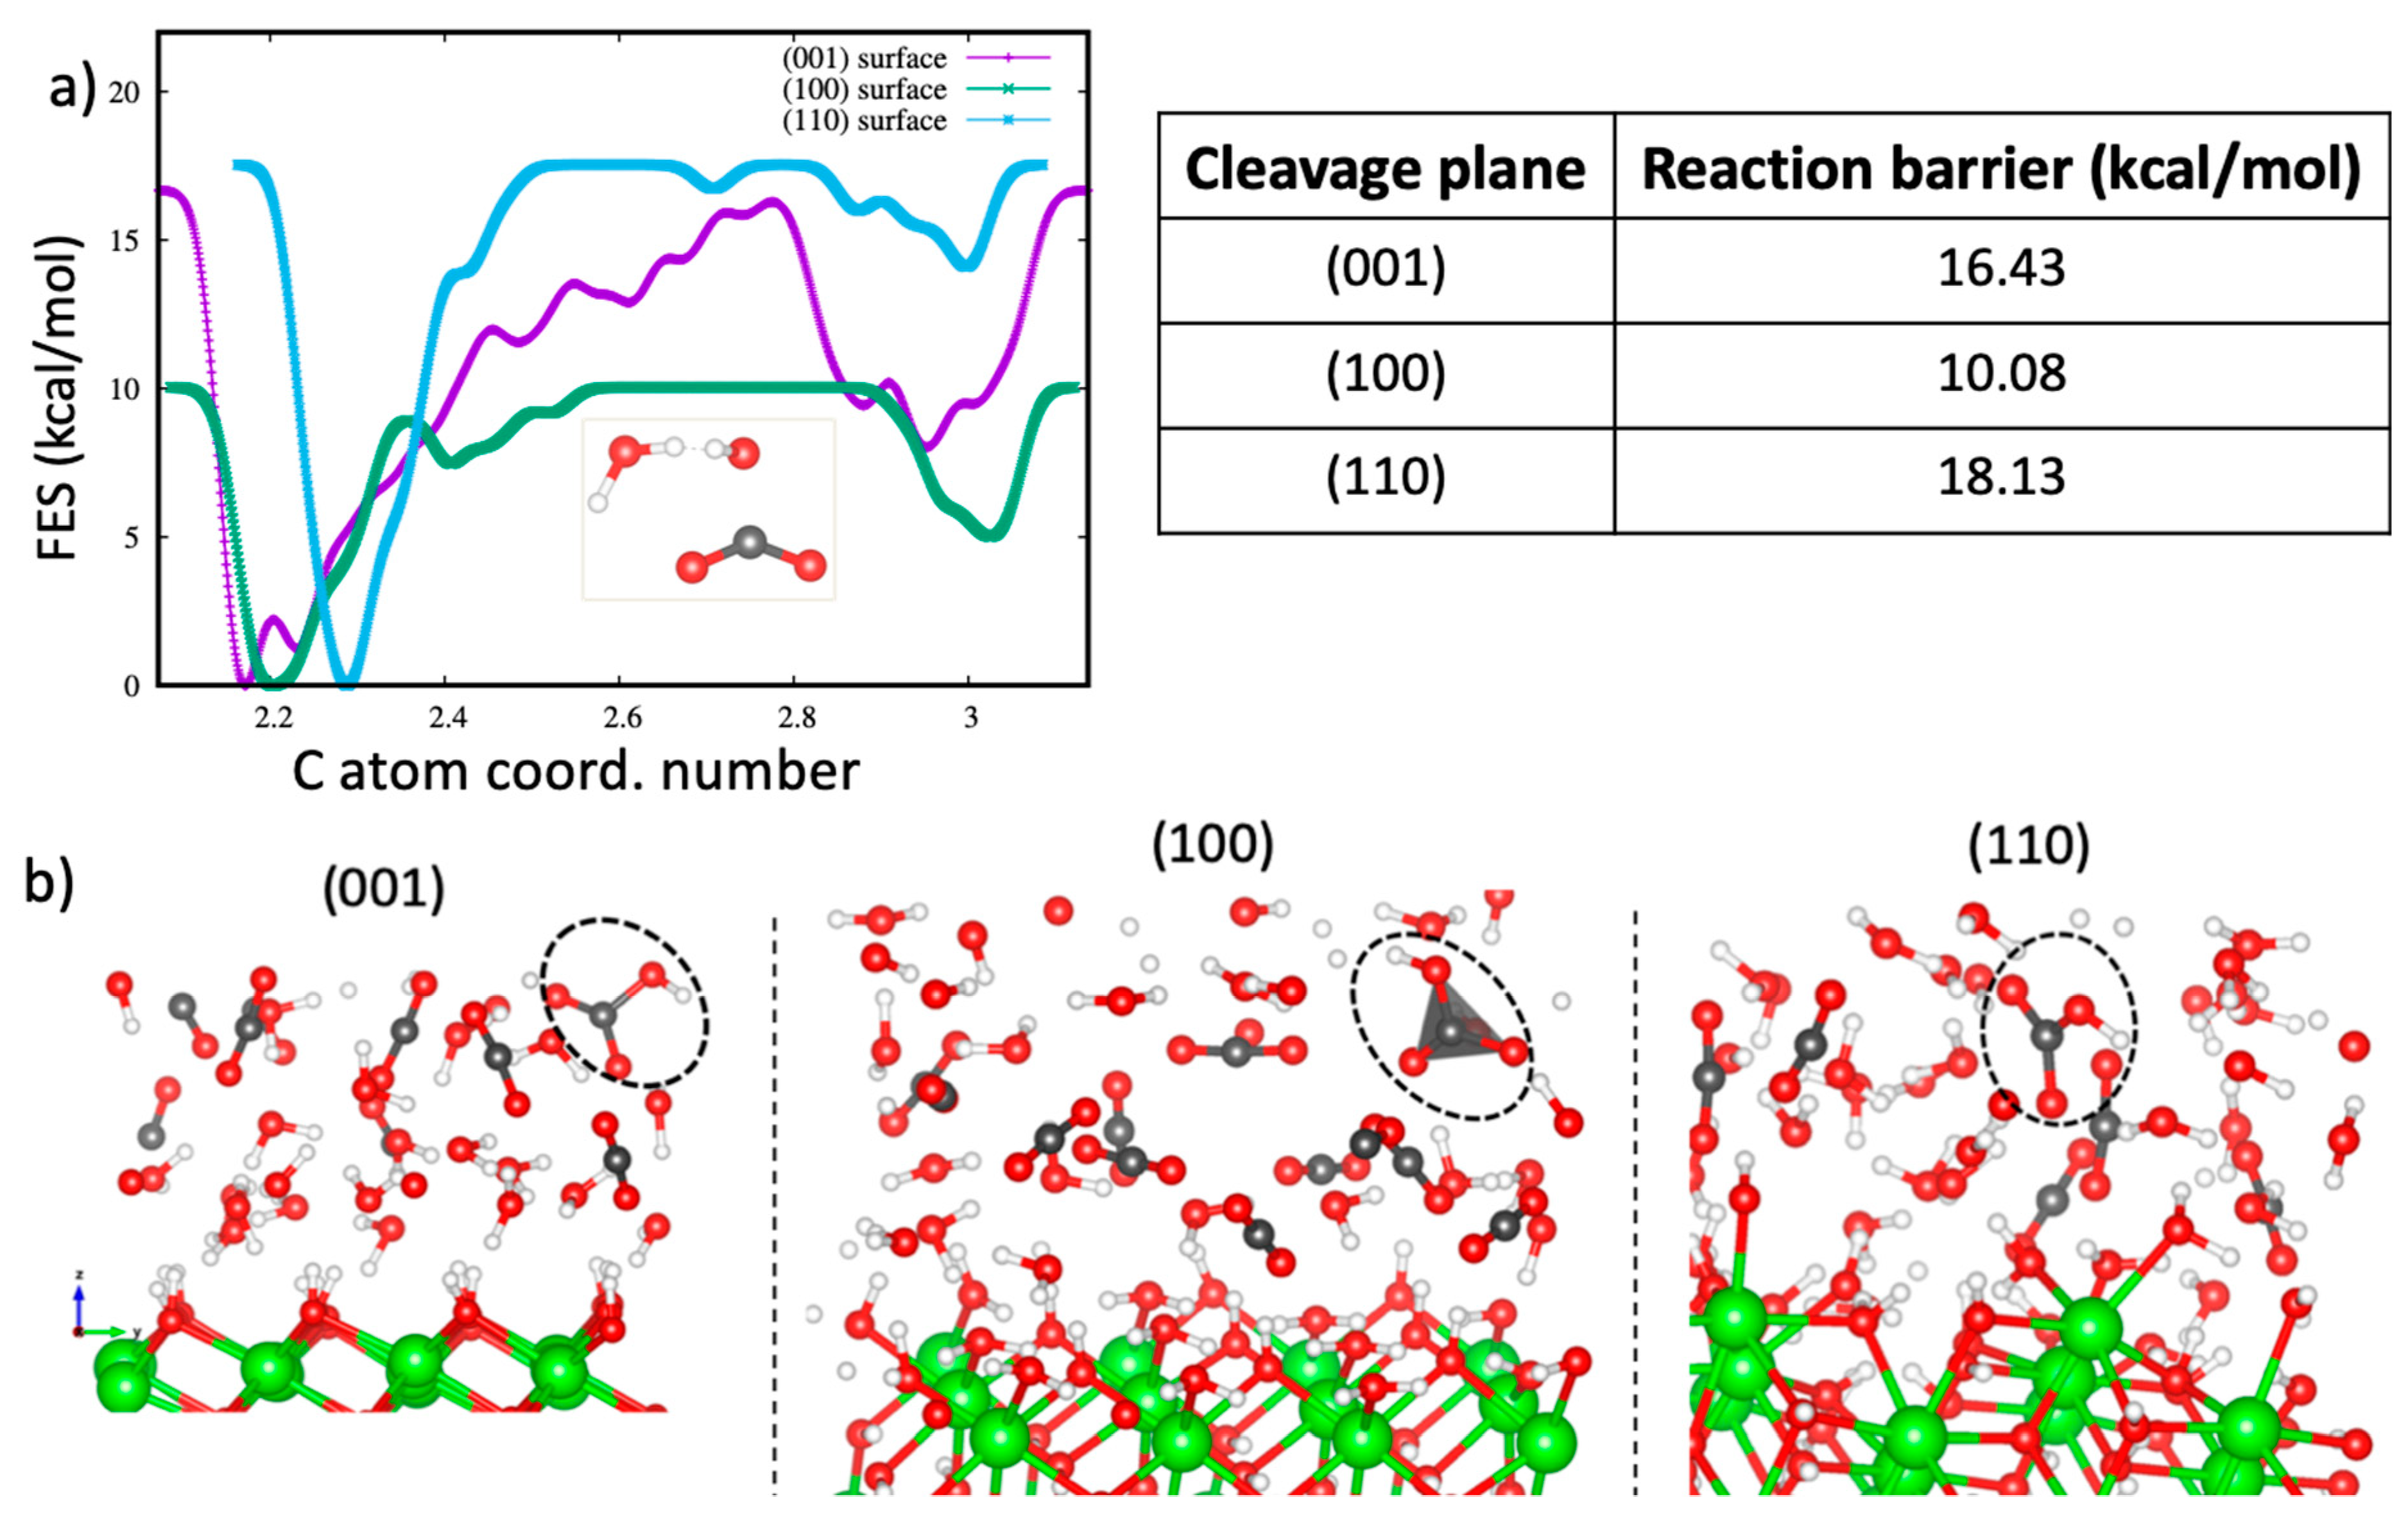
To quantify the reactivity of CO2 with the portlandite surfaces in the presence of water, metadynamics calculations were performed for all interfaces considered so far. Unlike the case of pure scCO2 discussed in Section 3.1, we did not observe any barrierless reaction of CO2 with the portlandite surfaces since the H2O molecules hydrate the surfaces and hinder direct interaction of CO2 molecules with the surfaces. Figure 7a shows the evolution of the free energy as function of the carbon atom coordination number to the oxygen atoms. This collective variable takes into account the oxygen atoms of both H2O molecules and surface hydroxyl groups. The calculated free energies of reaction are 16.43 kcal/mol, 10.08 kcal/mol, and 18.13 kcal/mol for the (001), (100) and (110) surfaces, respectively. The carbonation reaction product in all cases is a bicarbonate ion, illustrated in the snapshots in Figure 7b.
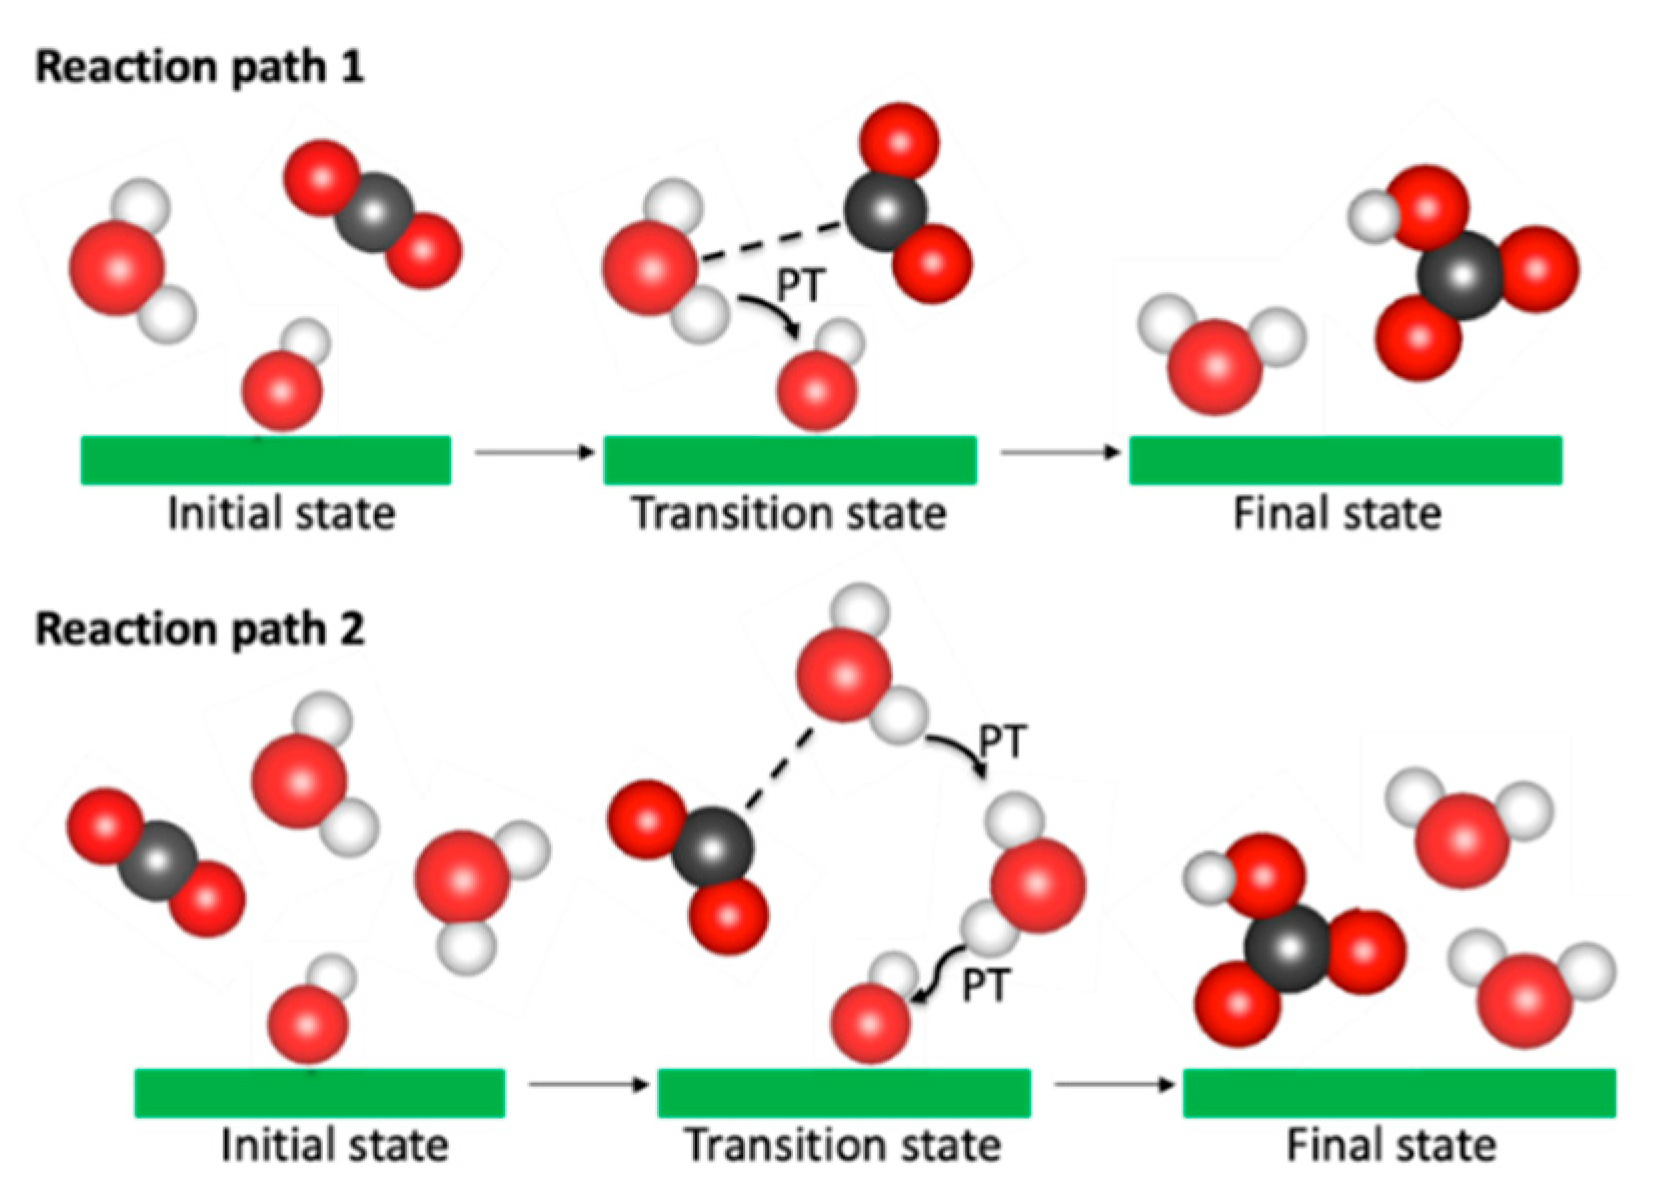
The values obtained by our approach are in good agreement with the reaction energy barriers predicted for the formation of bicarbonate complexes [80,81,82] and carbonic acid [82,94,95,96,97]. The free-energy barrier of 18.13 kcal/mol for the reaction on the (110) surface is the highest for the surfaces investigated here. The carbonation reaction on the (110) surface is preceded by many proton transfers among the water molecules and the surface hydroxyl groups. This is demonstrated by the migration of hydroxyl groups up to the middle of the pores shown by the density profile plots reported in the Section 3.2.1. It directly involves concerted interaction of two H2O molecules, a hydroxyl group and a CO2 molecule (illustrated as the reaction path 2 in Figure 8). The reaction barrier is in good agreement with the 17.4 kcal/mol [95] and 19.3 kcal/mol [82] values estimated for the formation of carbonic acid under similar conditions. For both the (001) and (100) surfaces, the carbonation reaction involved one H2O molecule, a surface OH group and a CO2 molecule (see the reaction path 1 in Figure 8). The H2O molecule donates a proton to the surface hydroxyl group and the resultant hydroxyl ion in turn interacts with a CO2 molecule to form a bicarbonate ion. The carbonation reaction barrier within the (100) surface is, however, noticeably lower and is within the range of values obtained for the reaction of CO2 with the (001) surface in the absence of water, as discussed in Section 3.1.
We relate the variation of the free-energy barriers in the formation of the bicarbonate complex to the interfacial structure of water [98,99] which is, in turn, dictated by the surface chemistry and the degree of nanoconfinement [87,88]. A threshold H2O film thickness is required for carbonate precipitation, and it has been recently shown [100] that carbonate precipitation becomes predominant at about 1.5 monolayers of water, below which the reaction products are limited to (bi)carbonate surface complexes. The arrangement of the water molecules in the vicinity of the three surfaces is distinct (see the density profiles and H2O orientation plots in Figure 6), and this explains the variation in the carbonation reaction mechanisms. Notably, within the (001) and (110) pores, H2O molecules form a distinct layer between the CO2 molecules and the surfaces in contrast to the (100) pore where most of the water molecules occupy surface sites created by the missing hydroxyl groups due to the five-fold coordination of the surface Ca atoms, with only a small percentage occupying the rest of the pore space (see the density profiles and H2O orientation plots, Figure 4b,e). Thus, there is no formation of a water layer between the CO2 and the (100) surface. Moreover, the adsorbed H2O molecules are strongly surface-associated and are not sufficiently free to reorient and to participate in the hydration of CO2 [98]. The low reaction barrier for the carbonation reaction on the (100) surface is hence associated with the chemisorbed H2O molecules and the absence of a full water layer between the CO2 and the surface.
3.2.3. Analysis of the Dynamical Properties
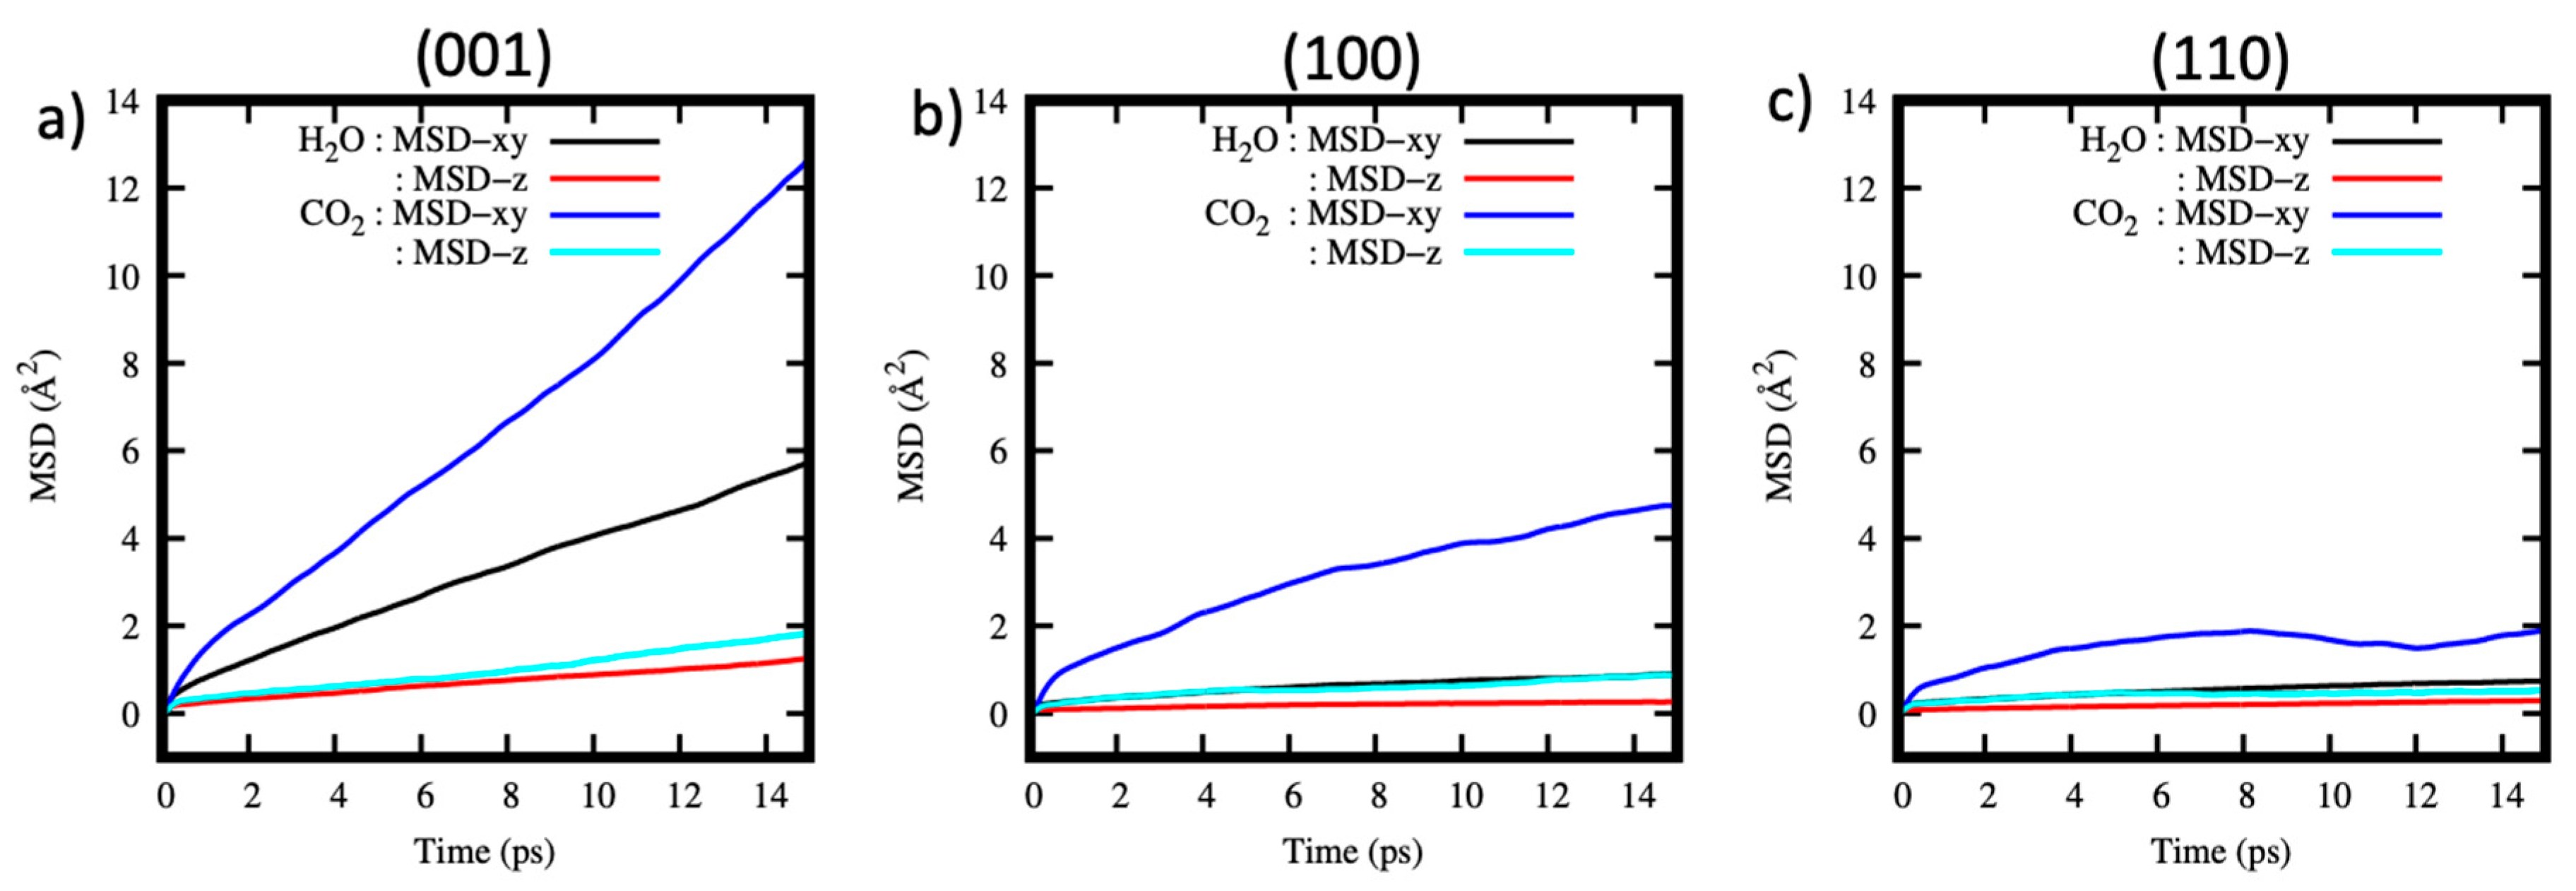
Analysis of the diffusional properties of H2O and CO2 molecules was performed by plotting their MSD as a function of time (Figure 9a–c). CO2 molecules diffuse faster than H2O molecules, noticeably within the xy plane. In addition to the small size of the pores, the presence of H2O molecules within the pores is shown to further attenuate the CO2 molecule diffusion in comparison to the pure scCO2 systems discussed in Section 3.1.1. By contact with CO2-rich fluids [101], the CO2 diffusivity plays here a key role in controlling the degree of cement reactivity, and these results indicate that the extent of CO2 molecular transport within cement is limited for fully water-filled pores like the inter/intralayer and small gel pores of the C-S-H phase.
The diffusion of H2O molecules is slow in general (Figure 9a–c), which we relate to their strong interaction with the portlandite surfaces. Due to their location within the pores, water molecules interact directly with the portlandite surfaces (Figure 6 and Figure S3 in the Supporting Information). The parallel diffusion of H2O molecules within the (001) pore is, however, relatively fast in comparison to the (100) and (110) pores, and this can be associated with the relatively weak water-surface interactions [62]. The negligible parallel diffusion of H2O molecules within the (100) and the (110) pores (Figure 9b,c) is attributed to the strong interaction of the water molecules with those surfaces since some of the H2O molecules occupy surface sites. The diffusion in the z direction is negligible in all cases for both H2O and CO2 molecules, ascribed to nanoconfinement in the z direction.
4. Conclusions
In this work, we investigated the reaction mechanisms of dry scCO2 and H2O/CO2 mixtures with portlandite surfaces, relevant for understanding the interaction of CO2 with cement in subsurface operations. Our simulations demonstrate that dry scCO2 undergoes a rapid barrierless carbonation reaction with the edge surfaces of portlandite crystals. However, the carbonation reaction soon ceases due to the deposition of (bi)carbonate surface complexes which form a carbonate layer. We therefore propose the reaction of scCO2 with portlandite to be primarily interface-controlled, i.e., it depends on the exposed surface and then secondly to be diffusion-controlled in that the rate-limiting step is the formation of the surface carbonate barrier which controls the diffusion of CO2 through the layer. The implications of the formation of the carbonate passivating layer are manifold: while it has positive effects by blocking the cracks which could act as CO2 leakage pathways and attenuate cement degradation, it would have a detrimental effect in mineral carbonation CCS operations where CO2 is permanently stored through reaction with host rocks. It is important to emphasize that this conclusion is limited to the relatively small pore sizes studied in this work and we might expect that increasing the pore sizes could favor diffusion of the CO2/(bi)carbonate complexes thus enhancing the CO2 reactivity.
The presence of water alters the interaction of CO2 with portlandite surfaces. Our results show that H2O molecules coordinate directly to the portlandite surfaces forming well-structured water layers which CO2 molecules cannot easily penetrate. It is deduced that the rate-limiting step in the carbonation reaction of portlandite and the H2O/CO2 mixture is the structure and the water content within the portlandite pores. As such, CO2 reactivity for pores with highly structured water-surface layers (with no bulk-like water) is expected to be limited due to the attenuated inward diffusion of the CO2 molecules.
Dissolution of calcium atoms can enhance the carbonation reaction by facilitating their interaction with the dissolved (bi)carbonate/carbonic acid to form calcite in the presence of water [31]. Dissolution-precipitation carbonation reaction mechanism is expected to be dominant in the presence of water. However, no dissolution of calcium atoms was observed in our simulations. This is attributed to the small size of the atomistic models and short simulation times permitted by the AIMD approach. To overcome this drawback, future work should involve the use of a reactive molecular dynamics approach using an empirical reactive force field, such as ReaxFF [102], which would allow atomistically model relatively large systems over longer time scale. This approach, however, is more strongly dependent on the choice and accuracy of the force field.
Supplementary Materials
The following are available online at https://www.mdpi.com/article/10.3390/min11050509/s1, Figure S1: (a) The variation of the total energy with the plane-wave basis cutoff energy. (b) Energy change relative to the previous step. The value of 400 Ry is selected since there is negligible change in energy beyond this value; Figure S2: Variation of the Carbon atom coordination number (CV) with time for the metadynamics simulations of the portlandite/CO2/H2O systems; Figure S3: Snapshots of the (a) (001), (b) (100) and (c) (110) portlandite pore systems with the positions of water molecules interacting with the surfaces highlighted by the dashed circles.
Author Contributions
Conceptualization, methodology, validation, S.M.M. and A.G.K.; software, investigation, formal analysis, visualization, writing—original draft preparation, S.M.M.; resources, funding acquisition, project administration, supervision, writing—review and editing, A.G.K. All authors have read and agreed to the published version of the manuscript.
Funding
This work is a part of the Science for Clean Energy (S4CE) research consortium funded by European Union’s Horizon 2020 research and innovation program, under grant agreement No. 764810. A.G.K. also acknowledges financial support of the HSE University Basic Research Program and the industrial chair “Storage and Disposal of Radioactive Waste” at the Institut Mines-Télécom Atlantique.
Data Availability Statement
The data presented in this study are available within the article.
Acknowledgments
The generous allocation of supercomputing resources by CCIPL and CINES/GENCI (DARI projects A0060906921 and A0080906921) is also gratefully acknowledged.
Conflicts of Interest
The authors declare no conflict of interest.
References
- Bandilla, K.W. Carbon capture and storage. In Future Energy: Improved, Sustainable and Clean Options for Our Planet; Elsevier: Amsterdam, The Netherlands, 2020; pp. 669–692. ISBN 9780081028865. [Google Scholar]
- Gibbins, J.; Chalmers, H. Carbon capture and storage. Energy Policy 2008, 36, 4317–4322. [Google Scholar] [CrossRef] [Green Version]
- Bui, M.; Adjiman, C.S.; Bardow, A.; Anthony, E.J.; Boston, A.; Brown, S.; Fennell, P.S.; Fuss, S.; Galindo, A.; Hackett, L.A.; et al. Carbon capture and storage (CCS): The way forward. Energy Environ. Sci. 2018, 11, 1062–1176. [Google Scholar] [CrossRef] [Green Version]
- Leung, D.Y.C.; Caramanna, G.; Maroto-Valer, M.M. An overview of current status of carbon dioxide capture and storage technologies. Renew. Sustain. Energy Rev. 2014, 39, 426–443. [Google Scholar] [CrossRef] [Green Version]
- Matter, J.M.; Broecker, W.S.; Stute, M.; Gislason, S.R.; Oelkers, E.H.; Stefánsson, A.; Wolff-Boenisch, D.; Gunnlaugsson, E.; Axelsson, G.; Björnsson, G. Permanent carbon dioxide storage into basalt: The CarbFix pilot project, Iceland. Energy Procedia 2009, 1, 3641–3646. [Google Scholar] [CrossRef] [Green Version]
- Cao, P.; Karpyn, Z.T.; Li, L. Dynamic alterations in wellbore cement integrity due to geochemical reactions in CO2-rich environments. Water Resour. Res. 2013, 49, 4465–4475. [Google Scholar] [CrossRef]
- Carey, J.W. Geochemistry of wellbore integrity in CO2 sequestration: Portland cement-steel-brine-CO2 interactions. Rev. Miner. Geochem. 2013, 77, 505–539. [Google Scholar] [CrossRef]
- Jung, H.B.; Jansik, D.; Um, W. Imaging wellbore cement degradation by carbon dioxide under geologic sequestration conditions using X-ray computed microtomography. Environ. Sci. Technol. 2013, 47, 283–289. [Google Scholar] [CrossRef]
- Crow, W.; Carey, J.W.; Gasda, S.; Brian Williams, D.; Celia, M. Wellbore integrity analysis of a natural CO2 producer. Int. J. Greenh. Gas Control. 2010, 4, 186–197. [Google Scholar] [CrossRef]
- Newell, D.L.; Carey, J.W. Experimental evaluation of wellbore integrity along the cement rock boundary. Environ. Sci. Technol. 2013, 47, 276–282. [Google Scholar] [CrossRef]
- Carey, J.W.; Svec, R.; Grigg, R.; Zhang, J.; Crow, W. Experimental investigation of wellbore integrity and CO2-brine flow along the casing-cement microannulus. Int. J. Greenh. Gas Control. 2010, 4, 272–282. [Google Scholar] [CrossRef]
- Kiran, R.; Teodoriu, C.; Dadmohammadi, Y.; Nygaard, R.; Wood, D.; Mokhtari, M.; Salehi, S. Identification and evaluation of well integrity and causes of failure of well integrity barriers (A review). J. Nat. Gas Sci. Eng. 2017, 45, 511–526. [Google Scholar] [CrossRef]
- Xiao, T.; McPherson, B.; Bordelon, A.; Viswanathan, H.; Dai, Z.; Tian, H.; Esser, R.; Jia, W.; Carey, W. Quantification of CO2-cement-rock interactions at the well-caprock-reservoir interface and implications for geological CO2 storage. Int. J. Greenh. Gas Control. 2017, 63, 126–140. [Google Scholar] [CrossRef]
- Lorek, A.; Labus, M.; Bujok, P. Wellbore cement degradation in contact zone with formation rock. Environ. Earth Sci. 2016, 75, 499. [Google Scholar] [CrossRef] [Green Version]
- Gherardi, F.; Audigane, P.; Gaucher, E.C. Predicting long-term geochemical alteration of wellbore cement in a generic geological CO2 confinement site: Tackling a difficult reactive transport modeling challenge. J. Hydrol. 2012, 420, 340–359. [Google Scholar] [CrossRef] [Green Version]
- Omosebi, O.; Maheshwari, H.; Ahmed, R.; Shah, S.; Osisanya, S.; Hassani, S.; DeBruijn, G.; Cornell, W.; Simon, D. Degradation of well cement in HPHT acidic environment: Effects of CO2 concentration and pressure. Cem. Concr. Compos. 2016, 74, 54–70. [Google Scholar] [CrossRef]
- Taylor, H.F.W. Cement Chemistry; Thomas Telford: London, UK, 1997; Volume 2, ISBN 0 7277 2592 0. [Google Scholar]
- Jobard, E.; Sterpenich, J.; Pironon, J.; Corvisier, J.; Randi, A. Experimental modelling of the caprock/cement interface behaviour under CO2 storage conditions: Effect of water and supercritical CO2 from a cathodoluminescence study. Geosciences 2018, 8, 185. [Google Scholar] [CrossRef] [Green Version]
- Kutchko, B.G.; Strazisar, B.R.; Dzombak, D.A.; Lowry, G.V.; Thaulow, N. Degradation of well cement by CO2 under geologic sequestration conditions. Environ. Sci. Technol. 2007, 41, 4787–4792. [Google Scholar] [CrossRef]
- Kutchko, B.G.; Strazisar, B.R.; Lowry, G.V.; Dzombak, D.A.; Thaulow, N. Rate of CO2 attack on hydrated class H well cement under geologic sequestration conditions. Environ. Sci. Technol. 2008, 42, 6237–6242. [Google Scholar] [CrossRef]
- Kutchko, B.G.; Strazisar, B.R.; Huerta, N.; Lowry, G.V.; Dzombak, D.A.; Thaulow, N. CO2 reaction with hydrated class H well cement under geologic sequestration conditions: Effects of flyash admixtures. Environ. Sci. Technol. 2009, 43, 3947–3952. [Google Scholar] [CrossRef]
- Rimmelé, G.; Barlet-Gouédard, V.; Porcherie, O.; Goffé, B.; Brunet, F. Heterogeneous porosity distribution in Portland cement exposed to CO2-rich fluids. Cem. Concr. Res. 2008, 38, 1038–1048. [Google Scholar] [CrossRef]
- Carey, J.W.; Wigand, M.; Chipera, S.J.; WoldeGabriel, G.; Pawar, R.; Lichtner, P.C.; Wehner, S.C.; Raines, M.A.; Guthrie, G.D. Analysis and performance of oil well cement with 30 years of CO2 exposure from the SACROC Unit, West Texas, USA. Int. J. Greenh. Gas Control. 2007, 1, 75–85. [Google Scholar] [CrossRef]
- Duguid, A.; Radonjic, M.; Scherer, G.W. Degradation of cement at the reservoir/cement interface from exposure to carbonated brine. Int. J. Greenh. Gas Control. 2011, 5, 1413–1428. [Google Scholar] [CrossRef]
- Duguid, A.; Scherer, G.W. Degradation of oilwell cement due to exposure to carbonated brine. Int. J. Greenh. Gas Control. 2010, 4, 546–560. [Google Scholar] [CrossRef]
- Azizi, D.; Larachi, F. Surface speciation of brucite dissolution in aqueous mineral carbonation: Insights from density-functional theory simulations. J. Phys. Chem. A 2019, 123, 889–905. [Google Scholar] [CrossRef] [PubMed]
- Churakov, S.V.; Iannuzzi, M.; Parrinello, M. Ab initio study of dehydroxylation-carbonation reaction on brucite surface. J. Phys. Chem. B 2004, 108, 11567–11574. [Google Scholar] [CrossRef]
- Funk, A.; Trettin, H.F.R. DFT study on the effect of water on the carbonation of portlandite. Ind. Eng. Chem. Res. 2013, 52, 2168–2173. [Google Scholar] [CrossRef]
- Longo, R.C.; Cho, K.; Bruner, P.; Welle, A.; Gerdes, A.; Thissen, P. Carbonation of wollastonite(001) competing hydration: Microscopic insights from ion spectroscopy and density functional theory. ACS Appl. Mater. Interfaces 2015, 7, 4706–4712. [Google Scholar] [CrossRef]
- Vance, K.; Falzone, G.; Pignatelli, I.; Bauchy, M.; Balonis, M.; Sant, G. Direct carbonation of Ca(OH)2 using liquid and supercritical CO2: Implications for carbon-neutral cementation. Ind. Eng. Chem. Res. 2015, 54, 8908–8918. [Google Scholar] [CrossRef]
- Ruiz-Agudo, E.; Kudłacz, K.; Putnis, C.V.; Putnis, A.; Rodriguez-Navarro, C. Dissolution and carbonation of portlandite [Ca(OH)2] single crystals. Environ. Sci. Technol. 2013, 47, 11342–11349. [Google Scholar] [CrossRef]
- Stepkowska, E.T. Hypothetical transformation of Ca(OH)2 into CaCO3 in solid-state reactions of portland cement. J. Therm. Anal. Calorim. 2005, 80, 727–733. [Google Scholar] [CrossRef]
- Montes-Hernandez, G.; Daval, D.; Chiriac, R.; Renard, F. Growth of nanosized calcite through gas-solid carbonation of nanosized portlandite under anisobaric conditions. Cryst. Growth Des. 2010, 10, 4823–4830. [Google Scholar] [CrossRef]
- Montes-Hernandez, G.; Chiriac, R.; Toche, F.; Renard, F. Gas-solid carbonation of Ca(OH)2 and CaO particles under non-isothermal and isothermal conditions by using a thermogravimetric analyzer: Implications for CO2 capture. Int. J. Greenh. Gas. Control. 2012, 11, 172–180. [Google Scholar] [CrossRef] [Green Version]
- López-Arce, P.; Gómez-Villalba, L.S.; Martínez-Ramírez, S.; Álvarez de Buergo, M.; Fort, R. Influence of relative humidity on the carbonation of calcium hydroxide nanoparticles and the formation of calcium carbonate polymorphs. Powder Technol. 2011, 205, 263–269. [Google Scholar] [CrossRef] [Green Version]
- Montes-Hernandez, G.; Pommerol, A.; Renard, F.; Beck, P.; Quirico, E.; Brissaud, O. In situ kinetic measurements of gas-solid carbonation of Ca(OH)2 by using an infrared microscope coupled to a reaction cell. Chem. Eng. J. 2010, 161, 250–256. [Google Scholar] [CrossRef]
- Galan, I.; Glasser, F.P.; Baza, D.; Andrade, C. Assessment of the protective effect of carbonation on portlandite crystals. Cem. Concr. Res. 2015, 74, 68–77. [Google Scholar] [CrossRef]
- Morandeau, A.; Thiéry, M.; Dangla, P. Investigation of the carbonation mechanism of CH and C-S-H in terms of kinetics, microstructure changes and moisture properties. Cem. Concr. Res. 2014, 56, 153–170. [Google Scholar] [CrossRef] [Green Version]
- Pesce, G.L.; Fletcher, I.W.; Grant, J.; Molinari, M.; Parker, S.C.; Ball, R.J. Carbonation of hydrous materials at the molecular level: A time of flight-secondary ion mass spectrometry, raman and density functional theory study. Cryst. Growth Des. 2017, 17, 1036–1044. [Google Scholar] [CrossRef] [Green Version]
- Moorehead, D.R. Cementation by the carbonation of hydrated lime. Cem. Concr. Res. 1986, 16, 700–708. [Google Scholar] [CrossRef]
- Barducci, A.; Bonomi, M.; Parrinello, M. Metadynamics. Wiley Interdiscip. Rev. Comput. Mol. Sci. 2011, 1, 826–843. [Google Scholar] [CrossRef]
- Barducci, A.; Bussi, G.; Parrinello, M. Well-tempered metadynamics: A smoothly converging and tunable free-energy method. Phys. Rev. Lett. 2008, 100, 020603. [Google Scholar] [CrossRef] [Green Version]
- Car, R.; Parrinello, M. Unified approach for molecular dynamics and density-functional theory. Phys. Rev. Lett. 1985, 55, 2471–2474. [Google Scholar] [CrossRef] [Green Version]
- Marx, D.; Hutter, J. Ab initio molecular dynamics: Theory and implementation. In Modern Methods and Algorithms of Quantum Chemistry; NIC-John von Neumann Institute for Computing: Forschungszentrum Jülich, Germany, 2000; Volume 1, pp. 301–449. ISBN 3000056181. [Google Scholar]
- Parrinello, M. From silicon to RNA: The coming of age of ab initio molecular dynamics. Solid State Commun. 1997, 102, 107–120. [Google Scholar] [CrossRef]
- Laio, A.; Gervasio, F.L. Metadynamics: A method to simulate rare events and reconstruct the free energy in biophysics, chemistry and material science. Rep. Prog. Phys. 2008, 71, 71. [Google Scholar] [CrossRef]
- Tiwary, P.; Parrinello, M. From metadynamics to dynamics. Phys. Rev. Lett. 2013, 111, 230602. [Google Scholar] [CrossRef] [Green Version]
- Ensing, B.; De Vivo, M.; Liu, Z.; Moore, P.; Klein, M.L. Metadynamics as a tool for exploring free energy landscapes of chemical reactions. Acc. Chem. Res. 2006, 39, 73–81. [Google Scholar] [CrossRef] [PubMed]
- Hutter, J.; Iannuzzi, M.; Schiffmann, F.; Vandevondele, J. Cp2k: Atomistic simulations of condensed matter systems. Wiley Interdiscip. Rev. Comput. Mol. Sci. 2014, 4, 15–25. [Google Scholar] [CrossRef] [Green Version]
- Goedecker, S.; Teter, M.; Hutter, J. Separable dual-space Gaussian pseudopotentials. Phys. Rev. B 1996, 54, 1703–1710. [Google Scholar] [CrossRef] [PubMed] [Green Version]
- Perdew, J.P.; Burke, K.; Ernzerhof, M. Generalized gradient approximation made simple. Phys. Rev. Lett. 1996, 77, 3865–3868. [Google Scholar] [CrossRef] [Green Version]
- Grimme, S.; Antony, J.; Ehrlich, S.; Krieg, H. A consistent and accurate ab initio parametrization of density functional dispersion correction (DFT-D) for the 94 elements H-Pu. J. Chem. Phys. 2010, 132, 154104. [Google Scholar] [CrossRef] [Green Version]
- Bussi, G.; Donadio, D.; Parrinello, M. Canonical sampling through velocity rescaling. J. Chem. Phys. 2007, 126, 014101. [Google Scholar] [CrossRef] [Green Version]
- Tribello, G.A.; Bonomi, M.; Branduardi, D.; Camilloni, C.; Bussi, G. PLUMED 2: New feathers for an old bird. Comput. Phys. Commun. 2014, 185, 604–613. [Google Scholar] [CrossRef] [Green Version]
- Stirling, A.; Pápai, I. H2CO3 forms via HCO3—In water. J. Phys. Chem. B 2010, 114, 16854–16859. [Google Scholar] [CrossRef]
- Bal, K.M.; Fukuhara, S.; Shibuta, Y.; Neyts, E.C. Free energy barriers from biased molecular dynamics simulations. J. Chem. Phys. 2020, 153, 114118. [Google Scholar] [CrossRef]
- Dobrushin, R.L.; Kotecký, R.; Shlosman, S.B. Wulff Construction: A Global Shape from Local Interaction; American Mathematical Society: Providence, RI, USA, 1992; Volume 104, ISBN 978-0-8218-4563-9. [Google Scholar]
- Zucker, R.V.; Chatain, D.; Dahmen, U.; Hagege, S.; Carter, W.C. New software tools for the calculation and display of isolated and attached interfacial-energy minimizing particle shapes. J. Mater. Sci. 2012, 47, 8290–8302. [Google Scholar] [CrossRef]
- Ringe, E.; Van Duyne, R.P.; Marks, L.D. Wulff construction for alloy nanoparticles. Nano Lett. 2011, 11, 3399–3403. [Google Scholar] [CrossRef]
- Desgranges, L.; Grebille, D.; Calvarin, G.; Chevrier, G.; Floquet, N.; Niepce, J.-C. Hydrogen thermal motion in calcium hydroxide: Ca(OH)2. Acta Crystallogr. Sect. B 1993, 49, 812–817. [Google Scholar] [CrossRef]
- Chen, X.; Wei, S.; Wang, Q.; Tang, M.; Shen, X.; Zou, X.; Shen, Y.; Ma, B. Morphology prediction of portlandite: Atomistic simulations and experimental research. Appl. Surf. Sci. 2020, 502, 144296. [Google Scholar] [CrossRef]
- Galmarini, S.; Aimable, A.; Ruffray, N.; Bowen, P. Changes in portlandite morphology with solvent composition: Atomistic simulations and experiment. Cem. Concr. Res. 2011, 41, 1330–1338. [Google Scholar] [CrossRef] [Green Version]
- Harutyunyan, V.S. Adsorption energy of stoichiometric molecules and surface energy at morphologically important facets of a Ca(OH) 2 crystal. Mater. Chem. Phys. 2012, 134, 200–213. [Google Scholar] [CrossRef]
- Anthony, J.W. Handbook of Mineralogy: Halides, Hydroxides and Oxides; Mineral Data Publishing: Springfield, OH, USA, 1997; ISBN 0962209724. [Google Scholar]
- Harutyunyan, V.S.; Kirchheim, A.P.; Monteiro, P.J.M.; Aivazyan, A.P.; Fischer, P. Investigation of early growth of calcium hydroxide crystals in cement solution by soft X-ray transmission microscopy. J. Mater. Sci. 2009, 44, 962–969. [Google Scholar] [CrossRef]
- Gallucci, E.; Scrivener, K. Crystallisation of calcium hydroxide in early age model and ordinary cementitious systems. Cem. Concr. Res. 2007, 37, 492–501. [Google Scholar] [CrossRef]
- Berger, R.L.; McGregor, J.D. Influence of admixtures on the morphology of calcium hydroxide formed during tricalcium silicate hydration. Cem. Concr. Res. 1972, 2, 43–55. [Google Scholar] [CrossRef]
- Plimpton, S. Fast parallel algorithms for short-range molecular dynamics. J. Comput. Phys. 1995, 117, 1–19. [Google Scholar] [CrossRef] [Green Version]
- Cygan, R.T.; Liang, J.-J.; Kalinichev, A.G. Molecular models of hydroxide, oxyhydroxide, and clay phases and the development of a general force field. J. Phys. Chem. B 2004, 108, 1255–1266. [Google Scholar] [CrossRef]
- Cygan, R.T.; Romanov, V.N.; Myshakin, E.M. Molecular simulation of carbon dioxide capture by montmorillonite using an accurate and flexible force field. J. Phys. Chem. C 2012, 116, 13079–13091. [Google Scholar] [CrossRef]
- Hockney, R.W.; Eastwood, J.W. Computer Simulation Using Particles; CRC Press: Boca Raton, FL, USA, 1988; ISBN 9780052473922. [Google Scholar]
- Özçelik, V.O.; Gong, K.; White, C.E. Highly surface-active Ca(OH)2 monolayer as a CO2 capture material. Nano Lett. 2018, 18, 1786–1793. [Google Scholar] [CrossRef] [Green Version]
- Shih, S.M.; Ho, C.S.; Song, Y.S.; Lin, J.P. Kinetics of the reaction of Ca(OH)2 with CO2 at low temperature. Ind. Eng. Chem. Res. 1999, 38, 1316–1322. [Google Scholar] [CrossRef]
- Steiner, S.; Lothenbach, B.; Proske, T.; Borgschulte, A.; Winnefeld, F. Effect of relative humidity on the carbonation rate of portlandite, calcium silicate hydrates and ettringite. Cem. Concr. Res. 2020, 135, 106116. [Google Scholar] [CrossRef]
- Cizer, Ö.; Rodriguez-Navarro, C.; Ruiz-Agudo, E.; Elsen, J.; Van Gemert, D.; Van Balen, K. Phase and morphology evolution of calcium carbonate precipitated by carbonation of hydrated lime. J. Mater. Sci. 2012, 47, 6151–6165. [Google Scholar] [CrossRef] [Green Version]
- Rodriguez-Navarro, C.; Ruiz-Agudo, E. Nanolimes: From synthesis to application. Pure Appl. Chem. 2018, 90, 523–550. [Google Scholar] [CrossRef]
- Dheilly, R.M.; Tudo, J.; Sebaibi, Y.; Quéneudec, M. Influence of storage conditions on the carbonation of powdered Ca(OH)2. Constr. Build. Mater. 2002, 16, 155–161. [Google Scholar] [CrossRef]
- Beruto, D.T.; Botter, R. Liquid-like H2O adsorption layers to catalyze the Ca(OH)2/CO2 solid-gas reaction and to form a non-protective solid product layer at 20 °C. J. Eur. Ceram. Soc. 2000, 20, 497–503. [Google Scholar] [CrossRef]
- Nikulshina, V.; Gálvez, M.E.; Steinfeld, A. Kinetic analysis of the carbonation reactions for the capture of CO2 from air via the Ca(OH)2-CaCO3-CaO solar thermochemical cycle. Chem. Eng. J. 2007, 129, 75–83. [Google Scholar] [CrossRef]
- Stowe, H.M.; Hwang, G.S. Molecular insights into the enhanced rate of CO2 absorption to produce bicarbonate in aqueous 2-amino-2-methyl-1-propanol. Phys. Chem. Chem. Phys. 2017, 19, 32116–32124. [Google Scholar] [CrossRef]
- Stirling, A. HCO3-formation from CO2 at High pH: Ab initio molecular dynamics study. J. Phys. Chem. B 2011, 115, 14683–14687. [Google Scholar] [CrossRef]
- Wang, X.; Conway, W.; Burns, R.; McCann, N.; Maeder, M. Comprehensive study of the hydration and dehydration reactions of carbon dioxide in aqueous solution. J. Phys. Chem. A 2010, 114, 1734–1740. [Google Scholar] [CrossRef]
- Nakamoto, K. Infrared and raman spectra of inorganic and coordination compounds. In Handbook of Vibrational Spectroscopy; Wiley: Hoboken, NJ, USA, 2006. [Google Scholar]
- Bargar, J.R.; Kubicki, J.D.; Reitmeyer, R.; Davis, J.A. ATR-FTIR spectroscopic characterization of coexisting carbonate surface complexes on hematite. Geochim. Cosmochim. Acta 2005, 69, 1527–1542. [Google Scholar] [CrossRef]
- Baltrusaitis, J.; Jensen, J.H.; Grassian, V.H. FTIR spectroscopy combined with isotope labeling and quantum chemical calculations to investigate adsorbed bicarbonate formation following reaction of carbon dioxide with surface hydroxyl groups on Fe2O3 and Al2O3. J. Phys. Chem. B 2006, 110, 12005–12016. [Google Scholar] [CrossRef]
- Baltrusaitis, J.; Grassian, V.H. Surface reactions of carbon dioxide at the adsorbed water-iron oxide interface. J. Phys. Chem. B 2005, 109, 12227–12230. [Google Scholar] [CrossRef]
- Mutisya, S.M.; Kirch, A.; De Almeida, J.M.; Sánchez, V.M.; Miranda, C.R. Molecular dynamics simulations of water confined in calcite slit pores: An NMR spin relaxation and hydrogen bond analysis. J. Phys. Chem. C 2017, 121, 6674–6684. [Google Scholar] [CrossRef]
- Kirch, A.; Mutisya, S.M.; Sánchez, V.M.; De Almeida, J.M.; Miranda, C.R. Fresh molecular look at calcite-brine nanoconfined interfaces. J. Phys. Chem. C 2018, 122, 6117–6127. [Google Scholar] [CrossRef] [Green Version]
- Kalinichev, A.G.; Kirkpatrick, R.J.; Cygan, R.T. Molecular modeling of the structure and dynamics of the interlayer and surface species of mixed-metal layered hydroxides: Chloride and water in hydrocalumite (Friedel’s salt). Am. Mineral. 2000, 85, 1046–1052. [Google Scholar] [CrossRef] [Green Version]
- Greathouse, J.A.; Refson, K.; Sposito, G. Molecular dynamics simulation of water mobility in magnesium-smectite hydrates. J. Am. Chem. Soc. 2000, 122, 11459–11464. [Google Scholar] [CrossRef]
- Smirnov, K.S.; Bougeard, D. A Molecular dynamics study of structure and short-time dynamics of water in kaolinite. J. Phys. Chem. B 1999, 103, 5266–5273. [Google Scholar] [CrossRef]
- Kagunya, W.; Dutta, P.K.; Lei, Z. Dynamics of water in hydrotalcite. Phys. B Condens. Matter 1997, 234, 910–913. [Google Scholar] [CrossRef]
- Kalinichev, A.G.; Kirkpatrick, R.J. Molecular dynamics modeling of chloride binding to the surfaces of calcium hydroxide, hydrated calcium aluminate, and calcium silicate phases. Chem. Mater. 2002, 14, 3539–3549. [Google Scholar] [CrossRef]
- Nguyen, M.T.; Matus, M.H.; Jackson, V.E.; Ngan, V.T.; Rostad, J.R.; Dixon, D.A. Mechanism of the hydration of carbon dioxide: Direct participation of H2O versus microsolvation. J. Phys. Chem. A 2008, 112, 10386–10398. [Google Scholar] [CrossRef]
- Polino, D.; Grifoni, E.; Rousseau, R.; Parrinello, M.; Glezakou, V.A. How collective phenomena impact CO2 reactivity and speciation in different media. J. Phys. Chem. A 2020, 124, 3963–3975. [Google Scholar] [CrossRef]
- Kumar, P.P.; Kalinichev, A.G.; Kirkpatrick, R.J. Dissociation of carbonic acid: Gas phase energetics and mechanism from ab initio metadynamics simulations. J. Chem. Phys. 2007, 126, 1–7. [Google Scholar] [CrossRef] [PubMed] [Green Version]
- Kumar, P.P.; Kalinichev, A.G.; Kirkpatrick, R.J. Hydrogen-bonding structure and dynamics of aqueous carbonate species from Car-Parrinello molecular dynamics simulations. J. Phys. Chem. B 2009, 113, 794–802. [Google Scholar] [CrossRef]
- Miller, Q.R.S.; Ilton, E.S.; Qafoku, O.; Dixon, D.A.; Vasiliu, M.; Thompson, C.J.; Schaef, H.T.; Rosso, K.M.; Loring, J.S. Water structure controls carbonic acid formation in adsorbed water films. J. Phys. Chem. Lett. 2018, 9, 4988–4994. [Google Scholar] [CrossRef]
- Miller, Q.R.S.; Dixon, D.A.; Burton, S.D.; Walter, E.D.; Hoyt, D.W.; McNeill, A.S.; Moon, J.D.; Thanthiriwatte, K.S.; Ilton, E.S.; Qafoku, O.; et al. Surface-catalyzed oxygen exchange during mineral carbonation in nanoscale water films. J. Phys. Chem. C 2019, 123, 12871–12885. [Google Scholar] [CrossRef]
- Placencia Gomez, E.; Kerisit, S.N.; Mehta, H.; Qafoku, O.; Thompson, C.J.; Graham, T.R.; Ilton, E.S.; Loring, J.S. Critical water coverage during forsterite carbonation in thin water films: Activating dissolution and mass transport. Environ. Sci. Technol. 2020, 54, 6888–6899. [Google Scholar] [CrossRef]
- Huet, B.; Tasoti, V.; Khalfallah, I. A review of Portland cement carbonation mechanisms in CO2 rich environment. Energy Procedia 2011, 4, 5275–5282. [Google Scholar] [CrossRef] [Green Version]
- Senftle, T.P.; Hong, S.; Islam, M.M.; Kylasa, S.B.; Zheng, Y.; Shin, Y.K.; Junkermeier, C.; Engel-Herbert, R.; Janik, M.J.; Aktulga, H.M.; et al. The ReaxFF reactive force-field: Development, applications and future directions. npj Comput. Mater. 2016, 2, 15011. [Google Scholar] [CrossRef]
Figure 1.
(a) The crystal structure of portlandite. Illustration of the cleavage planes along the lowest energy surfaces: (b) (001), (c) (100) and (110) planes. (d) The portlandite crystal morphology determined from DFT calculated surface energies. Color legend: O, red; H, white; Ca, green.
Figure 1.
(a) The crystal structure of portlandite. Illustration of the cleavage planes along the lowest energy surfaces: (b) (001), (c) (100) and (110) planes. (d) The portlandite crystal morphology determined from DFT calculated surface energies. Color legend: O, red; H, white; Ca, green.

Figure 2.
Snapshots of the configurations of reacted CO2 with the portlandite surfaces (a) (100) surface, (b) (110) surface and (c) (001) surface. The resultant H2O molecules are highlighted with circles for the (100) and the (110) surfaces. (d) The free-energy evolution with the C atom coordination number to the surface O atoms for the (001) surface.

Figure 3.
(a) The distribution function of the O-C-O angle for CO2 molecules and (bi)carbonate ions. The inset highlights the results for the (bi)carbonate ions. (b) The power spectra of CO2 molecules confined within the nanopores of (001), (100) and (110) portlandite surfaces. The arrows highlight the (bi)carbonate ions produced from the carbonation reaction of CO2 with portlandite.

Figure 4.
The atomic density profile of the CO2 carbon (C), CO2 oxygen (Oc), hydroxyl oxygen (Oh), hydroxyl hydrogen (H) and calcium (Ca) atoms along the z direction for the (a) (001), (b) (100) and (c) (110) surfaces. The surface is defined as the average position of the surface calcium atoms.
Figure 4.
The atomic density profile of the CO2 carbon (C), CO2 oxygen (Oc), hydroxyl oxygen (Oh), hydroxyl hydrogen (H) and calcium (Ca) atoms along the z direction for the (a) (001), (b) (100) and (c) (110) surfaces. The surface is defined as the average position of the surface calcium atoms.

Figure 5.
MSD as a function of time for the CO2 molecules and ions within the (a) (001) (b) (100) and (c) (110) pore systems along the xy and z directions.
Figure 5.
MSD as a function of time for the CO2 molecules and ions within the (a) (001) (b) (100) and (c) (110) pore systems along the xy and z directions.

Figure 6.
The atomic density profiles of the H2O oxygen (Ow), H2O hydrogen (Hw), CO2 carbon (C), CO2 oxygen (Oc), hydroxyl oxygen (Oh), hydroxyl hydrogen (H) and calcium (Ca) atoms along the z direction for the (a) (001), (b) (100) and (c) (110) pores. The Surface is defined as the average position of the surface calcium atoms. The orientation of the H2O molecule dipole vector with respect to the surface normal for the (d) (001), (e) (100) and (f) (110) pore systems.

Figure 7.
(a) (Left) The free-energy evolution with the C atom coordination number for the (001), (100) and (110) systems with H2O/CO2 mixture confined therein. (right) The calculated free-energy barrier values for the (001), (100) and (110) systems. (b) The snapshots of the configurations of reacted CO2 with the portlandite surfaces; (left) (001) surface, (center) (100) surface and (right) (110) surface. The resultant ions are highlighted with circles.

Figure 8.
Schematic illustration of the proposed reaction pathways for CO2 reaction with the portllandite surfaces. Reaction path 1 refers to the reaction observed for the (001) and (100) interfaces while reaction path 2 is for the (110) interface.
Figure 8.
Schematic illustration of the proposed reaction pathways for CO2 reaction with the portllandite surfaces. Reaction path 1 refers to the reaction observed for the (001) and (100) interfaces while reaction path 2 is for the (110) interface.

Figure 9.
Mean Squared Displacement as a function of time for the H2O and CO2 molecules within the (a) (001) (b) (100) and (c) (110) pore systems along the xy and z directions.
Figure 9.
Mean Squared Displacement as a function of time for the H2O and CO2 molecules within the (a) (001) (b) (100) and (c) (110) pore systems along the xy and z directions.


Table 1.
The number of CO2 and H2O molecules within the portlandite pores cleaved along the (001), (100) and (110) planes for both the pure scCO2 and H2O/CO2 mixture systems.
Table 1.
The number of CO2 and H2O molecules within the portlandite pores cleaved along the (001), (100) and (110) planes for both the pure scCO2 and H2O/CO2 mixture systems.
| System | Number of CO2 and H2O Molecules within the (001), (100) and (110) Pores | |||||
|---|---|---|---|---|---|---|
| (001) | (100) | (110) | ||||
| Slab size (Å3) | 4411.49 | 4478.17 | 8188.60 | |||
| CO2 | H2O | CO2 | H2O | CO2 | H2O | |
| Pure scCO2 | 24 | - | 24 | - | 44 | - |
| H2O/CO2 mixture | 12 | 38 | 12 | 38 | 12 | 88 |
Publisher’s Note: MDPI stays neutral with regard to jurisdictional claims in published maps and institutional affiliations. |
© 2021 by the authors. Licensee MDPI, Basel, Switzerland. This article is an open access article distributed under the terms and conditions of the Creative Commons Attribution (CC BY) license (https://creativecommons.org/licenses/by/4.0/).
Share and Cite
MDPI and ACS Style
Mutisya, S.M.; Kalinichev, A.G. Carbonation Reaction Mechanisms of Portlandite Predicted from Enhanced Ab Initio Molecular Dynamics Simulations. Minerals 2021, 11, 509. https://doi.org/10.3390/min11050509
AMA Style
Mutisya SM, Kalinichev AG. Carbonation Reaction Mechanisms of Portlandite Predicted from Enhanced Ab Initio Molecular Dynamics Simulations. Minerals. 2021; 11(5):509. https://doi.org/10.3390/min11050509
Chicago/Turabian StyleMutisya, Sylvia M., and Andrey G. Kalinichev. 2021. "Carbonation Reaction Mechanisms of Portlandite Predicted from Enhanced Ab Initio Molecular Dynamics Simulations" Minerals 11, no. 5: 509. https://doi.org/10.3390/min11050509
Note that from the first issue of 2016, this journal uses article numbers instead of page numbers. See further details here.