
Developing a Novel Fuzzy Evaluation Model by One-Sided Specification Capability Indices


1
School of Business Administration, Guangxi University of Finance and Economics, Guangxi 530003, China
2
School of Economics and Management, Dongguan University of Technology, Dongguan 523808, China
3
Department of Business Administration, Chaoyang University of Technology, Taichung 41349, Taiwan
4
International Language Center, Dayeh University, Changhua 51591, Taiwan
5
Department of Industrial Engineering and Management, National Chin-Yi University of Technology, Taichung 41170, Taiwan
*
Author to whom correspondence should be addressed.
Mathematics 2021, 9(10), 1076; https://doi.org/10.3390/math9101076
Submission received: 12 April 2021
/
Revised: 29 April 2021
/
Accepted: 7 May 2021
/
Published: 11 May 2021
(This article belongs to the Special Issue Fuzzy Applications in Industrial Engineering)
Abstract
:When all of the one-sided specification indices of each quality characteristic reach the requirements of the process quality level, they can ensure that the process capability of the product meets the requirements of the process quality level. This study constructs a fuzzy membership function based on the upper confidence limit of the index, derives the fuzzy critical value, and then labels the fuzzy critical value on the axis of the visualized radar chart as well as connects adjacent critical points to shape a regular polygonal critical region. Next, this study calculates the observed value of the index to estimate and mark it on the axis for forming a visualized fuzzy radar evaluation chart. Obviously, this fuzzy evaluation model not only reduces the testing cost but also makes the quality level quickly meet the requirements of the specifications. Further, the radar chart can reduce the risk of misjudgment attributable to sampling errors and help improve the accuracy of evaluation by a confidence-upper-limit-based fuzzy evaluation model. Therefore, this easy-to-use visualized fuzzy radar evaluation chart is used as an evaluation interface, which has good and convenient management performance to identify and improve critical-to-quality quickly. Improving the quality of the process before the product is completed will also have the advantage of reducing social losses and environmental damage costs.
1. Introduction
The output value of Taiwan’s machine tools is ranked seventh in the world, mainly sold to countries with emerging markets, such as Southeast Asia and Eastern Europe, and the export volume is ranked fifth in the world. About 70% of precision machinery, machine tool, and component factories are located in the central region, combining the aerospace and smart machinery industries, as well as connecting the component processing and maintenance industries to form a large settlement for the machine tool and machinery industry [1,2,3]. According to Prahalad and Hamel [4] and Grossman and Helpman [5], in order to reduce operating costs and concentrate resources to give full play to their own core technologies, companies will outsource some non-core businesses to professional manufacturers to improve their overall efficiency and competitiveness. Driven by the highly clustered effect of Taiwan’s machine tool industry, central Taiwan has become a complete machine tool industry chain and has established a key position in the global machine tool industry.
Machine tools have many important components, such as shafts, bearings, gears, etc. According to numerous studies, these important components usually contain multiple quality characteristics (QC) of the smaller-the-better, the larger-the-better, and the nominal-the-best types at the same time. Each quality characteristic must meet the requirement of the quality level to ensure the product quality of the machine tool [6,7,8,9,10,11,12,13,14,15]. Process Capability Indices (PCIs) are not only a helpful tool for internal engineers to evaluate and analyze process capabilities but also a good communication tool between manufacturers [16,17,18]. Kane [19] proposed three process-yield-based capability indices, currently the most widely used indicators in the industry [20,21,22,23]. As noted by Chen et al. [15], the index is suitable for the process of the smaller-the-better (STB) quality characteristic, whereas is suitable for the process of the larger-the-better (LTB) quality characteristic. These two one-sided specification capability indices are explained as follows:
where is the process mean and is the process standard deviation; and refer to the upper specification limit and the lower specification limit, respectively. Based on Boyles [24], the relationship of indices and process yield is , where or , and is the cumulative distribution function of standard normal distribution. Furthermore, suits the process of the nominal-the-better (NTB) quality characteristic. This two-sided specification index can be expressed as follows:
For the sake of generality, this study assumes that the important components of the machine tools have two-sided and one-sided specification quality characteristics. Since the two-sided specification index is the minimum value derived from the one-sided specification indices and , consequently, this study will decompose it into two one-sided specification indices. Therefore, the process capability of an entire component can be evaluated by one-sided specification process capability indices, in which . When the process capability indices of all one-sided specification indices meet the requirements of process capabilities, it is ensured that all quality characteristics are also consistent with the requirements of process capabilities. The radar chart is a visualized evaluation tool, which has been widely applied to various fields, such as engineering, management, education, and others [25,26,27,28,29]. Next, this study combined the upper- confidence-limit-based fuzzy evaluation rules with the radar chart with lines to establish a visualized fuzzy radar evaluation chart. Apparently, this fuzzy radar evaluation chart is on the basis of rigorous statistical inferences. In addition, the evaluation criteria are established by an accurate fuzzy testing method. Finally, the easy-to-use visualized radar chart is used as an evaluation interface, which has good and convenient management performance to identify and improve critical-to-quality quickly. Therefore, this fuzzy radar evaluation chart is not only simple but also easy to use. Furthermore, it also can reduce the risk of misjudgment caused by sampling errors as well as improve the accuracy of the assessment. Improving the quality of the process before the product is completed will also have the advantage of reducing social losses and environmental damage costs.
The remainder of this paper is organized as follows: In Section 2, we present the estimations of process quality indices, including finding a maximum likelihood estimator (MLE) of one-sided specification capability indices and its 100()% upper confidence limits. In Section 3, we derive the fuzzy critical values based on the upper confidence limits. Subsequently, fuzzy testing rules are established by the index estimates and the fuzzy critical values. According to the fuzzy testing rules, In Section 4, a simple and handy visualized radar evaluation chart is constructed as an evaluation interface. Finally, conclusions are made in Section 5.
2. Estimations of Process Quality Indices
A lot of studies have indicated that if the required process capability of a product is , then the required value of the process capability of an individual quality characteristic must be greater than [2,30,31]. As mentioned above, when the process capability for each quality characteristic meets the requirement, it can be claimed as a qualified product or component. Since this study decomposed the two-sided specification index into two one-sided specification indices and , all the evaluated one-sided specification indices of the product or component must meet the process capability requirement before it can be claimed as a qualified product or component.
According to Chen et al. [15], this study used Event , representing the index value of the quality characteristic is greater than (), and lets . Based on Boole’s inequality and DeMorgan’s theorem, the two one-sided specification indices in this study can be indicated in the following equation:
where refers to the complement of event . Given the relationship between the index value and the yield, Equation (4) can be rewritten as follows:
Therefore,
Obviously, when the process capability index value for each evaluated one-sided specification index is greater than , then the entire product or component can be guaranteed to be a good or qualified product.
As mentioned above, the process capability of the product or component can be assessed by the process capability indices of one-sided specifications. Let , which is a set of random samples estimating the value of the hth process capability index, whose population is the normal distribution with mean and standard deviation , where h = 1,2, …, . Therefore, the sample mean and sample standard deviation can be shown respectively, as follows:
and
Let
Then, the estimators of the process capability index are written below:
Under the assumption of normality,
is delivered as , where is distributed as . Therefore,
where is the lower 1 − quantile of .
Given the smaller-the-better quality characteristic, let
Then the random variable is distributed as standard normal distribution. Consequently,
where is the upper quantile of .
Given the larger-the-better quality characteristic, let
Then the random variable is regarded as a standard normal distribution. Therefore,
In addition, let Event and Event be expressed below:
In addition, the compliments of Event and Event are indicated in the following:
Given DeMorgan’s rules and Boole’s inequality, it is learned:
Thus,
Equivalently,
Let and be the observed values of and respectively, as follows:
and
Thus, the observed value of and the upper confidence limit of respectively are expressed as follows:
and
3. Fuzzy Hypothesis Testing
The Fuzzy hypothesis testing is an effective approach to a decision whether process capability is acceptable [16,32,33,34,35]. Pearn and Chen [36] have defined the capability requirement is shown in Table 1 as follows:
It is assumed that a product or component contains a total of q corresponding one-sided specification evaluation indicators. If the process capability index values of the product are required to be at least v, then all of its corresponding q one-sided specification evaluation indices must be at least according to Equation (6). In order to determine whether the values of one-sided specification capability indices are larger or equal to , the hypothesis testing at significance level can be stated as follows:
As mentioned above, the null hypothesis is , while the alternative hypothesis is . Given the above statistical test rules and the approach proposed by Chen [37], this study developed the fuzzy testing method based on the observed values of upper confidence limits for index . As noted by Chen [38] and Lee et al. [39], the -cuts of the triangular shaped fuzzy number can be obtained as follows:
where
Therefore, the half-triangular shaped fuzzy number is , where
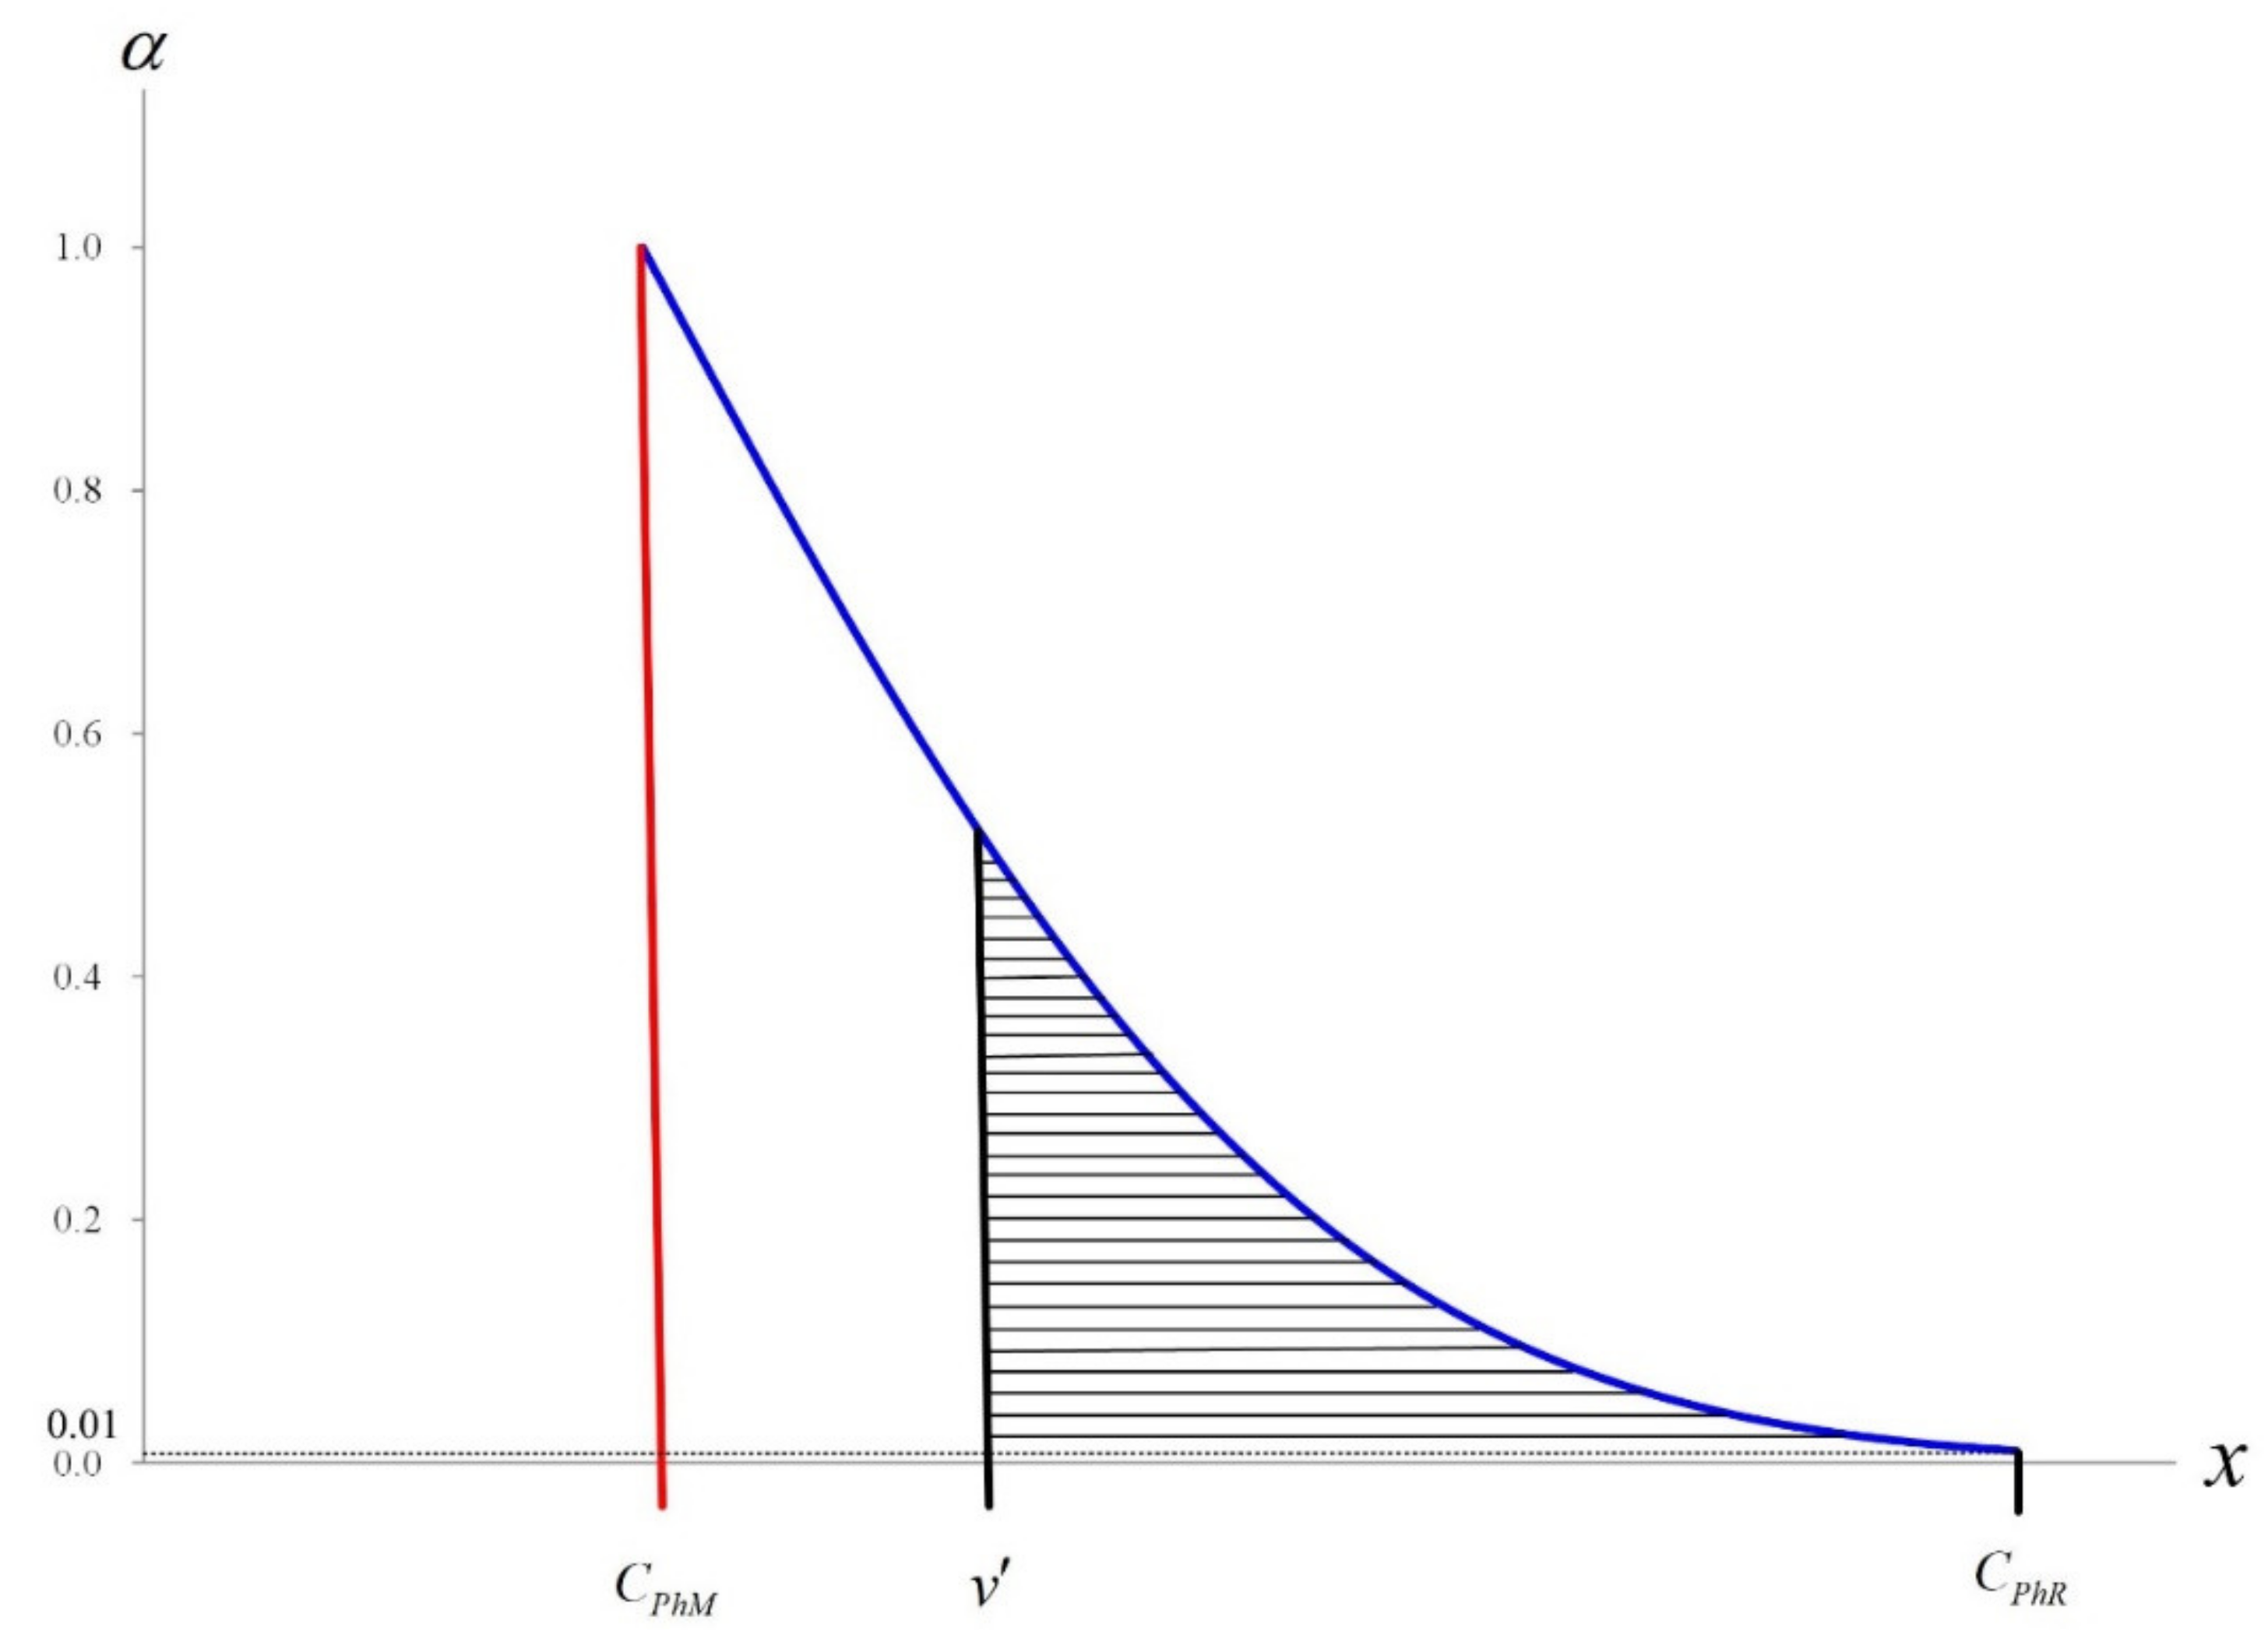
Consequently, the membership function of the fuzzy number is
where is decided by . Figure 1 exhibits a graph of the membership function with the vertical line .
Based on the theories of Chen et al. [1] and Chen [40], if we let set be the area in the graph of and set be the area in the graph of but to the right of the vertical line , then
And
Based on Equations (27) and (28), = − and = − . Then
As noted by Yu et al. [41], we let 0 < ≤ 0.5. Then, the decision value of the hth one-sided specification evaluation index can satisfy the following equation.
According to Equations (27) and (28), the decision value is = + where
- (1)
- If ≤ is equivalent to ≤ , then reject and conclude that .
- (2)
- If is equivalent to , then do not reject and conclude that .
In Equation (34), is equivalent to where
According to Chen and Yu [42], we can call as a fuzzy critical value. The decision rules of fuzzy tests can be rewritten as follows:
- (1)
- If , then reject and conclude that .
- (2)
- If , then do not reject and conclude that .
4. Case Study
As mentioned above, the output value of Taiwan’s machine tools ranks among the best in the world, and the central region is the main industrial cluster. Many products or important components processed by machine tools usually contain numerous quality characteristics of one-sided and two-sided specifications at the same time—gears, for example. After the inner circular hole of the gear is polished, it is necessary to confirm that the four quality characteristics—roundness, inner cylindrical surface roughness, deflection, and inner diameter—can meet the specification requirements for the subsequent assembly quality and post-assembly operation quality [30,43]. Among these four quality characteristics, roundness, inner cylindrical surface roughness, and deflection are considered as the smaller-the-better type, directly evaluated by the one-sided specification indices (h = 1, 2, 3) of the smaller-the-better type. Inner diameter belongs to the nominal-the-best type, so it can be evaluated by both a one-sided specification index (h = 4) of the smaller-the-better type and a one-sided specification index (h = 5) of the larger-the-better type. The relevant information is shown in the following Table 2.
Next, a random test follows. Sixty gears processed by a mechanical processing factory in central Taiwan were randomly selected. Based on the 60 sample data and the evaluation model mentioned earlier in this study, the evaluation steps were established as follows:
Step 1: Based on Table 1 and Equation (6), set the required capability index value of the gear grinding process as and calculate the required value for each corresponding evaluation index as follows:
- = 1.33 (Satisfactory)
- = = 1.455
Step 2: Based on Equations (34) and (35), compute the values of
and , and then based on Equation (36), compute the fuzzy value of as follows:
- = 1.051
- = 0.067
- = 1.321
Step 3: Based on Equations (19) and (20), compute the values of and , and then based on Equation (21), compute the critical values of as follows:
Step 4: Draw 5 lines with an angle of 72 degrees, mark on the lines of the radar chart is shown in Figure 2, and connect adjacent critical points to build a regular pentagon critical region ( = 1.321) as follows:
Step 5: Mark the estimated values of the five indicators (h = 1, …, 5) in Table 3 on the five lines and perform the evaluation task as follows:
- When the index estimate falls within the regular pentagon critical region, then reject and conclude that < 1.455.
- When the index estimate falls outside the regular pentagon critical region, then do not reject and conclude that ≥ 1.455.
Step 6: The results and discussion are described as follows:
- Considering the statistical testing rules, the five indicator values all met the requirement of the process quality level ( ≥ 1.455) since the upper limits of the five indicators were all greater than 1.455.
- According to the fuzzy testing method proposed by this study, the estimated value of the evaluation index 2 was = 1.183 < = 1.321, which means that index 2 did not meet the quality level requirement. In fact, = 1.183 was much less than = 1.455, so applying the fuzzy testing method is more reasonable than the traditional statistical method.
5. Conclusions
This study disassembled a two-sided specification index into two one-sided specification indices and applied the one-sided specification index to propose a quality evaluation model for products or important components with multiple quality characteristics. The advantages of this evaluation model are illustrated as follows:
- Given the upper confidence limit of the one-sided specification index, the risk of misjudgment caused by sampling errors can be reduced.
- The precision of the evaluation can be advanced through the confidence-upper-limit-based fuzzy testing method.
- The developed fuzzy critical values labeled on the radar chart are simple and easy to use.
- Using the easy-to-use visualized radar chart as an evaluation interface can present a complete picture of all evaluation indicators, showing that it has good and convenient management performance.
In addition, the evaluation model proposed by this study can monitor all evaluation indicators at the same time to ensure that each index value can meet the requirement of the quality level. In practice, this model can assist the development of the industrial chain and promote quality improvement. Furthermore, this study used gears as an example. However, future studies can apply the proposed approach to products or important components with multiple quality characteristics in various fields, such as IC industry wire bonding, TFT LCD, and physical fitness, etc. Moreover, it is recommended this proposed model be applied to the selection of multiple suppliers or the comparison of the process performance of multiple production lines.
Author Contributions
Conceptualization, W.L., C.-M.Y. and K.-K.L.; methodology, W.L. and K.-K.L.; software, C.-M.Y.; validation, S.-Y.L. and C.-M.Y.; formal analysis, W.L. and K.-K.L.; resources, C.-M.Y.; data curation, S.-Y.L. and C.-H.C.; writing—original draft preparation, W.L., K.-K.L., C.-M.Y., S.-Y.L. and C.-H.C.; writing—review and editing, W.L. and K.-K.L.; visualization, S.-Y.L. and C.-H.C.; supervision, K.-K.L.; project administration, W.L. and C.-M.Y. All authors have read and agreed to the published version of the manuscript.
Funding
This work was financially supported by the National Natural Science Foundation of China, under grant No. 71762008.
Conflicts of Interest
The authors declare no conflict of interest.
References
- Chen, K.S.; Wang, C.H.; Tan, K.H. Developing a fuzzy green supplier selection model using Six Sigma quality indices. Int. J. Prod. Econ. 2019, 212, 1–7. [Google Scholar]
- Lin, K.P.; Yu, C.M.; Chen, K.S. Production data analysis system using novel process capability indices-based circular economy. Ind. Manag. Data Syst. 2019, 119, 1655–1668. [Google Scholar]
- Chien, C.F.; Hong, T.Y.; Guo, H.Z. An empirical study for smart production for TFT-LCD to empower Industry 3.5. J. Chin. Inst. Eng. 2017, 40, 552–561. [Google Scholar]
- Prahalad, C.K.; Hamel, G. The Core Competence of the Corporation. Harv. Bus. Rev. 1990, 68, 79–91. [Google Scholar]
- Grossman, G.M.; Helpman, E. Integration versus outsourcing in industry equilibrium. Q. J. Econ. 2002, 117, 85–120. [Google Scholar]
- Chen, K.S.; Huang, M.L.; Li, R.K. Process capability analysis for an entire product. Int. J. Prod. Res. 2001, 39, 4077–4087. [Google Scholar]
- Huang, M.L.; Chen, K.S.; Hung, Y.H. Integrated process capability analysis with an application in backlight module. Microelectron. Reliab. 2002, 42, 2009–2014. [Google Scholar]
- Chen, K.S.; Huang, M.L. Performance measurement for a manufacturing system based on quality, cost and time. Int. J. Prod. Res. 2006, 44, 2221–2243. [Google Scholar]
- Chen, K.S.; Yu, K.T.; Sheu, S.H. Process capability monitoring chart with an application in the silicon-filler manufacturing process. Int. J. Prod. Econ. 2006, 103, 565–571. [Google Scholar]
- Chen, H.T.; Chen, K.S. Advanced multi-process performance analysis chart for an entire product with joint confidence regions. Int. J. Prod. Res. 2007, 45, 2141–2159. [Google Scholar]
- Chen, K.S.; Huang, M.L.; Hung, Y.H. Process capability analysis chart with the application of Cpm. Int. J. Prod. Res. 2008, 46, 4483–4499. [Google Scholar] [CrossRef]
- Chang, T.C.; Wang, K.J.; Chen, K.S. Sputtering process assessment of ITO film for multiple quality characteristics with one-sided and two-sided specifications. J. Test. Eval. 2014, 42, 196–203. [Google Scholar] [CrossRef]
- Chen, H.T.; Chen, K.S. Assessing the assembly quality of a T-bar ceiling suspension by using an advanced multi-process performance analysis chart with asymmetric tolerance. Eur. J. Ind. Eng. 2016, 10, 264–283. [Google Scholar]
- Hsu, C.H.; Chen, K.S.; Yang, C.M. Construction of closed interval for process capability indices Cpu, Cpl, and Spk based on Boole’s inequality and de Morgan’s laws. J. Stat. Comput. Simul. 2016, 86, 3701–3714. [Google Scholar] [CrossRef]
- Chen, K.S.; Chen, H.T.; Chang, T.C. The construction and application of six sigma quality indices. Int. J. Prod. Res. 2017, 55, 2365–2384. [Google Scholar] [CrossRef]
- Yang, C.M.; Lin, K.P.; Chen, K.S. Confidence interval based fuzzy evaluation model for an integrated-circuit packaging molding process. Appl. Sci. 2019, 9, 2623. [Google Scholar] [CrossRef] [Green Version]
- Chen, K.S.; Chen, H.T.; Wang, C.H. A study of process quality assessment for golf club-shaft in leisure sport industries. J. Test. Eval. 2012, 40, 512–519. [Google Scholar] [CrossRef]
- Pearn, W.L.; Cheng, Y.C. Measuring production yield for processes with multiple characteristics. Int. J. Prod. Res. 2010, 48, 4519–4536. [Google Scholar] [CrossRef]
- Kane, V.E. Process capability indices. J. Qual. Technol. 1986, 18, 41–52. [Google Scholar] [CrossRef]
- Chang, T.C.; Chen, K.S. Testing process quality of wire bonding with multiple gold wires from viewpoint of producers. Int. J. Prod. Res. 2019, 57, 5400–5413. [Google Scholar] [CrossRef]
- Anderson, N.C.; Kovach, J.V. Reducing welding defects in turnaround projects: A lean six sigma case study. Qual. Eng. 2014, 26, 161–168. [Google Scholar] [CrossRef]
- Gijo, E.V.; Scaria, J. Process improvement through Six Sigma with Beta correction: A case study of manufacturing company. Int. J. Adv. Manuf. Technol. 2014, 71, 717–730. [Google Scholar] [CrossRef]
- Shafer, S.M.; Moeller, S.B. The effects of Six Sigma on corporate performance: An empirical investigation. J. Oper. Manag. 2012, 30, 521–532. [Google Scholar] [CrossRef]
- Boyles, R.A. The Taguchi capability index. J. Qual. Technol. 1991, 23, 17–26. [Google Scholar] [CrossRef]
- Claessen, J.H.T.; van Wijk, J.J. Flexible linked axes for multivariate data visualization. IEEE Trans. Vis. Comput. Graph. 2011, 17, 2310–2316. [Google Scholar] [CrossRef] [PubMed] [Green Version]
- Lin, Y.T.; Chang, T.C.; Chen, K.S. A novel approach to evaluating the performance of physical fitness by combining statistical inference with the radar chart. J. Test. Eval. 2018, 46, 1498–1507. [Google Scholar] [CrossRef]
- Wan, Y.; Cheng, K.; Liu, Z.; Ye, H. An investigation on machinability assessment of difficult-to-cut materials based on radar charts. Proc. Inst. Mech. Eng. Part. B J. Eng. Manuf. 2013, 227, 1916–1920. [Google Scholar] [CrossRef]
- Zhang, H.; Hou, Y.; Zhang, J.; Qi, X.; Wang, F. A new method for nondestructive quality evaluation of the resistance spot welding based on the radar chart method and the decision tree classifier. Int. J. Adv. Manuf. Technol. 2015, 78, 841–851. [Google Scholar] [CrossRef]
- Yu, C.M.; Lai, K.K.; Chen, K.S.; Chang, T.C. Process-quality evaluation for wire bonding with multiple gold wires. IEEE Access 2020, 8, 106075–106082. [Google Scholar] [CrossRef]
- Chen, K.S.; Chang, T.C.; Guo, Y.Y. Selecting an optimal contractor for production outsourcing: A case study of gear grinding. J. Chin. Inst. Eng. 2020, 43, 415–424. [Google Scholar] [CrossRef]
- Chen, K.S.; Yu, C.M.; Hsu, T.H.; Cai, S.R.; Chiou, K.C. A model for evaluating the performance of the bearing manufacturing process. Appl. Sci. 2019, 9, 3105. [Google Scholar] [CrossRef] [Green Version]
- Chen, K.S.; Wang, C.H.; Tan, K.H.; Chiu, S.F. Developing one-sided specification Six-Sigma fuzzy quality index and testing model to measure the process performance of fuzzy information. Int. J. Prod. Econ. 2019, 208, 560–565. [Google Scholar] [CrossRef]
- Chen, K.S.; Chang, T.C. Construction and fuzzy hypothesis testing of Taguchi Six Sigma quality index. Int. J. Prod. Res. 2020, 58, 3110–3125. [Google Scholar] [CrossRef]
- Chen, K.S.; Chang, T.C. A fuzzy approach to determine process quality for one-sided specification with imprecise data. Proc. Inst. Mech. Eng. Part. B J. Eng. Manuf. 2020, 234, 1198–1206. [Google Scholar] [CrossRef]
- Luo, W.J.; Chen, K.S.; Yu, C.M.; Hsu, T.H. The fuzzy process quality evaluation model for the STB quality characteristic of machining. Appl. Sci. 2020, 10, 8272. [Google Scholar] [CrossRef]
- Pearn, W.L.; Chen, K.S.; Lin, G.H. A generalization of clements’ method for non-normal pearsonian processes with asymmetric tolerances. Int. J. Qual. Reliab. Manag. 1999, 16, 507–521. [Google Scholar] [CrossRef] [Green Version]
- Chen, K.S. Two-tailed Buckley fuzzy testing for operating performance index. J. Comput. Appl. Math. 2019, 361, 55–63. [Google Scholar] [CrossRef]
- Chen, K.S. Fuzzy testing decision-making model for intelligent manufacturing process with Taguchi capability index. J. Intell. Fuzzy Syst. 2020, 38, 2129–2139. [Google Scholar] [CrossRef]
- Lee, T.S.; Wang, C.H.; Yu, C.M. Fuzzy Evaluation Model for Enhancing E-Learning Systems. Mathematics 2019, 7, 918. [Google Scholar] [CrossRef] [Green Version]
- Chen, K.S. Fuzzy testing of operating performance index based on confidence intervals. Ann. Oper. Res. 2019. [CrossRef]
- Yu, C.M.; Chen, K.S.; Lai, K.K.; Hsu, C.H. Fuzzy supplier selection method based on smaller-the-better quality characteristic. Appl. Sci. 2020, 10, 3635. [Google Scholar] [CrossRef]
- Chen, K.S.; Yu, C.M. Fuzzy test model for performance evaluation matrix of service operating systems. Comput. Ind. Eng. 2020, 140, 106240. [Google Scholar] [CrossRef]
- Wu, M.F.; Chen, H.Y.; Chang, T.C.; Wu, C.F. Quality evaluation of internal cylindrical grinding process with multiple quality characteristics for gear products. Int. J. Prod. Res. 2019, 57, 6687–6701. [Google Scholar] [CrossRef]
Figure 1.
Membership function with vertical line .

Figure 2.
Critical region on a radar chart.


Table 1.
The capability level and corresponding index values.
| Capability Level | Index Values |
|---|---|
| Inadequate | 1.00 |
| Capable | 1.00 1.33 |
| Satisfactory | 1.33 1.50 |
| Excellent | 1.50 2.00 |
| Superb | 2.00 |
Table 2.
Important quality characteristics and corresponding evaluation index values after the gear inner hole grinding.
Table 2.
Important quality characteristics and corresponding evaluation index values after the gear inner hole grinding.
| Tolerance Type | h | Specification Limit | Evaluation Index |
|---|---|---|---|
| one-sided | 1 | = 0.010 | |
| one-sided | 2 | = 0.050 | |
| one-sided | 3 | = 0.600 | |
| two-sided | 4 | = 29.012 | |
| two-sided | 5 | = 28.988 |
Remark: unit um.
Table 3.
The values of .
| Sample Mean () | Sample Standard Deviation () | ||
|---|---|---|---|
| = 0.0070 | = 0.00075 | = 1.333 | = 1.644 |
| = 0.0390 | = 0.00310 | = 1.183 | = 1.468 |
| = 0.4550 | = 0.03650 | = 1.324 | = 1.634 |
| = 29.002 | = 0.00250 | = 1.333 | = 1.644 |
| = 29.002 | = 0.00250 | = 1.867 | = 2.268 |
Publisher’s Note: MDPI stays neutral with regard to jurisdictional claims in published maps and institutional affiliations. |
© 2021 by the authors. Licensee MDPI, Basel, Switzerland. This article is an open access article distributed under the terms and conditions of the Creative Commons Attribution (CC BY) license (https://creativecommons.org/licenses/by/4.0/).
Share and Cite
MDPI and ACS Style
Lo, W.; Yang, C.-M.; Lai, K.-K.; Li, S.-Y.; Chen, C.-H. Developing a Novel Fuzzy Evaluation Model by One-Sided Specification Capability Indices. Mathematics 2021, 9, 1076. https://doi.org/10.3390/math9101076
AMA Style
Lo W, Yang C-M, Lai K-K, Li S-Y, Chen C-H. Developing a Novel Fuzzy Evaluation Model by One-Sided Specification Capability Indices. Mathematics. 2021; 9(10):1076. https://doi.org/10.3390/math9101076
Chicago/Turabian StyleLo, Wei, Chun-Ming Yang, Kuei-Kuei Lai, Shao-Yu Li, and Chi-Han Chen. 2021. "Developing a Novel Fuzzy Evaluation Model by One-Sided Specification Capability Indices" Mathematics 9, no. 10: 1076. https://doi.org/10.3390/math9101076
Note that from the first issue of 2016, this journal uses article numbers instead of page numbers. See further details here.