
A Photovoltaic-Fed DC-Bus Islanded Electric Vehicles Charging System Based on a Hybrid Control Scheme


1
Faculty of Science and Engineering, Swansea University, Fabian Way, Swansea SA1 1EP, UK
2
Centre for Advanced Low Carbon, Coventry University, Coventry CV1 5FB, UK
3
Department of Electrical and Computer Engineering, University of Texas at Austin, Austin, TX 78712, USA
*
Author to whom correspondence should be addressed.
Electronics 2021, 10(10), 1142; https://doi.org/10.3390/electronics10101142
Submission received: 29 March 2021
/
Revised: 7 May 2021
/
Accepted: 7 May 2021
/
Published: 11 May 2021
(This article belongs to the Special Issue Power Management and Control of Microgrid with Distributed and Renewable Energy Sources)
Abstract
:Electric vehicle (EV) charging stations fed by photovoltaic (PV) panels allow integration of various low-carbon technologies, and are gaining increasing attention as a mean to locally manage power generation and demand. This paper presents novel control schemes to improve coordination of an islanded PV-fed DC bus EV charging system during various disturbances, including rapid changes of irradiance, EV connection and disconnection, or energy storage unit (ESU) charging and discharging. A new hybrid control scheme combining the advantages of both master–slave control and droop control is proposed for a charging station supplying 20 EVs for a total power of 890 kW. In addition, a three-level (3L) boost converter with capacitor voltage balance control is designed for PV generation, with the aim to provide high voltage gain while employing a small inductor. The control techniques are implemented in a simulation environment. Various case studies are presented and analysed, confirming the effectiveness and stability of the control strategies proposed for the islanded charging system. For all tested conditions, the operating voltage is maintained within 5% of the rated value.
1. Introduction
The transportation sector is one of the main contributors to Greenhouse Gas (GHG) emissions [1]. Following the introduction of Electric Vehicles (EVs), it is expected that an effective de-carbonization of the transportation section will take place in the next decades, thus contributing to the achievement of the targets stated in the Paris Agreement [2]. However, with the rapidly increasing number of EVs, the demand for charging facilities is expected to increase, thus posing a further burden to the electricity grid, which in many countries is already constrained. This phenomenon is further aggravated by the uncontrolled and random charging patterns of EVs [3] and by the increasing deployment of fast charging approaches [4], drawing high power from the grid for short periods [5].
The establishment of distributed generation based on renewable energy sources (RESs) is a practical solution to the challenges described above, as it will allow local generation of electricity to charge the EVs. RESs have gained popularity [6] following the drop in semiconductor price in the last two decades [7]. Among RESs, solar energy is a promising generating source for both grid-connected [8,9] and off-grid applications [10,11].
As DC sources, PV arrays can be directly connected to a DC-bus system [12]. Compared with the more common AC configuration, the benefits of a dc-bus system include the following [7,13]:
- Lower energy conversion losses when the system includes dc sources such as PVs, dc loads such as EVs, and energy storage units (ESUs).
- Reduced cost and lower number of power electronics devices.
- No need to consider synchronization with the utility grid and reactive power management.
Given the above advantages, the literature shows a growing interest in PV-fed dc fast-charging stations. A typical PV-fed dc bus charging station is comprised of PV arrays, EV chargers, ESUs and various DC–DC power converters that connect each component to a common dc bus. The bus is either connected to the grid (grid-connected mode—in this case, a DC–AC converter is required) or disconnected from the grid (off-grid or islanded mode) [14]. An islanded charging station can provide charging facilities for tourists or long-distance travellers in remote locations with a lack of infrastructure. In this mode, the bus voltage is regulated by the ESU. Various projects employing AC off-grid charging stations have been deployed. For example, a 1.0 MW off-grid PV system started to operate in Bamyan, Afghanistan in 2014 [15]. In Australia, the world’s largest off-grid solar project, a 10.6 MW PV plant with 6 MW battery was completed in 2016, which reduces the customer’s total diesel consumption by approximately 20% [16]. Robben Island, a world heritage site, also has been isolated from the mainland’s power grid from 2017, supplied by a 666.4 kW solar PV and battery storage microgrid [17].
The existing literature for PV-fed DC charging systems mainly contributes to system design [18,19,20], vehicle-to-grid (V2G) operations [21,22], energy management [23,24,25], and minimization of electricity bills in smart homes [26]. However, these strategies are considered at a high level over a long timescale, thus they cannot cope with sudden system disturbance such as fast irradiance changes.
To fill this gap, [27] proposes a sliding-mode control to regulate the DC=bus output voltage fast dynamic response, but EVs and ESU coordination is not mentioned. The work presented in [28] introduces a coordinated control to avoid over-charging and over-discharging of the ESU in islanded mode. However, transient PV generation disruption, which may cause insufficient EV charging power, thus affecting system stability, is not considered.
A decentralized control method to coordinate PV generation and ESU charging/discharging is proposed in [29]. The authors use a droop control-based scheme on the ESU side and an adaptive power control method on the PV generators side. In [29], the EV chargers are shown in a simplified form and not regarded as part of the coordination, hence the impact of any outages from the EV side is not analysed.
Based on the summary above, it can be concluded that the existing decentralized control strategies for islanded DC bus EV charging systems mainly deal with PV-ESU coordination [30], while the complete PV-ESU-EV coordination study is still absent. Additionally, short-term and fast disturbances are not fully analysed. Table 1 summarises the main characteristic of the works reported above.
This paper proposes novel hybrid control schemes for coordinating PV arrays, EVs and ESU. These control schemes include master–slave and droop controls to maintain system stability and improve operation under numerous operating conditions. A three-level (3L) boost converter [31] is designed for PV generation to provide high efficiency. The proposed techniques are implemented in Simulink/Simscape Power Systems. Various cases are presented and analysed.
2. System Description
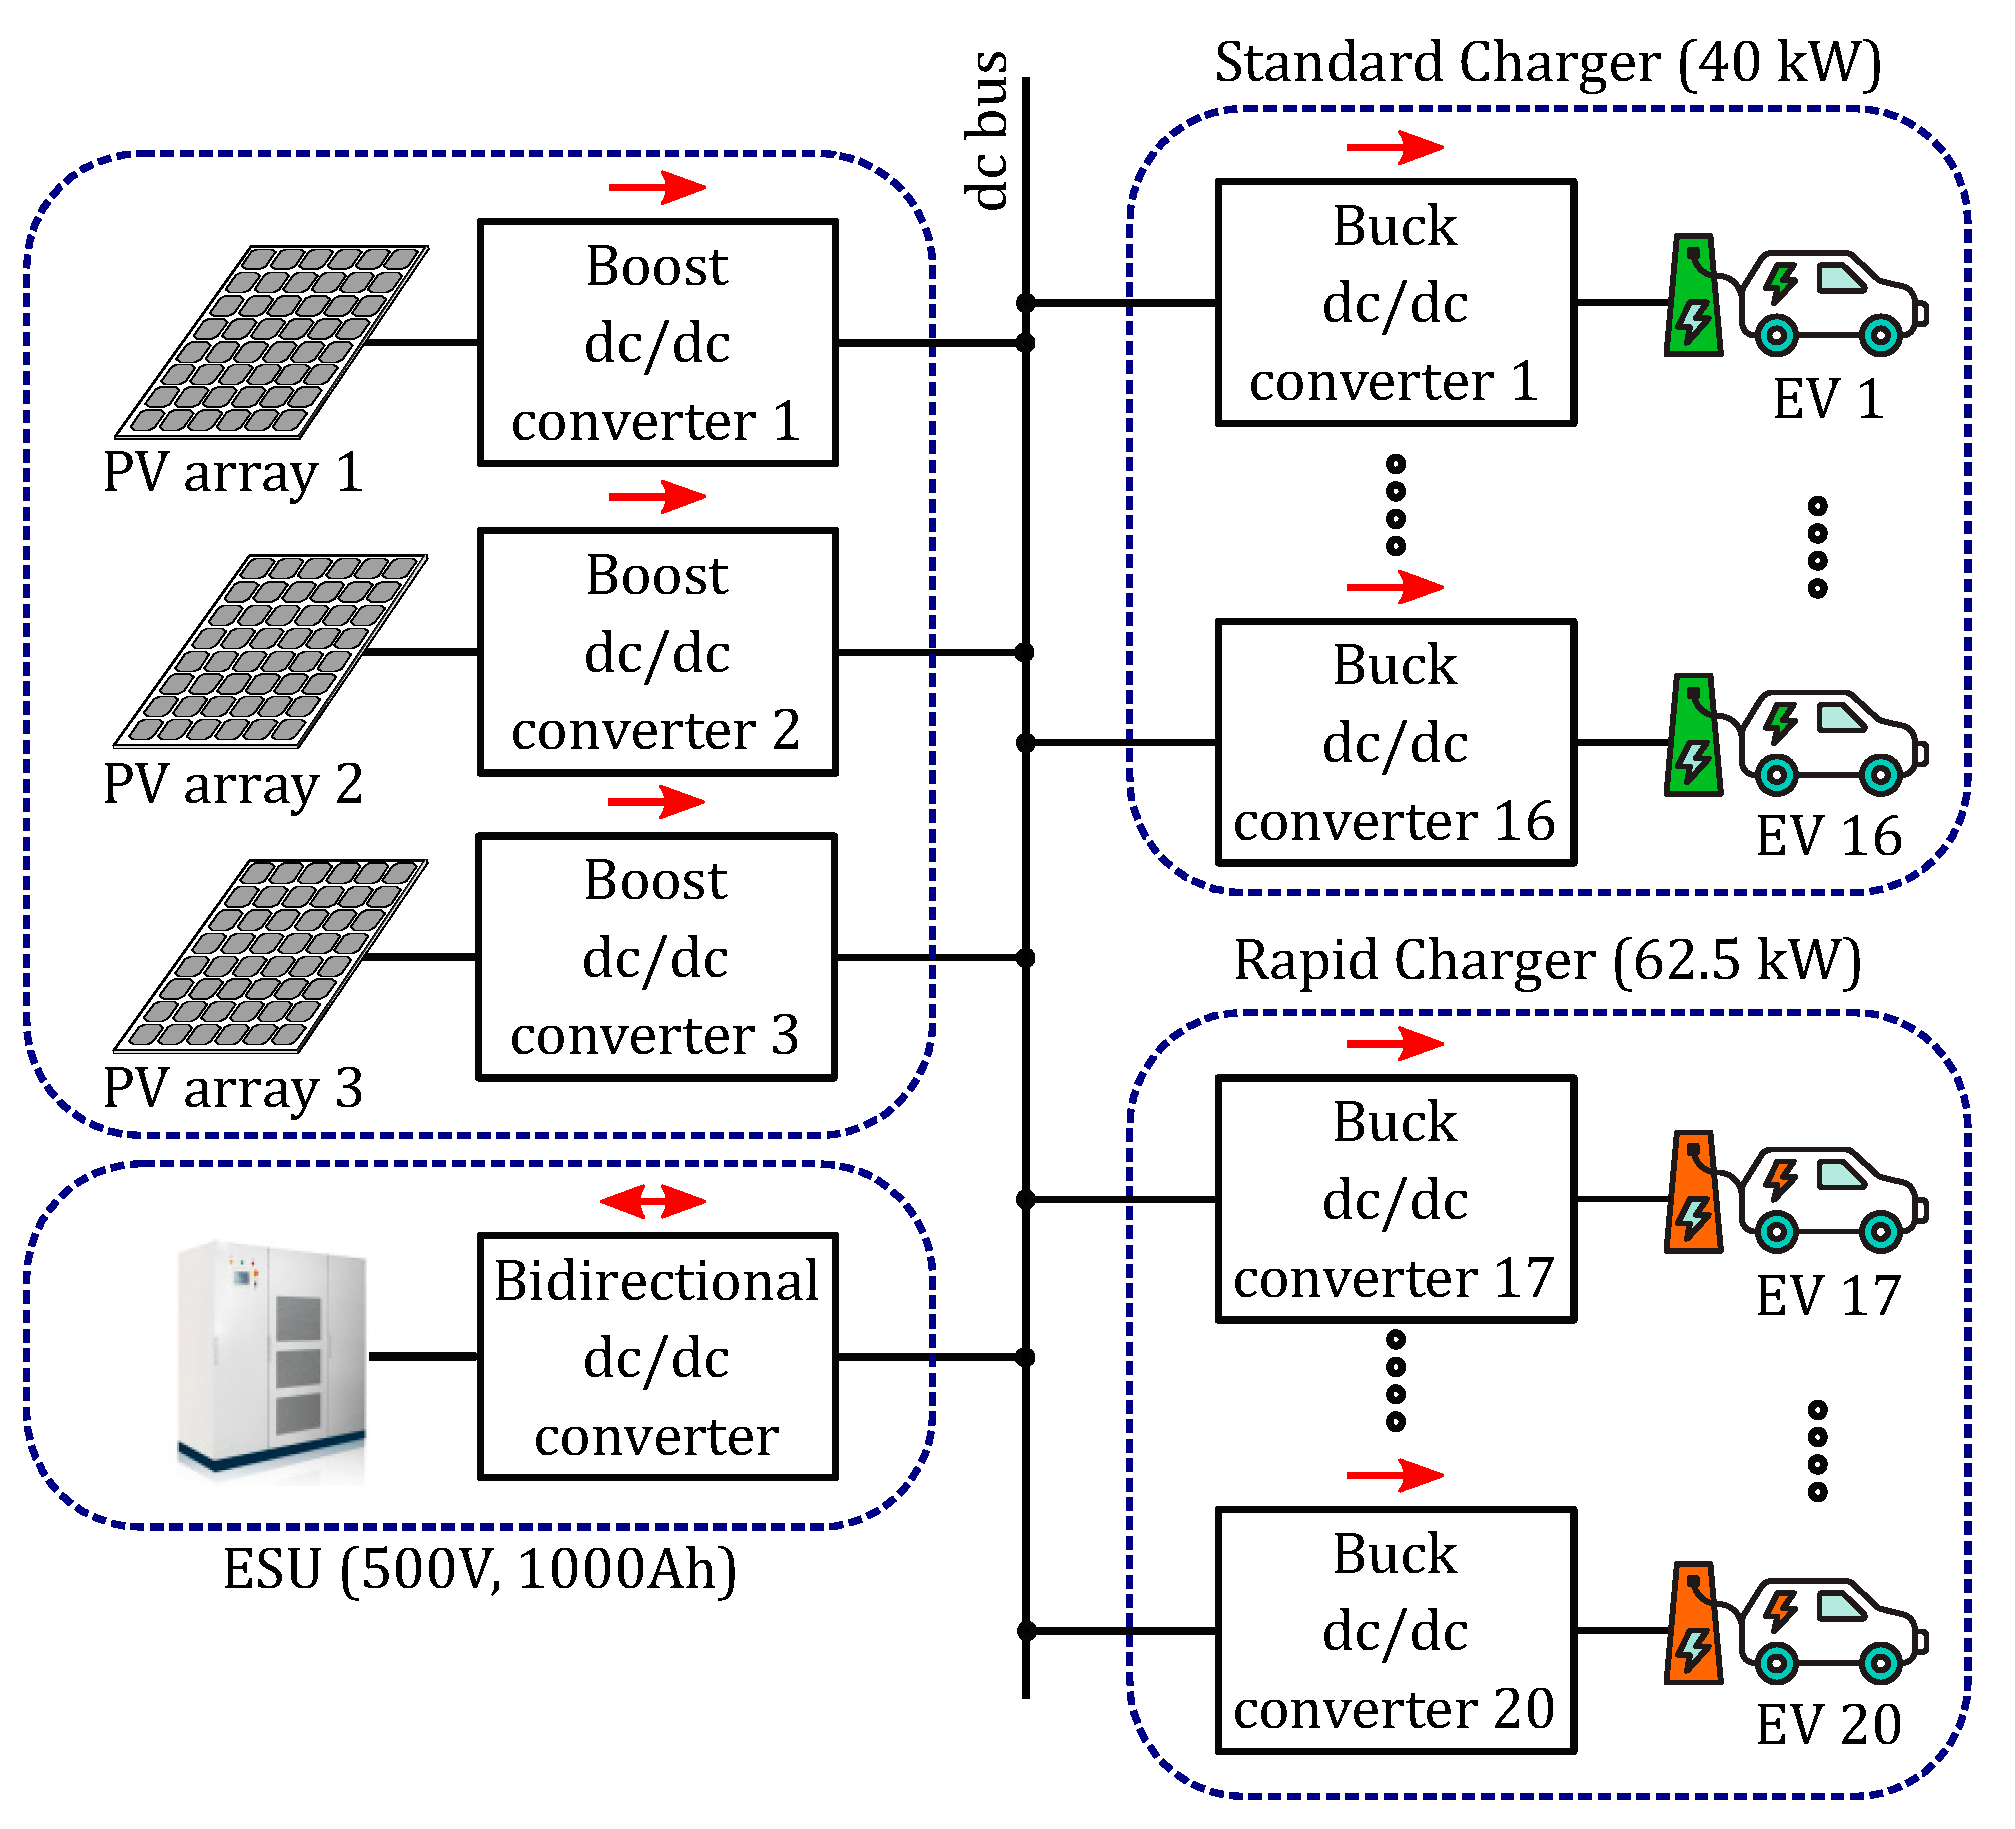
The overview of the PV-fed DC-bus EV charging station architecture considered in this work is shown in Figure 1. The charging station is designed to charge up to 20 EVs simultaneously: four rapid chargers (62.5 kW) and 16 standard chargers (40 kW). The total power demand for the station is approximately 890 kW.
The power supply consists of three PV arrays connected to the DC bus by means of three 3L boost converters. The arrays are connected in a 14 × 90 structure, for a total of 3780 modules. Each module is rated = 280 W, and therefore the PV system can generate up to 1.06 MW.
An ESU is included to store or release energy, and to ensure that the DC bus voltage is maintained close to the nominal value under varying operating conditions.
2.1. PV System
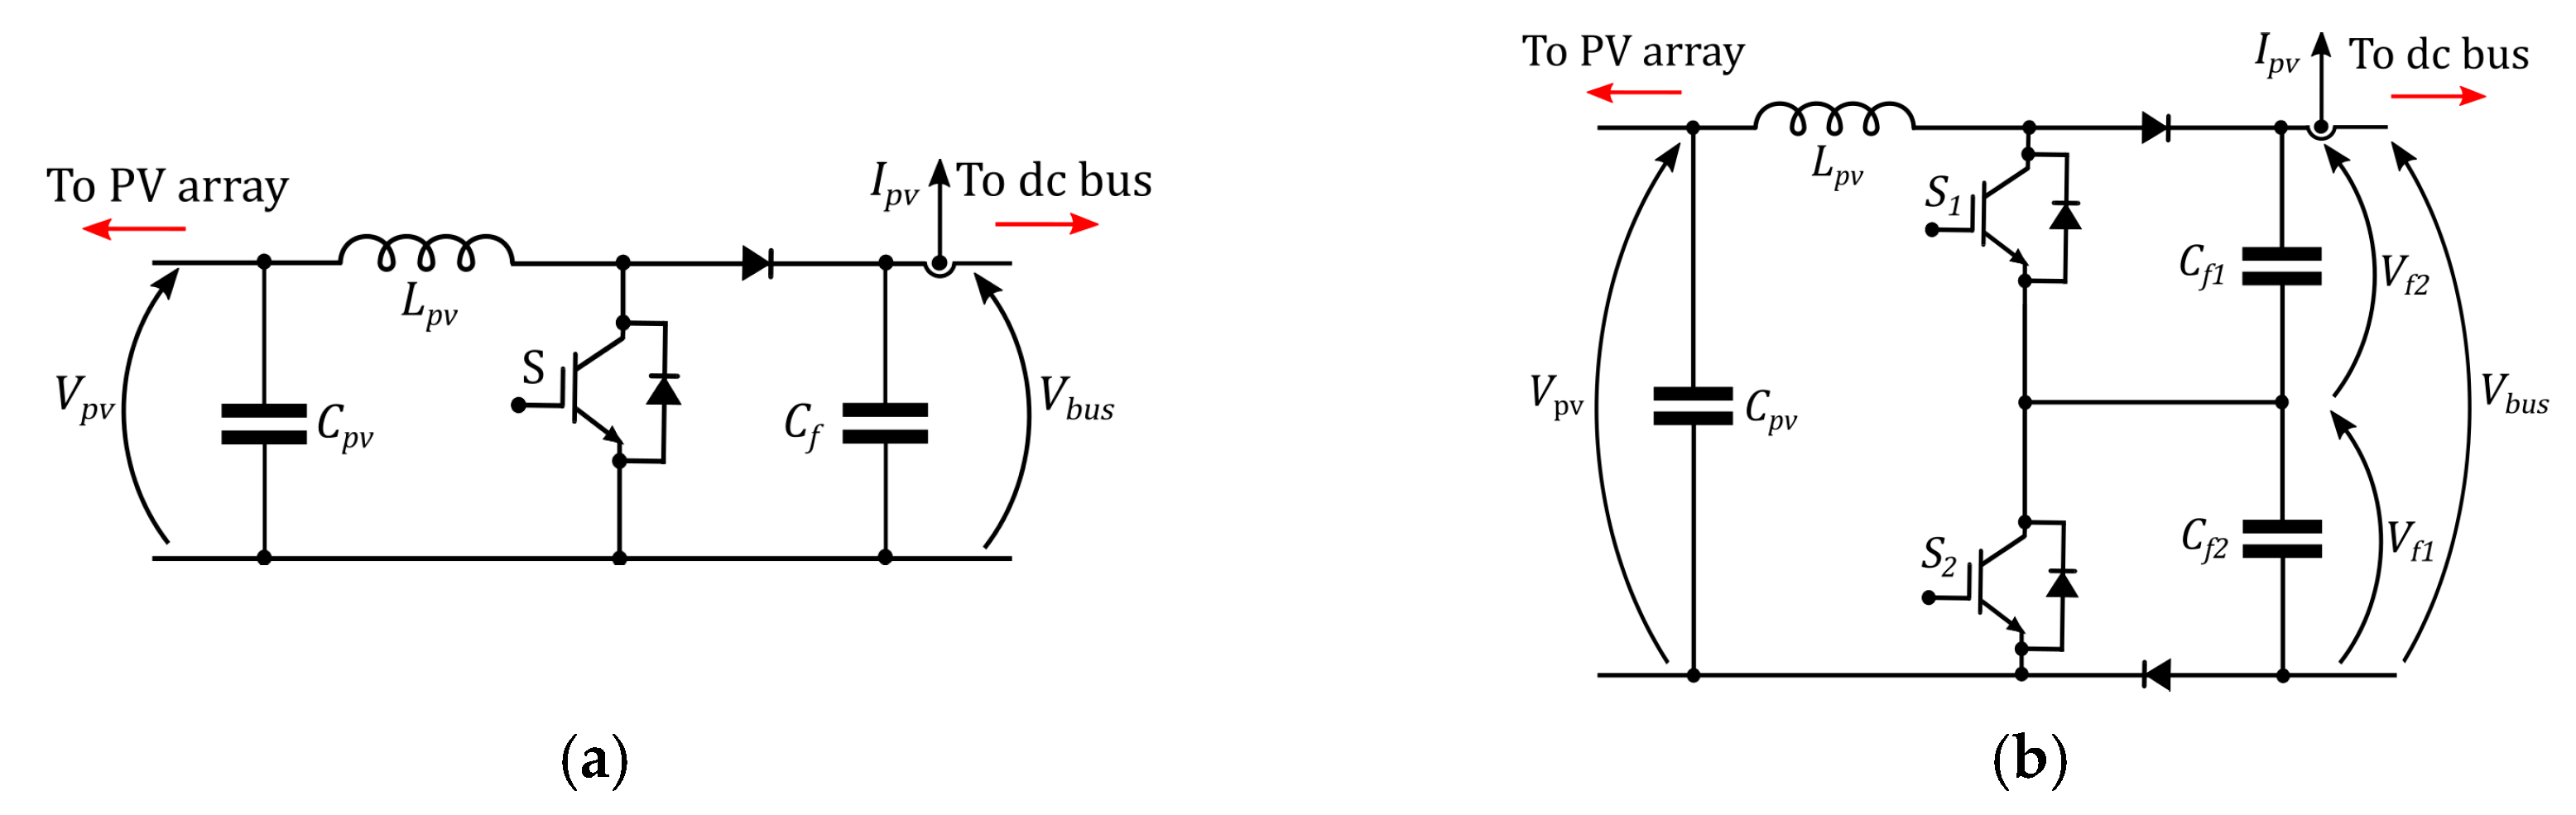
The conventional two-level (2L) boost converter used for PV generation is shown in Figure 2a: the low voltage side () is connected to the PV array and the high voltage side () is connected to the DC bus. This design causes power losses due mostly to the inductor : these losses are amplified in high power density and low voltage applications such as EV charging stations. Hence, an improved boost converter design is necessary for the PV system to reduce losses. A 3L-boost converter, shown in Figure 2b, is adopted to provide higher efficiency [31]. It consists of an inductor, two insulated-gate bipolar transistors (IGBTs) with anti-parallel connected diodes, two capacitors and two diodes. Compared with a conventional two-level boost converter, this topology requires half rated voltage for the switches and the capacitor. Additionally, it provides double voltage gain but requires a quarter of the inductance compared to the 2L converter, as shown in the following subsections.
2.1.1. Voltage Gain
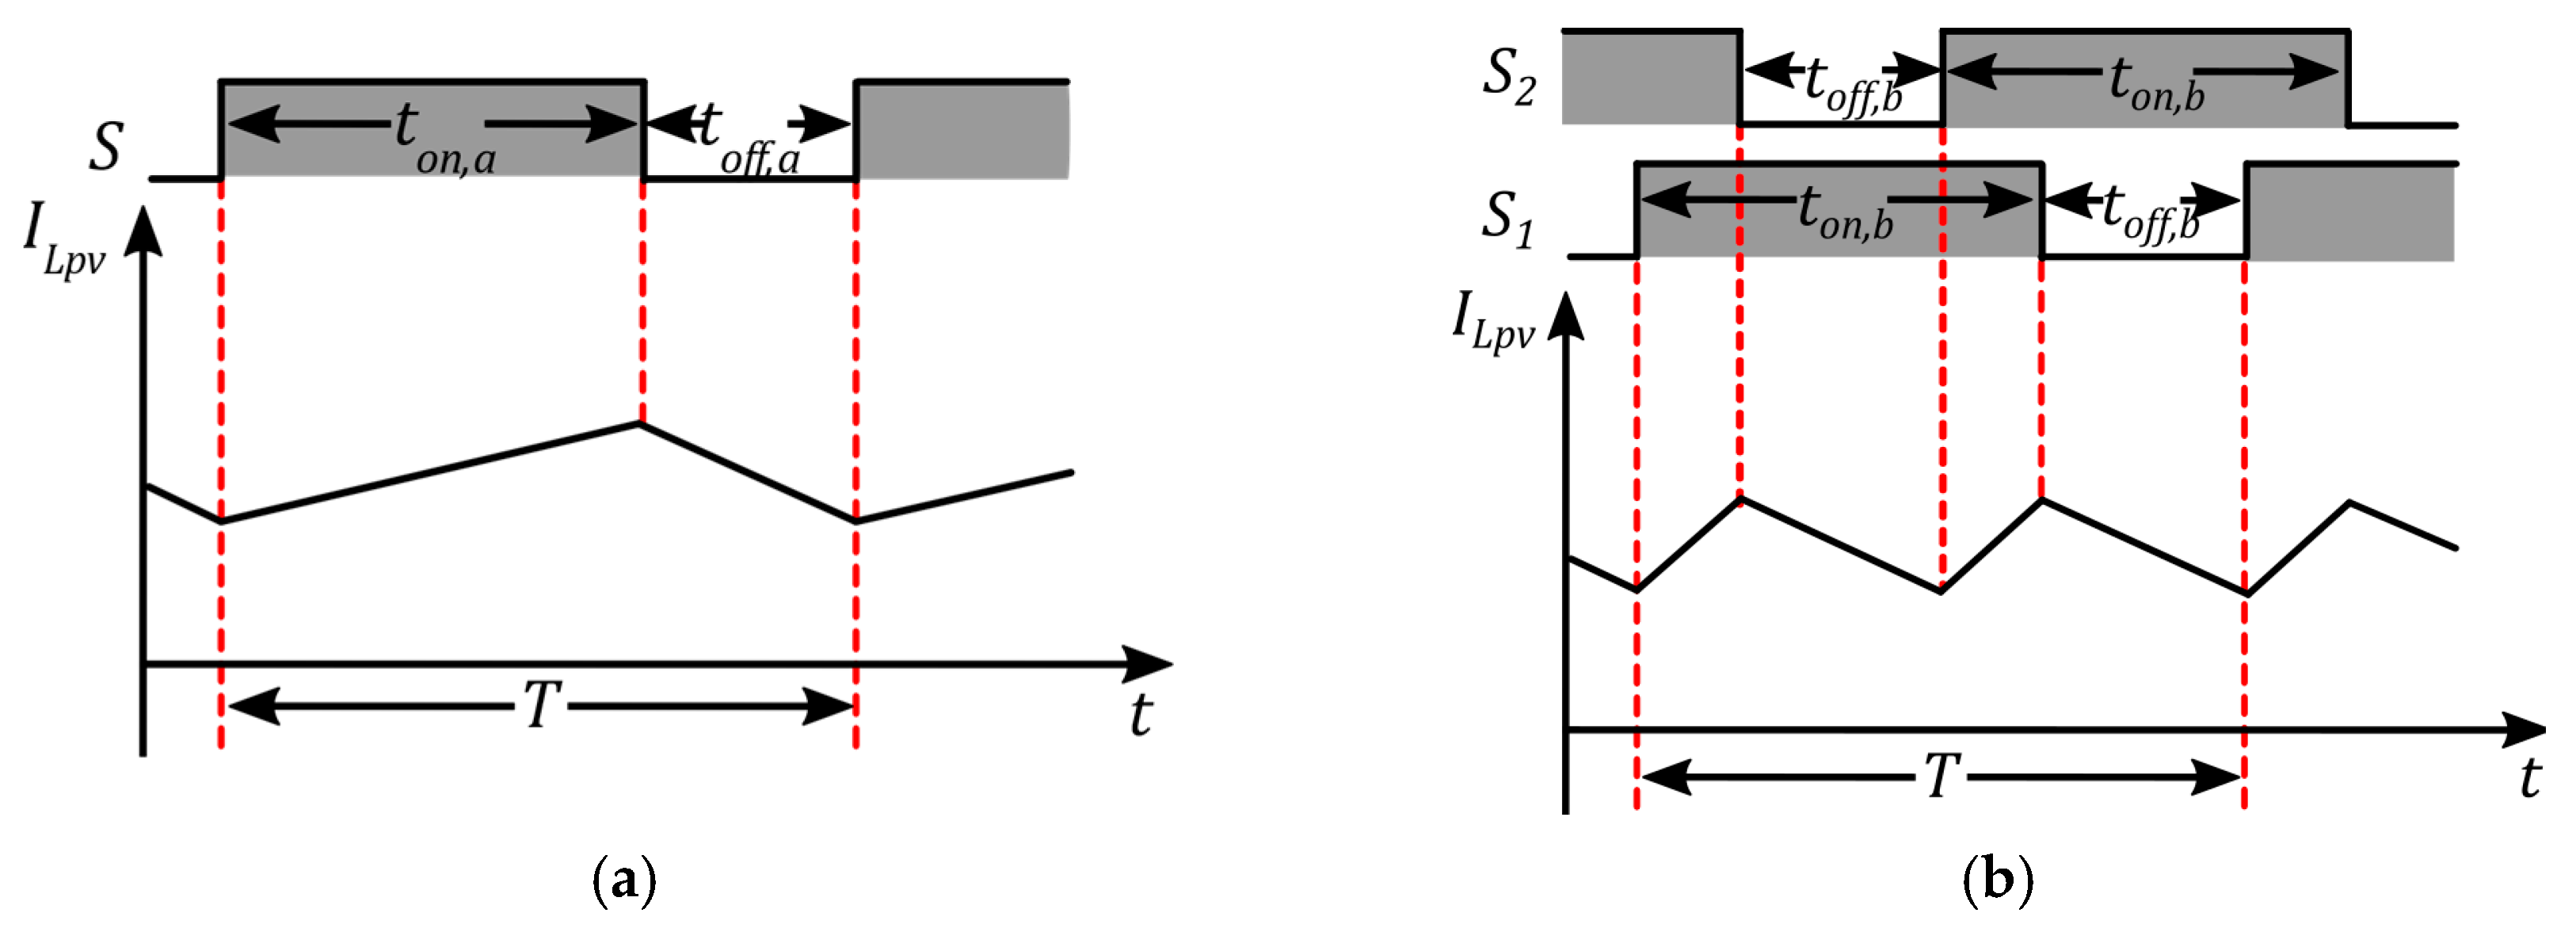
Figure 3 shows the switching states and corresponding inductor current of the two topologies described above (2L and 3L). Since, in steady-state, the time integral of the inductor voltage over one cycle must be zero, the voltage gain [32] of the standard 2L boost converter is calculated as follows (Figure 3a):
where is the PV array terminal voltage, is the main DC bus voltage, is the switch switching-on time and is switching-off time, is a full-cycle time and is the duty ratio, defined as /.
For the 3L boost converter, the integral is calculated over half cycle, and the voltage gain is calculated as follows (Figure 3b):
where the switching-on time is defined as , the switching-off time is , and the duty ratio is .
By comparing (2) and (4), it can be concluded that the voltage gain of the 3L boost converter is double of the 2L converter, with same duty ratio.
2.1.2. Inductor Size
The boost converter output current ripple is related to the inductor size. The conventional 2L boost converter inductance is calculated as [32]:
Therefore, when , the ripple is the highest () and the corresponding inductance is:
Similarly, the 3L boost converter inductance is calculated as follows:
In this case, when the ripple is at maximum value and the corresponding inductance is:
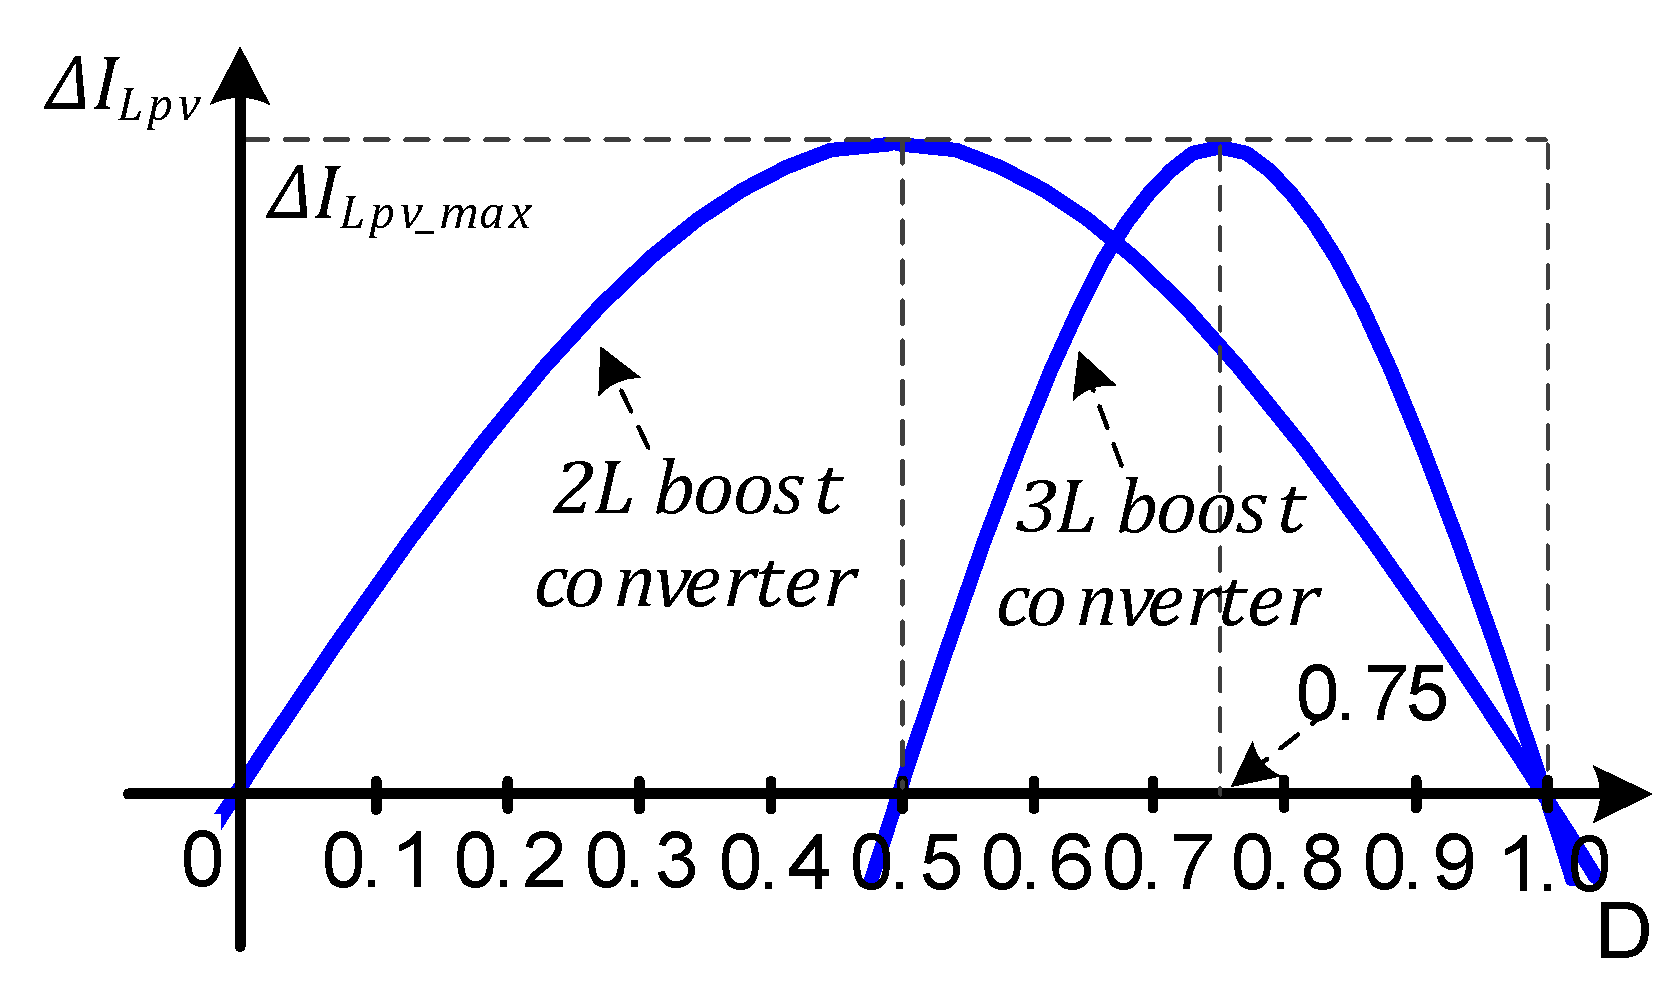
The characteristic waveforms of the two converters inductance current ripples versus duty ratio are shown in Figure 4. If the maximum inductor current ripple for the two converters is the same, the corresponding duty ratios are and , respectively. Substituting these values in (10) and (7), one can verify that the inductance of the 3L boost converter is a quarter of the 2L boost converter—thus saving on space, cost, and losses.
2.2. EV Charger and ESU Converter
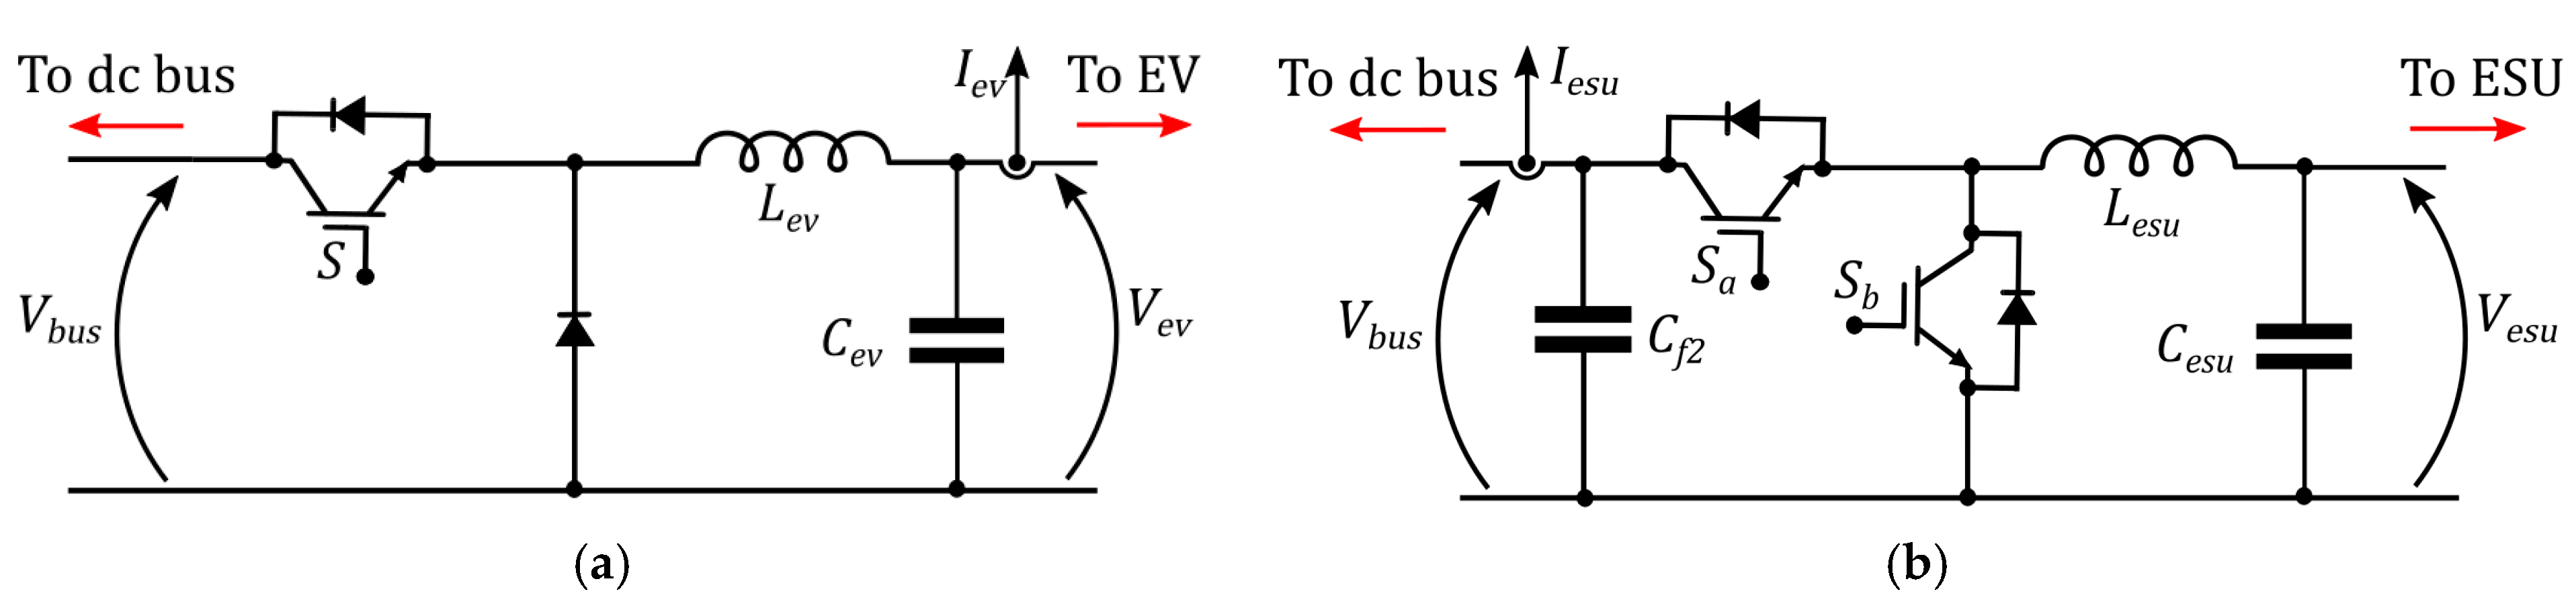
The power converters adopted for the EV charger and the ESU converter are shown in Figure 5. They are based on standard converters (i.e., buck converter for EVs and bidirectional DC–DC converter for the ESU), in order to reduce computational effort and highlight the whole system coordination control from grid operation point of view.
The EV charger is the buck converter shown in Figure 5a. It includes a semiconductor switch, a diode, an inductor and a capacitor. The main functions of the charger are to interface the DC bus to the EV battery terminals and to regulate the charging current according to the different charging speed requirements and standards. In this paper, two EV charger technologies are considered: the standard charger, limited to 80 A, and the fast charger, limited to 125 A.
The ESU includes a standard bi-directional DC–DC converter and a battery. The converter consists of two switches ( and ), two capacitors and an inductor, as shown in Figure 5b. works as active switch for buck mode, while for boost mode becomes active; two anti-parallel diodes are also connected to the switches to provide a path for the inductor current while the switches are off.
3. Control System Design
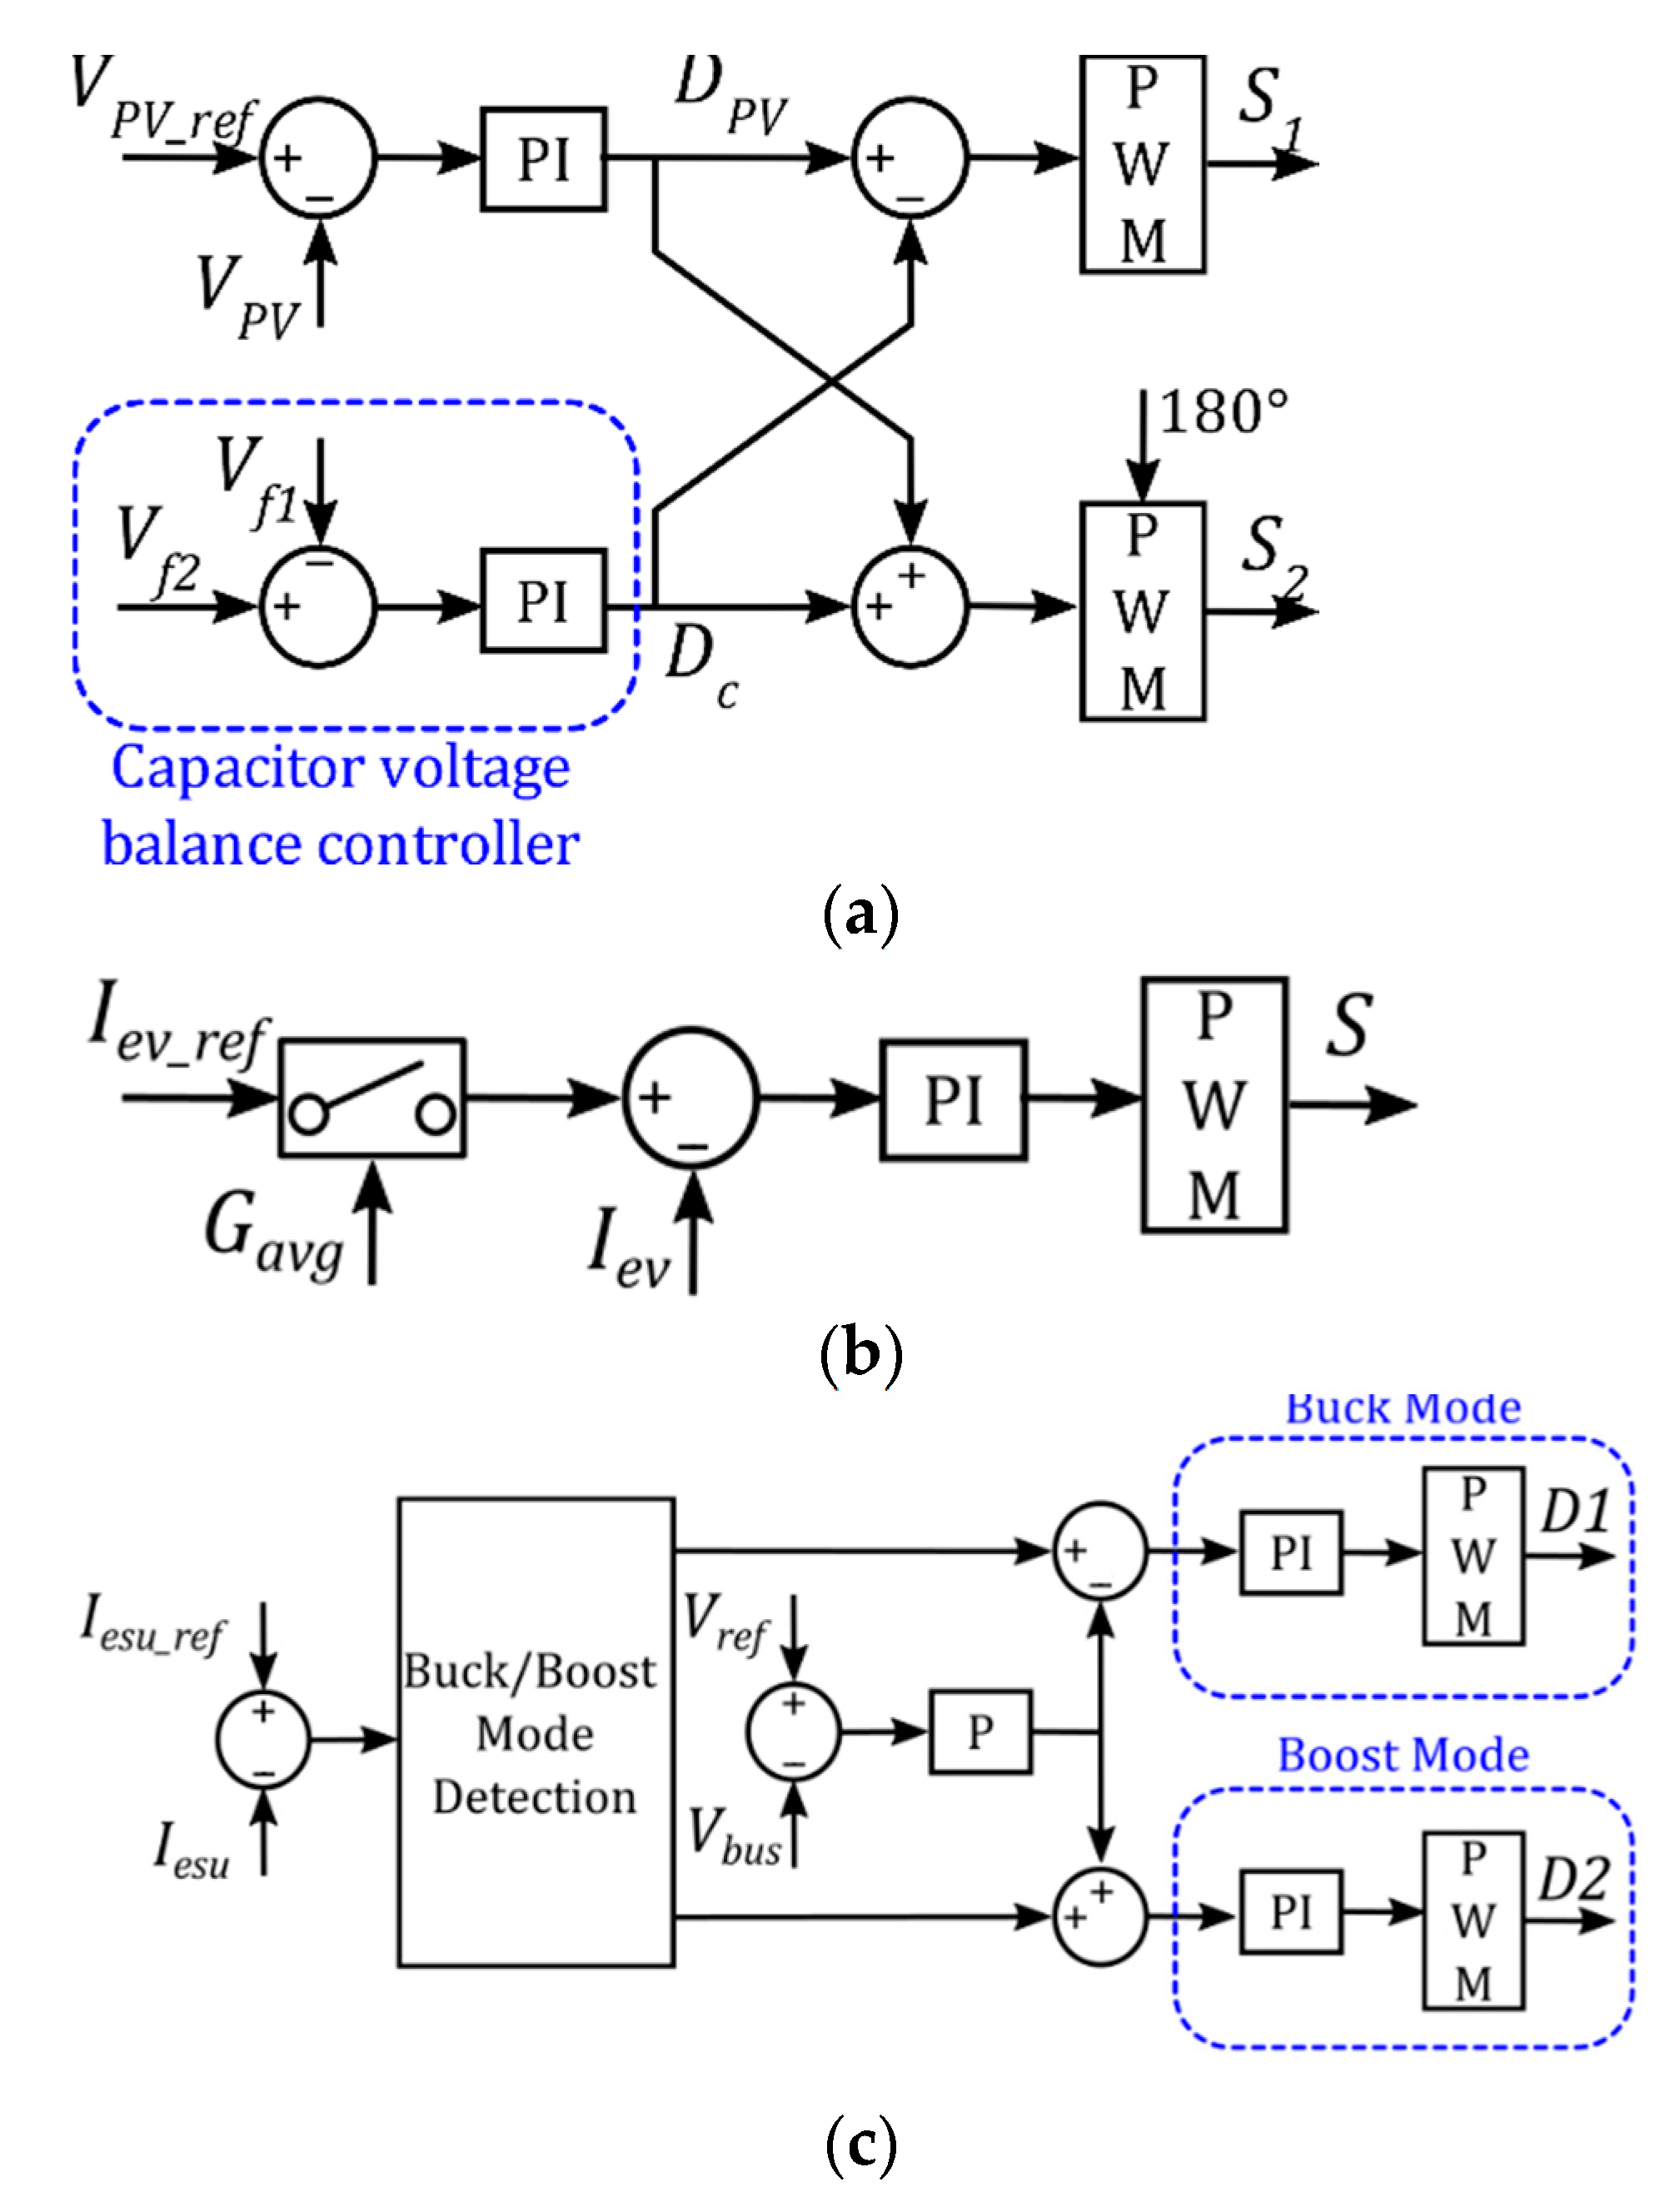
The control of the above system includes three main algorithms: PV system control, EV charging control, and ESU bi-directional charging/discharging control. The three algorithms are shown in Figure 6 and will be described in the next subsections.
3.1. PV System Control
The PV system control, shown in Figure 6a, is designed to regulate the array terminal voltage via the 3L boost converter and to extract maximum power from the PV arrays. The converter requires balancing of the two capacitor voltages and two 180° phase-shifted carrier signals to control the upper switch and the lower switch, respectively [33].
The reference voltage is obtained from one of the most commonly implemented MPPT algorithms, Perturb and Observe (P&O) [34]. The error term obtained as the difference between and is applied to a proportional-integral (PI) controller to generate the duty ratio for the 3L boost converter. This term is adjusted by the duty ratio generated from the capacitor voltage balance controller. In this way, the voltages of the upper and lower capacitors ( and ) are kept well balanced.
3.2. Charging/Discharging Control
The charging/discharging control is deployed in the 20 EV chargers and ESU converter. The EV charging control is shown in Figure 6b, and the reference charging current is . The controller contains a disable function depending on the average value of the solar irradiance . This function enables the EV chargers to coordinate with the ESU and limits the ESU discharging current. When falls below a certain level, the disable function is triggered. Subsequently, the EV charging current reference becomes zero and the charger is soft switching off from the DC bus. The number of disconnected EVs increases with dropping. In the proposed design, when reduces to zero, only two EV chargers are connected, and the rely on the ESU for charging. When the ESU reaches the minimum state-of-charge (SoC) level, and keeps being equal to zero, all EV chargers are switched off, until the PV arrays generate power again.
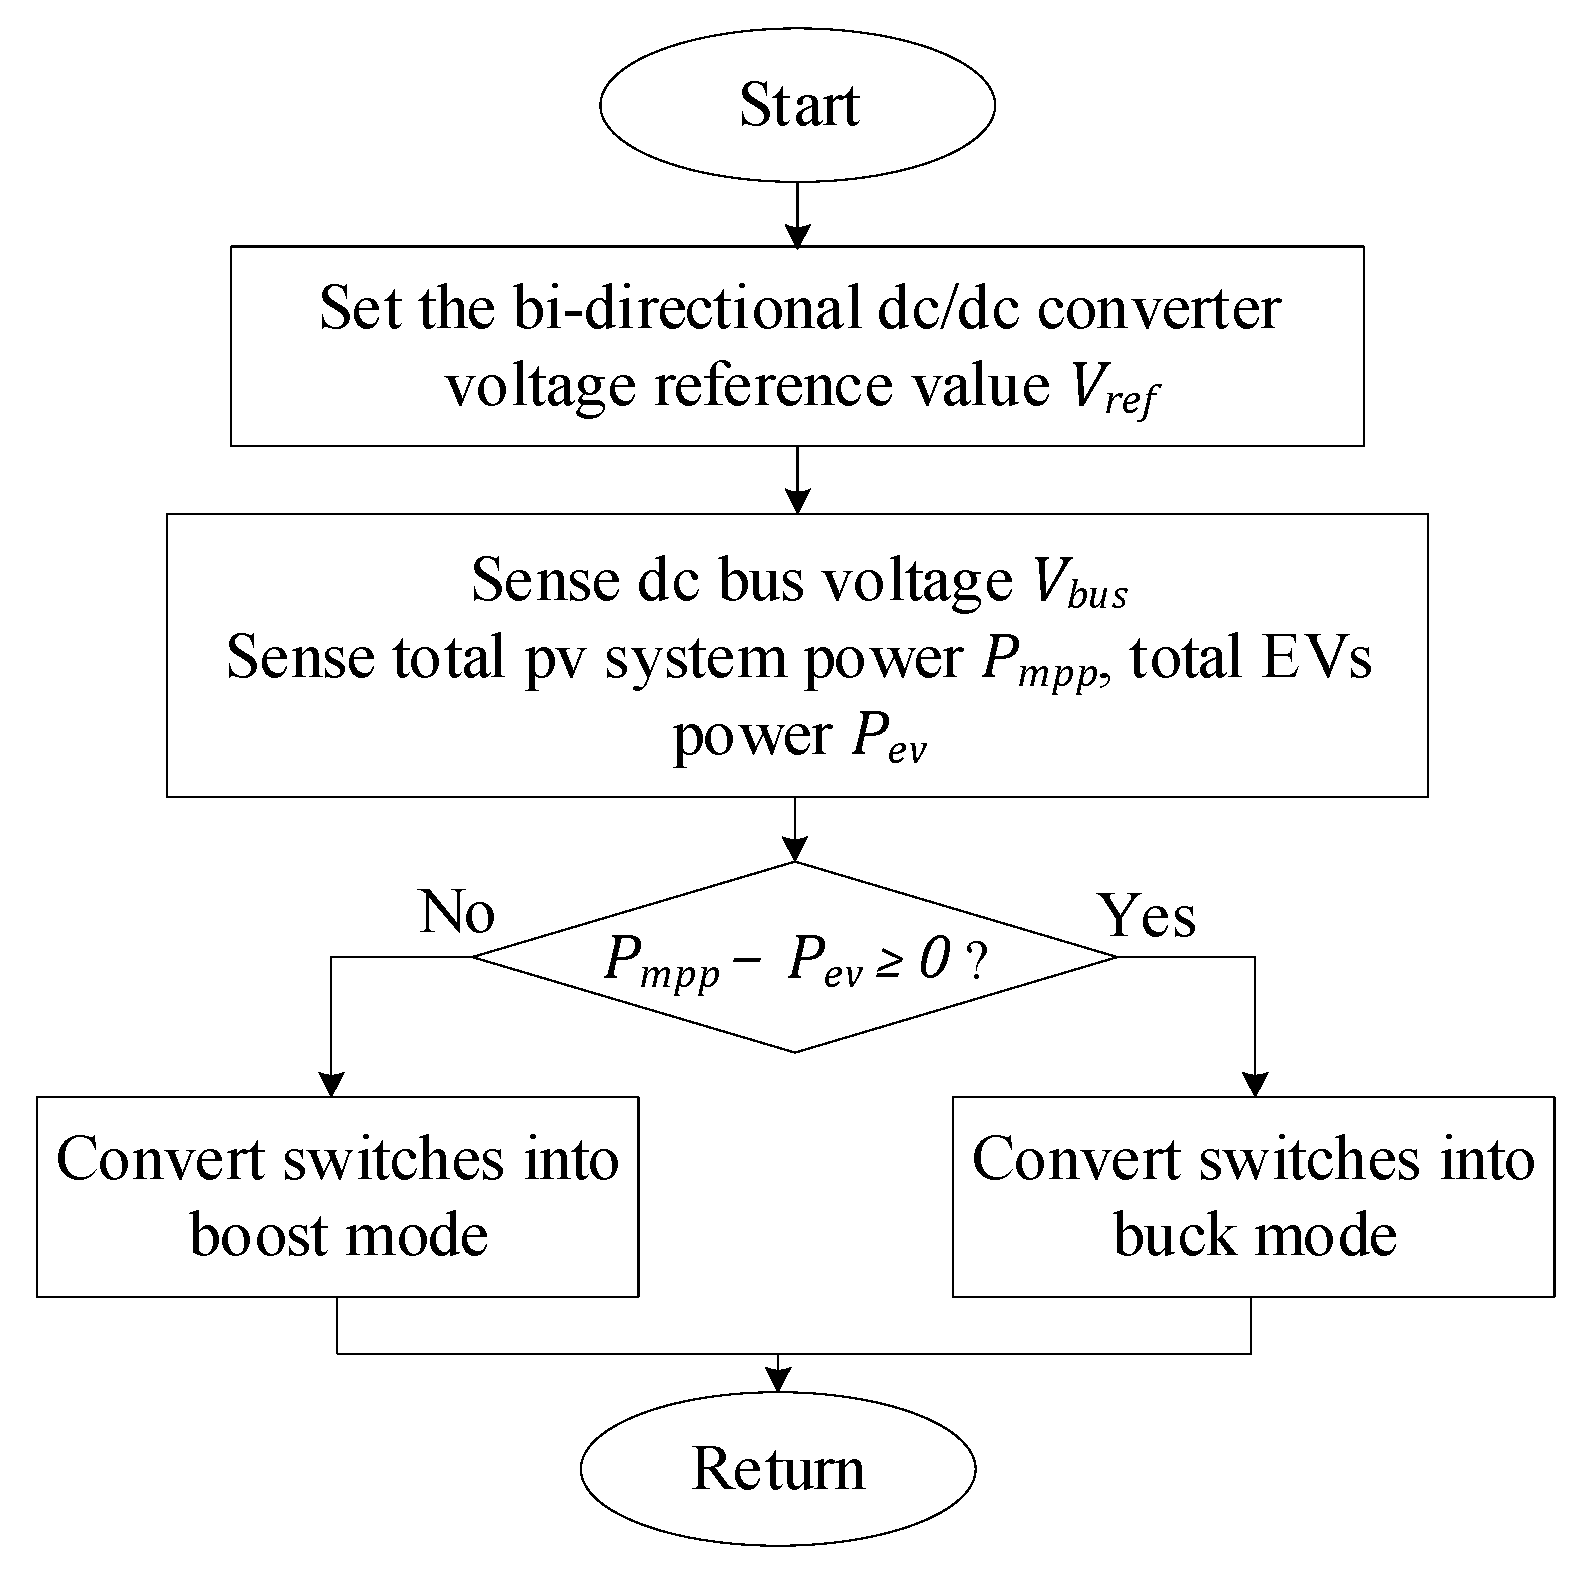
The ESU bi-directional DC–DC converter is controlled to ensure that the DC bus voltage is maintained at the nominal level. It can either work in buck mode to charge the battery, or in boost mode to discharge it. A control strategy has been designed to regulate switching between the two modes, as shown in Figure 7. After setting the reference voltage and monitoring the bus voltage and power in the system, the difference between the instantaneous power generated by the PVs ( and the power absorbed by the EVs ( is used to determine the converter operating model:
- : ESU in buck mode (charge)
- : ESU in boost mode (discharge)
A time delay equal to 0.1 s is added to the logic shown in Figure 7 to avoid changing the operating mode too frequently, which can damage the ESU battery.
Since the DC system is islanded from the grid, the three algorithms described above are not suitable for all operating conditions. More advanced control strategies are required to maintain system stability under fast-changing operating conditions, such as sudden disconnection of the ESU, or rapid change in PV generated power due to irradiance variation. Therefore, a hybrid control scheme is adopted to handle these transients and maintain coordination across all converters.
3.3. Hybrid Control
Although the control scheme described in the previous section provides accurate current sharing during both steady-state and transient conditions, the main drawback is that the stability and reliability of the entire system is highly dependent on the ESU. Therefore, the ESU cannot be switched off nor the current through it can be regulated when SoC falls below or rises above a certain value.
Furthermore, the proposed charging/discharging controller is only suitable for slow-changing conditions. When fast disturbances occur in the system, the EVs cannot connect/disconnect from the bus frequently in a short period of time because this operating mode may damage the EV batteries. Therefore, an additional control loop is required to cope with these sudden transients.
The aforementioned challenges can be overcome by adopting a droop-based control which exhibits flexible current sharing capabilities and high reliability. However, the inherent trade-off between current sharing and bus voltage regulation degrades the performance of the droop-based control scheme. To this end, a hybrid control scheme that exploits advantages from both droop and master–slave control methods is proposed.
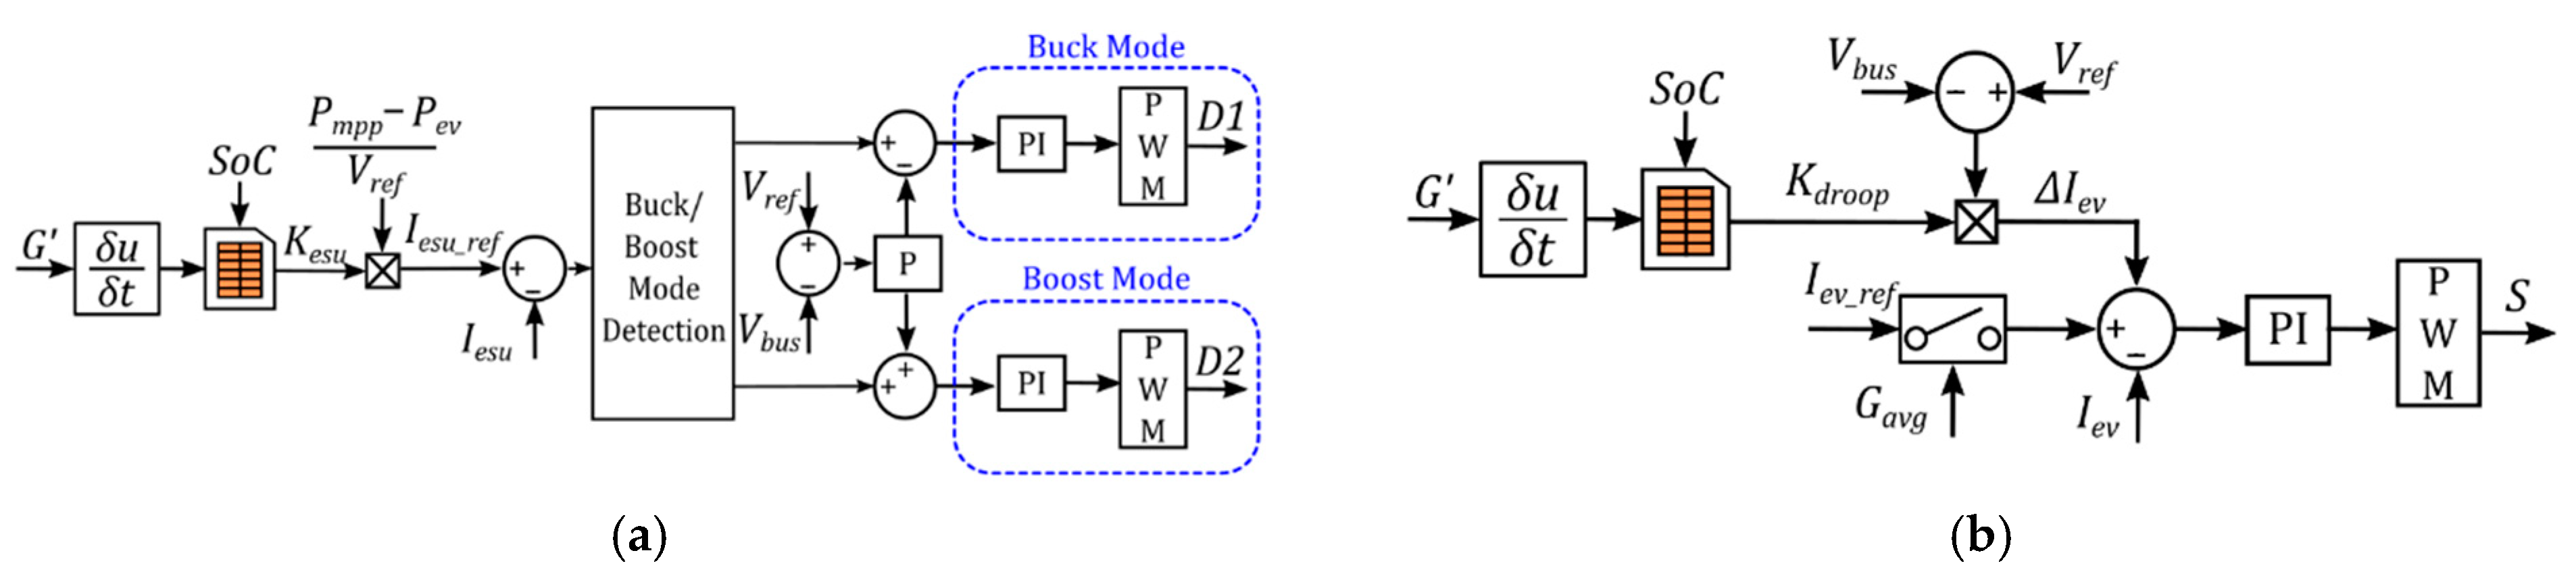
Figure 8a shows the modified ESU control system, which is adaptive to the rate of change in solar irradiance (), change in SoC, and change in demand. The modified storage current reference can be calculated as follows:
where represents the ESU droop gain, varying between 0 and 1. The droop gain is generated using a look-up table based on the levels of and SoC.
Figure 8b shows the modified EV control system, where all EV units are equipped with a voltage-based droop control structure and participate into the DC-bus voltage regulation. The output of the droop control can be expressed as follows:
where represents the EV adaptive droop gain and is calculated using the levels of and SoC.
The overall system operation can be described by the following control modes:
- Mode 1—Master-slave control: = 1, = 0 and & are within the defined limits: droop controls are disabled.
- Mode 2—Hybrid control: 0, 0 < and or falls outside the defined limits: droop controls are activated to provide better transient response.
- Mode 3—The ESU battery charging reaches its SoC limit (90%) and no EVs are connected. This mode leads to = 0 and < 1, and the PVs are disconnected from the bus to avoid the system to become unstable.
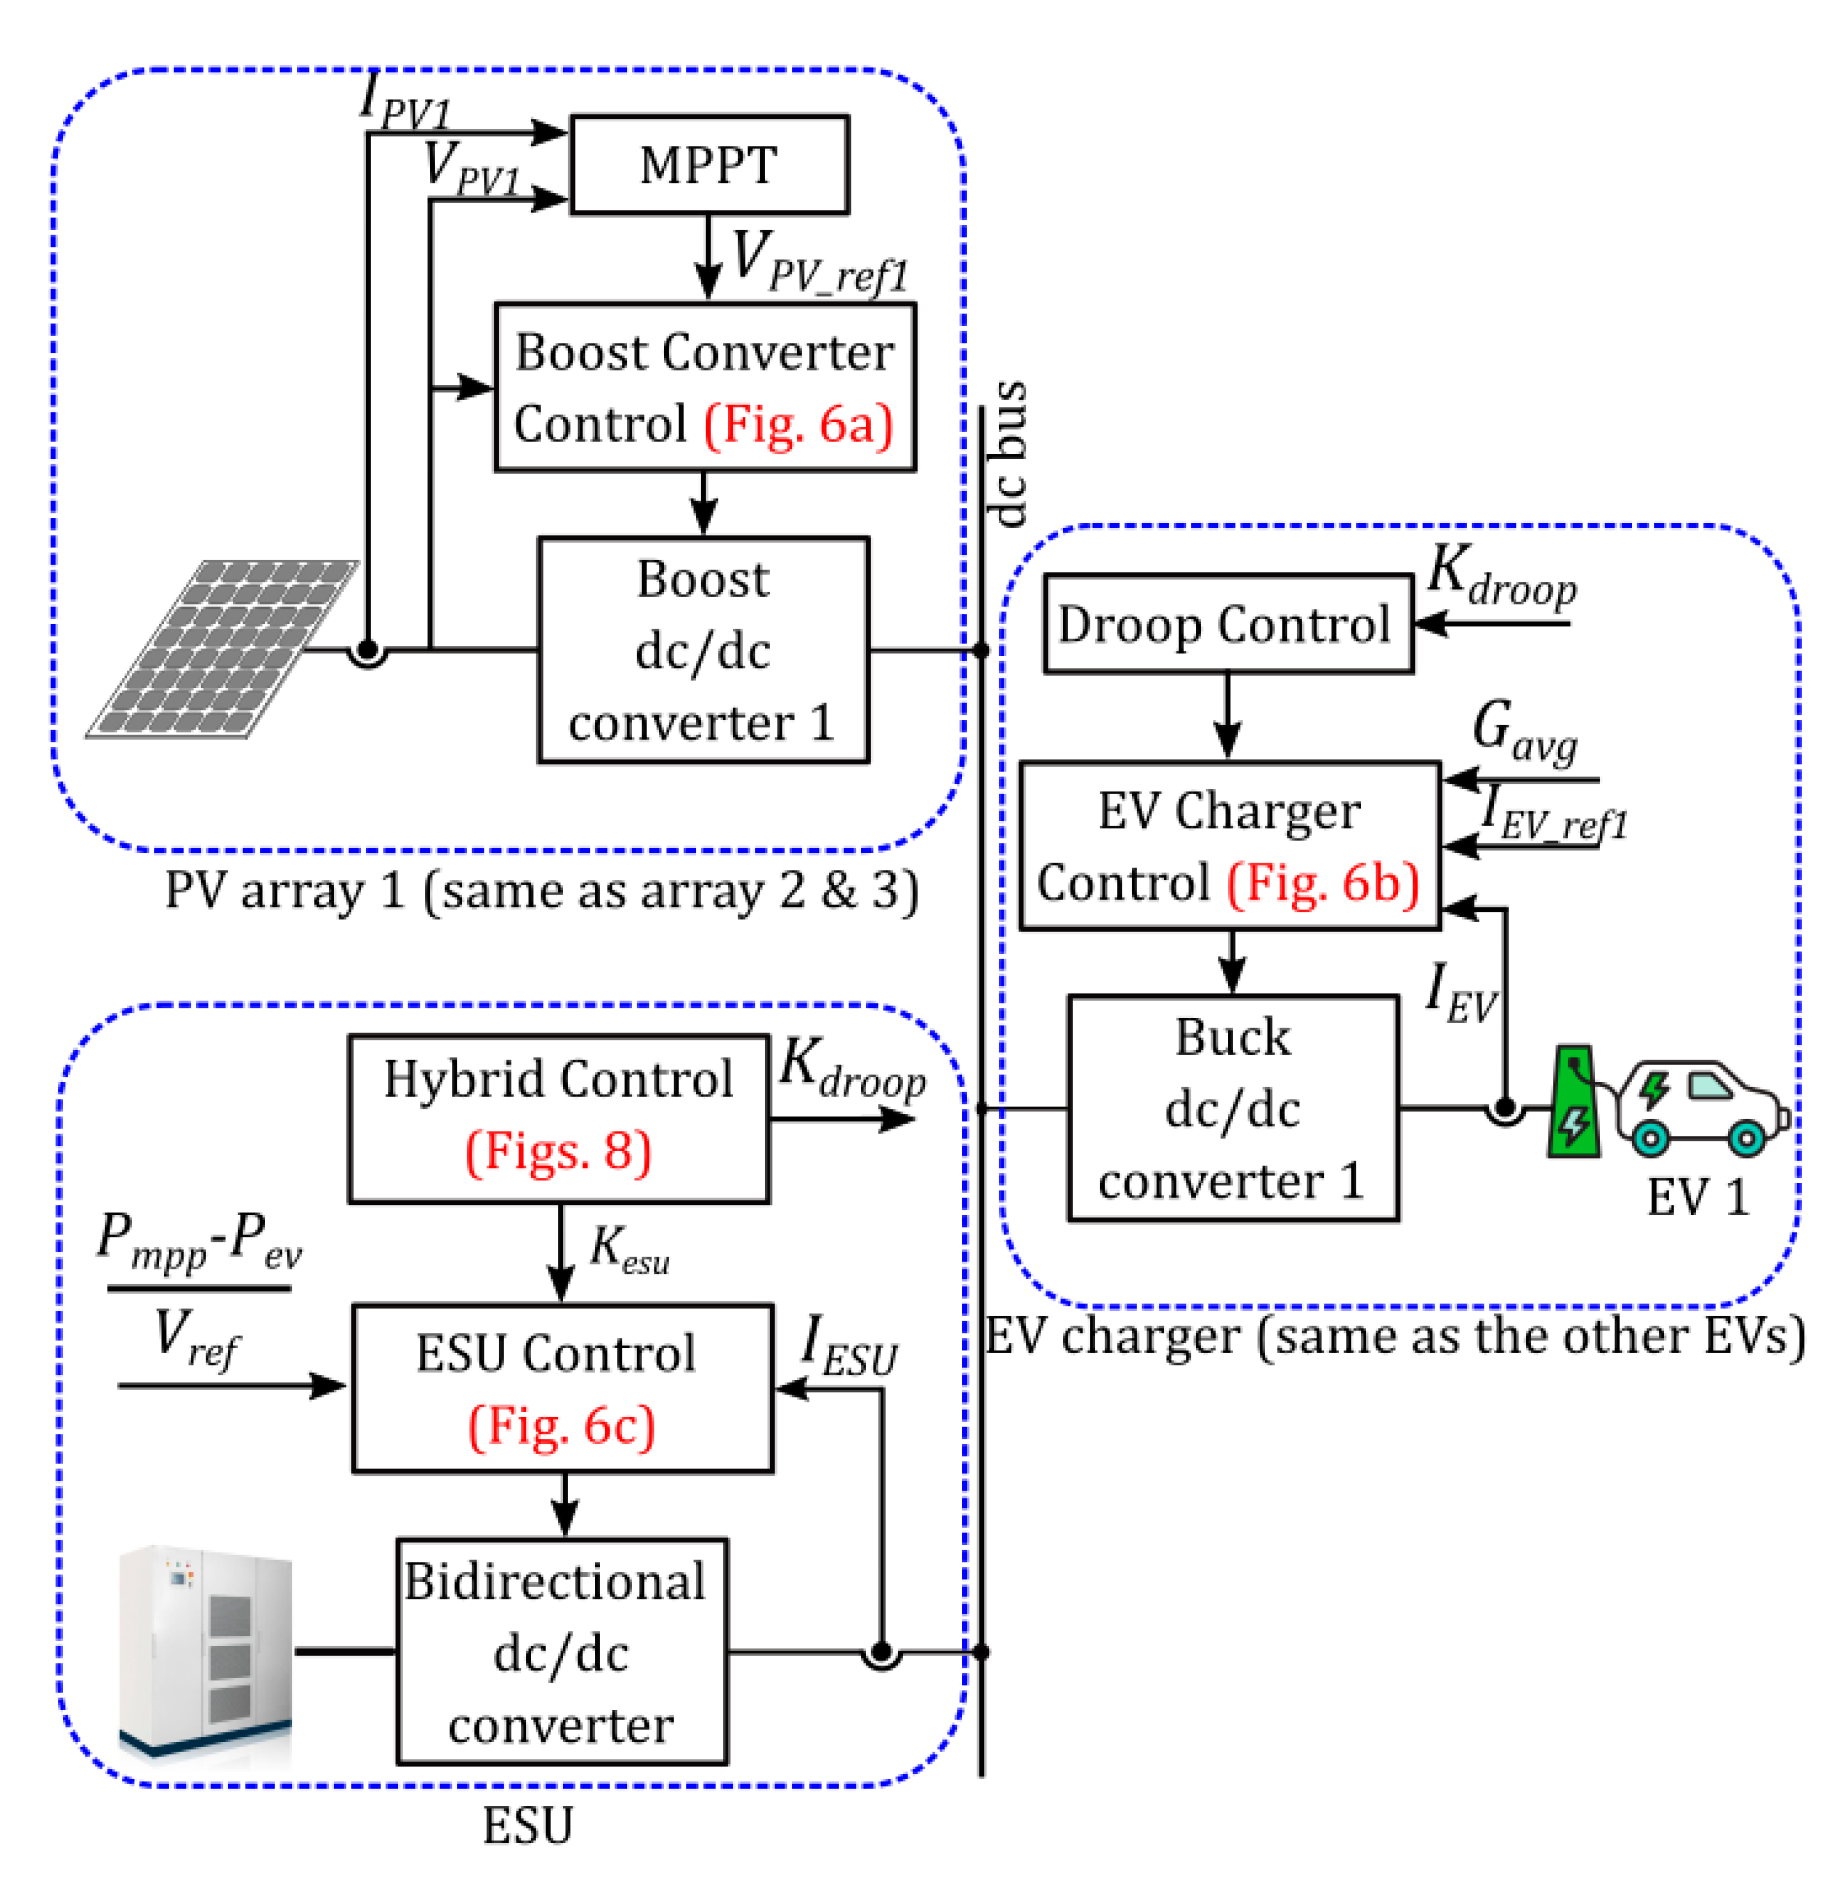
The charging station overall control strategies are shown in Figure 9, which comprises the three main control functions (PV system 3L boost converter control, EVs buck converter control with droop control, and the ESU converter control) and coordination between the ESU and EVs.
4. Simulation Results
To validate the effectiveness of the proposed control strategies, the system is implemented in Simulink/Simscape Power Systems. The system parameters are listed in Table 2. Simulation results are presented in this section for various operating conditions.
For all simulations, initially, the PV arrays generate the rated power, and no EVs are connected. Therefore, the power flows to the ESU. The 20 EVs connect to the DC bus between 1 and 2 s: although this connecting sequence is much faster than the one taking place in the real world, it is adopted to show the stability of the proposed control.
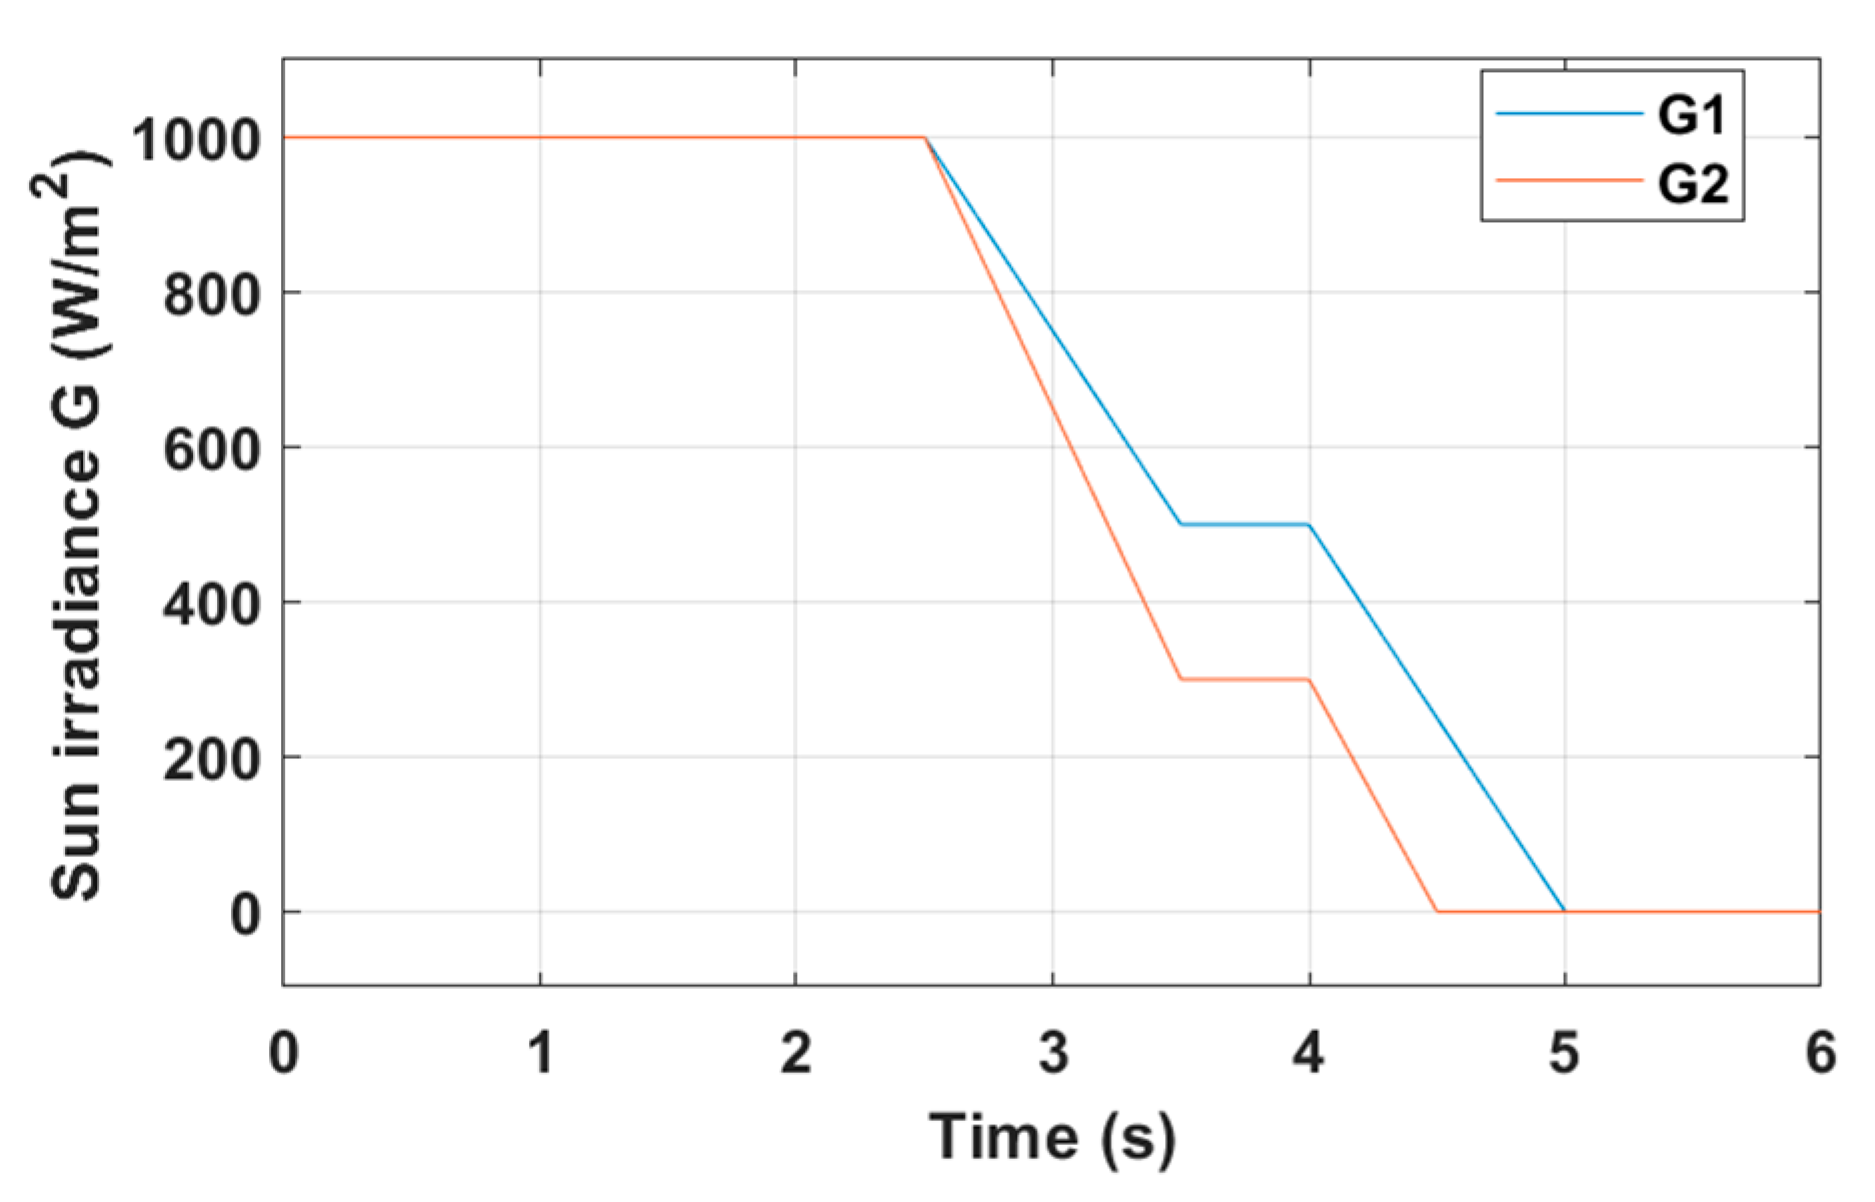
Two different solar irradiance profiles are considered, as shown in Figure 10. Solar irradiance G1 is 1 kW/m2 initially, and decreases to 500 W/m2 between 2.5 and 3.5 s, to further drop to 0 kW/m2 between 4 and 5 s. Solar irradiance G2 drops from 1 kW/m2 to 300 W/m2 between 2.5 and 3.5 s, and to 0 kW/m2 between 4 and 4.5 s. Furthermore, the initial SoC for the ESU is set to 40 %, where the nominal operating range is 30–70% [35].
4.1. Master–Slave Control Mode for Slow Irradiance Change
One of the most important factors affecting system stability is the rate of change in solar irradiance (. The following subsections will address the impact of this parameters for different irradiance profiles and applied to a varying number of PV panels.
4.1.1. Case 1: Single-Array Irradiance Changing according to G1
In this case, the irradiance of one of the three PV array power is changing according to G1, and the other two are constant at 1000 W/m2.
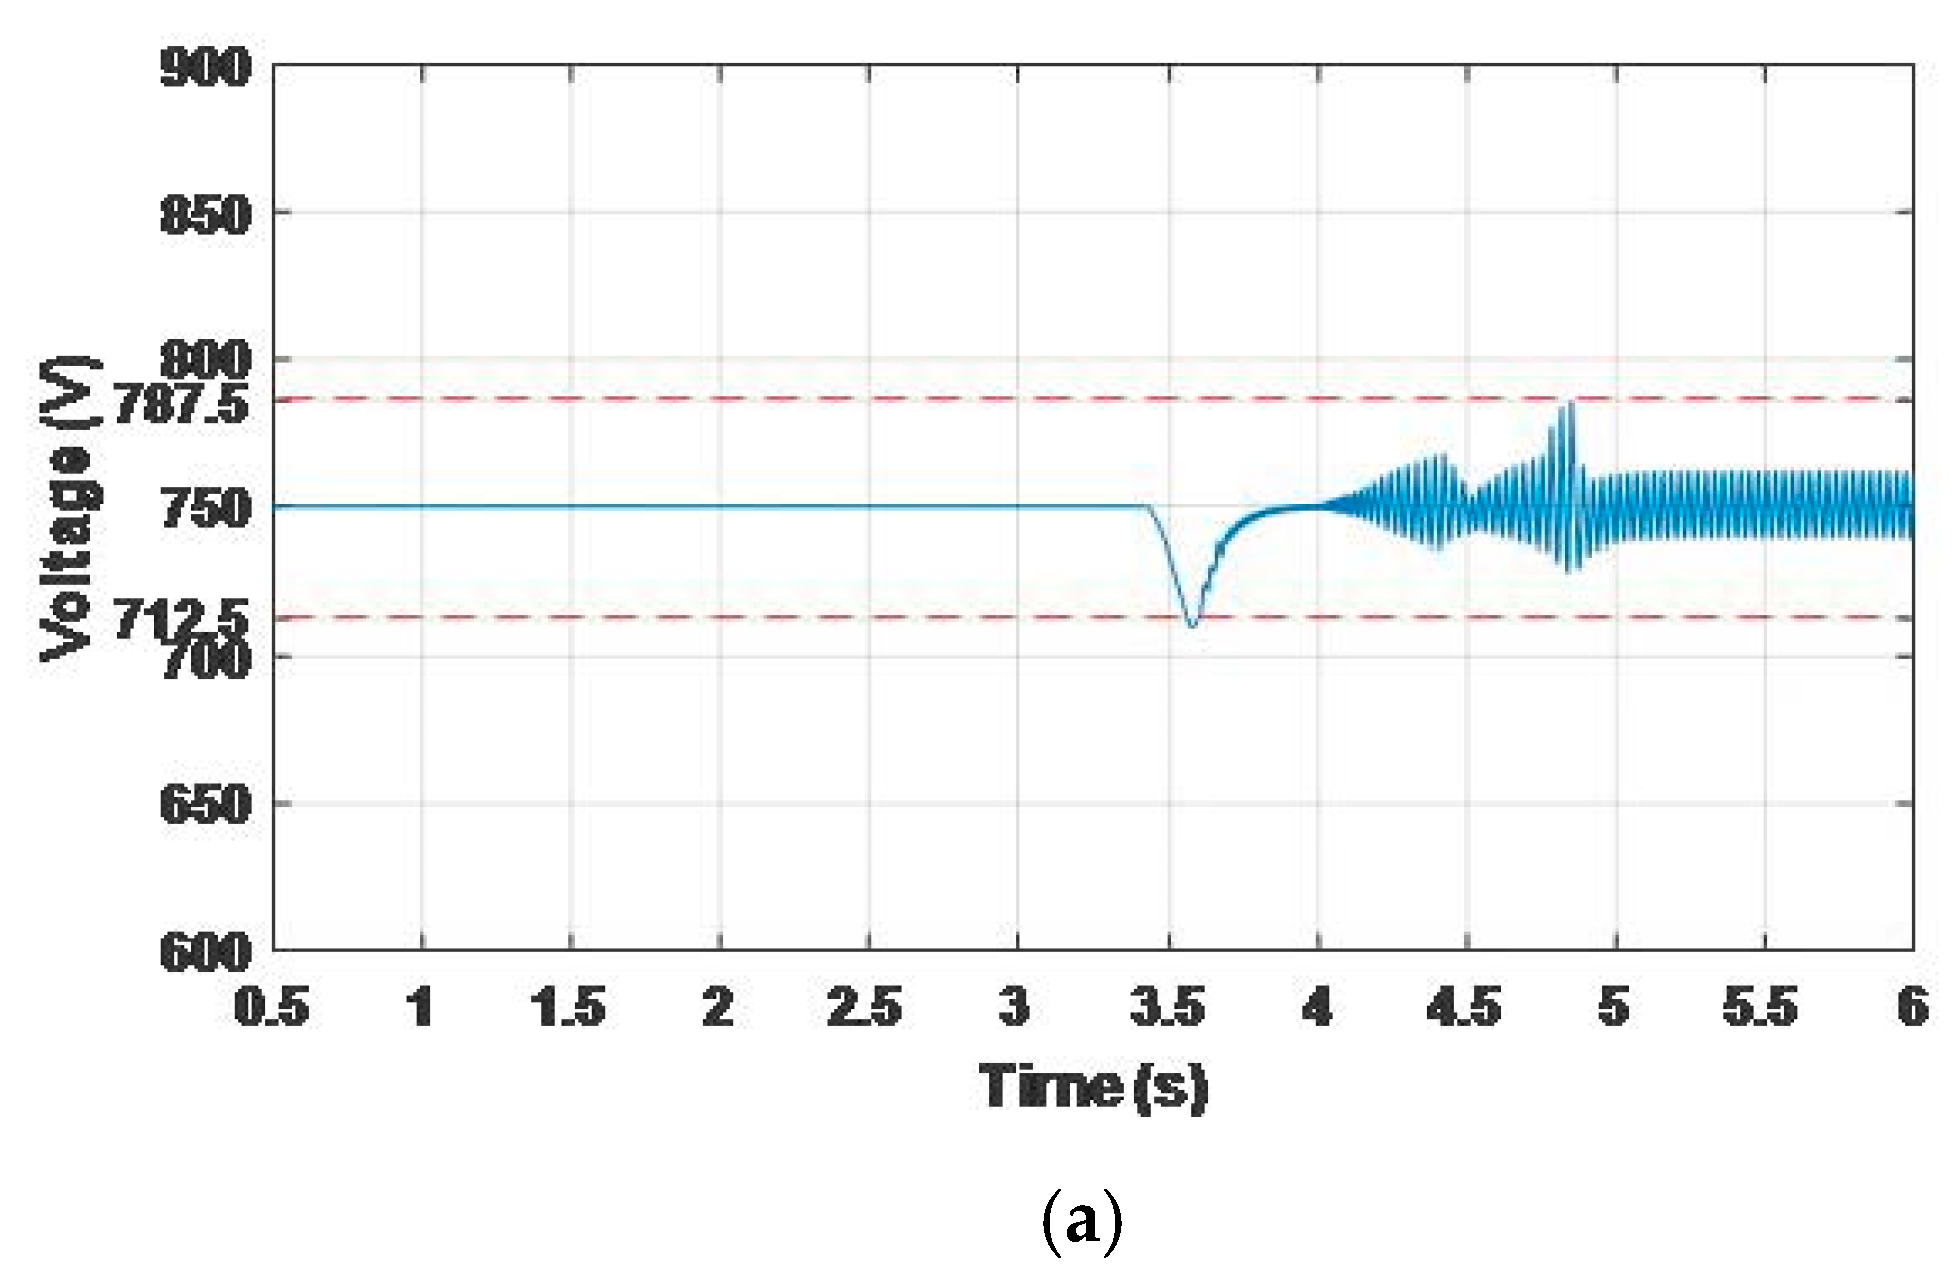
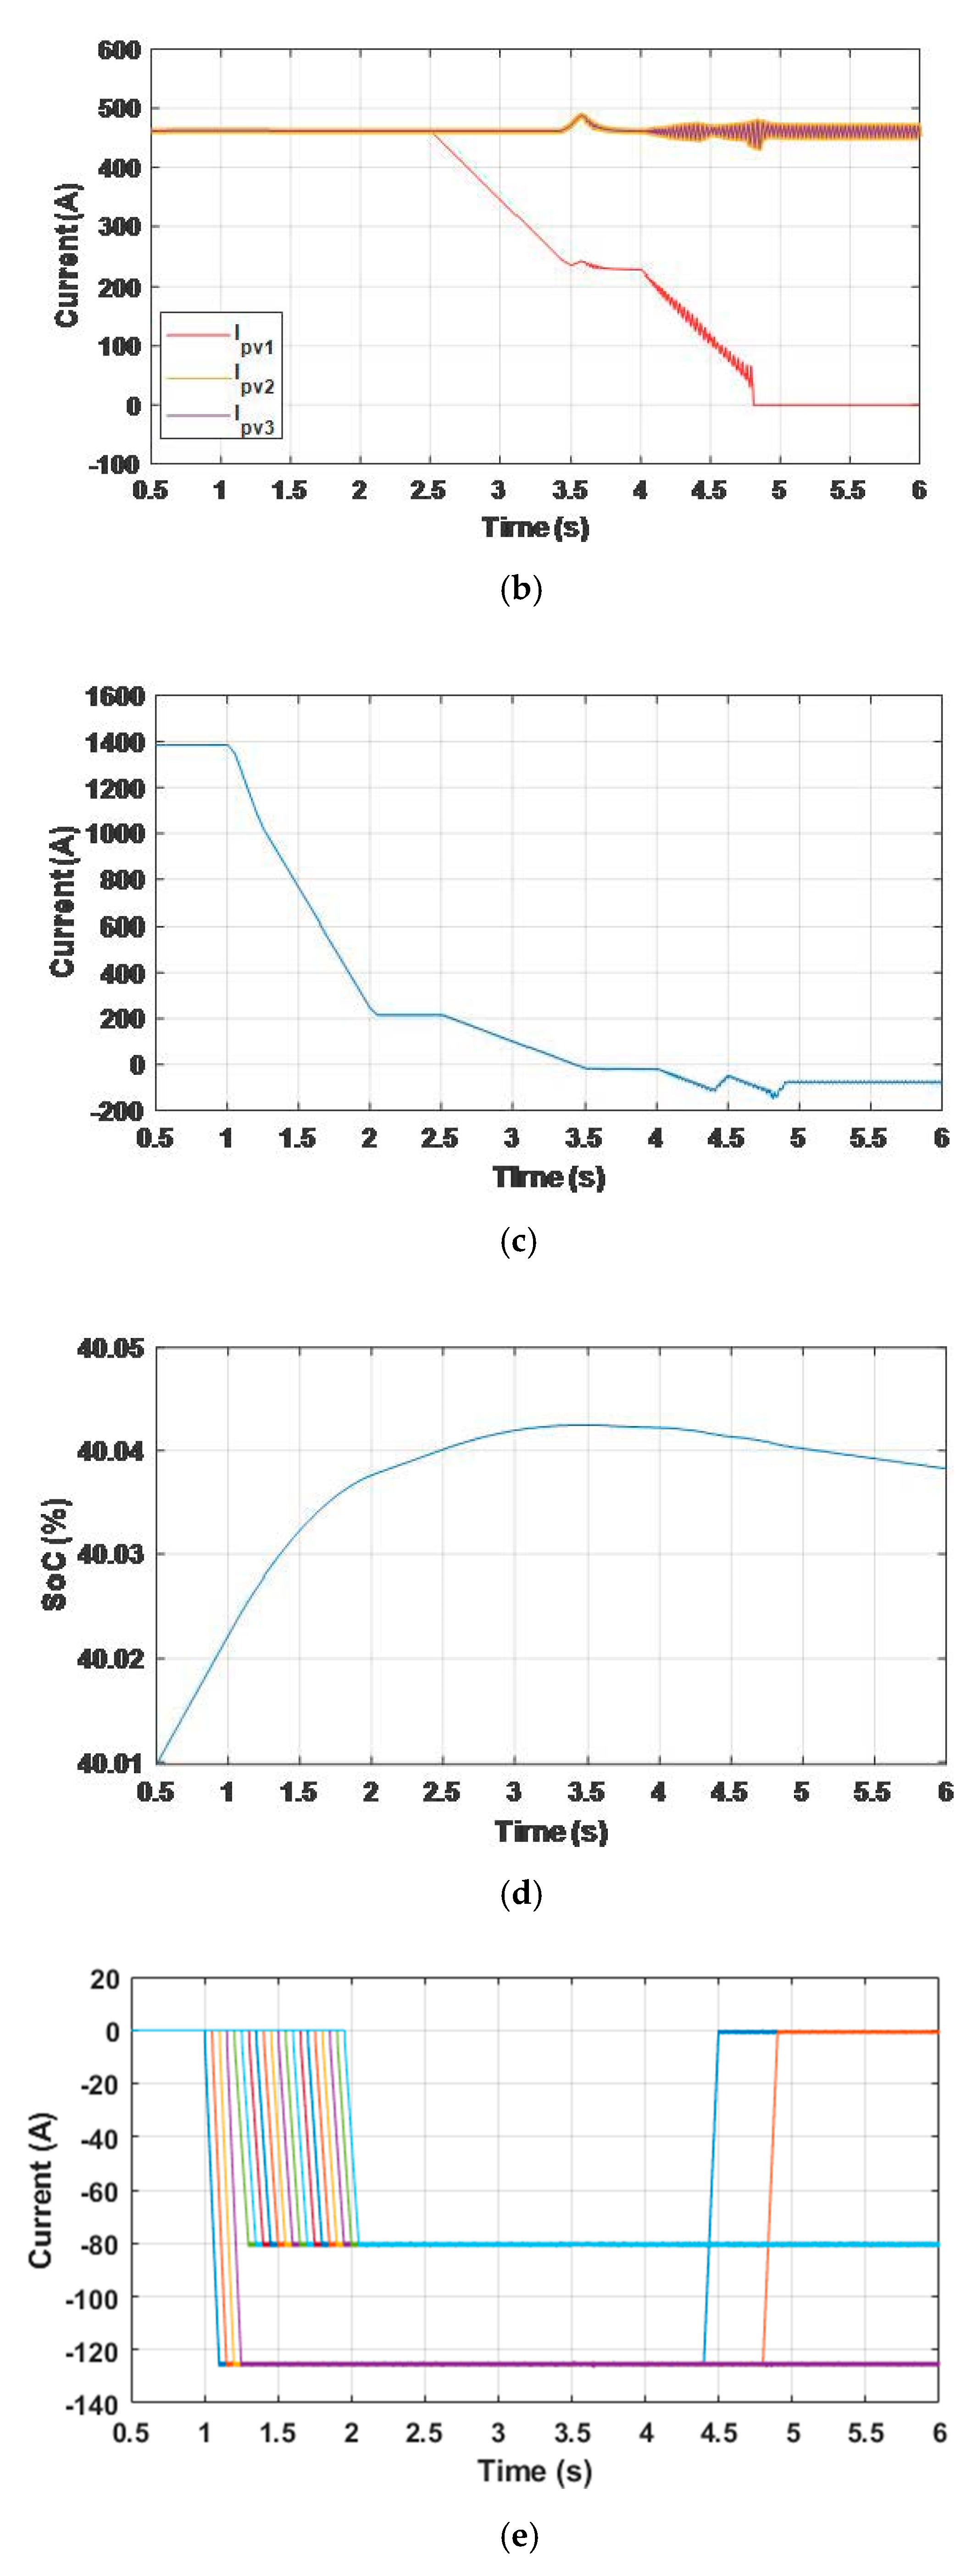
Figure 11a,b show the DC bus voltage and three PV array currents. At the beginning of the simulation, the voltage is maintained at a nominal value 750 V, and the array currents are 460 A. The first array current (IPV1) starts to drop at t = 2.5 s when its irradiance is reduced, while the other two are constant. Following the sudden drop in generation, at t = 3.4 s the ESU converter changes from buck mode to boost mode to discharge the battery and to keep the bus voltage constant, while supplying power to charge the EVs. At 4.8 s, the first PV array is disconnected from grid due to the low irradiance value and its current drops to 0. In spite of the oscillations in the waveforms due to battery discharging, the voltage profile is maintained within the 5% of the nominal value (750 V). The oscillations in DC voltage will disappear when the battery will switch back to buck mode.
Figure 11c,d show the ESU current and battery SoC, respectively. The ESU is charging between t = 0 s and t = 3.5 s, and discharges afterwards, when the ESU switches to buck mode. Figure 11e shows the EVs charging currents. The EVs connect in sequence between t = 1 and 2 s, and two of the EVs are disconnected at t = 4.4 s and t = 4.8 s, respectively, as the ESU is unable to meet the full power demand. Therefore, in this case, 18 vehicles can be charged for t > 5 s.
4.1.2. Case 2: Two Arrays Irradiance Changing according to G1
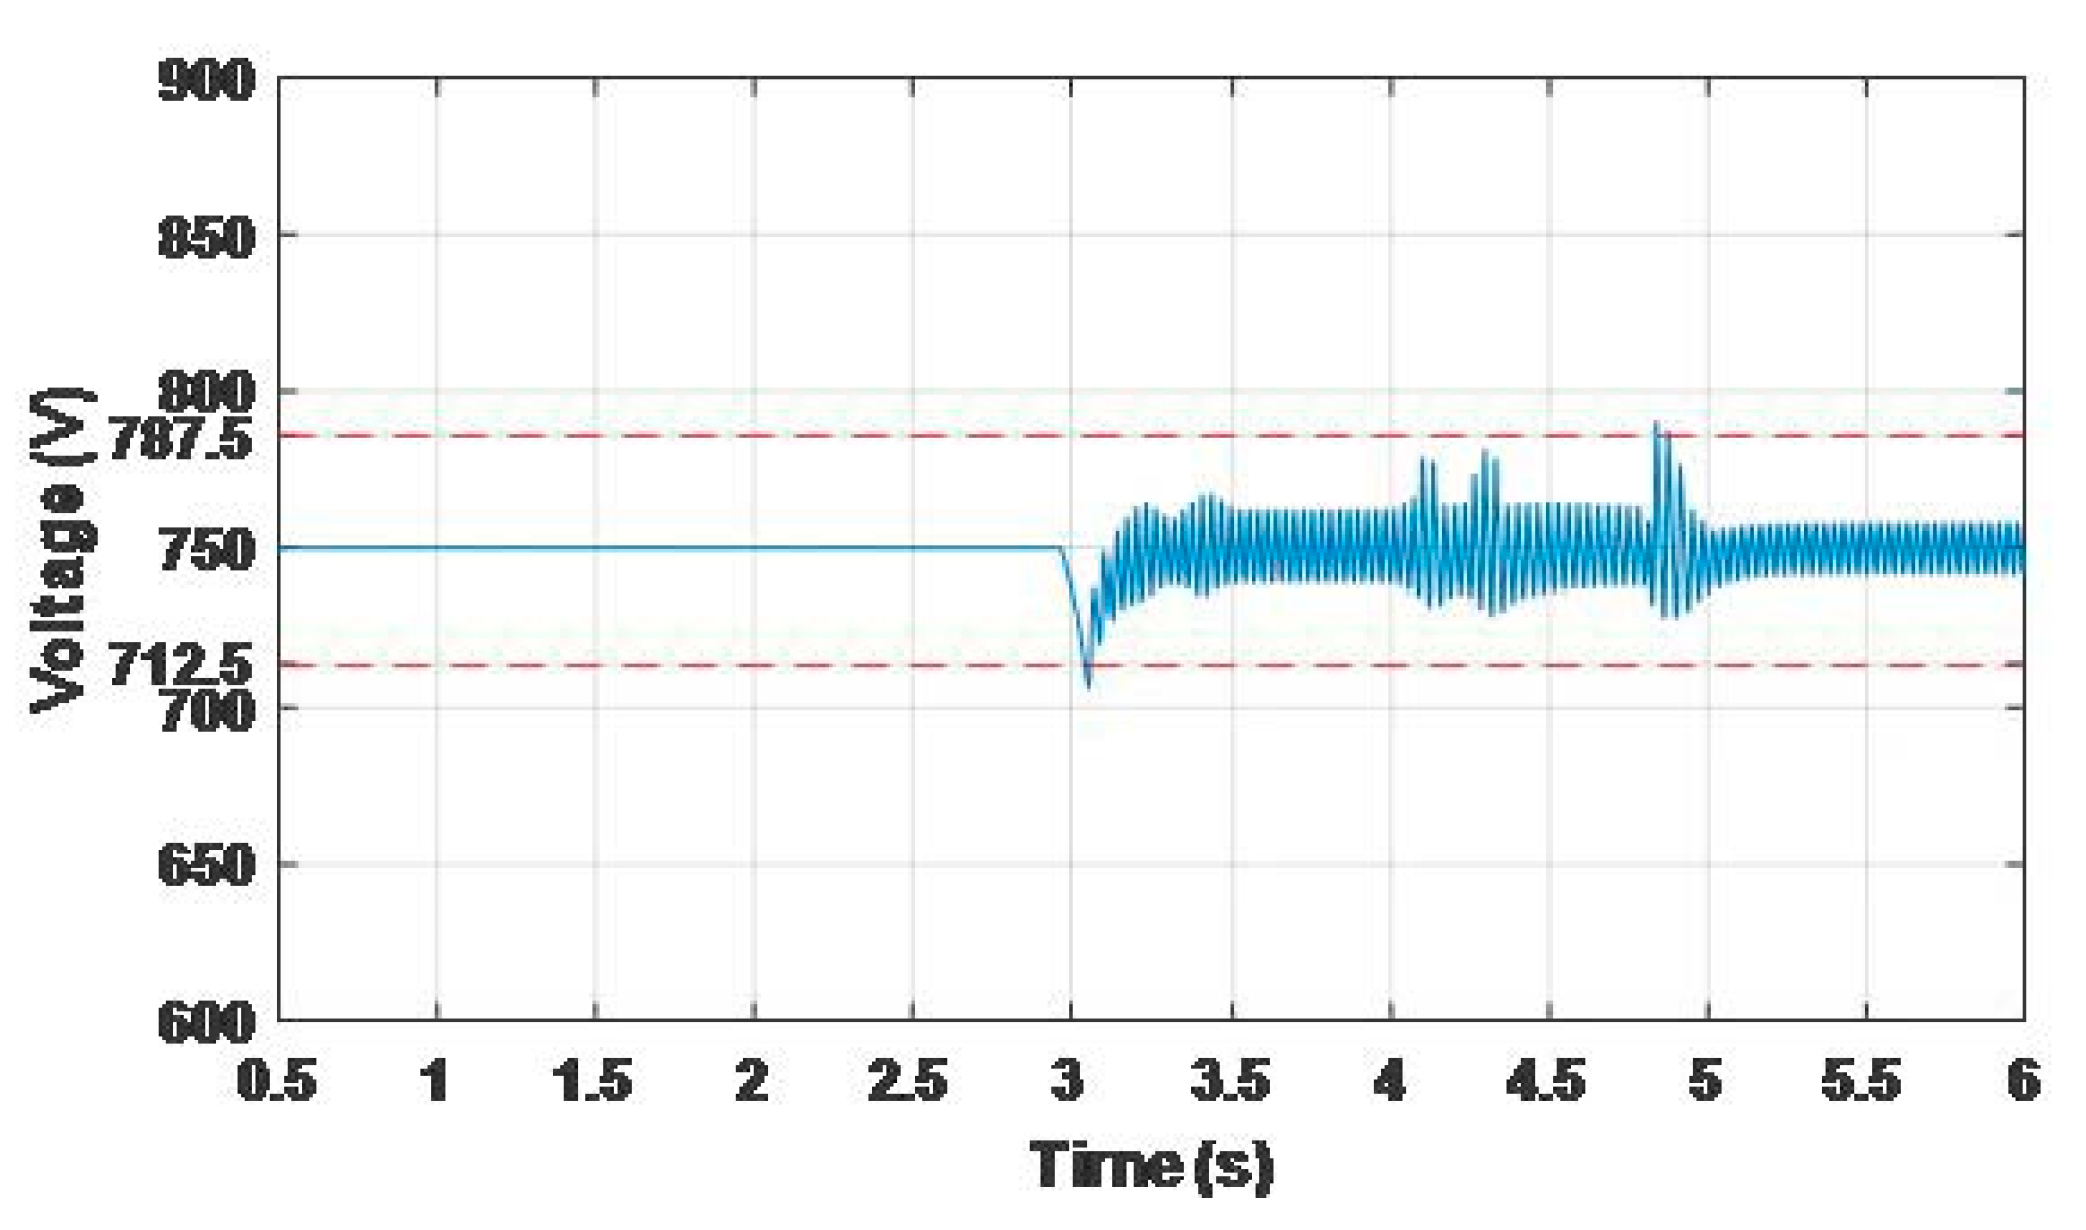
In this case, the irradiance of two PV arrays change according to G1 and for the third array, the irradiance remains constant at 1000 W/m2. Figure 12 shows the main DC bus voltage. The voltage oscillations are due to the ESU switching from buck mode to boost mode, as in Case 1, and additional spikes are due to the disconnection of electric vehicles. However, the voltage remains close to 750 V and the ripple is within the 5% of nominal level. In this case, for t > 5 s only 10 EV can be charged, because the PV-generated power is reduced.
4.1.3. Case 3: Three Arrays Irradiance Changing according to G1
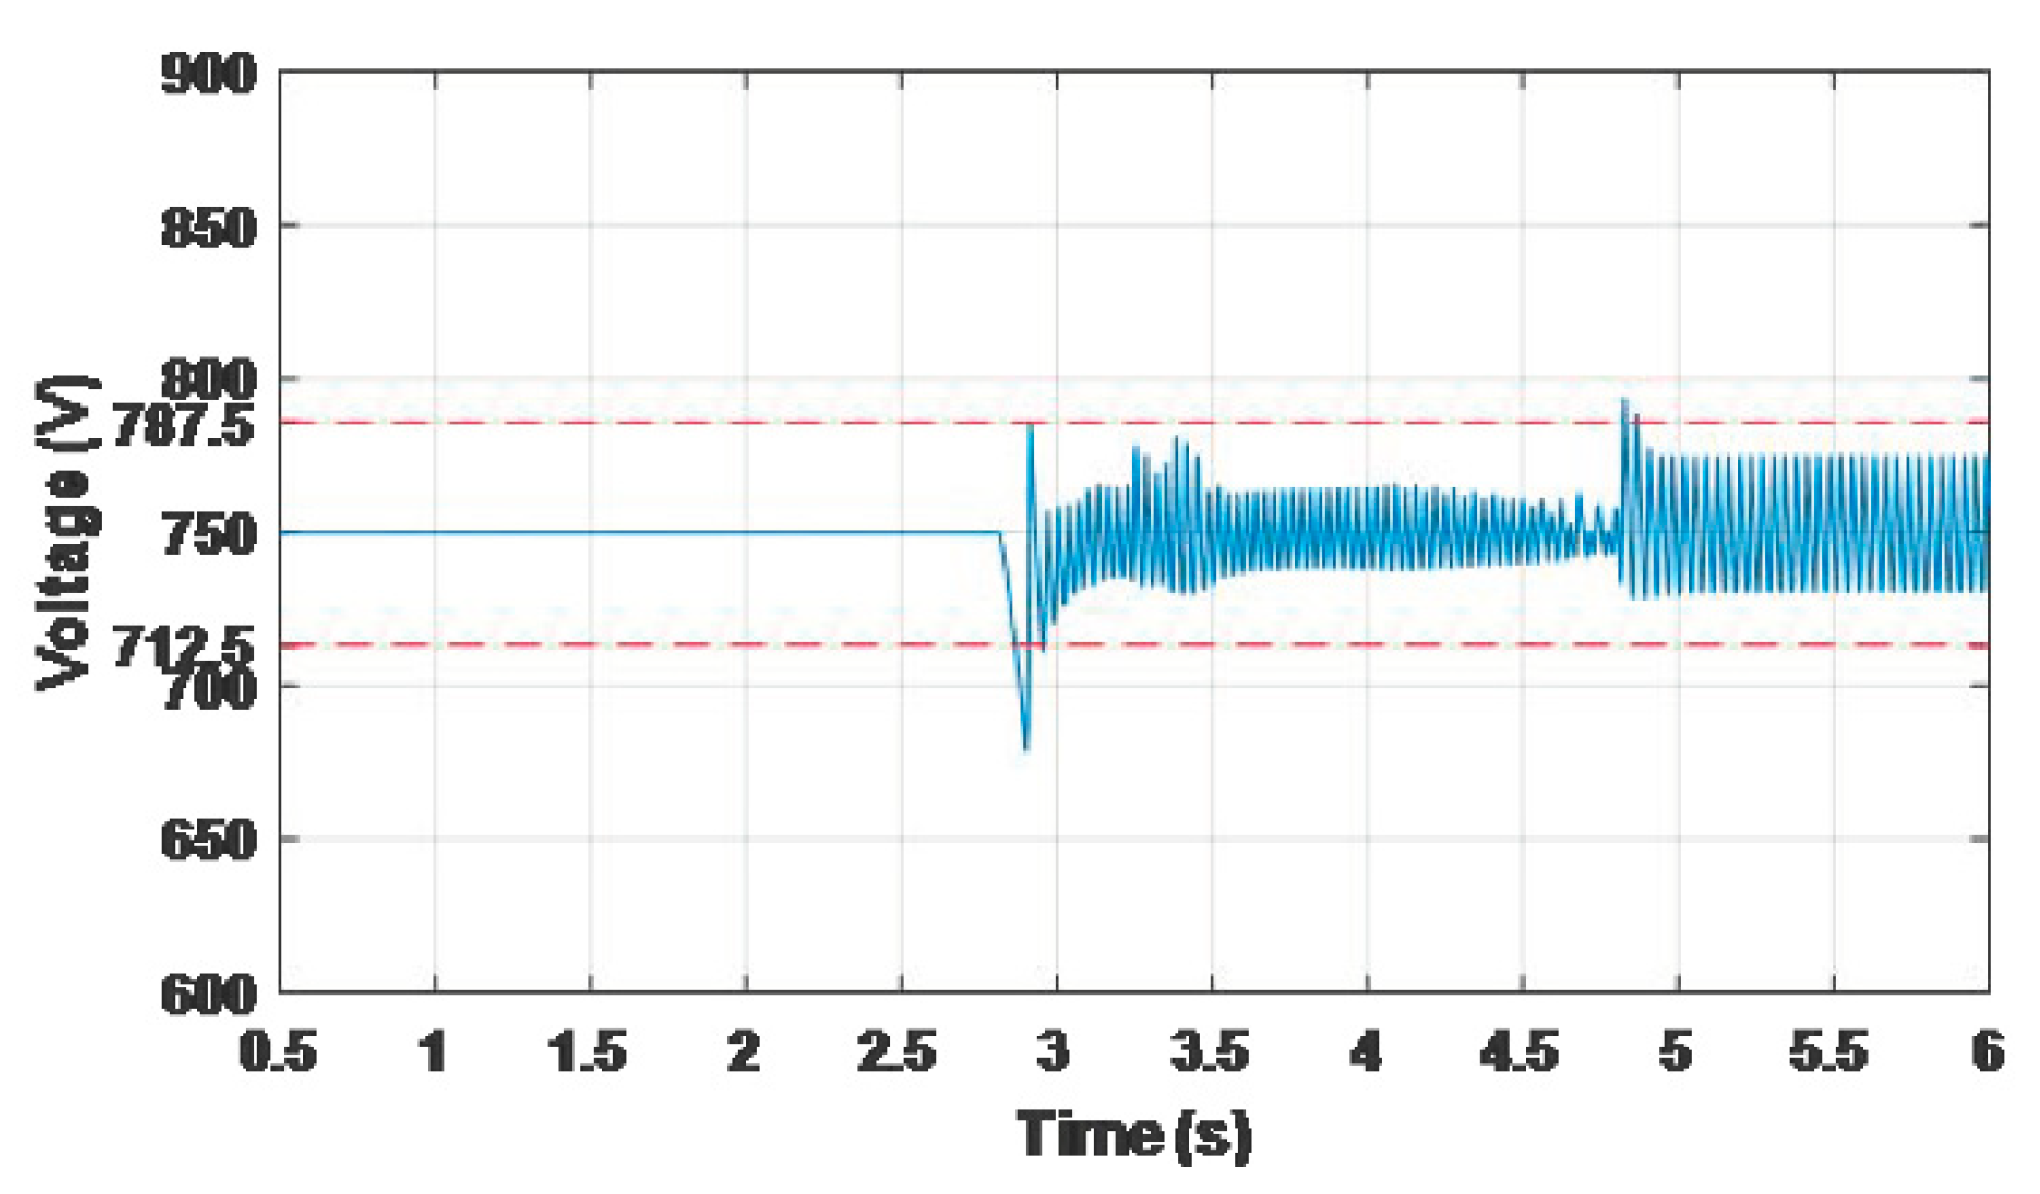
In this case, all the three PV arrays are controlled by irradiance G1. Figure 13 shows the DC bus voltage: while additional oscillations than in Case 2 are observed, still the voltage is maintained within the 5% of nominal level. All EVs except two disconnected from the DC bus between 3 s and 5 s. The two remaining EVs are charged by the ESU directly.
4.2. Hybrid Control Mode for Rapid Irradiance Change
Solar irradiance can change suddenly at any point in time, and the following case shows the results when this parameter changes according to curve G2 in Figure 10.
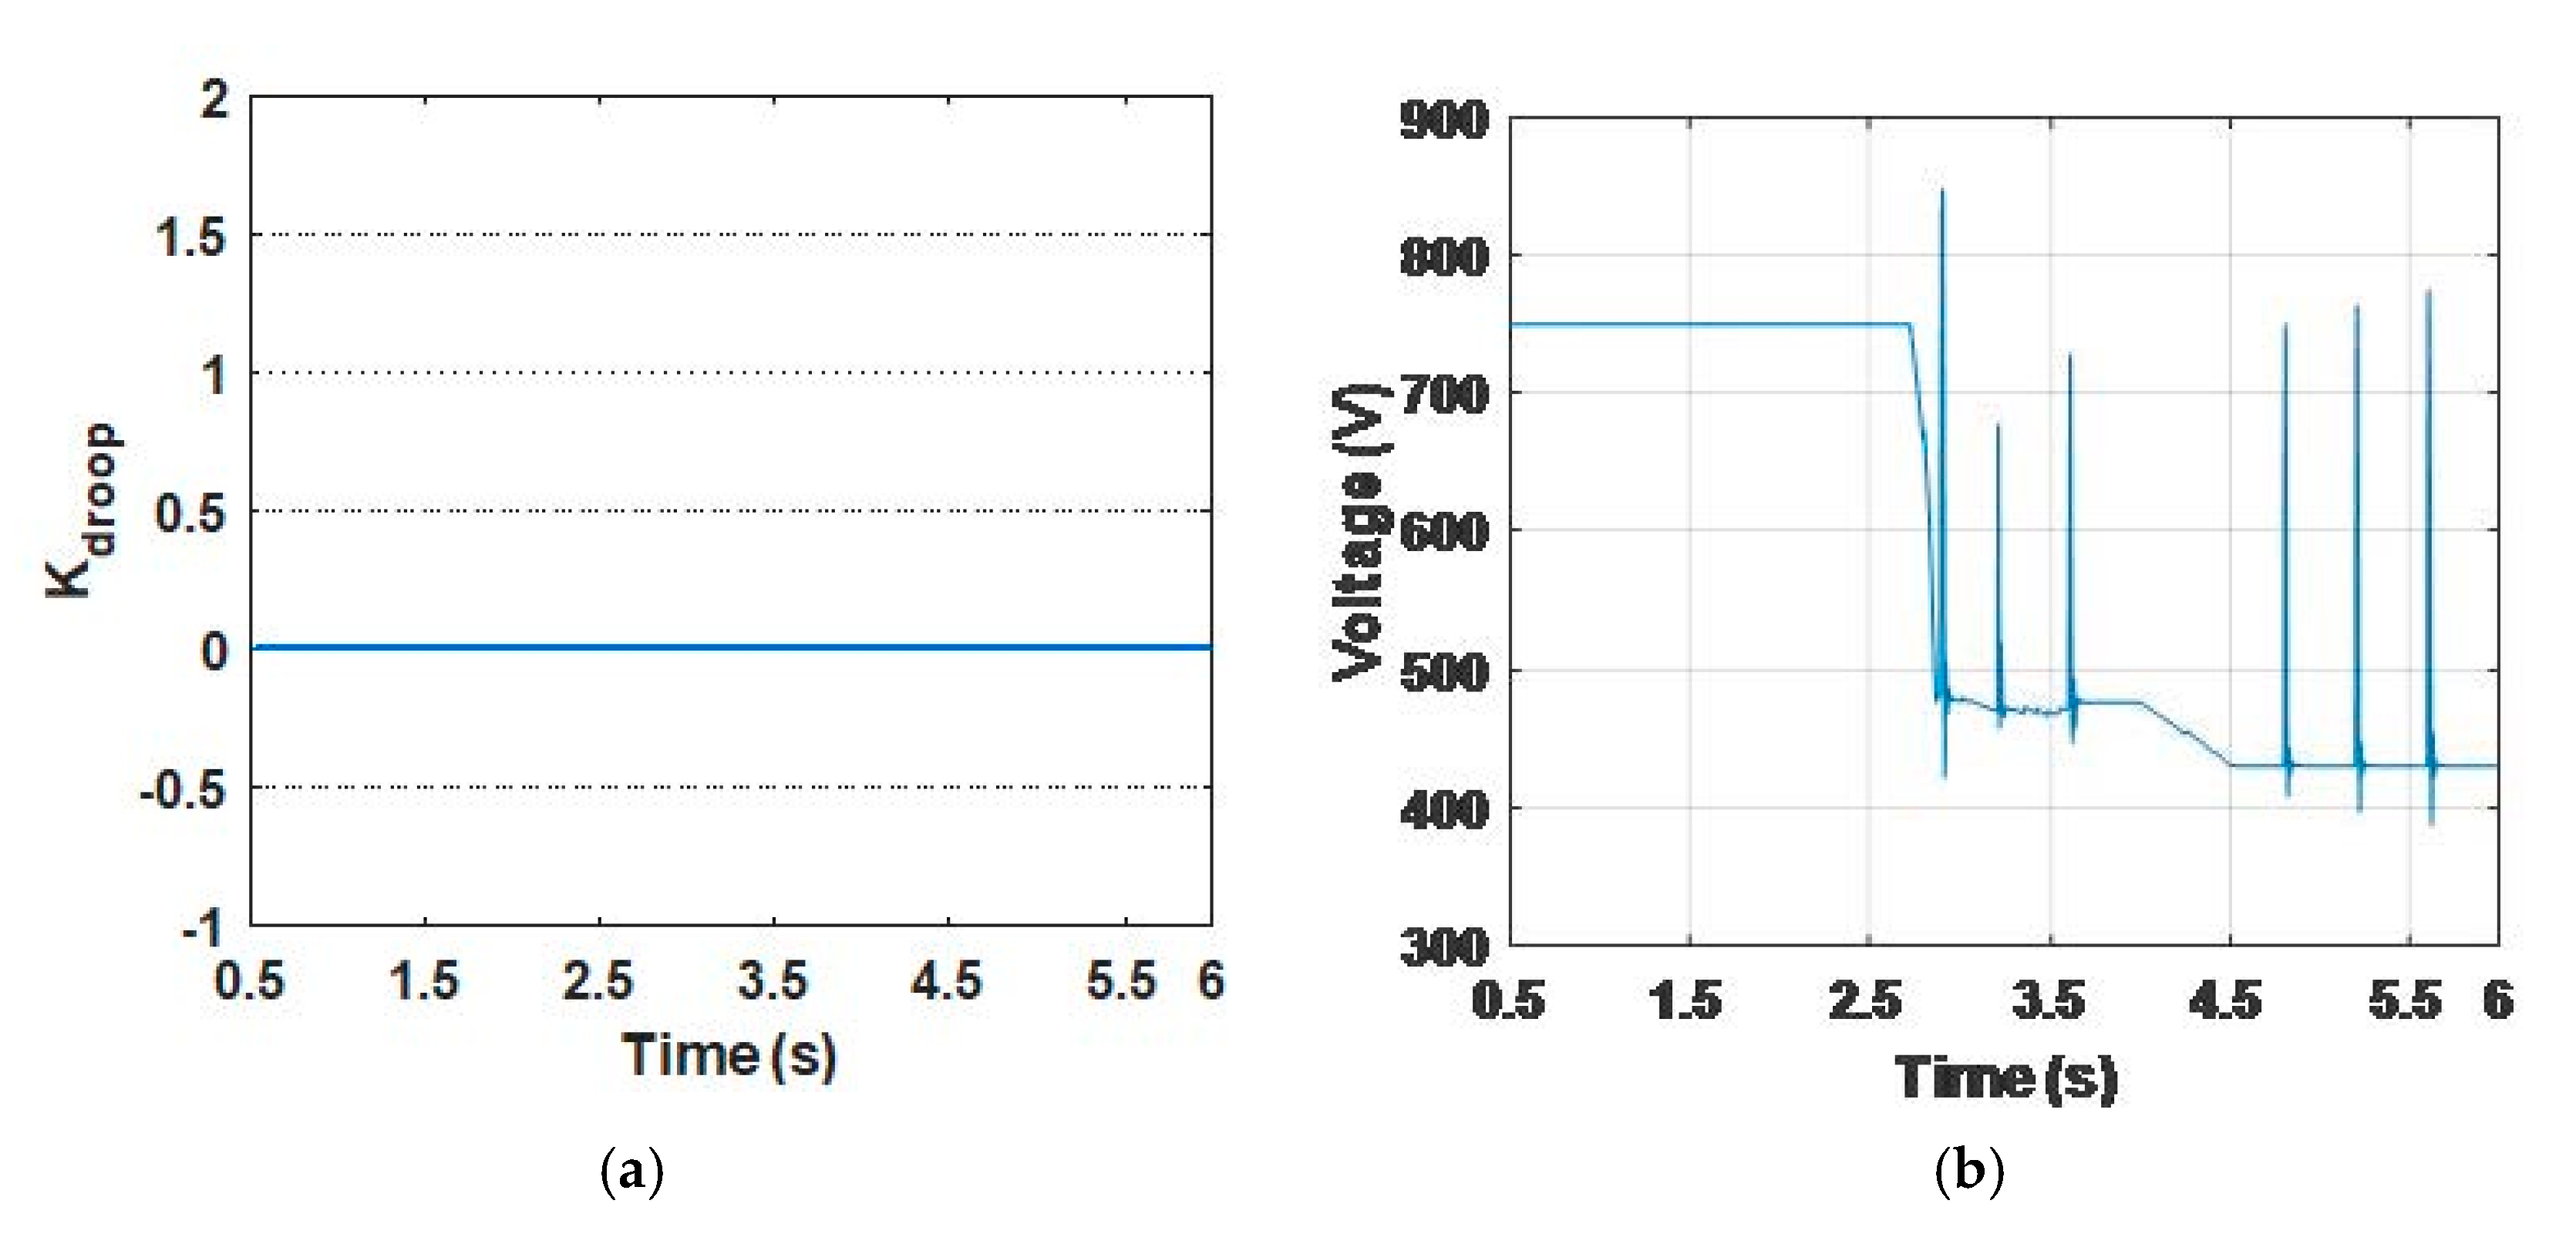
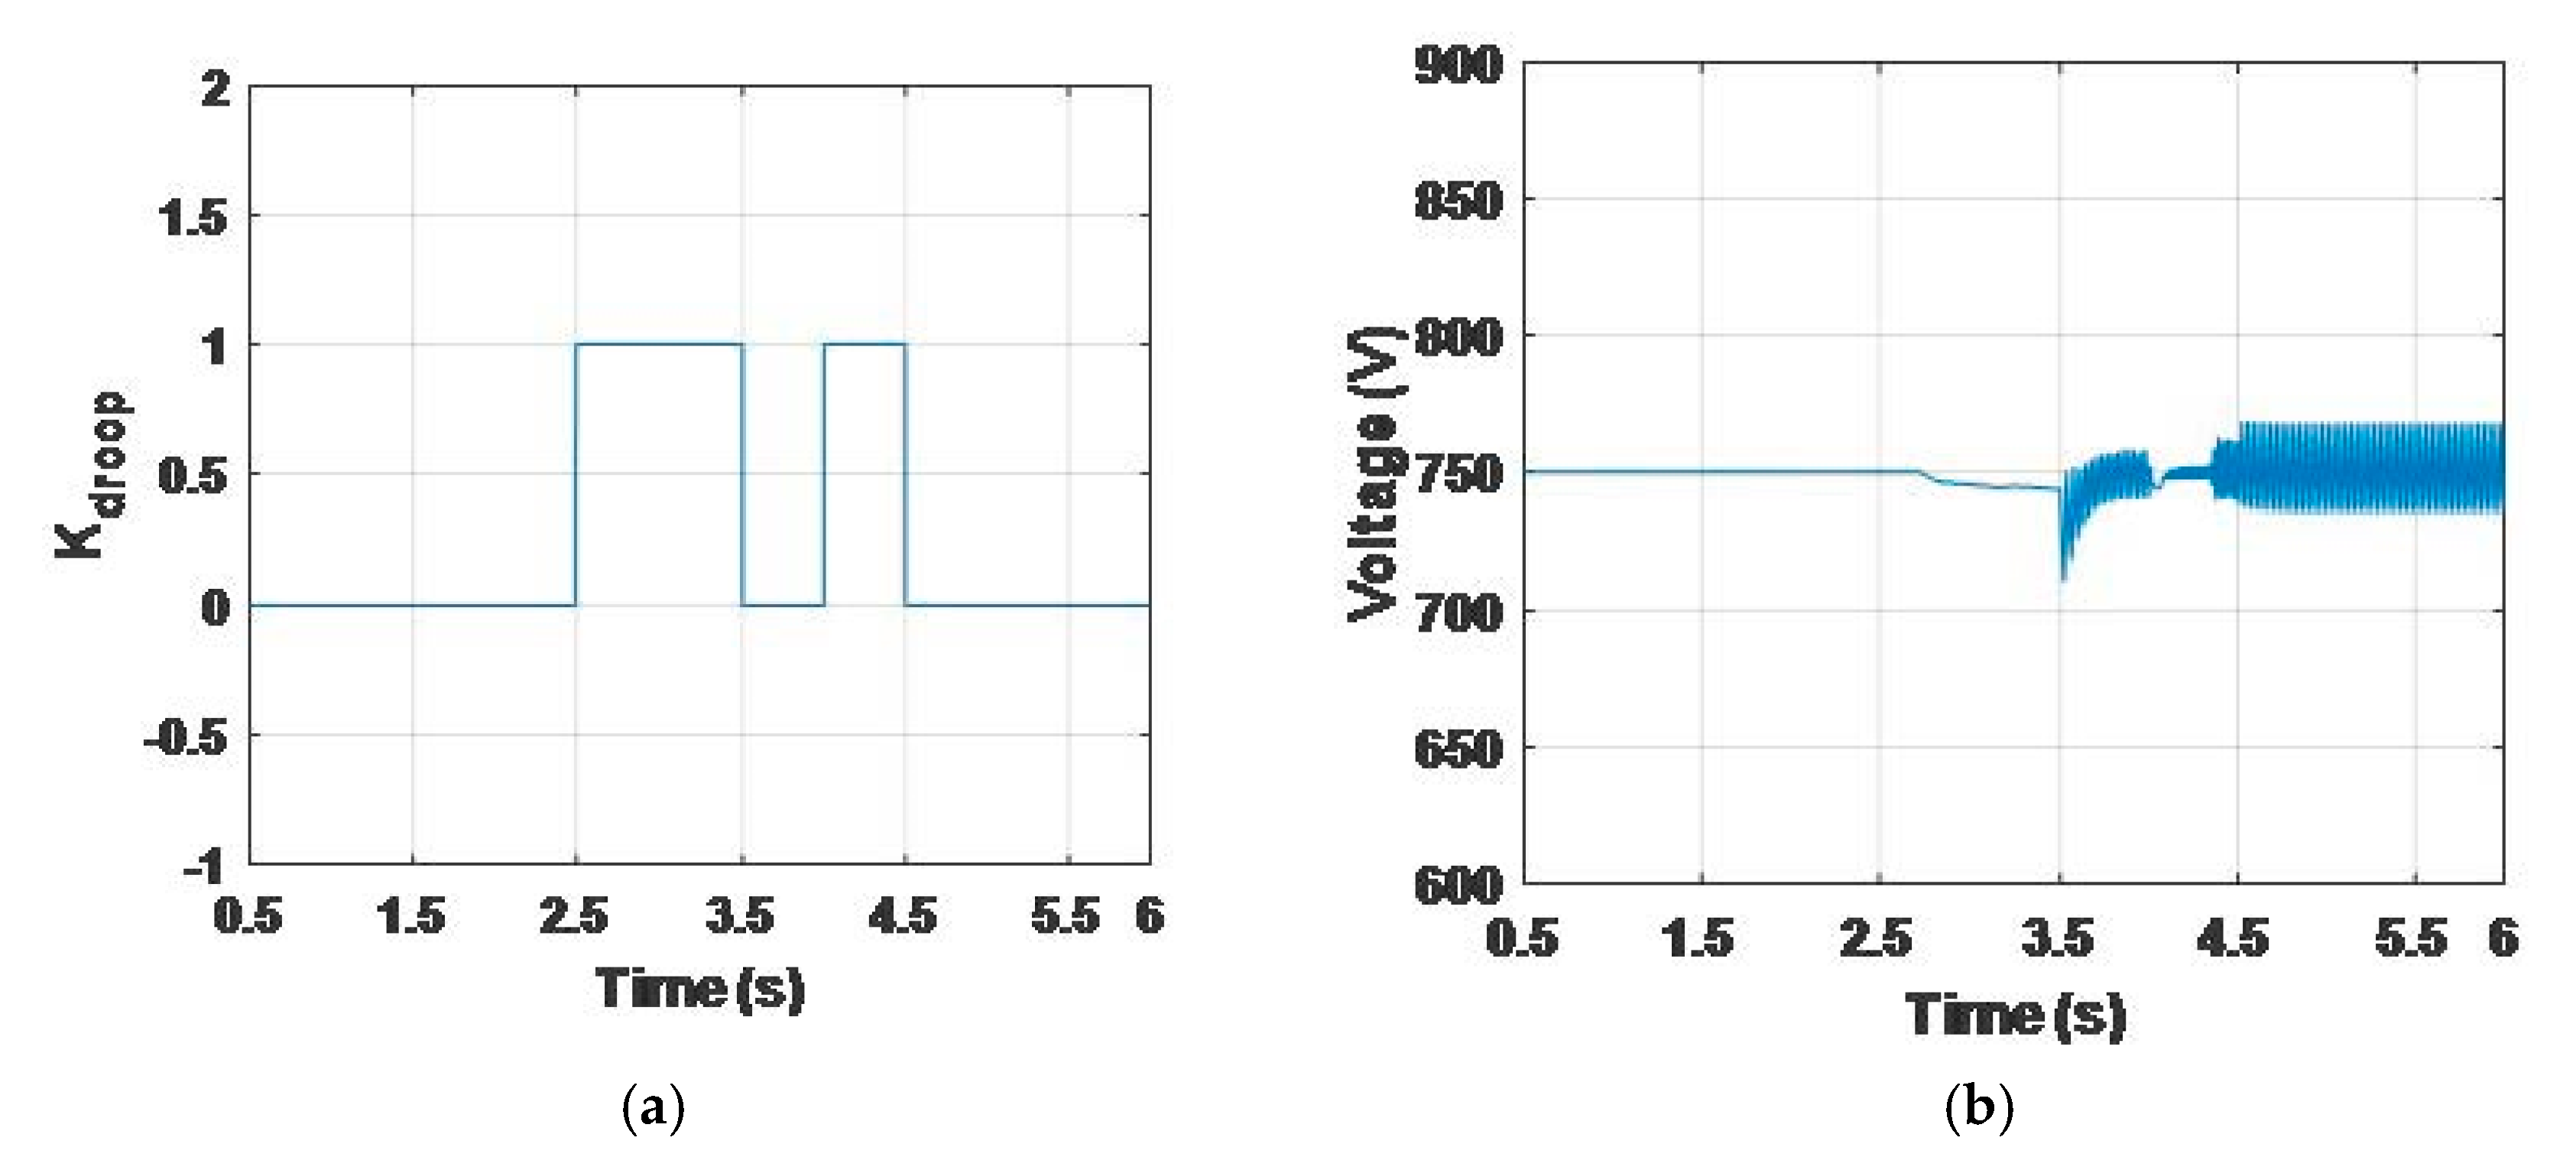
Figure 14 and Figure 15 show the droop gain and the voltage profile for two cases: without and with the droop control, respectively. Figure 14b illustrates that the bus voltage drifts from the rated value without droop control. When the droop control is implemented, the voltage is stable, as shown in Figure 15b m and the gain changes from 0 to 1 to enable droop control when the rate of change in irradiance is beyond the threshold 600 W/(m2s), as shown in Figure 15a. This case indicates that the proposed droop control is required when fast irradiance change takes place, while it is not necessary under slow-changing operating conditions.
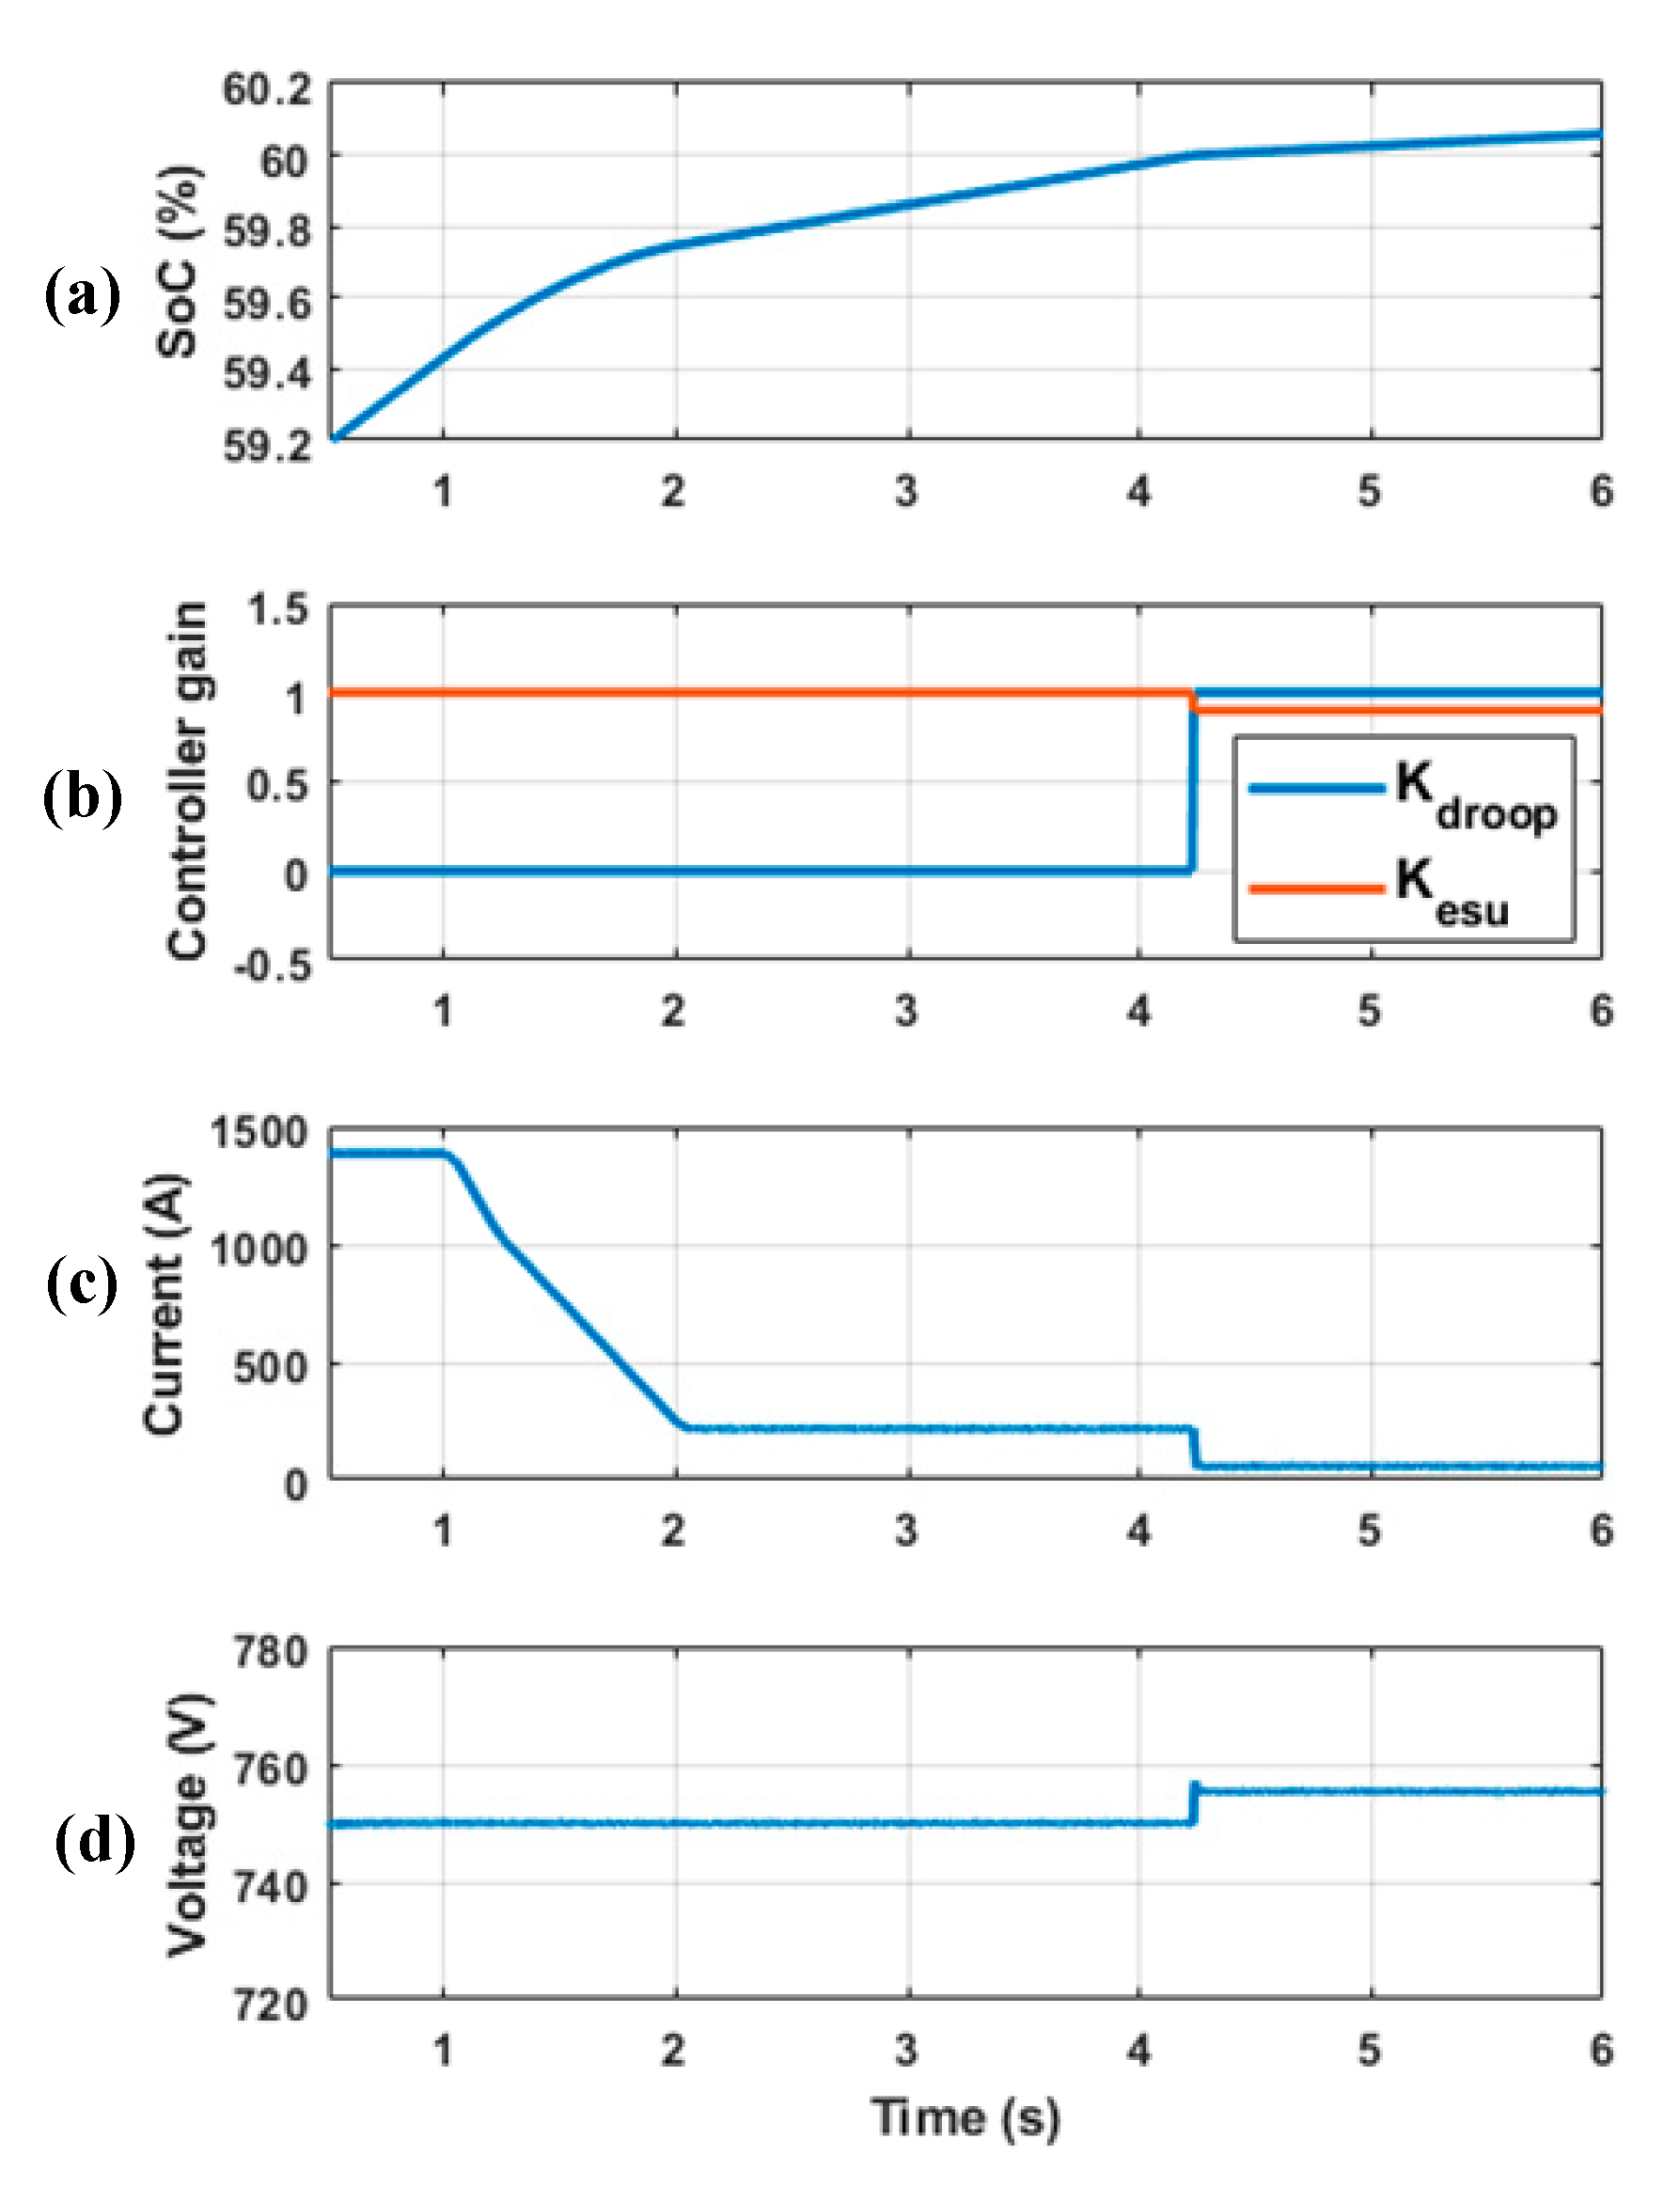
4.3. Reduced Charging Current
This case illustrates system operation when the ESU battery is charged beyond the nominal SoC range (i.e., 60%). The condition is set as follow: the solar irradiance is constant at 1000 W/m2; 20 EVs are connecting to the system between 1 to 2 s and the ESU battery is changed to 80 Ah (i.e., 59.2% of the SoC).
The battery reaches a SoC equal to 60% at t = 4.2 s, as shown in Figure 16. As a result, the hybrid control is enabled and the gain and change from 1 to 0.9 and 0 to 1, respectively. Therefore, the power generated by the PV panels is shared by the ESU and all the connected EVs, and the charging current for ESU reduces. However, the bus voltage will not be affected visibly, only increasing by approximately 0.67% as shown in Figure 16d.
5. Conclusions
This paper presented a novel hybrid control scheme that effectively improves the transients and operational stability of a PV-fed DC bus islanded EV charging station, when compared to a standard master–slave control scheme. The advantages of both master–slave and droop-based controls are combined in the proposed scheme, that leads to an improved PV-ESU-EV coordination in an islanded charging station. Various cases have been presented, including varying PV power generation, slow and rapid solar irradiance change, and the ESU battery SoC being charged outside the nominal range.
A 3L boost converter was designed to provide double voltage gain using a quarter of the inductance compared to the conventional 2L boost converter, thus resulting in higher efficiency for PV generation. The 3L boost converter is controlled by P&O MPPT and a capacitor voltage balance controller. EV chargers and ESU converter design with corresponding control schemes were also described.
The proposed methodology has been tested on a DC-charging station supplying 20 EVs. Various operating conditions have been studied, including slow and rapid changes of solar irradiance (between 700 W/m2s and 300 W/m2s) and the impact of charging the ESU beyond the nominal SoC (60%). Simulation results show that the DC bus voltage is always maintained within 5% of the nominal level under all operating conditions. The results also indicated that the EVs charge at the rated value and the ESU can either charge or discharge within its nominal SoC limits.
The proposed design allows increasing the utilisation of RESs for electrification of transport, and deployment of LTCs in areas with weak grid connection.
Author Contributions
Conceptualization, H.H. and G.T.; methodology, H.H.; software, H.H. and S.B.; validation, S.B. and G.T.; writing—original draft preparation, H.H. and S.B.; writing—review and editing, G.T. and S.S.; supervision, G.T. and S.S.; project administration, G.T.; funding acquisition, G.T. All authors have read and agreed to the published version of the manuscript.
Funding
European Regional Development Fund, through the Welsh Government, for the 2nd Solar Photovoltaic Academic Research Consortium (SPARC II) which supported this research.
Acknowledgments
The authors would like to acknowledge funding by the European Regional Development Fund, through the Welsh Government, for the 2nd Solar Photovoltaic Academic Research Consortium (SPARC II) which supported this research.
Conflicts of Interest
The authors declare no conflict of interest.
References
- Edenhofer, O. Climate Change 2014: Mitigation of Climate Change; Cambridge University Press: Cambridge, UK, 2015; Volume 3. [Google Scholar]
- Paris Agreement; United Nations Framework Convention on Climate Change; 2015; p. 2017. Available online: https://unfccc.int/sites/default/files/english_paris_agreement.pdf (accessed on 10 May 2021).
- Lucas, A.; Bonavitacola, F.; Kotsakis, E.; Fulli, G. Grid harmonic impact of multiple electric vehicle fast charging. Electr. Power Syst. Res. 2015, 127, 13–21. [Google Scholar] [CrossRef]
- Tan, L.; Wu, B.; Yaramasu, V.; Rivera, S.; Guo, X. Effective Voltage Balance Control for Bipolar-DC-Bus-Fed EV Charging Station With Three-Level DC–DC Fast Charger. IEEE Trans. Ind. Electron. 2016, 63, 4031–4041. [Google Scholar] [CrossRef]
- Yong, J.Y.; Ramachandaramurthy, V.K.; Tan, K.M.; Mithulananthan, N. A review on the state-of-the-art technologies of electric vehicle, its impacts and prospects. Renew. Sustain. Energy Rev. 2015, 49, 365–385. [Google Scholar] [CrossRef]
- Bull, S.R. Renewable energy today and tomorrow. Proc. IEEE 2001, 89, 1216–1226. [Google Scholar] [CrossRef]
- Bevrani, H.; François, B.; Ise, T. Microgrid Dynamics and Control; John Wiley & Sons: Hoboken, NJ, USA, 2017. [Google Scholar]
- Mangu, B.; Akshatha, S.; Suryanarayana, D.; Fernandes, B.G. Grid-Connected PV-Wind-Battery-Based Multi-Input Transformer-Coupled Bidirectional DC-DC Converter for Household Applications. IEEE J. Emerg. Sel. Top. Power Electron. 2016, 4, 1086–1095. [Google Scholar] [CrossRef]
- Das, M.; Pal, M.; Agarwal, V. Novel High Gain, High Efficiency DC–DC Converter Suitable for Solar PV Module Integration with Three-Phase Grid Tied Inverters. IEEE J. Photovolt. 2019, 9, 528–537. [Google Scholar] [CrossRef]
- Chen, Y.; Huang, A.Q.; Yu, X. A High Step-Up Three-Port DC–DC Converter for Stand-Alone PV/Battery Power Systems. IEEE Trans. Power Electron. 2013, 28, 5049–5062. [Google Scholar] [CrossRef]
- Debnath, D.; Chatterjee, K. Two-Stage Solar Photovoltaic-Based Stand-Alone Scheme Having Battery as Energy Storage Element for Rural Deployment. IEEE Trans. Ind. Electron. 2015, 62, 4148–4157. [Google Scholar] [CrossRef]
- Xiong, X.; Yang, Y. A Photovoltaic-Based DC Microgrid System: Analysis, Design and Experimental Results. Electronics 2020, 9, 941. [Google Scholar] [CrossRef]
- Ito, Y.; Zhongqing, Y.; Akagi, H. DC microgrid based distribution power generation system. Proc. Int. Power Electron. Motion Control Conf. (IPEMC) 2004, 3, 1740–1745. [Google Scholar]
- Goli, P.; Shireen, W. PV Integrated Smart Charging of PHEVs Based on DC Link Voltage Sensing. IEEE Trans. Smart Grid 2014, 5, 1421–1428. [Google Scholar] [CrossRef]
- Available online: https://www.sma.de/fileadmin/content/global/Products/Documents/Referenzanlagen/REFBAMYAN-AEN145010.pdf (accessed on 10 May 2021).
- Available online: https://www.juwi.com/news/artikel/artikelansicht/largest-off-grid-solar-project-complete-1 (accessed on 10 May 2021).
- Available online: https://www.wsp.com/en-MY/projects/robben-island-solar-microgrid (accessed on 10 May 2021).
- Mouli, G.C.; Bauer, P.; Zeman, M. System design for a solar powered electric vehicle charging station for workplaces. Appl. Energy 2016, 168, 434–443. [Google Scholar] [CrossRef] [Green Version]
- Goli, P.; Shireen, W. PV powered smart charging station for PHEVs. Renew. Energy 2014, 66, 280–287. [Google Scholar] [CrossRef]
- Fattori, F.; Anglani, N.; Muliere, G. Combining photovoltaic energy with electric vehicles, smart charging and vehicle-to-grid. Sol. Energy 2014, 110, 438–451. [Google Scholar] [CrossRef]
- Capasso, C.; Veneri, O. Experimental study of a DC charging station for full electric and plug in hybrid vehicles. Appl. Energy 2015, 152, 131–142. [Google Scholar] [CrossRef]
- Tran, V.T.; Islam, M.R.; Muttaqi, K.M.; Sutanto, D. An Efficient Energy Management Approach for a Solar-Powered EV Battery Charging Facility to Support Distribution Grids. IEEE Trans. Ind. Appl. 2019, 55, 6517–6526. [Google Scholar] [CrossRef]
- Badawy, M.O.; Sozer, Y. Power Flow Management of a Grid Tied PV-Battery System for Electric Vehicles Charging. IEEE Trans. Ind. Appl. 2017, 53, 1347–1357. [Google Scholar] [CrossRef]
- Meer, D.V.d.; Mouli, G.R.C.; Mouli, G.M.-E.; Elizondo, L.R.; Bauer, P. Energy Management System With PV Power Forecast to Optimally Charge EVs at the Workplace. IEEE Trans. Ind. Inform. 2018, 14, 311–320. [Google Scholar] [CrossRef] [Green Version]
- Melath, G.; Rangarajan, S.; Agarwal, V. Comprehensive power management scheme for the intelligent operation of photovoltaic-battery based hybrid microgrid system. IET Renew. Power Gener. 2020, 14, 1688–1698. [Google Scholar] [CrossRef]
- Kahrobaee, S.; Rajabzadeh, R.A.; Soh, L.; Asgarpoor, S. A Multiagent Modeling and Investigation of Smart Homes with Power Generation, Storage, and Trading Features. IEEE Trans. Smart Grid 2013, 4, 659–668. [Google Scholar] [CrossRef] [Green Version]
- Thang, T.V.; Ahmed, A.; Kim, C.; Park, J. Flexible System Architecture of Stand-Alone PV Power Generation With Energy Storage Device. IEEE Trans. Energy Convers. 2015, 30, 1386–1396. [Google Scholar] [CrossRef]
- Wu, D.; Tang, F.; Dragicevic, T.; Guerrero, J.M.; Vasquez, J.C. Coordinated Control Based on Bus-Signaling and Virtual Inertia for Islanded DC Microgrids. IEEE Trans. Smart Grid 2015, 6, 2627–2638. [Google Scholar] [CrossRef] [Green Version]
- Xia, Y.; Yu, M.; Yang, P.; Peng, Y.; Wei, W. Generation-Storage Coordination for Islanded DC Microgrids Dominated by PV Generators. IEEE Trans. Energy Convers. 2019, 34, 130–138. [Google Scholar] [CrossRef]
- Eghtedarpour, N.; Farjah, E. Distributed charge/discharge control of energy storages in a renewable-energy-based DC micro-grid. IET Renew. Power Gener. 2014, 8, 45–57. [Google Scholar] [CrossRef]
- Zhang, M.T.; Yimin, J.; Lee, F.C.; Jovanovic, M.M. Single-phase three-level boost power factor correction converter. Proc. 10th IEEE Annu. Appl. Power Electron. Conf. Expo. 1995, 1, 434–439. [Google Scholar]
- Mohan, N.; Undeland, T.M.; Robbins, W.P. Power Electronics: Converters, Applications, and Design; John Wiley & Sons: Hoboken, NJ, USA, 2003. [Google Scholar]
- Abdullah, R.; Rahim, N.A.; Raihan, S.R.S.; Ahmad, A.Z. Five-level diode-clamped inverter with three-level boost converter. IEEE Trans. Ind. Electron. 2014, 61, 5155–5163. [Google Scholar] [CrossRef] [Green Version]
- Mao, M.; Cui, L.; Zhang, Q.; Guo, K.; Zhou, L.; Huang, H. Classification and summarization of solar photovoltaic MPPT techniques: A review based on traditional and intelligent control strategies. Energy Rep. 2020, 6, 1312–1327. [Google Scholar] [CrossRef]
- Zeh, A.; Müller, M.; Naumann, M.; Hesse, H.C.; Jossen, A.; Witzmann, R. Fundamentals of using battery energy storage systems to provide primary control reserves in Germany. Batteries 2016, 2, 29. [Google Scholar] [CrossRef] [Green Version]
Figure 1.
The architecture of the PV-fed DC bus charging station.

Figure 2.
PV boost converter circuit: (a) Two-level (2L) boost converter; (b) Three-level (3L) boost converter.
Figure 2.
PV boost converter circuit: (a) Two-level (2L) boost converter; (b) Three-level (3L) boost converter.

Figure 3.
Switching mode and inductor current waveforms: (a) 2 L boost converter; (b) 3 L boost converter.
Figure 3.
Switching mode and inductor current waveforms: (a) 2 L boost converter; (b) 3 L boost converter.

Figure 4.
Current ripple versus duty ratio for two different converter designs (2L and 3L).

Figure 5.
Power converters used in the model: (a) EV buck converter and (b) ESU bi-directional DC–DC converter.
Figure 5.
Power converters used in the model: (a) EV buck converter and (b) ESU bi-directional DC–DC converter.

Figure 6.
Control algorithms regulating the charging station: (a) PV boost converter, (b) EV charger and (c) ESU charger.
Figure 6.
Control algorithms regulating the charging station: (a) PV boost converter, (b) EV charger and (c) ESU charger.

Figure 7.
Flow chart of the ESU buck/boost mode detection.

Figure 8.
(a) Hybrid ESU control; (b) Hybrid EV charger current control.

Figure 9.
Block diagram illustrating the overall control strategy proposed in this work.

Figure 10.
Solar irradiance profiles adopted in the numerical simulations.

Figure 11.
(a) DC bus voltage, (b) currents of PV array 1, 2 and 3, (c) ESU current, (d) ESU SoC and (e) 20 EV charging currents for Case 1.
Figure 11.
(a) DC bus voltage, (b) currents of PV array 1, 2 and 3, (c) ESU current, (d) ESU SoC and (e) 20 EV charging currents for Case 1.


Figure 12.
DC bus voltage for Case 2.

Figure 13.
DC bus voltage for Case 3.

Figure 14.
(a) and (b) DC bus voltage without droop control.

Figure 15.
(a) and (b) DC bus voltage with droop control.

Figure 16.
(a) ESU battery SoC; (b) Controller gain and ; (c) ESU current; (d) DC bus voltage.


Table 1.
Comparison of existing literature on islanded DC charging systems.
| Ref. [19] | Ref. [27] | Ref. [28,29] | |
|---|---|---|---|
| PV arrays | ✓ | ✓ | ✓ |
| Energy storage | ✓ | ✓ | ✓ |
| Fast disturbance considered | ✓ | ✓ | |
| PV-ESU coordination | ✓ | ✓ | |
| PV-ESU-EV coordination |
Table 2.
System parameters.
| Component | Value | |
|---|---|---|
| Source Side | PV module quantity | = 14 × 90 × 3 |
| Per module Max. voltage | = 35 V | |
| Per module Max. current | = 8 A | |
| Per module Max. Power at STC | = 280 W | |
| 3L converter input side capacitor | = 0.3 mF | |
| 3L converter inductor | = 1 mH | |
| Converter output side capacitor | = = 4.2 mF | |
| PI controller | = 10, = 150 | |
| Charger Side | EV battery charger type 1 | = 400 V; = 80 A Init. SoC = 5% |
| EV battery charger type 2 | = 400 V; = 125 A Init. SoC = 5% | |
| Buck converter | = 25 µF = 2.5 mH | |
| ESU | ESU battery | = 500 V Cap: 1000 Ah Init. SoC = 40% |
| Bi-directional dc/dc converter | = 25 µF = 1 mH | |
Publisher’s Note: MDPI stays neutral with regard to jurisdictional claims in published maps and institutional affiliations. |
© 2021 by the authors. Licensee MDPI, Basel, Switzerland. This article is an open access article distributed under the terms and conditions of the Creative Commons Attribution (CC BY) license (https://creativecommons.org/licenses/by/4.0/).
Share and Cite
MDPI and ACS Style
Huang, H.; Balasubramaniam, S.; Todeschini, G.; Santoso, S. A Photovoltaic-Fed DC-Bus Islanded Electric Vehicles Charging System Based on a Hybrid Control Scheme. Electronics 2021, 10, 1142. https://doi.org/10.3390/electronics10101142
AMA Style
Huang H, Balasubramaniam S, Todeschini G, Santoso S. A Photovoltaic-Fed DC-Bus Islanded Electric Vehicles Charging System Based on a Hybrid Control Scheme. Electronics. 2021; 10(10):1142. https://doi.org/10.3390/electronics10101142
Chicago/Turabian StyleHuang, Han, Senthooran Balasubramaniam, Grazia Todeschini, and Surya Santoso. 2021. "A Photovoltaic-Fed DC-Bus Islanded Electric Vehicles Charging System Based on a Hybrid Control Scheme" Electronics 10, no. 10: 1142. https://doi.org/10.3390/electronics10101142
Note that from the first issue of 2016, this journal uses article numbers instead of page numbers. See further details here.