
Gait Symmetry Analysis Based on Dynamic Time Warping


1
Department of Physiotherapy, Józef Piłsudski University of Physical Education in Warsaw, 00-809 Warsaw, Poland
2
Department of Rehabilitation, Faculty of Medical Sciences, Medical University of Warsaw, 02-091 Warsaw, Poland
*
Author to whom correspondence should be addressed.
Symmetry 2021, 13(5), 836; https://doi.org/10.3390/sym13050836
Submission received: 6 April 2021
/
Revised: 27 April 2021
/
Accepted: 6 May 2021
/
Published: 10 May 2021
(This article belongs to the Special Issue New Insights into Motion Analysis)
Abstract
:Background: Gait deviations may negatively affect the articular surfaces of the lower extremity joints and lead to some minor degenerative changes. The simplest method for gait evaluation is to assess the symmetry of its parameters, assuming that each undisturbed gait should be symmetrical. This study aims to quantify the degree of asymmetry of kinematic and kinetic parameters caused by the presence of different ankle orthosis settings using Dynamic Time Warping (DTW). Methods: Barefoot gait and gait with four different walker settings were investigated in eighteen healthy persons. Kinematic and kinetic parameters were measured using the Vicon system and Kistler plates. Symmetry was assessed using the DTW method. Results: It was shown that the presence of different ankle orthosis settings significantly disturbs the symmetry of all lower limb kinematic parameters and only knee and hip torques. The highest values of asymmetry were noted for the walker set at 15° of dorsiflexion (15DF). Conclusions: The DTW method allowed us to quantify the degree of asymmetry throughout the gait cycle in relation to barefoot walking. Our results suggest that each orthosis position analysed in this study fulfills its protective function, but gait 15DF can lead to the overload of knee and hip joints.
Keywords:
Dynamic Time Warping; kinematic; kinetic; walker boot; ankle-foot orthosis; gait; biomechanics1. Introduction
The gait of healthy individuals is characterized by fairly symmetric movement patterns of the lower extremities with minor deviations. In order to adapt to an ever-changing internal and external environment, regulatory feedback loops work across multiple spatial and temporal scales in a pathologic or disturbed gait, and, as a result, the entire gait dynamics change. Therefore, it can be assumed that the gait pattern will not only change under the influence of disease or disability, but also under the influence of orthopedic equipment. Orthopedic walking boots are commonly used for joint stabilization after post-surgical interventions or ankle/foot injuries [1,2]. However, the restriction of mobility in joints caused by the orthosis influences the way other joints move [3,4,5]. Although most authors have analyzed the impact of wearing the orthosis on kinematic [6,7] and kinetic [4,8,9] gait parameters, there have not been many studies on symmetry analysis. Gait symmetry is an important determinant of gait pattern alterations and is used to establish the degree of functional limitation due to pathology or other factors such as pain or the presence of an orthosis.
Viteckova et al. [10] reviewed symmetry approaches and distinguished four main classes of symmetry measures: discrete, complete (continuous), nonlinear, and statistical. The most commonly used methods are discrete approaches such as ratio index (RI), symmetry index (SI), and symmetry angle (SA) [11]. Research using these indicators mainly includes the quantification of temporal and spatial parameters, such as gait phase duration, cadence, or ground reaction force peak values. Although discrete indices provide information about discrete time events, they ignore information in time-domain waveforms. This requires a different category of measures which assesses the development of a feature over the gait cycle. This category includes four methods: trend symmetry [12], cyclogram [13], region of deviation [14], and the symbol-based method [15]. Nonlinear methods such as multiresolution entropy and cross-fuzzy entropy were used as a measure of the similarity between two signals [16,17]. Nonlinear methods work similarly to discrete methods but are more sophisticated. The main function is to decompose the original data over multiple levels, and at each level, from a pair of time-series (one on the left leg and one on the right leg), the modified entropy of the sample is calculated [16]. In the last group, the statistical approaches can be applied to both discrete values and continuous signals. In the case of continuous signals, the cross-correlation [18], principal component analysis (PCA) [19], and root-mean-square (RMS) difference [20] were calculated. For discrete values, typical parametric or non-parametric statistics were applied. Each of the above-mentioned methods has some disadvantages. Therefore, the use of the Dynamic Time Warping (DTW) algorithm has become increasingly prevalent in gait analysis in the last few years [21,22]. DTW is one of the algorithms for measuring similarity between two temporal sequences which may vary in speed. According to Lee [23], DTW is known as the best algorithm for evaluating the similarity between two time-series data that vary in time frames as well as in nonlinear time-series data. The DTW algorithm was developed to solve the difficulties in analyzing pattern similarity in time-series data. This method was successfully applied in various fields, such as word recognition [24]; online handwriting and signature recognition [25]; off-line recognition of a small gesture and a vision-based gesture [26]; data mining [27]; computer animation and chemical engineering [28]; and rehabilitation, treatment, and development of exercise programs [26,29].
Moreover, DTW can statistically determine the degree of similarity by the normalization of matching cost calculated in DTW [23,30]. Li et al. [31] used DTW to diagnose post-stroke disease. They showed that the difference in the DTW of patients with hemiplegia was much larger than that of healthy control subjects. Gaspar, Welke, Seehaus, Hurschler, and Schwarze [21] suggested that DTW can be used for the similarity test of gait research, which was confirmed by Lee [23]. Despite the use of DTW in many areas of knowledge, not many studies have been found that aimed to assess gait symmetry using this method. This study aims to quantify the degree of asymmetry of lower limb kinematic and kinetic parameters caused by the presence of four different orthopedic walking boot settings using Dynamic Time Warping analysis.
2. Materials and Methods
2.1. Participants and Procedures
The study group comprised of eighteen healthy persons aged 20.88 ± 1.27 years with a mean body height of 1.71 ± 0.52 m, a body weight of 65.44 ± 5.71 kg, and a shoe size of 39–42 (EUR). The participants reported having no existing lower limb injuries in the last 6 months prior to testing, followed by at least 2 days of restricted activity. The participants gave written consent to participate in the experimental procedures. The study protocol was approved by the University Research Ethics Committee.
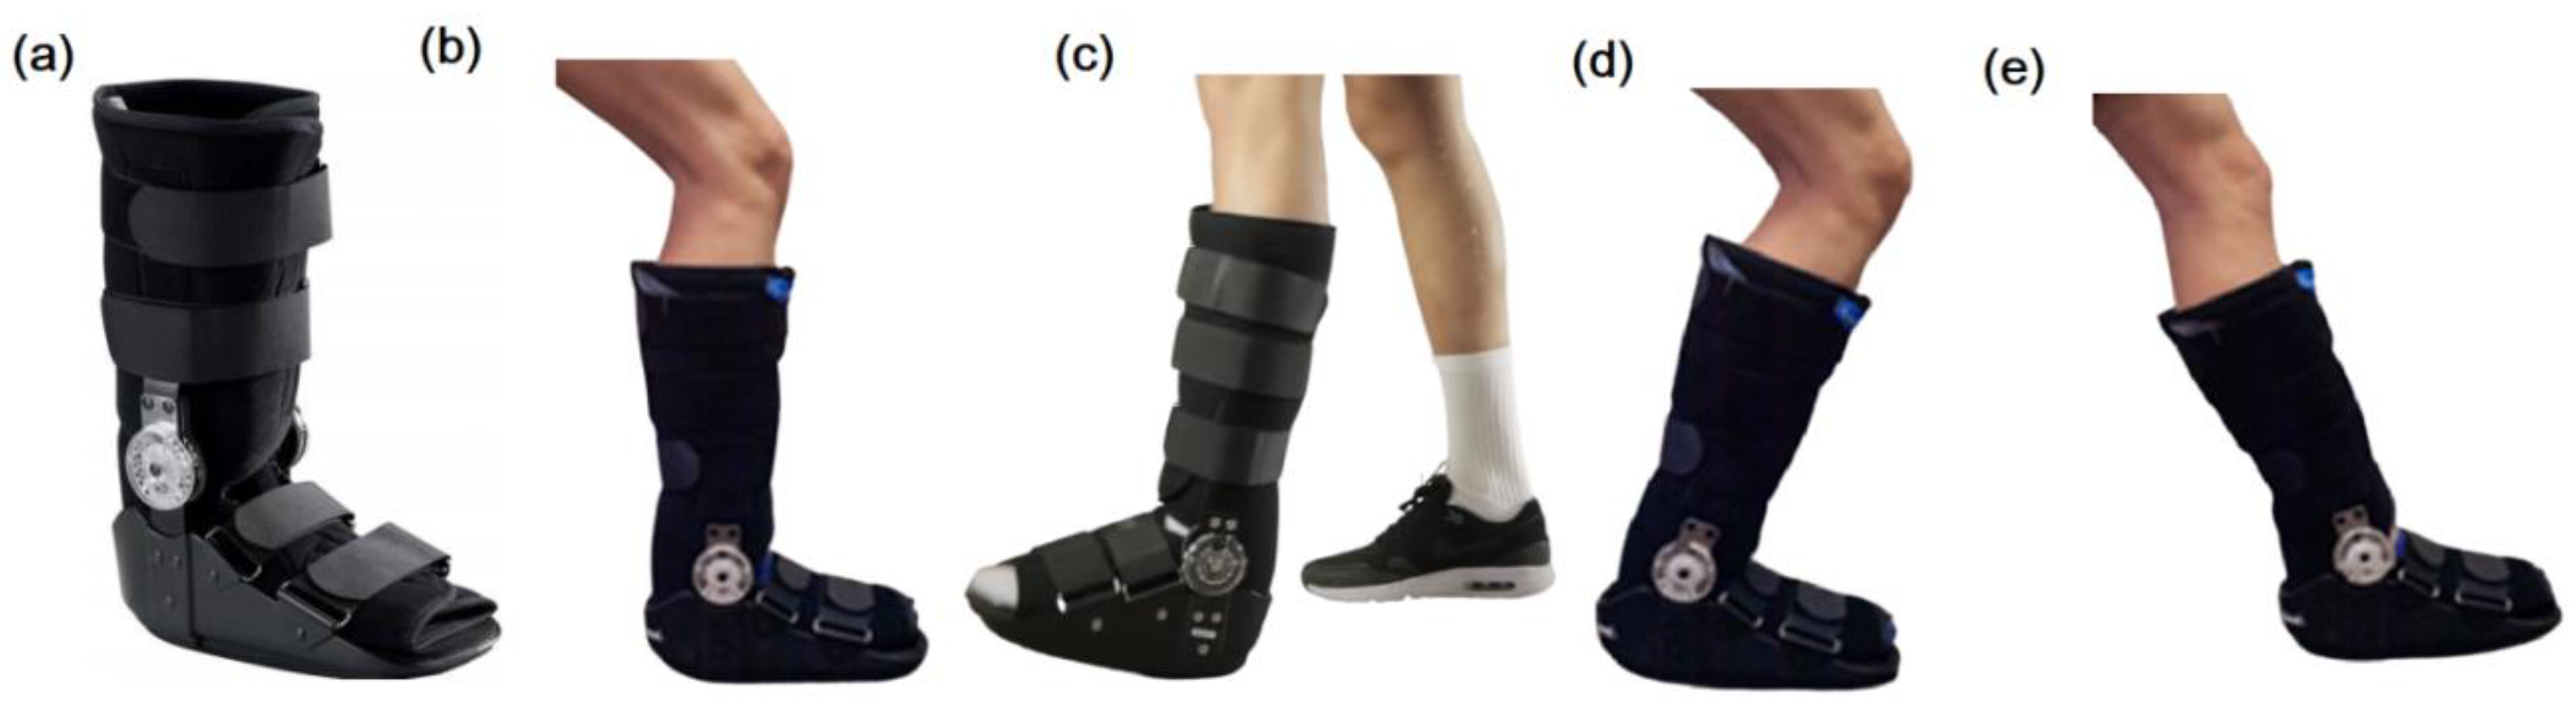
All subjects performed fifteen trials of gait at a self-selected speed, with three samples of barefoot gait and three samples of gait in each of the four walker settings (Figure 1). The long TD ROM Walker U08202 boot (Thuasne, France) that was used in this study was always worn on the right lower limb. The left foot was bare. Thus, the following walker boot settings were used in the study: (1) BF: barefoot walking, (2) ZERO: the walker boot locked at 0° (ankle joint set in an intermediate position) (Figure 1b), (3) ZEROshoe: the walker boot locked at 0° and the sports shoe on the left foot (Figure 1c), (4) 15DF: the walker boot locked at 15° of dorsiflexion (Figure 1d), and (5) 15PF: the walker boot locked at 15° of plantarflexion (Figure 1e).
Prior to the experiment, anthropometric measurements were taken for each subject. Next, fifteen spherical markers were placed at anatomical landmarks according to the biomechanical lower body Plug-in-Gait (SACR) model available in the motion capture system (Vicon Motion Systems Ltd., Oxford, UK). In the case of a limb in a walker, markers were placed on the boot at appropriate points coinciding with the anatomical ones. The markers on the walker boot were not removed between the measurements. Two force plates (Kistler Holding AG, Winterthur, Switzerland) embedded into the floor were used to measure ground reaction force data at a sampling rate of 1000 Hz. A motion capture system consisting of nine infrared cameras was employed to collect kinematic data at a sampling rate of 100 Hz. The force plates were synchronized with the motion capture system. Before the trials, both systems were calibrated according to the manufacturer’s recommendations.
2.2. Data Analysis
The analysis included trials in which no missing markers were noted and those in which complete gait cycles were present for the right and left lower limb. Thus, the kinematic and kinetic data of one trial for each gait of each participant were imported into the MatLab software (MathWorks, Natick, MA, USA). Waveforms for lower limb angles and torques from the sagittal plane were normalized for 100% of the gait cycle using the interpolation method. Afterward, the data were filtered by a second order low-pass Butterworth filter. Therefore, time-series with 100 points each were received. Next, Dynamic Time Warping (DTW) analysis was used to count the differences between the right and left limb curves for all kinematic and kinetic parameters.
DTW is an algorithm that returns a distance measure calculating the similarity between two time-series. If A and B are two time-series of length, m and n, respectively: and . In order to align two sequences using DTW, an n-by-m matrix should be constructed. The elements of the matrix are distances between two points: and . In this paper, the distance between two points is represented by Euclidean distance: . To find the best match between these two sequences, a path through the matrix that minimizes the total cumulative distance between them was retrieved. In particular, the optimal path is the path that minimizes the warping cost: , where is the matrix element that also belongs to the k-th element of a warping path W, a contiguous set of matrix elements that represents a mapping between A and B.
It was assumed that the lower the DTW value, the greater the symmetry of the analyzed parameters. If DTW = 0, then the curves coincided and full symmetry was present. The DTW method was applied for each walker boot setting and each person.
The statistical analysis was conducted using Statistica 13.1 (TIBCO Software, Inc., Palo Alto, CA, USA). The significance level was set at 0.05. Not all parameters met the requirements for the normality of the data using the Shapiro–Wilk test. For this reason, and because of the small number of participants, the non-parametric Kruskal–Wallis test and the post hoc test (multiple comparisons of mean ranks for all groups) were applied to detect differences between the DTW calculated for free gait and for each walker boot setting for lower limb joint angles and torques in the sagittal plane. Then, the percentage differences between the DTW values calculated for gait in the orthosis in relation to the barefoot gait were calculated. It was assumed that the DTW values calculated for barefoot walking should be the lowest due to the fact that the subjects were healthy and showed no signs of asymmetry.
3. Results
3.1. Kinematic Parameters
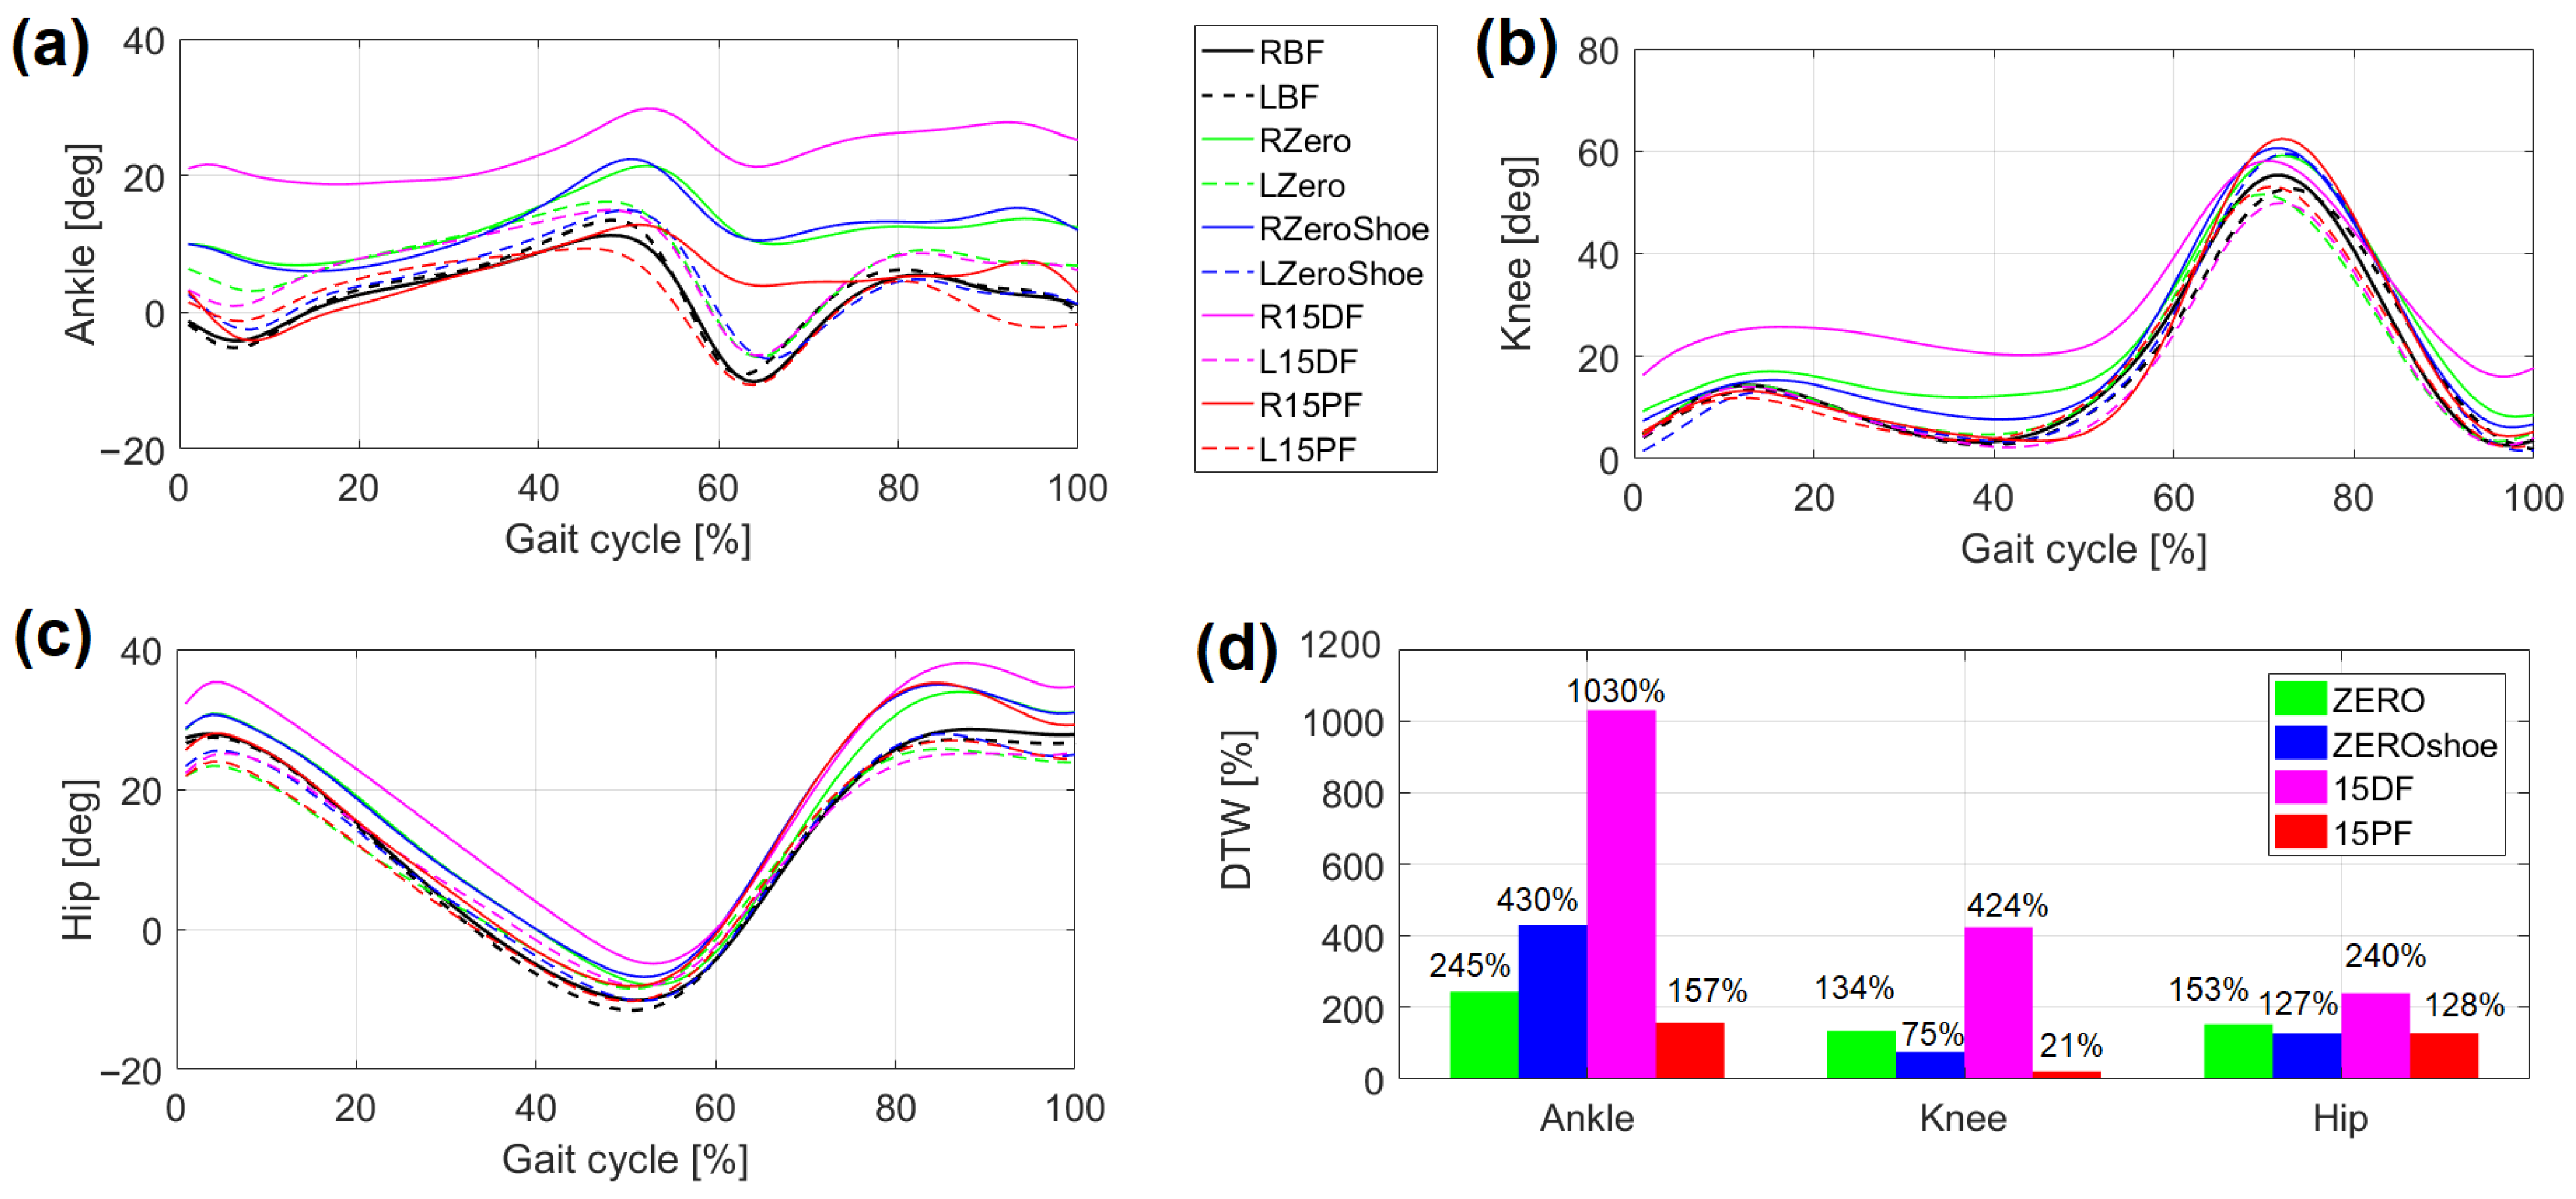
The presence of different orthosis settings on the right lower limb caused a change in the kinematic parameters of the examined gaits (Figure 2a–c).
When calculating the DTW values between the right and left joint angle curves, the lowest values were obtained during barefoot gait for each joint (Table 1). Therefore, the assumption has been met and these values have been taken as reference. The Kruskal–Wallis test showed significantly different results for all lower limb joints, as follows: ankle angle: H(4, N = 90) = 70.05 p = 0.0001; knee angle: H(4, N = 90) = 45.25 p = 0.0001; hip angle: H(4, N = 90) = 32.53 p = 0.0001.
After conducting a post hoc test for DTW calculated for ankle joint, statistically significant differences (p = 0.0001) were found between BF vs. ZERO, ZEROshoe, and 15DF (Table 1). The smallest and highest differences between the curves calculated between the left and the right lower limbs were found during the gait with the walker set on 15° of plantarflexion (15PF) and the gait with the walker set on 15° of dorsiflexion (15DF), respectively (Table 1). This confirms the behavior of the mean curve for the ankle angle in Figure 2a. It can be noticed that the average curve for the right leg in the walker set on 15° of dorsiflexion is different from the rest, while the one for the left leg is close to normal.
A smaller number of statistically significant differences was found for the knee angles compared to those presented for the ankle joint. Significant differences were observed between BF vs. ZERO and 15DF (Table 1). Similar to the ankle joint, in relation to the barefoot gait, the greatest asymmetry tendency was during gait in the walker boot locked at 15° of dorsiflexion (Figure 2d). It should be noted that the range of differences was less noticeable for the hip joint (Figure 2c,d). Significant differences were found between the DTW values calculated for barefoot gait and gait with all walker settings: BF vs. ZERO, ZEROshoe, 15DF, and 15PF (Table 1). Again, the greatest increase in the DTW value in relation to the reference was recorded for 15DF—240% (Figure 2d). Summarizing the trends of kinematic parameters for all orthosis settings except 15DF, the highest increase in DTW values in relation to the reference was obtained for the ankle, and the lowest was obtained for the knee joint (Figure 2d).
By comparing the DTW values calculated for individual joints in barefoot gait, no statistically significant differences were observed. The biggest symmetry (the lowest mean DTW) values were in the sequences for hip, ankle, and knee (Table 1). For the remaining gaits, in different walker boot settings, statistically significant differences were found between the DTW values calculated for individual joints. For the walker boot set at 0°, the lowest mean DTW value was seen for the hip and the highest for the ankle (p = 0.0361). When a sports shoe for the opposite leg was added to this walker setting, the mean asymmetry increased for the ankle angle. The values for the knee and hip were significantly lower compared to those for the ankle. When the walker boot was locked at 15° of dorsiflexion, the highest DTW value was noted for the ankle. This value was significantly higher than those of the knee and hip. The last walker boot setting (15° of plantarflexion) caused a significant decrease in asymmetry for the knee and hip joints. Therefore, the above results confirm the behavior of the curves presented in Figure 2a–c.
3.2. Kinetic Parameters
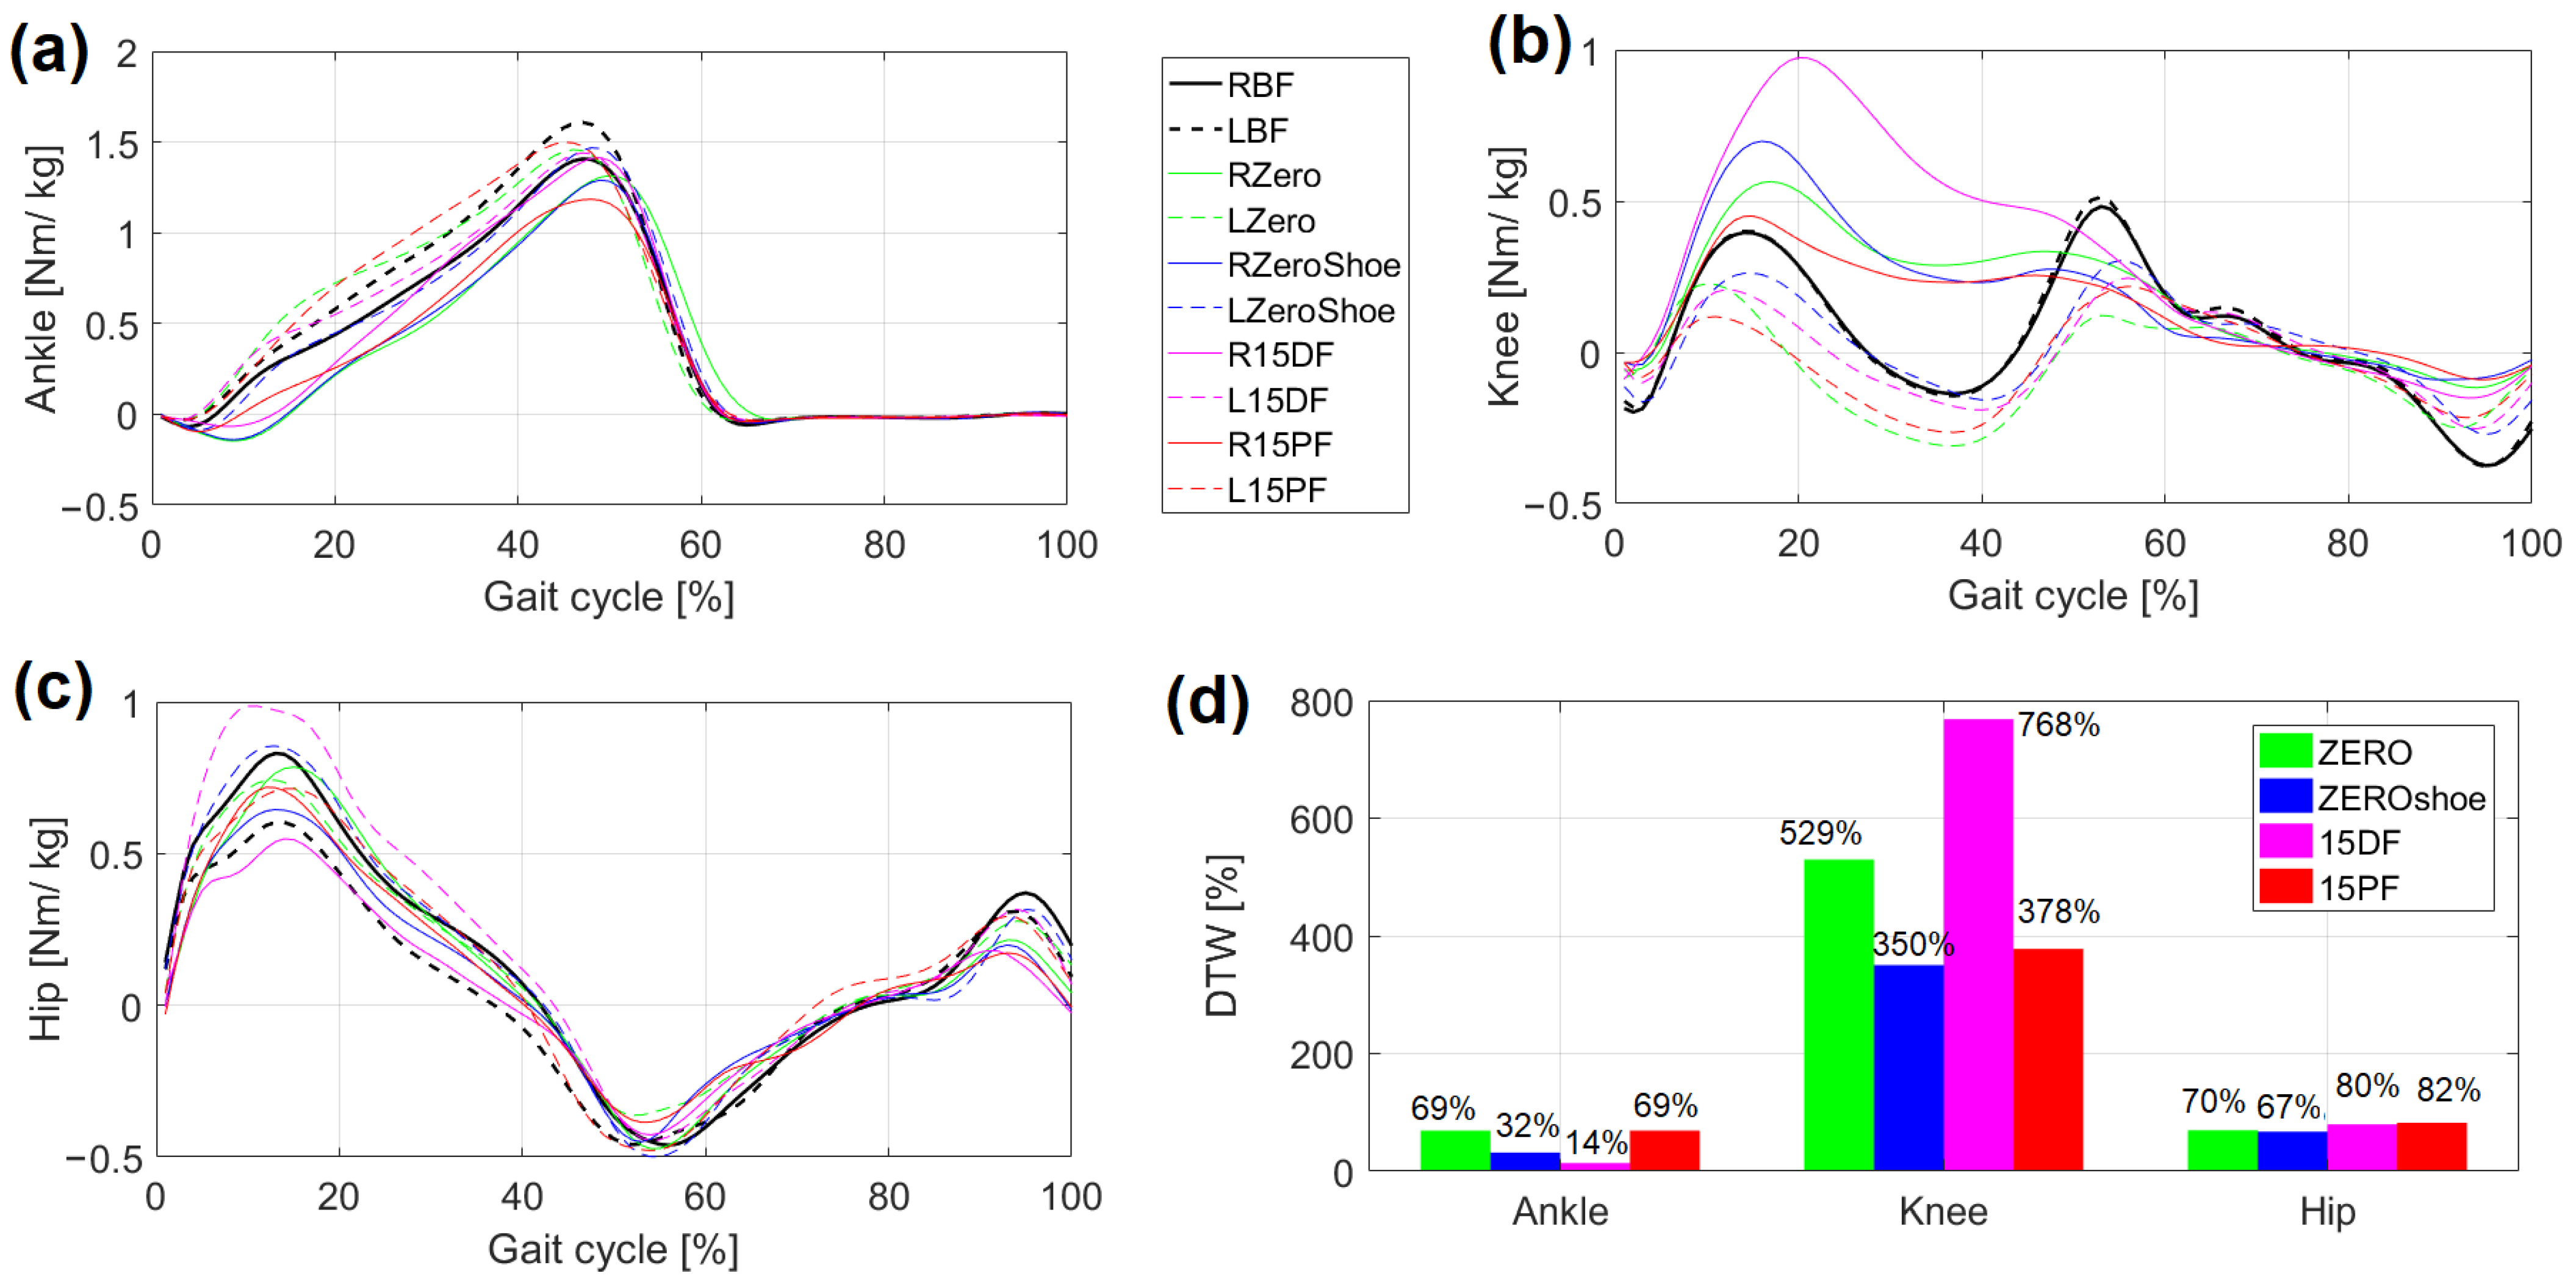
As for the kinematic parameters, the changes also took place in the shape of kinetic curves (Figure 3a–c). This time, curves for the ankle joint were within similar limits of value in each type of gait, and major changes were visible for knee torque trajectories (Figure 3b). For the hip joint, the differences were less noticeable (Figure 3c).
When calculating the DTW values between the right and left joint torque curves, the lowest values were obtained during barefoot gait for each joint (Table 2). The results of the Kruskal–Wallis test showed statistically significant differences only for the knee and hip torques. H(4, N = 90) = 53.96, p = 0.0001 and H(4, N = 90) = 17.89, p = 0.0013 were observed for the knee and the hip torques, respectively. After conducting a post hoc test for DTW, statistically significant knee and hip torque differences were found between BF vs. ZERO, ZEROshoe, 15DF, and 15PF (Table 2). Summarizing the trends of kinetic parameters for all orthosis settings in relation to the reference values, the highest increase in DTW values were obtained for the knee, and the lowest were obtained for the ankle joint (Figure 3d).
When comparing the DTW values calculated for individual joints (Table 2) in free gait, the greatest symmetry, and thus curves similarity (the lowest mean DTW value) was recorded for the knee and ankle, then for the hip torque (p = 0.0012). For the remaining gaits, in different walker boot settings, statistically significant differences were found between the DTW values calculated for ankle torque and hip torque (p = 0.0001) and between the ankle and knee torque (p = 0.0001). During barefoot gait (BF), gait with sports shoe and walker boot locked at 0° (ZEROshoe), and gait with walker boot locked at 15° plantarflexion (15PF), the highest DTW mean values were noted for the hip. For the remaining walker boot settings (ZERO and 15DF), the highest DTW mean values were calculated for knee joint torque.
4. Discussion
The aim of this study was to quantify, using the Dynamic Time Warping (DTW) method, the degree of asymmetry of kinematic and kinetic parameters caused by the presence of ankle orthosis in four different settings on one lower limb.
In biomechanics, time-series data such as kinematic and kinetic variables are frequently used as a tool to understand human movement. This study sought to confirm the applicability of DTW for the analysis of gait curves similarity in terms of symmetry. In previous studies using DTW for gait analysis, Gaspar, Welke, Seehaus, Hurschler, and Schwarze [21] conducted a study to validate the sensitivity of DTW by comparing it to other metrics such as the Pearson correlation coefficient and the Root Mean Square Error (RMS). They proposed that DTW can be used in both direct and indirect quantitative validation. Moreover, Clemens et al. [32] and Li, Tian, Sun, and Chen [31] confirmed that the DTW method can be used to detect differences in gait parameters and, therefore, its symmetry. The advantage of DTW was also confirmed in assessing both the dynamic gait variability description and accuracy increase in the study of Ghaderyan and Ghoreshi Beyrami [33]. Using Dynamic Time Warping also helps to see effects that have low in-group variances, and its uniqueness is tied to quantitative differences of homogeneous events [34].
In the current study, using the DTW method we successfully showed that the presence of different ankle orthosis settings significantly disturbs the symmetry of all lower limb kinematic and kinetic parameters. It should be emphasized that the DTW method provides results in the units in which the analyzed variables are given. Such results mean that kinematic parameters (expressed in degrees) and kinetic variables (expressed in Nm/kg) have to be considered separately. However, in this study, in addition to the above-mentioned approach, a reference to the reference curves was used. The reference curves were calculated for barefoot walking only, as were the DTW values between the curves for the right and left lower limb joints. Indeed, it was shown that for each joint and each parameter, the DTW values were the lowest in barefoot walking. With respect to these curves, the percentage differences for each joint in each gait in each orthosis position was calculated. This approach made it possible to interpret the data as percentages, which allowed for the assessment of the scale of asymmetry in the study group. As a result of this approach, it was shown that within each gait for kinematic parameters the highest DTW values were noted for the ankle and hip joints (greatest asymmetry). However, for the knee joint and also the hip joint, the highest DTW values were observed for kinetic parameters. For kinematic parameters, the gait in the walker boot locked at 15° of dorsiflexion (15DF) slightly deviates from the described tendency. In this case, the most evident changes were noted for the ankle joint itself. Here, the highest (1030%) increase in the DTW value in relation to the reference was recorded. Such changes did not significantly affect the hip kinematic like in another cases, but the knee joint (424%). As a result, knee flexion torque in the loading response and in the mid stance phases was almost double in comparison to that of knee flexion torque recorded for free gait. Here, DTW values increased by 768%. It is worth noting that each setting of the orthosis resulted in large changes in the shape of the knee torque. DTW grew in the range of 350–768%, while for kinematic parameters the changes were smaller: 21–424%. Therefore, setting the walker boot in 15 degrees of dorsiflexion significantly affects both knee and hip joints, and can lead to joint overload, especially in situations of prolonged immobilization of the ankle. Furthermore, the increased asymmetry of ankle kinematic can lead to contralateral ankle overload. A slightly better situation is observed with the walker boot set in neutral position: a great asymmetry observed in knee torque can affect the knee joint. It should be emphasized that, such asymmetries can cause joint pain or discomfort, although such analysis was not the aim of this study. It can also be the reason for early degenerative changes in the overloaded joint.
The existence of asymmetry in kinematic data in the gait with the orthopaedic boot in zero setting was confirmed by Severin et al. [2], who noticed a slightly greater range of motion in the hip with the boot than in the contralateral limb with a shoe. This study also confirmed the influence of boot-wearing conditions on the hip joint flexion moment, as well as on the knee flexion and knee extension moments. Wearing a boot increased the asymmetry in the knee and reduced it in the hip joint, according to the symmetry index results. The high asymmetry of kinematic data for knee and hip joint, as well as the asymmetry of the knee joint moment in the sagittal plane, was also confirmed by Gulgin, Hall, Luzadre, and Kayfish [1]. However, they found only small differences in ground reaction forces. The above-cited studies only used linear parameters to analyze gait and, therefore, are not directly comparable to our results. However, they indirectly confirm that our results, obtained using the DTW method, are correct.
5. Conclusions
Taken together, each walking boot setting affects the degree of asymmetry in each joint of the lower limb, both for kinematic and kinetic parameters. The highest asymmetry was observed in the stance phase for each type of gait, although DTW was calculated for the entire gait cycle. The evaluation of asymmetry provided within this paper showed that the kinematic parameters indicate larger DTW increases than kinetic ones. For kinematic parameters, in each gait the highest increase in the DTW values was noted for the ankle joint and the smallest for the knee. However, for the kinetic parameters, the highest increase in the DTW values in each gait was noted for the knee joint and the smallest for the ankle. This result suggests that each orthosis position analyzed in this study fulfills its protective function. Only the results for the gait with the walker set on 15° of dorsiflexion (15DF) differ from the above-mentioned pattern and could lead to knee and hip joints overload.
Author Contributions
Conceptualization, M.B.; methodology, M.B.; software, M.B.; validation, M.B.; formal analysis, M.B.; investigation, M.B. and K.L.V.L.; resources, M.B.; data curation, M.B. and K.L.V.L.; writing—original draft preparation, M.B.; writing—review and editing, M.B., A.H.; visualization, M.B.; supervision, M.B.; project administration, M.B.; funding acquisition, M.B., A.H. All authors have read and agreed to the published version of the manuscript.
Funding
This research received no external funding.
Institutional Review Board Statement
The study was conducted according to the guidelines of the Declaration of Helsinki, and approved by the University Research Ethics Committee of Józef Piłsudski University of Physical Education in Warsaw (protocol no. SKE 01-34/2018, approved 18/12/2018).
Informed Consent Statement
Informed consent was obtained from all subjects involved in the study.
Data Availability Statement
Data available on request due to restrictions of privacy. The data presented in this study are available on request from the corresponding author.
Acknowledgments
This work was supported by the Ministry of Science and Higher Education in the year 2020–2022 under Research Group no 3 at Józef Pilsudski University of Physical Education in Warsaw “Motor system diagnostics in selected dysfunctions as a basis for planning the rehabilitation process” and statutory funds of the Medical University of Warsaw (grant no. 2F1/N/21).
Conflicts of Interest
The authors declare no conflict of interest.
References
- Gulgin, H.; Hall, K.; Luzadre, A.; Kayfish, E. 3D gait analysis with and without an orthopedic walking boot. Gait Posture 2018, 59, 76–82. [Google Scholar] [CrossRef]
- Severin, A.C.; Gean, R.P.; Barnes, S.G.; Queen, R.; Butler, R.J.; Martin, R.; Barnes, C.L.; Mannen, E.M. Effects of a corrective heel lift with an orthopaedic walking boot on joint mechanics and symmetry during gait. Gait Posture 2019, 73, 233–238. [Google Scholar] [CrossRef]
- Zhang, S.; Clowers, K.G.; Powell, D. Ground reaction force and 3D biomechanical characteristics of walking in short-leg walkers. Gait Posture 2006, 24, 487–492. [Google Scholar] [CrossRef]
- Richards, J.; Payne, K.; Myatt, D.; Chohan, A. Do orthotic walkers affect knee and hip function during gait? Prosthet. Orthot. Int. 2016, 40, 137–141. [Google Scholar] [CrossRef] [Green Version]
- Lann Vel Lace, K.; Błażkiewicz, M. A review of the effect of a Walker ankle-foot orthosis on gait biomechanics in healthy individuals. Adv. Rehabil. Postępy Rehabil. 2021. [Google Scholar] [CrossRef]
- McHenry, B.D.; Exten, E.L.; Cross, J.A.; Kruger, K.M.; Law, B.; Fritz, J.M.; Harris, G. Sagittal Subtalar and Talocrural Joint Assessment During Ambulation With Controlled Ankle Movement (CAM) Boots. Foot Ankle Int. 2017, 38, 1260–1266. [Google Scholar] [CrossRef]
- Keene, D.J.; Willett, K.; Lamb, S.E. The Immediate Effects of Different Types of Ankle Support Introduced 6 Weeks After Surgical Internal Fixation for Ankle Fracture on Gait and Pain: A Randomized Crossover Trial. J. Orthop. Sports Phys. 2016, 46, 157–167. [Google Scholar] [CrossRef] [PubMed]
- Zellers, J.A.; Tucker, L.A.; Higginson, J.S.; Manal, K.; Silbernagel, K.G. Changes in gait mechanics and muscle activity with wedge height in an orthopaedic boot. Gait Posture 2019, 70, 59–64. [Google Scholar] [CrossRef] [PubMed]
- Vanderpool, M.T.; Collins, S.H.; Kuo, A.D. Ankle fixation need not increase the energetic cost of human walking. Gait Posture 2008, 28, 427–433. [Google Scholar] [CrossRef] [PubMed] [Green Version]
- Viteckova, S.; Kutilek, P.; Svoboda, Z.; Krupicka, R.; Kauler, J.; Szabo, Z. Gait symmetry measures: A review of current and prospective methods. Biomed. Signal. Process. Control 2018, 42, 89–100. [Google Scholar] [CrossRef]
- Blazkiewicz, M.; Wiszomirska, I.; Wit, A. Comparison of four methods of calculating the symmetry of spatial-temporal parameters of gait. Acta Bioeng. Biomech. 2014, 16, 29–35. [Google Scholar]
- Crenshaw, S.J.; Richards, J.G. A method for analyzing joint symmetry and normalcy, with an application to analyzing gait. Gait Posture 2006, 24, 515–521. [Google Scholar] [CrossRef] [PubMed]
- Goswami, A. A new gait parameterization technique by means of cyclogram moments: Application to human slope walking. Gait Posture 1998, 8, 15–36. [Google Scholar] [CrossRef]
- Shorter, K.A.; Polk, J.D.; Rosengren, K.S.; Hsiao-Wecksler, E.T. A new approach to detecting asymmetries in gait. Clin. Biomech. 2008, 23, 459–467. [Google Scholar] [CrossRef]
- Sant’anna, A.; Wickström, N. A symbol-based approach to gait analysis from acceleration signals: Identification and detection of gait events and a new measure of gait symmetry. IEEE Trans. Inf. Technol. Biomed. 2010, 14, 1180–1187. [Google Scholar] [CrossRef] [PubMed] [Green Version]
- Liao, F.; Wang, J.; He, P. Multi-resolution entropy analysis of gait symmetry in neurological degenerative diseases and amyotrophic lateral sclerosis. Med. Eng. Phys. 2008, 30, 299–310. [Google Scholar] [CrossRef] [PubMed]
- Xie, H.-B.; Zheng, Y.-P.; Guo, J.-Y.; Chen, X. Cross-fuzzy entropy: A new method to test pattern synchrony of bivariate time series. Inf. Sci. 2010, 180, 1715–1724. [Google Scholar] [CrossRef]
- Park, K.; Dankowicz, H.; Hsiao-Wecksler, E.T. Characterization of spatiotemporally complex gait patterns using cross-correlation signatures. Gait Posture 2012, 36, 120–126. [Google Scholar] [CrossRef] [PubMed]
- Hoerzer, S.; Federolf, P.A.; Maurer, C.; Baltich, J.; Nigg, B.M. Footwear Decreases Gait Asymmetry during Running. PLoS ONE 2015, 10, e0138631. [Google Scholar] [CrossRef] [PubMed]
- Blazkiewicz, M.; Wit, A. Comparison of sensitivity coefficients for joint angle trajectory between normal and pathological gait. Acta Bioeng. Biomech. 2012, 14, 83–91. [Google Scholar]
- Gaspar, M.; Welke, B.; Seehaus, F.; Hurschler, C.; Schwarze, M. Dynamic Time Warping compared to established methods for validation of musculoskeletal models. J. Biomech. 2017, 55, 156–161. [Google Scholar] [CrossRef] [PubMed]
- Barth, J.; Oberndorfer, C.; Pasluosta, C.; Schulein, S.; Gassner, H.; Reinfelder, S.; Kugler, P.; Schuldhaus, D.; Winkler, J.; Klucken, J.; et al. Stride segmentation during free walk movements using multi-dimensional subsequence dynamic time warping on inertial sensor data. Sensors 2015, 15, 6419–6440. [Google Scholar] [CrossRef] [PubMed]
- Lee, H.S. Application of dynamic time warping algorithm for pattern similarity of gait. J. Exerc. Rehabil. 2019, 15, 526–530. [Google Scholar] [CrossRef] [PubMed] [Green Version]
- Gilbert, J.M.; Rybchenko, S.I.; Hofe, R.; Ell, S.R.; Fagan, M.J.; Moore, R.K.; Green, P. Isolated word recognition of silent speech using magnetic implants and sensors. Med. Eng. Phys. 2010, 32, 1189–1197. [Google Scholar] [CrossRef]
- Efrat, A.; Fan, Q.; Venkatasubramanian, S. Curve Matching, Time Warping, and Light Fields: New Algorithms for Computing Similarity between Curves. J. Math. Imaging Vis. 2007, 27, 203–216. [Google Scholar] [CrossRef] [Green Version]
- Bautista, M.A.; Hernandez-Vela, A.; Escalera, S.; Igual, L.; Pujol, O.; Moya, J.; Violant, V.; Anguera, M.T. A Gesture Recognition System for Detecting Behavioral Patterns of ADHD. IEEE Trans. Cybern. 2016, 46, 136–147. [Google Scholar] [CrossRef] [Green Version]
- Shokoohi-Yekta, M.; Hu, B.; Jin, H.; Wang, J.; Keogh, E. Generalizing DTW to the multi-dimensional case requires an adaptive approach. Data Min. Knowl. Discov. 2017, 31, 1–31. [Google Scholar] [CrossRef] [Green Version]
- Vial, J.; Nocairi, H.; Sassiat, P.; Mallipatu, S.; Cognon, G.; Thiebaut, D.; Teillet, B.; Rutledge, D.N. Combination of dynamic time warping and multivariate analysis for the comparison of comprehensive two-dimensional gas chromatograms: Application to plant extracts. J. Chromatogr. A 2009, 1216, 2866–2872. [Google Scholar] [CrossRef]
- AbdelMaseeh, M.; Chen, T.; Stashuk, D.W. Extraction and Classification of Multichannel Electromyographic Activation Trajectories for Hand Movement Recognition. IEEE Trans. Neural Syst. Rehabil. Eng. 2016, 24, 662–673. [Google Scholar] [CrossRef] [PubMed]
- Pulido-Valdeolivas, I.; Gómez-Andrés, D.; Martín-Gonzalo, J.A.; Rodríguez-Andonaegui, I.; López-López, J.; Pascual-Pascual, S.I.; Rausell, E. Gait phenotypes in paediatric hereditary spastic paraplegia revealed by dynamic time warping analysis and random forests. PLoS ONE 2018, 13, e0192345. [Google Scholar] [CrossRef] [Green Version]
- Li, M.; Tian, S.; Sun, L.; Chen, X. Gait Analysis for Post-Stroke Hemiparetic Patient by Multi-Features Fusion Method. Sensors 2019, 19, 1737. [Google Scholar] [CrossRef] [PubMed] [Green Version]
- Clemens, S.; Kim, K.J.; Gailey, R.; Kirk-Sanchez, N.; Kristal, A.; Gaunaurd, I. Inertial sensor-based measures of gait symmetry and repeatability in people with unilateral lower limb amputation. Clin. Biomech. 2020, 72, 102–107. [Google Scholar] [CrossRef] [PubMed]
- Ghaderyan, P.; Ghoreshi Beyrami, S.M.G. Neurodegenerative diseases detection using distance metrics and sparse coding: A new perspective on gait symmetric features. Comput. Biol. Med. 2020, 120, 103736. [Google Scholar] [CrossRef]
- Weiske, F.; Böhme, M.; Jäkel, J.; Zentner, J.; Witt, M. Stair ascent comparison of lower limb kinematics with differing time normalization techniques. J. Biomech. 2021, 119, 110316. [Google Scholar] [CrossRef] [PubMed]
Figure 1.
Different walker boot settings: (a) TD ROM Walker U08202 boot, (b) the walker boot locked at 0°, (c) the walker boot locked at 0° and sports shoe, (d) the walker boot locked at 15° of dorsiflexion, and (e) the walker boot locked at 15° of plantarflexion.
Figure 1.
Different walker boot settings: (a) TD ROM Walker U08202 boot, (b) the walker boot locked at 0°, (c) the walker boot locked at 0° and sports shoe, (d) the walker boot locked at 15° of dorsiflexion, and (e) the walker boot locked at 15° of plantarflexion.

Figure 2.
Influence of individual walker boot settings on mean kinematic parameters: (a) ankle angle trajectories, (b) knee angle trajectories, (c) hip angle trajectories, (d) DTW percentage in relation to BF, where: L—left lower limb; R—right lower limb; BF—barefoot walking; ZERO—the walker boot locked at 0°; ZEROshoe—the walker boot locked at 0° and the sports shoe on left foot; 15DF—the walker boot locked at 15° of dorsiflexion; and 15PF—the walker boot locked at 15° of plantarflexion.

Figure 3.
Influence of individual walker boot settings on kinetic parameters: (a) ankle torque trajectories, (b) knee torque trajectories, (c) hip torque trajectories, (d) DTW percentage in relation to BF, where: L—left lower limb; R—right lower limb; BF—barefoot walking; ZERO—the walker boot locked at 0°; ZEROshoe—the walker boot locked at 0° and the sports shoe on left foot; 15DF—the walker boot locked at 15° of dorsiflexion; and 15PF—the walker boot locked at 15° of plantarflexion.


Table 1.
Mean and standard deviation of DTW values calculated between left and right lower limb joint angles for each walker boot setting.
Table 1.
Mean and standard deviation of DTW values calculated between left and right lower limb joint angles for each walker boot setting.
| Gait | Ankle | Knee | Hip |
|---|---|---|---|
| BF | 148.27 ± 86.09 | 163.11 ± 82.56 | 126.34 ± 86.42 |
| ZERO | 511.55 ± 240.57 | 381.36 ± 196.06 | 320 ± 145.28 |
| BF vs. ZERO (p value) | p = 0.0001 * | p = 0.0095 * | p = 0.0015 * |
| ZEROshoe | 785.81 ± 340.41 | 286.14 ± 182.38 | 287.39 ± 168.75 |
| BF vs. ZEROshoe (p value) | p = 0.0001 * | p = 0.2598 | p = 0.0355 * |
| 15DF | 1675.55 ± 356.56 | 854.69 ± 461.49 | 429.21 ± 161.17 |
| BF vs. 15DF (p value) | p = 0.0001 * | p = 0.0001 * | p = 0.0001 * |
| 15PF | 381.73 ± 102.9 | 197.14 ± 97.5 | 288.18 ± 134.71 |
| BF vs. 15PF (p value) | p = 0.0795 | p = 0.4512 | p = 0.0111 * |
*—significant differences between DTW values calculated for comparison between gait in orthosis and the barefoot gait, p < 0.05.
Table 2.
Mean and standard deviation of DTW values calculated between left and right lower limb joint torques for each walker boot setting.
Table 2.
Mean and standard deviation of DTW values calculated between left and right lower limb joint torques for each walker boot setting.
| Gait | Ankle | Knee | Hip |
|---|---|---|---|
| BF | 3.27 ± 2.06 | 2.67 ± 1.16 | 8.16 ± 5.22 |
| ZERO | 5.53 ± 4.53 | 16.81 ± 6.84 | 13.85 ± 4.31 |
| BF vs. ZERO (p value) | p = 0.8269 | p = 0.0001 * | p = 0.0244 * |
| ZEROshoe | 4.31 ± 3.89 | 12.02 ± 3.83 | 13.66 ± 4.4 |
| BF vs. ZEROshoe (p value) | p = 0.8945 | p = 0.0001 * | p = 0.0210 * |
| 15DF | 3.73 ± 2.64 | 23.18 ± 9.81 | 14.66 ± 6.42 |
| BF vs. 15DF (p value) | p = 0.9821 | p = 0.0001 * | p = 0.0067 * |
| 15PF | 5.53 ± 3.04 | 12.76 ± 5.8 | 14.89 ± 4.49 |
| BF vs. 15PF (p value) | p = 0.0585 | p = 0.0002 * | p = 0.0024 * |
*—significant differences between DTW values calculated for comparison between gait in orthosis and the barefoot gait, p < 0.05.
Publisher’s Note: MDPI stays neutral with regard to jurisdictional claims in published maps and institutional affiliations. |
© 2021 by the authors. Licensee MDPI, Basel, Switzerland. This article is an open access article distributed under the terms and conditions of the Creative Commons Attribution (CC BY) license (https://creativecommons.org/licenses/by/4.0/).
Share and Cite
MDPI and ACS Style
Błażkiewicz, M.; Lann Vel Lace, K.; Hadamus, A. Gait Symmetry Analysis Based on Dynamic Time Warping. Symmetry 2021, 13, 836. https://doi.org/10.3390/sym13050836
AMA Style
Błażkiewicz M, Lann Vel Lace K, Hadamus A. Gait Symmetry Analysis Based on Dynamic Time Warping. Symmetry. 2021; 13(5):836. https://doi.org/10.3390/sym13050836
Chicago/Turabian StyleBłażkiewicz, Michalina, Karol Lann Vel Lace, and Anna Hadamus. 2021. "Gait Symmetry Analysis Based on Dynamic Time Warping" Symmetry 13, no. 5: 836. https://doi.org/10.3390/sym13050836
Note that from the first issue of 2016, this journal uses article numbers instead of page numbers. See further details here.