Article

Geochemical Mapping, Risk Assessment, and Source Identification of Heavy Metals in Road Dust Using Positive Matrix Factorization (PMF)

1
College of Water Conservancy Engineering, Zhengzhou University, Zhengzhou 450001, China
2
Zhengzhou Key Laboratory of Water Resource and Environment, Zhengzhou 450001, China
3
Water Resources Section, Ministry of Planning, Development and Special Initiatives, Islamabad 44000, Pakistan
*
Author to whom correspondence should be addressed.
Atmosphere 2021, 12(5), 614; https://doi.org/10.3390/atmos12050614
Submission received: 11 April 2021 / Revised: 19 April 2021 / Accepted: 7 May 2021 / Published: 10 May 2021
(This article belongs to the Section Air Quality)

Abstract

:
Heavy metals in road dust pose a significant threat to human health. This study investigated the concentrations, patterns, and sources of eight hazardous heavy metals (Cr, Ni, Cu, Zn, As, Cd, Pb, and Hg) in the street dust of Zhengzhou city of PR China. Fifty-eight samples of road dust were analyzed based on three methods of risk assessment, i.e., Geo-Accumulation Index (Igeo), Potential Ecological Risk Assessment (RI), and Nemerow Synthetic Pollution Index (PIN). The results exhibited higher concentrations of Hg and Cd 14 and 7 times higher than their background values, respectively. Igeo showed the risks of contamination in a range of unpolluted (Cr, Ni) to strongly polluted (Hg and Cd) categories. RI came up with the contamination ranges from low (Cr, Ni, Cu, Zn, As, and Pb) to extreme (Cd and Hg) risk of contamination. The risk of contamination based on PIN was from safe (Cu, As, and Pb) to seriously high (Cd and Hg). The results yielded by PIN indicated the extreme risk of Cd and Hg in the city. Positive Matrix Factorization was used to identify the sources of contamination. Factor 1 (vehicular exhaust), Factor 2 (coal combustion), Factor 3 (metal industry), and Factor 4 (anthropogenic activities), respectively, contributed 14.63%, 35.34%, 36.14%, and 13.87% of total heavy metal pollution. Metal’s presence in the dust is a direct health risk for humans and warrants immediate and effective pollution control and prevention measures in the city.

1. Introduction

Higher population densities in urban areas lead to increased levels of anthropogenic activities and the corresponding risk of pollution [1]. A dense population does not only consume more resources but also produces huge amounts of waste [2], which, unavoidably, contains some amounts of different poisons, transgressing nature in numerous perspectives [3]. The trash produced in urban communities is voluminous and diverse compared to rural areas. This waste prompts water contamination during the course of rainfall-induced surface runoff, affecting the overall availability of usable water [4]. The apprehended consequences of environmental contamination that threaten individual and collective lives in many ways, including health issues and socioeconomic impacts, have attracted the attention of researchers in recent decades [5].
Urbanization, vehicles, power plants, waste burning, and annihilation activities cause the accumulation of heavy metals in road dust, culminating in deteriorated air quality [6,7]. Adverse situations and practices disturb indigenous habitats for commercial, residential, and municipal purposes [8]. The level of this disturbance is a function of the degree and diversity of contaminants, which will inevitably cause damage once they surpass the allowable limits [9,10]. The literature also warns that poor quality of soil along the streets [11,12] and water in local water bodies [13,14] can put the wellbeing of inhabitants at grave risk [15]. Heavy metals, for example, are high-risk ecological contaminants that are unequivocally cytotoxic, disguised, and naturally aggregated [16]. The most dangerous form of heavy metal contamination spread is via direct ingestion [17]. Due to their ability of bioaccumulation, they are gravely harmful to the liver and respiratory, gastrointestinal, endocrine, cardiovascular, and hematopoietic systems [18]. In recent years, scientists have been examining the attributes of heavy metals in metropolitan residue [19,20,21]. In spatial investigations, historical analyses have zeroed in heavy metals fixations, and relating ideal outcomes have been attained [19,22,23].
Aerosols, tiny particles in liquid or solid form, suspended in the air significantly contribute to air pollution. These aerosols are capable of affecting certain radiative fluxes and cloud properties as well as the biogeochemical conditions of the ground once they settle on the surface. Dust particles are primary aerosols that detach and arise from the ground surface due to various natural and anthropogenic reasons such as winds and vehicular movement [24,25]. Settling and resuspension of the aerosols is a continuous process. The particles that cannot suspend in the air drop to the ground surface and become part of the street dust [26]. They can enter a water body through the surface overflow during the stormy season and spread residue pollution to an unfathomable extent [27,28]. Hence, aerosols can also cause the spread of various pollutants, including heavy metals. These metals naturally occur or are released during various activities, e.g., combustion and metal processing, can adopt the form of aerosols, and under the influence of natural and anthropogenic factors, can move to large extents of the land and atmosphere. Therefore, metropolitan street dust is an important indicator of surrounding air quality, and its analysis can reveal the level and extent of air quality deterioration [29]. Urban areas face another problem of frequently clogged traffic, consuming more fuel and emitting more gases and fumes [8]. Fuel consumption releases considerable sums of heavy metals [30], which then easily amass and are retained in water and soil [31]. Thus, street dust in dense urban areas can become the bastion of heavy metals.
Road dust contains different metals contributed by a range of movable and fixed sources; for example, vehicular traffic, mechanical plants, thermal power generation, domestic, and other small-scale oil-consuming facilities [7]. The major influencing factors are land use, anthropogenic activities, vehicle flux and density, population concentration, energy consumption patterns, and municipal cleaning activities [32]. The literature suggests that heavy metal filtering can help curb their spread during storm seepage through the side-spaces of road surfaces. Positive matrix factorization (PMF) is a technique used to quantitatively identify the sources of heavy metal pollution [33]. Although PMF can appropriately be employed for different media (for example, the air, soil, silt, and water [34,35,36,37]), it has not been extensively used for source identification in street dust. A few researchers realized this deficiency and utilized PMF for the source identification of polycyclic aromatic hydrocarbons (PAHs) [38]. With the support of a geographic information system (GIS), the spatial variation of substantial metals and their associated dangers and spatial extents can be assessed [39]. The safety hazard evaluation method has also been applied for analyzing carcinogenic and noncarcinogenic threats of heavy metals [40].
The present research is based on street dust samples collected during May–June 2019 from Zhengzhou Metropolitan of Henan Province of Central China. The core objectives include (1) estimating heavy metal concentrations with respect to diverse land use in Zhengzhou, (2) the geochemical mapping and pattern drawing of heavy metals, (3) the quantitative identification of the source of pollution using positive matrix factorization (PMF), and (4) the application of traditional risk assessment method to assess the severity of contamination

2. Materials and Methods
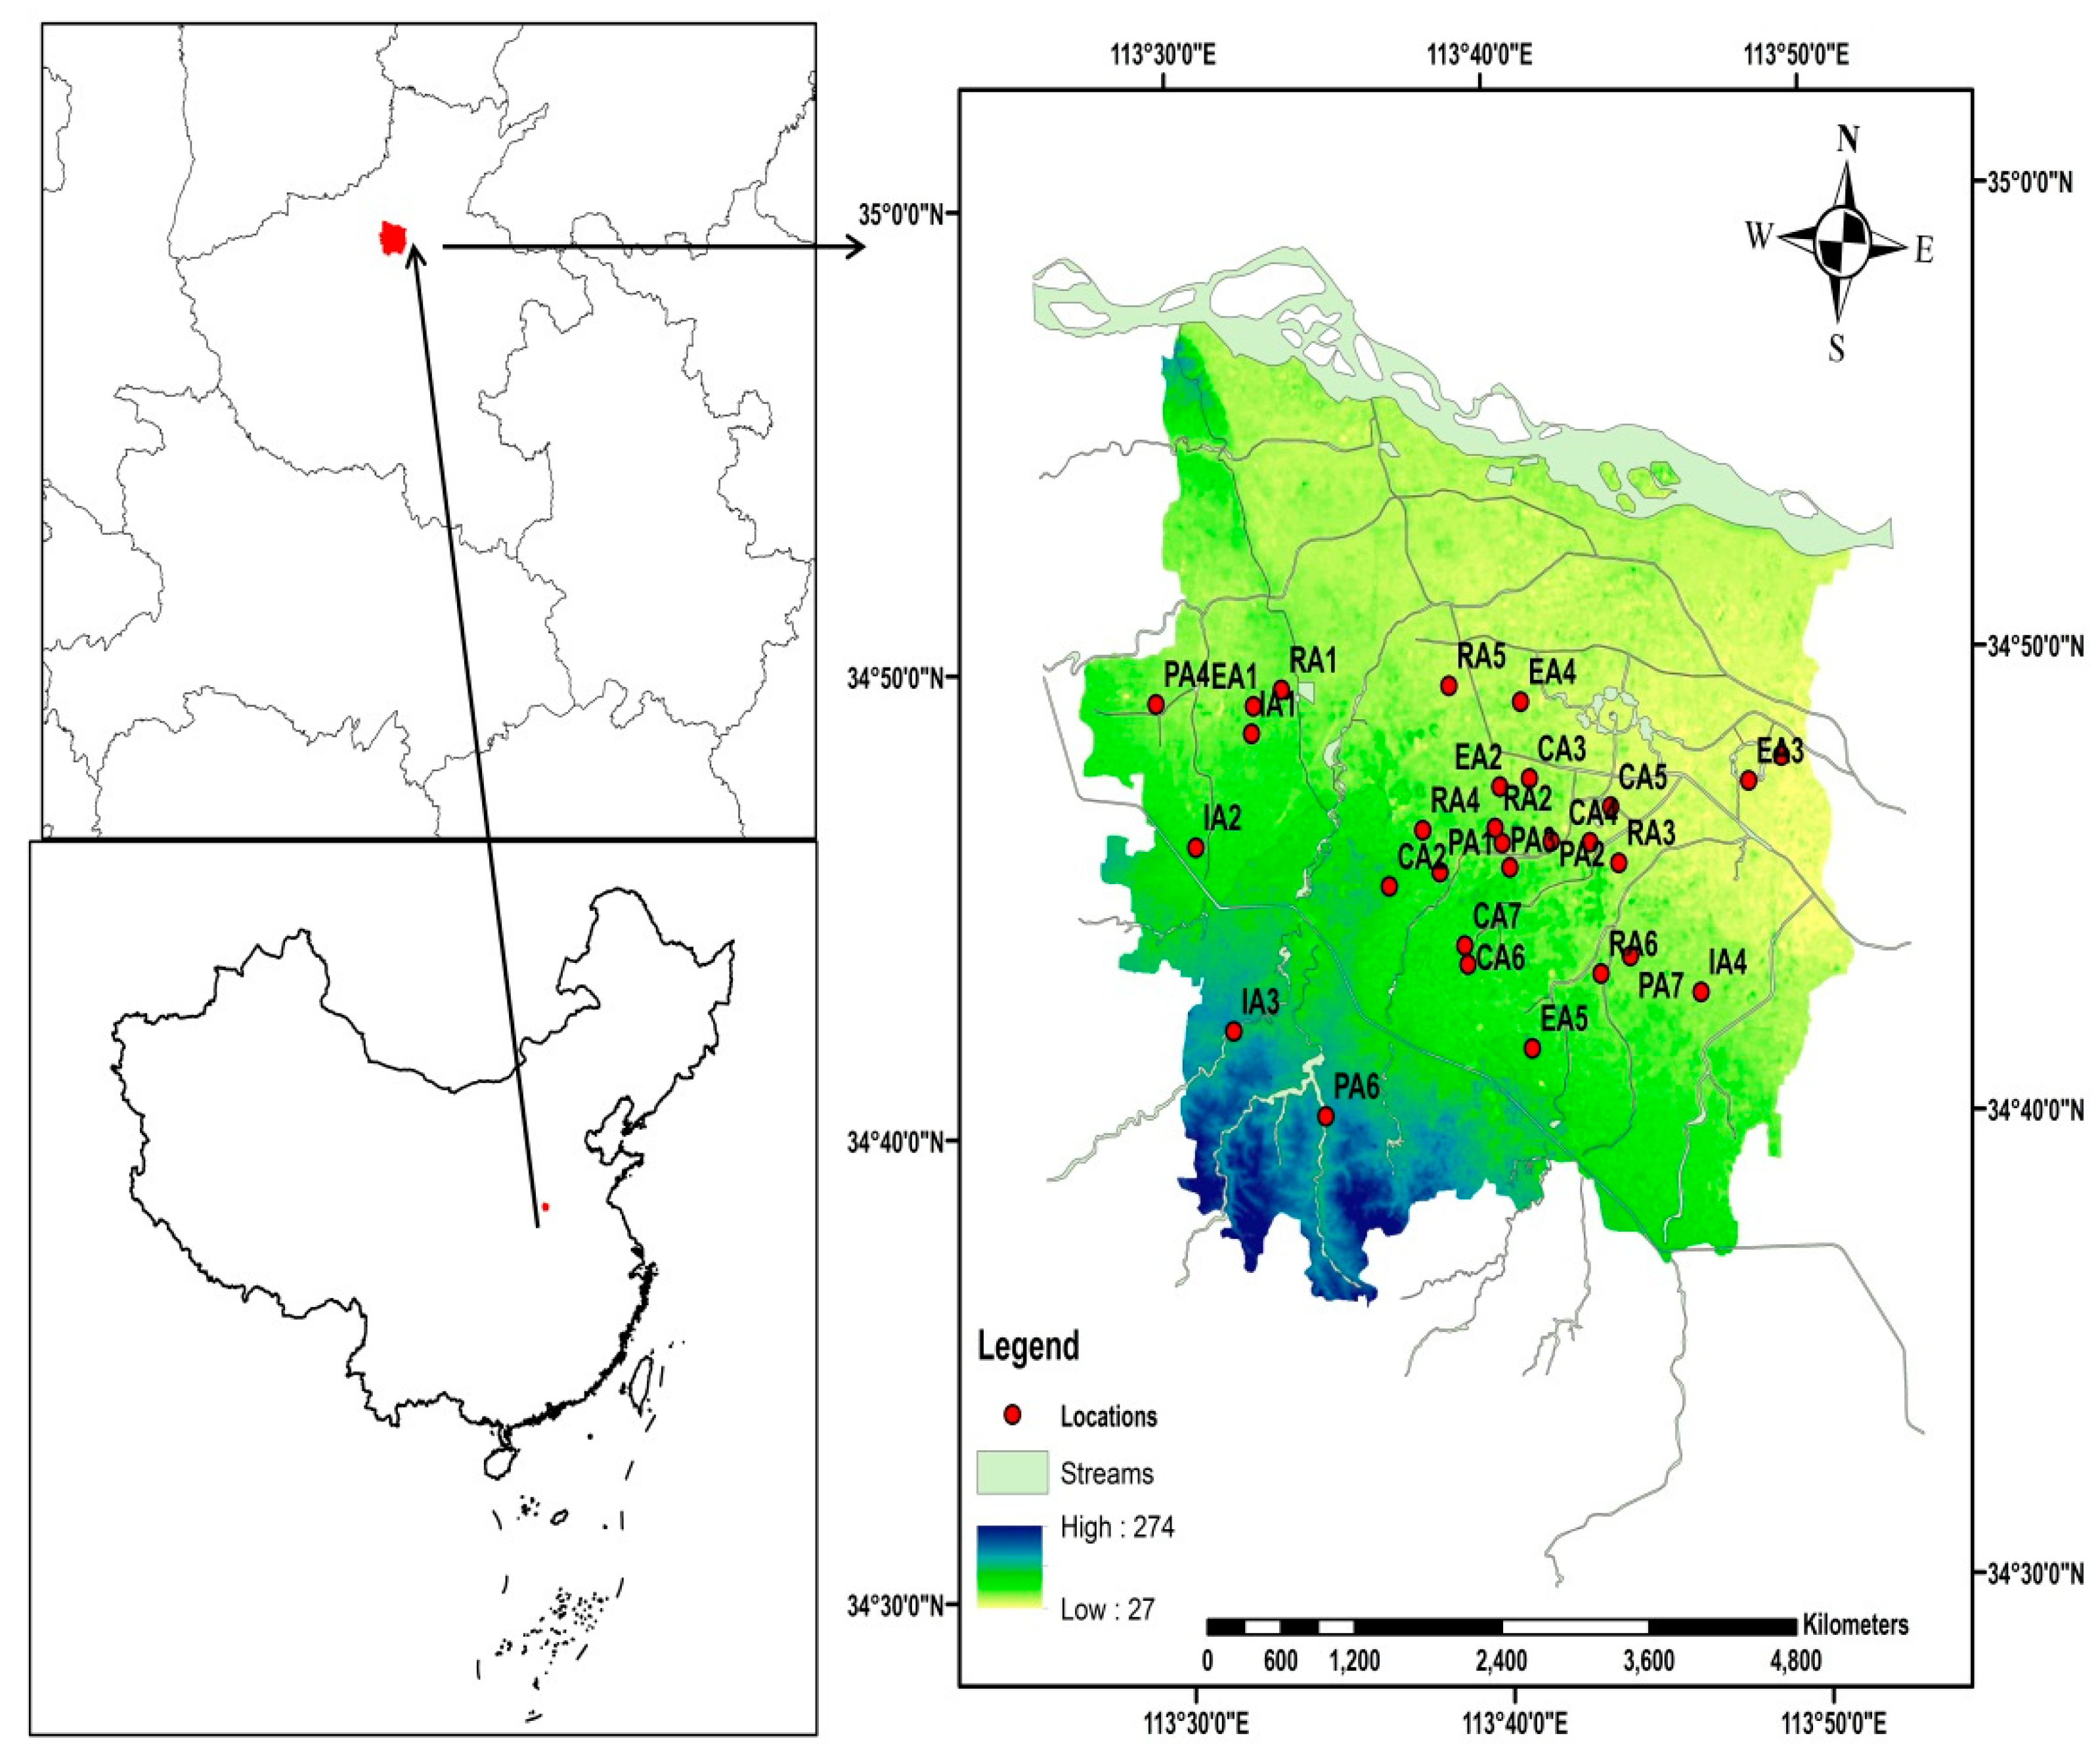
2.1. Research Area

Zhengzhou (112.7°–114.2° E, 34.3°–34.9° N), situated in the Central Plain megalopolis, is the capital of Henan Province and a hub of transportation, trade, and logistics in Central China as shown in Figure 1. The city is situated in the Northeast of the Funiu Mountains. It embraces high grounds in the west and middle and low grounds in the east. Zhengzhou lies in the middle and lower reaches of the historical Yellow River, which is not only regarded as the cradle of Chinese civilization but serves as the lifeline of Central China’s water economy [41].
The city falls in the region of the north temperate continental monsoon climate. The average annual temperature is 15.6 °C, and the average annual precipitation is 542.15 mm. The climate is hottest in the month of August, with a monthly mean temperature of 25.9 °C, whereas the coldest month is January, with a monthly average temperature of 2.15 °C [42]. While there exist four distinct seasons, the duration of summers and winters are longer [43].
The geographical situation, natural endowments, cultural splendor, political importance, the status of being the seat of institutions, historical grandeur, and economic significance of Zhengzhou continue to attract more people to visit the city or settle herein. The resident population of the city was estimated to be 10,352 million in December 2019 [44]. It was further estimated that the number of vehicles in the city had surpassed 4,500,000 registered motor vehicles [45] and 3,000,000 nonmotorized vehicles [46]. All these aspects of urbanization lead to increased carbon footprint and give rise to environmental consequences, being witnessed by the city.

2.2. Sample Collection and Analysis

The population of Zhengzhou is increasing rapidly, wherein one of the many factors is extensive infrastructural development in the city that includes industrial, commercial, educational, residential, and leisure facilities. After a preliminary inspection, we selected 29 different points of sampling from different functional areas for the research in May–June 2019 in Zhengzhou metropolis. A total of 58 samples of road dust were collected from these 29 sampling points. Each sampling point had a subsite for sampling, and each sample size was greater than 100 g [47]. All the subsamples of two main samples collected from identified sampling sites of Zhengzhou were checked for relative standard deviations. The subsamples were in the range of 10% relative standard deviation, with some outliers surpassing this range. The values of two samples collected from the main site and subsite of each sampling point were averaged, and this average was used as a single value. The samples were collected during a dry period of at least 7 days using shovels and plastic brushes. The collected samples from each site were preserved separately in self-fixing polyethylene packs, which were moved to the laboratory expeditiously so as to avoid any disturbance to the samples. Before the laboratory analysis, the sieved samples were air-dried at 4 °C [48] for one week. Each sample was sieved using 100-mesh polystyrene sieves with holes of <150 μm. The sieving process eliminated all the debris comprising hair, shrubberies, and pebble [49]. The diameter of less than 150 μm was considered for analysis, as these particles had the ability to persist in the environment for substantial extents of time [50,51,52]. Previous studies revealed that the particle size and nature of pollutant elements in the air have a significant impact on the harmfulness of human health [53]. After sieving, the moderate road dust size was found of <149 μm diameter in the central city region. Successively, portions of the strained samples of the dust were preserved in the new polyethylene packs with respect to particle size.
Eight conventional heavy metals exhibiting higher contaminating potential in the related research were selected for estimation. These typical heavy metals included lead (Pb), copper (Cu), Zinc (Zn), chromium (Cr), mercury (Hg), arsenic (As), nickel (Ni), and cadmium (Cd) [54,55]
Dust of 0.1 g from each collected dust sample was extracted for the concentration measurement of the 8 heavy metals Pb, Cu, Zn, Cr, Hg, As, Ni, and Cd. It was then put in a Teflon digestion vessel of 50 mL volume for the dissolution with nitric acid (HNO3) of 5 mL volume at 120 ℃ in the absence of a cover on the graphite digestion apparatus in the fume hood. After half an hour, hydrofluoric acid (HF) of 3 mL volume and perchloric acid (HClO4) of 2 mL volume were added at 140 ℃. The extracted samples were taken off and processed with hydrochloric acid (HCl) of 0.5 mL volume until the samples became clingy. At that point, the processing arrangements were weakened with super unadulterated water to a definite volume of 25 mL colorimetric tube for the study by inductively coupled plasma–mass spectrometry (ICP-MS, Agilent 7700X) [56]. To identify As and Hg, a 0.5 g dust sample was put in a colorimetric tube of 50 mL volume. The mixture of unadulterated water and aqua regia with a ratio of 1:1 in the volume of 10 mL was comprised in succession. The mixture was then shaken and then left for 2 h at 100 ℃ for softening in the thermostatic water shower. After every half an hour, the samples were shaken well, and the plug condition was observed. The samples were then cooled down, wobbled over, and inspected in an atomic fluorescence spectrometer (AFS) for Hg, and then all the values for the Hg concentration for each sample were noted [57].

2.3. Quality Assurance/Quality Control (QA/QC)

To ensure precision and accuracy of the laboratory experiment, we used 10% (n = 9) certified reference materials (CRMs), 2% (n = 2) blank samples, and 10% (n = 9) repetitive samples for this analysis [58]. The Geophysical and Geochemical Prospecting Institute of the Academy of Geological Sciences of China developed a CRM sequence for the soil chemical composition (GSS 1-31) as a quality check. It is used as the standard reference. In the current research for the QA/QC, Hubei Plains’ soil (GSS-13) and Shanxi province’s Luochuan Loess (GSS-8) and Liaohe Plains (GSS-11) were designated. In this study, the measured concentrations of standard materials were within the range of uncertainty. Therefore, a standard curve during the analysis with a correlation coefficient greater than 0.999 was established, and for every 20 samples, the point of concentration on the standard curve was examined [58].

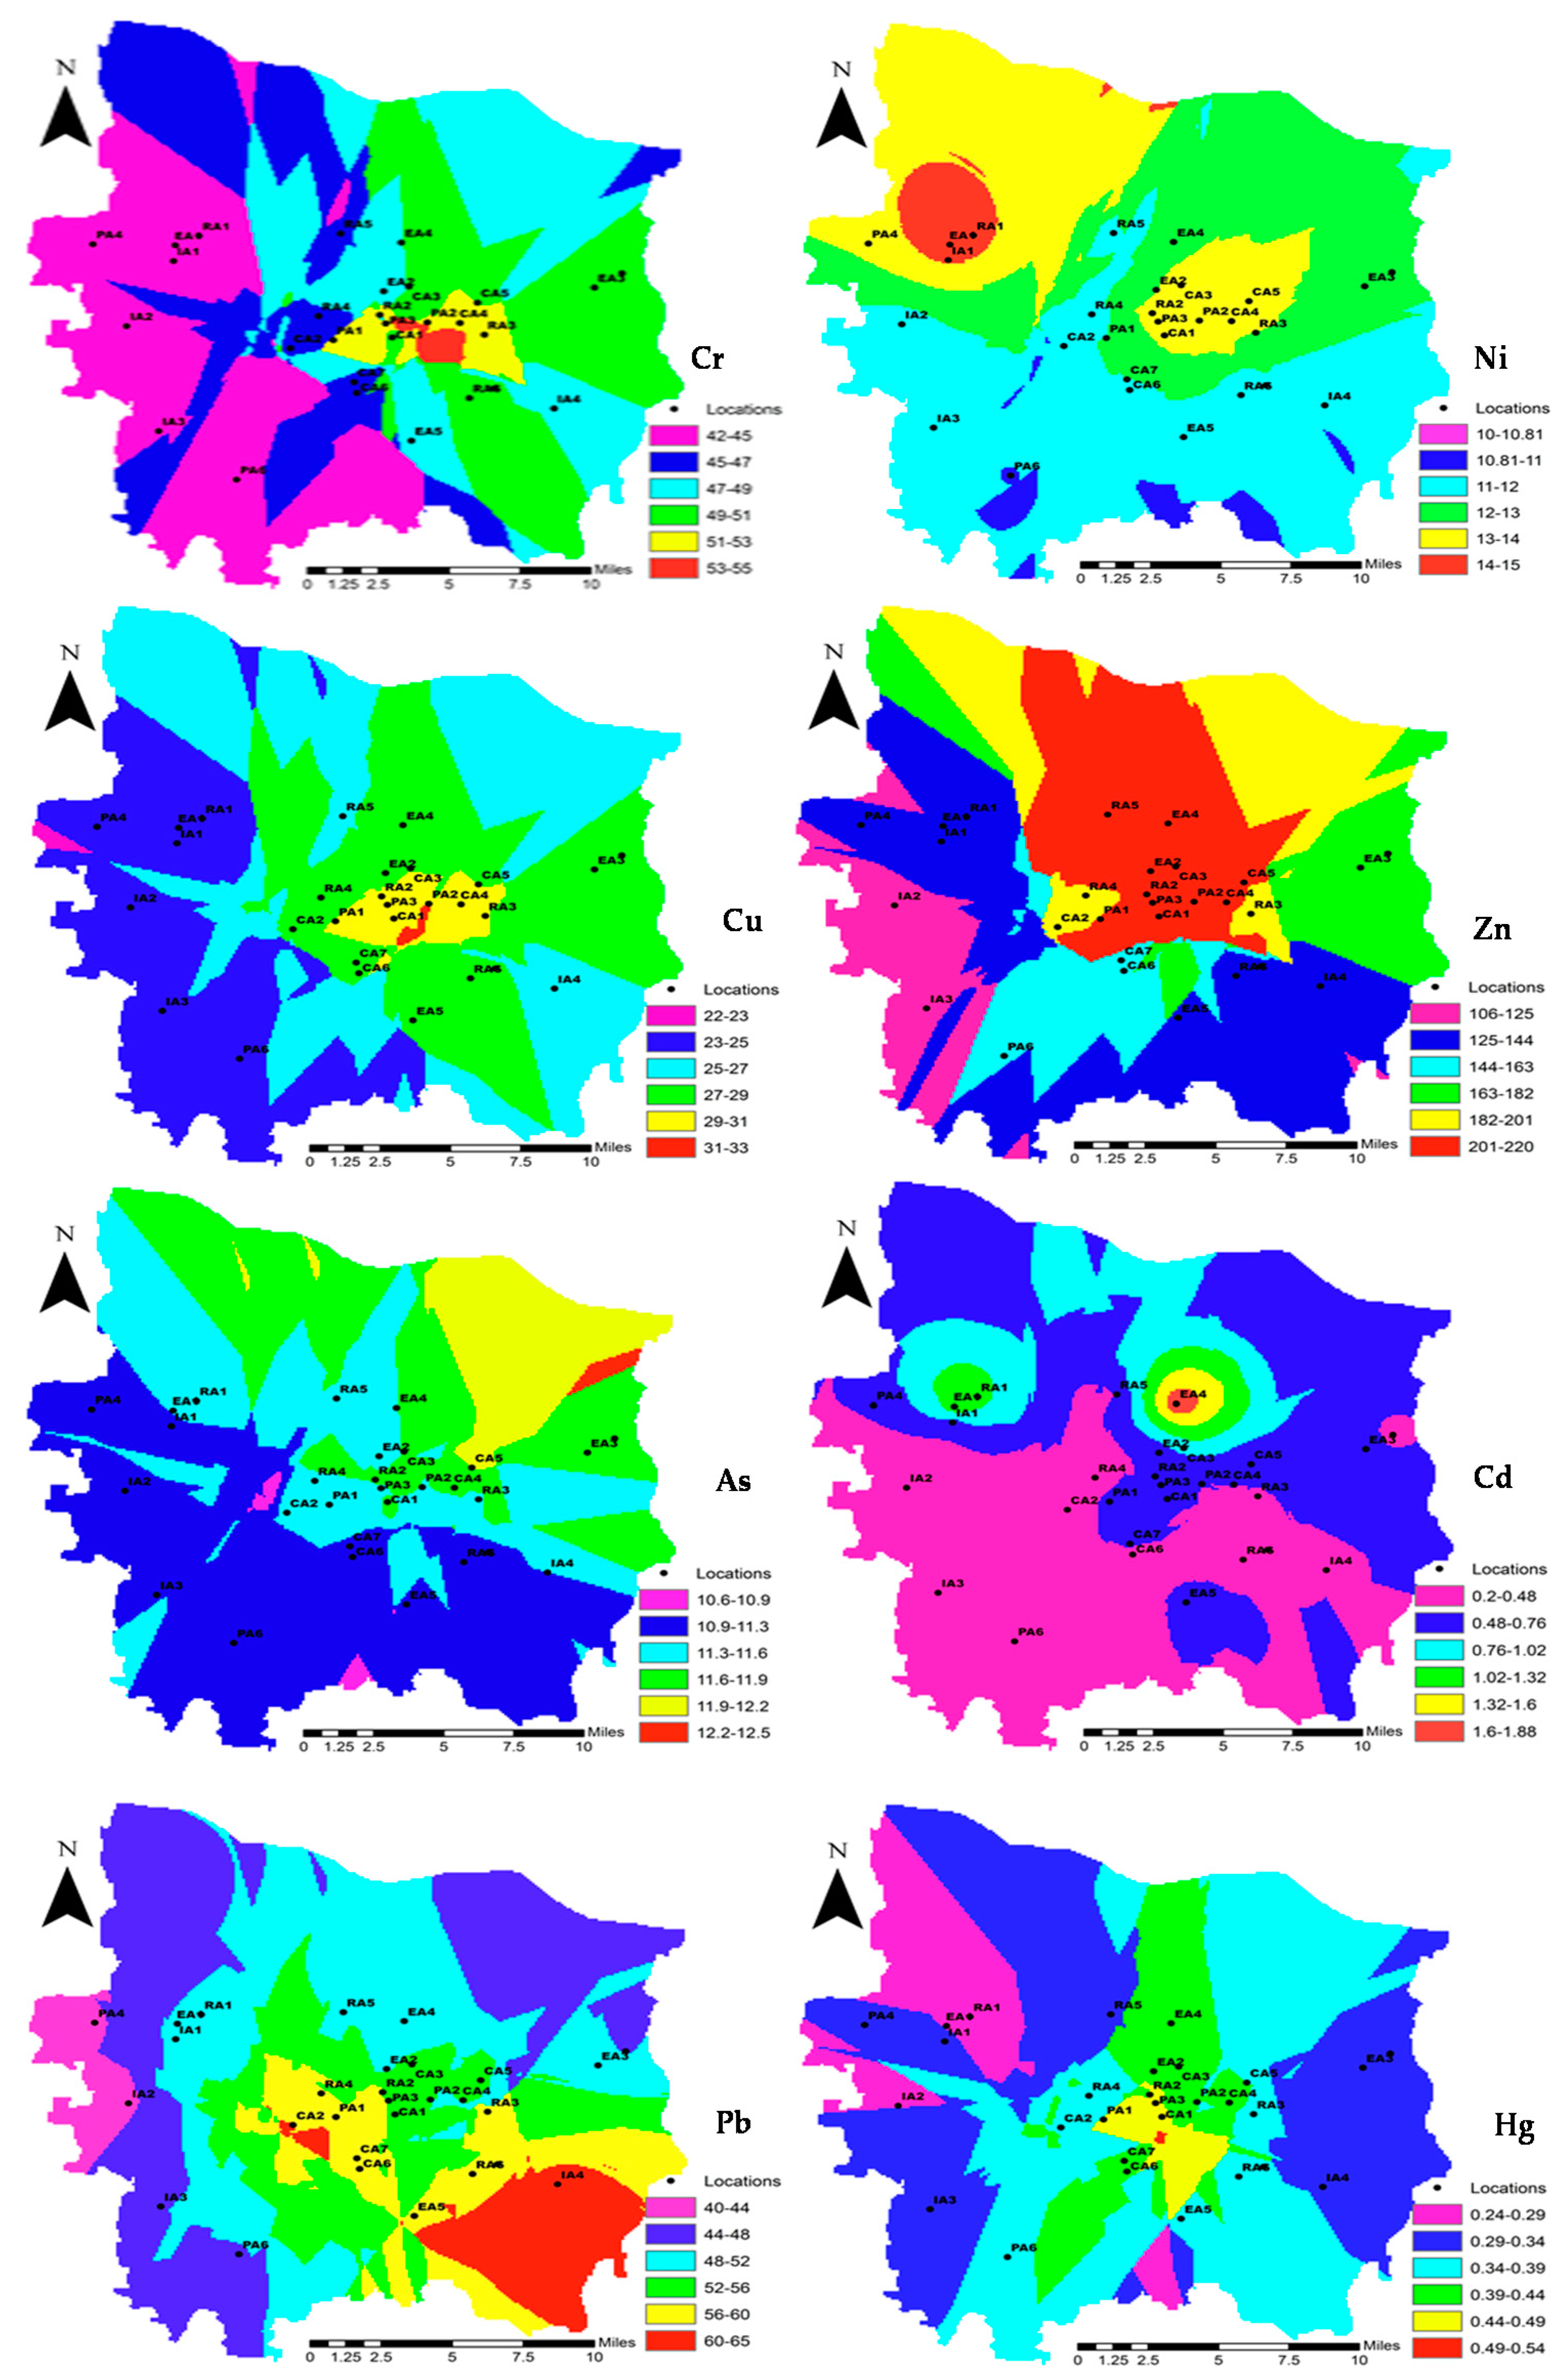
2.4. Geochemical Mapping

For geochemical mapping, Arc GIS 10.4.1 software was used to analyze and draw the measured heavy metals distribution in the street dust. The concentration values of heavy metals were utilized as input for the contouring of grid-based maps.

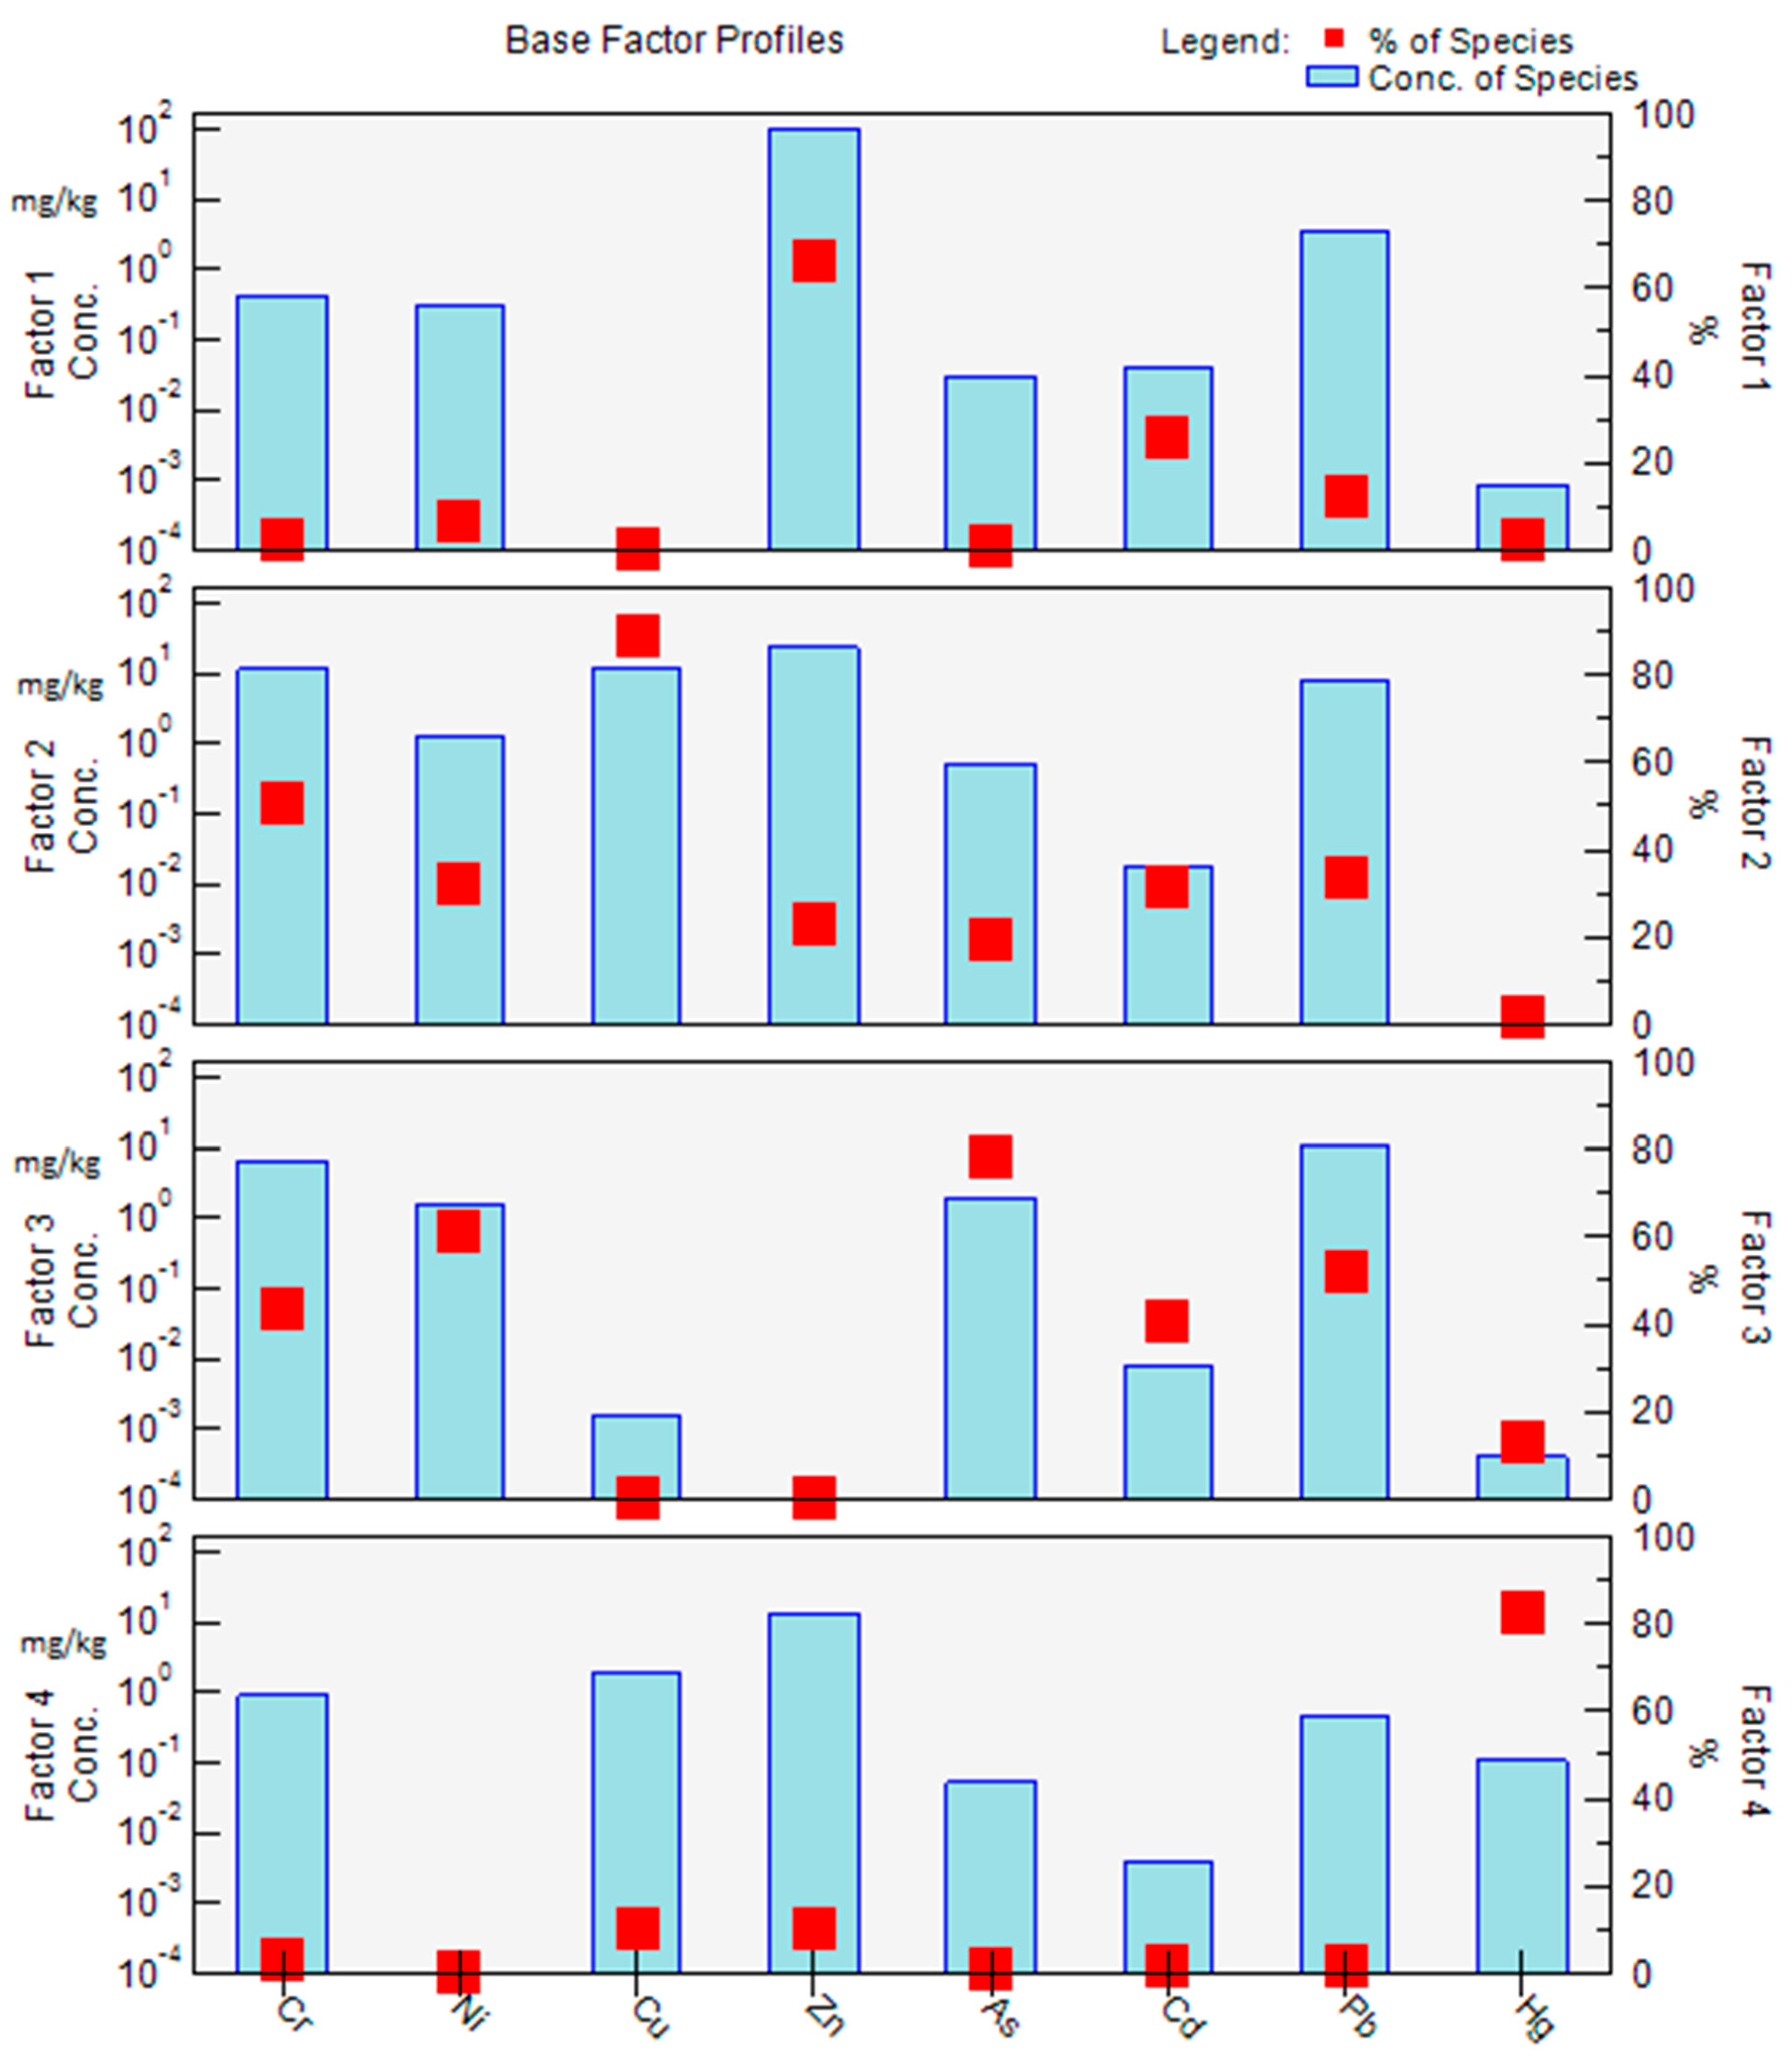
2.5. Positive Matrix Factorization (PMF)

To distinguish the pollution sources of heavy metals, a multivariate factor and an efficient analysis tool positive matrix factorization (PMF) were used [59]. Sample concentration figures matrices were disintegrated into factor outline matrices and factor influence matrices. In view of the deterioration outcome, the profile data were gathered, and the outflow inventories were explored [60]. PMF was calculated using the following equation [61]:
X ij = k = 1   p   g ik f kf + e ij
where Xij is the species j concentration on sample i, p is the number of factors, gik is the relevant factor contribution of k to i sample, fkf is the species’ concentration of j in profile factor k, and eij is the residuals
Using PMF model profiles and contributing factors derived by objective function, Q is expressed as [62]:
Q = j = 1 m j = 1 m   ( e ij u ij ) 2
where Uij is the uncertainty [63,64]. Method detection limit (MDL) values were 2 for Cr, 1 for Ni, 0.6 for Cu, 1 for Zn, 0.4 for As, 0.09 for Cd, 2 for Pb, and 0.002 for Hg in mg/kg.
If Xij ≤ MDL,
U ij = 5 6 × MDL  
If Xij ≥ MDL,
U ij = ( σ j × x ij ) 2 + ( MDL ) 2
where σj is the relative standard deviation, and MDL is the minimum detection limit

2.6. Risk Assessment Methods

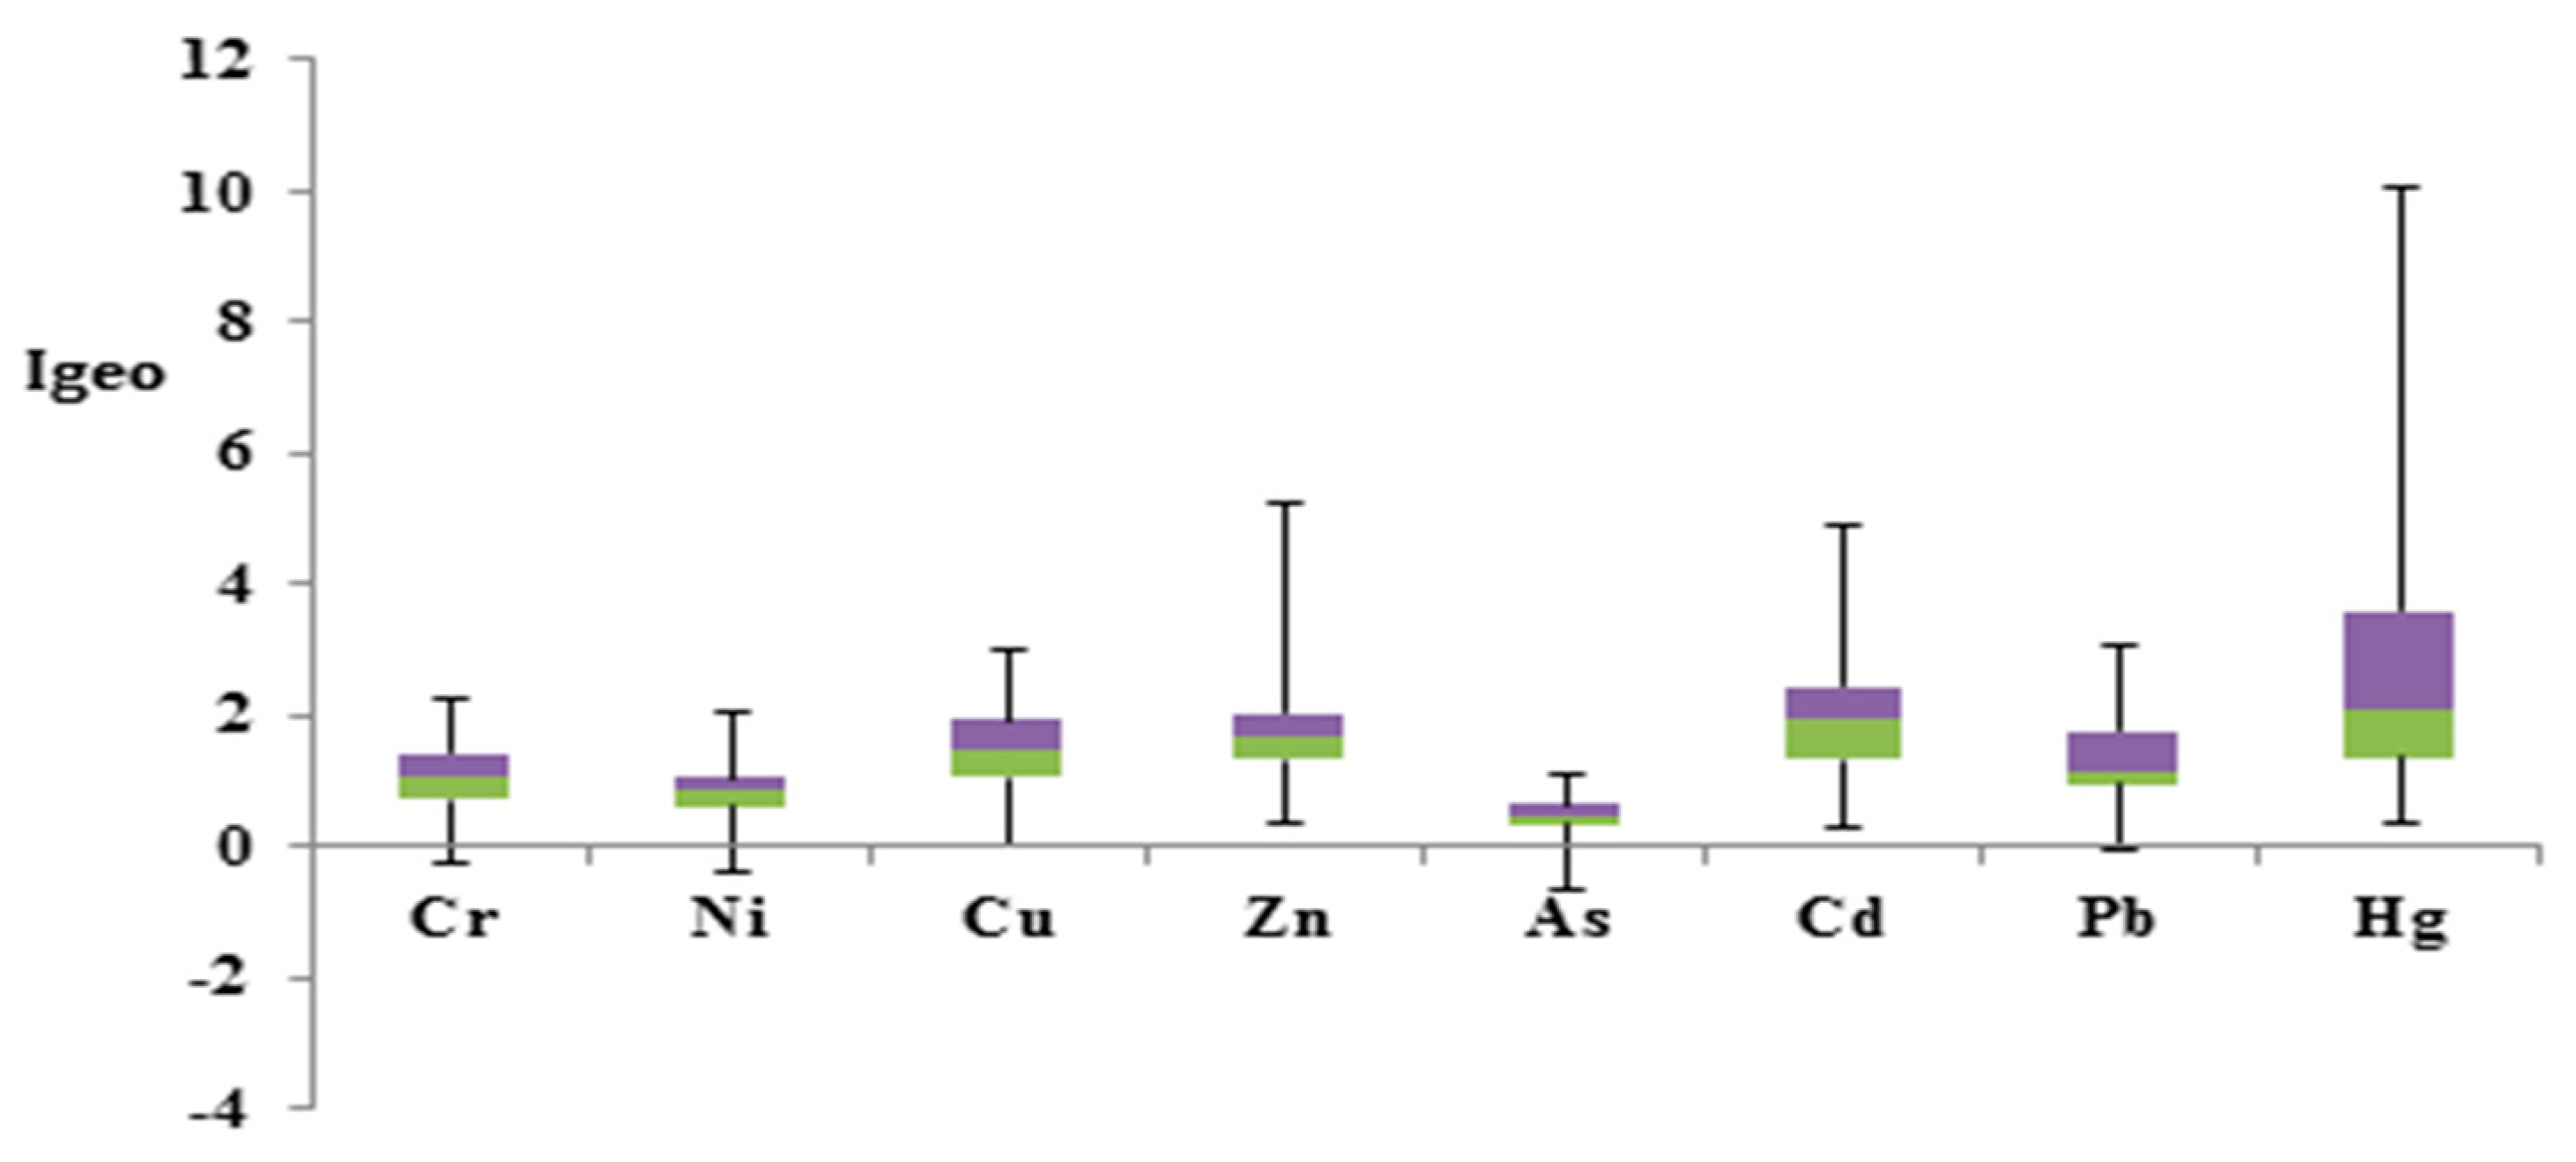
2.6.1. Geo-Accumulation Index (Igeo)

Many methods are available to assess road dust contamination based on the aggregation of soil and sediments [65,66,67]. In the present study, the Geo-Accumulation Index (Igeo) and Potential Ecological Risk Index (RI) were used to measure the metal contamination levels and risks. For the determination of single element pollution, Igeo is the most widely used index [68], whereas RI is applied to determine the contamination of the multiple elements [69]. Igeo considers both the background value and digenesis for assessment [70]:
I g e o = log 2 ( C n / 1.5 B n )
Where Cn is tested concentration of metal n in the road dust, 1.5 is the constant for neutralization of lithogenic actions, and Bn is the geochemical value of metal n [71]. Both Cn and Bn have the same units, i.e., mg/kg [72].

2.6.2. Potential Ecological Risk Index (RI)

RI quantitatively states the potential ecological risk of a certain pollutant. RI is calculated as [72]:
R I = i = 1 n E r i
E r i = T r i × C f i
C f i = C n i / B n i
where E r i is the potential ecological risk factor, T r i is the response of toxic factor, C f i is the contamination factor, C 0 1 i is the average content of certain element, and C n i is the reference value of geochemical in the road dust.

2.6.3. Nemerow Synthetic Pollution Index (PIN)

PIN is a widely used method of risk assessment. This method has also been used previously for soil environment study [73]. We employed it in this study to assess the risk of heavy metal pollution in the road dust.
PI N = MaxP ij 2 +   P ¯ ij 2 2
PI N = c ij c ri max 2 + [ 1 m   Σ i = 1 m c ij c ri 2 ] 2
where Max Pij is the maximum value of pollution, Pij is the average value of pollution, m is the number of metal species, cij is the measured concentration metal i in RDS with grain size j, and cri is the background concentration of metal i.
The index of classifications for all three risk assessment methods has been described below in Table 1.

3. Results and Discussions

3.1. Occurrence of Heavy Metals in Road Dust

The concentration values of all heavy metals were found greater than their background values, except those of Cr and Ni [76]. The concentrations of Hg and Cd were 14 and 7 times higher than their corresponding background values, respectively. The vastly higher amounts of Hg and Cd can be attributed to hyper-level anthropogenic activities, coal and oil combustion, and metal processing [77,78]. The collected samples showed a greater concentration of Cr, Zn, Cu, and Pb in the road dust. Among all heavy metals, the concentration of Zn was the highest but lower than that of most big cities both in China and abroad, with the exception of Ahvaz, Iran [11] and Kavala, Greece [79]. The concentration of Pb was the lowest in Zhengzhou compared to all other referenced cities mentioned in Table 2 except Dhaka, Bangladesh, where the Pb value was even less than that of Zhengzhou [18]. This phenomenon may be credited to the continuously declining consumption of gasoline in the city [80]. The concentrations of Cr, Ni, and Cu were also lower than those in other cities in comparison.
However, arsenic contents in the urban road dust of Zhengzhou were significantly higher than in Ahvaz, Dhaka, Beijing, Shanghai, Shiraz, and Novi Sad [11,18,47,81,82,83] and lower than in Isfahan, Baoji, Kavala, Nanjing, and Guangzhou [17,79,84,85,86]. In terms of Cd pollution, the road dust of Zhengzhou had higher contents compared to those of Novi Sad, Shiraz, and Kavala [79,82,83] and less compared to all others (Table 2). In the case of mercury, the concentration in the street dust was slightly higher compared to Guangzhou, Shanghai, Kavala, Nanjing, and Beijing [79,81,85,86] but less than Baoji and Shiraz [82,84]. However, this concentration was alarmingly higher compared to the background values of Zhengzhou itself, which warrants the immediate attention of authorities and stakeholders. It was observed that land use among the counties of Zhengzhou had no noticeable impact on Hg concentration. This reveals the insignificant impact of road cleaning and sweeping mechanisms as well as rainstorm handling on the spread of mercury.
Table 2 shows the statistical characteristics of eight heavy elements. The samples showed the following order of heavy metals concentration: Hg < Cd < As < Ni < Cu < Cr < Pb < Zn.
The concentration of heavy metals was the highest in commercial areas, attributable to higher traffic flows and public activities as shown in Table 3. Moreover, the high density of high-rise buildings in an area can affect the natural air exchange, which can lead to a higher concentration of pollutants [87]. Therefore, the higher concentration of the contaminants may be attributed to the presence of high-rise buildings in commercial areas.
The zinc concentration was higher in residential areas compared to educational and commercial areas [80]. Parks and leisure areas showed the lowest heavy metals concentration, apart from As and Cd, which may be attributed to the different behavior and characteristics of these metals. In the case of Cr, commercial areas showed the highest concentration, while parks and leisure areas exhibited the lowest concentration, suggesting the higher possibility of the presence of pollutants in commercial areas. In the case of Pb and Cu, commercial areas showed the highest concentration, while parks and leisure areas exhibited the lowest concentration.

3.2. Geochemical Mapping

Geochemical mapping of heavy metals, as well as their concentrations and patterns, in Zhengzhou metropolis was performed using ArcGIS software and is shown in Figure 2.
This represents the concentration ranges of all the heavy metals individually with respect to all 29 sampling points of the research area. Based on the concentration ranges, the area was divided into six classes. The concentration of Cr was in the range of 42–55 (mg/kg). Bishagang Park (PA1), Zijingshan Park (PA2), Renmin Park (PA3), Manhattan Shopping Mall (CA4), and Jianye Garden (RA3) were in the highest subrange of 51 to 55 mg/kg, whereas High-tech Industrial Zone (IA1), Xushui Industry and Trade area (IA2), Mazhai Food Industrial Park (IA3), Shenghe Yuan (RA1), New Campus of Zhengzhou University (EA1), Tianjian Lake Park (PA4), and Zhengzhou Arboretum (PA6) were in the lowest subrange of 42 to 45 mg/kg.
In the case of Ni, New Campus of Zhengzhou University (EA1), Shenghe Yuan (RA1), and High-tech Industrial Zone (IA1) fell in the range of maximum concentration, i.e., 14 to 15 mg/kg, while Zhengzhou Arboretum (PA6) was in the lowest range of 10–11 mg/kg. Cu concentration ranged from 22 to 33 mg/kg, and the areas of Bishagang Park (PA1), Zijingshan Park (PA2), Renmin Park (PA3), Manhattan Shopping Mall (CA4), Jianye Garden (RA3), Community of Tianxiacheng (RA2), and Erqie Square District (CA1) lied in the subrange of 29–33 mg/kg. The areas of High-tech Industrial Zone (IA1), Xushui Industry and Trade area (IA2), Mazhai Food Industrial Park (IA3), Shenghe Yuan (RA1), New Campus of Zhengzhou University (EA1), Tianjian Lake Park (PA4), and Zhengzhou Arboretum (PA6) were in the lowest subrange of 22–25 mg/kg.
The concentration of Zn was found between 106 and 220 mg/kg, and the lowest range, i.e., 106–125 mg/kg, included the areas of Mazhai Food Industrial Park (IA3) and Trade area (IA2). The areas that fell in the high subrange, i.e., 201–220 mg/kg were Bishagang Park (PA1), Zijingshan Park (PA2), Renmin Park (PA3), Erqi Square District (CA1), International Trade 360 Square, Manhattan Shopping Mall (CA4), Convention and Exhibition Center (CA5), Zhengzhou University North Campus (EA2), North Campus of North China University of Water Resources and Electric Power (EA4), Community of Tianxiacheng (RA2), and the South Area of Provence (RA5). In the concentration distribution of As, the range was between 10.6 and 12.5 mg/kg. Exhibition Center (CA5) was the only area that had a maximum concentration distribution in the 11.9 to 12.5 mg/kg range. However, for the lowest range of 10.6 to 11.3 mg/kg, the areas were High-tech Industrial Zone (IA1), Xushui Industry and Trade area (IA2), Mazhai Food Industrial Park (IA3), Tianjian Lake Park (PA4), Zhengzhou Arboretum (PA6), Erqi Wanda Plaza (CA6), Shenglong square in Daxue Road (CA7), Huanghe Science and Technology University (EA5), and Sunshine City (RA6).
The North Campus of North China University of Water Resources and Electric Power (EA4) was the only area that fell in the highest concentration range, i.e., 1.6–1.88 mg/kg of Cd. The maximum areas were in the lowest range of 0.2–0.48 mg/kg, including Xushui Industry and Trade area (IA2), Mazhai Food Industrial Park (IA3), Dongfeng Nissan (IA4), Family Courtyard of Power Transmission and Distribution (RA4), Sunshine City (RA6), Zhongyuan Wanda Plaza (CA2), and Erqi Wanda Plaza (CA6).
Zn concentration ranged between 40 and 65 mg/kg. The lowest range, i.e., 40–44 mg/kg, included the areas or Xushui Industry and Trade area (IA2) and Tianjian Lake Park (PA4), while only two areas, i.e., Dongfeng Nissan (IA4) and Zhongyuan Wanda Plaza (CA2), fell in the highest range of 60–65 mg/kg. The concentration of Hg was found alarmingly high during the laboratory analysis. Bishagang Park (PA1), Renmin Park (PA3), and Erqi Square District (CA1) fell in the highest subrange, i.e., 0.44–0.54 mg/kg, whereas Xushui Industry and Trade area (IA2), Shenghe Yuan (RA1), and the New Campus of Zhengzhou University (EA1) were in the lowest range of 0.24–0.29 mg/kg of Hg concentration.

3.3. Pollution Source Analysis with PMF

Positive matrix factorization (PMF) modeling of eight heavy metals identified four major factors causing their accumulation, shown in Figure 3. The signal-to-noise (S/N) ratios for these heavy metals ranged from 3.2 to 4.
The PMF-based analysis identified Factor 1 (transportation and vehicular exhaust) as a source of Cd and Zn. Factor 1 exhibited a 25.6% concentration of Cd and 66.5% of Zn. Cd is abundantly found in lubricating oils and tires [88]. Zinc emitted in the form of vehicular exhaust and cadmium is released to the atmosphere and road dust from the lubricating oil and tires wear [89]. Hence, as revealed by the PMF-based analysis and testified by the literature, the major sources of these heavy metals are vehicular exhaust and its related activities. The particles released during this process settle on the dust [90].
The concentration of Cr and Cu was found to be associated with Factor 2 (coal combustion, airborne emissions, asbestos lining erosion, chemical effluents, and contaminated landfill). The contribution of Cr and Cu in Factor 2 was 50.6% and 89.3%, respectively. Coal is also a major source of fuel, and its combustion causes the release of Cr and Cu [48]. This factor underlines the urgency of phasing out coal.
As, Ni, and Pb were attributed to Factor 3 (metal processing, coal-fired power generation, industrial processes, and geographic reasons). The composition of Factor 3 was 78.1% As, 61% Ni, and 51.2% Pb. The particles of these metals make their way to the road dust through the smoke emitted from industrial units. The particles suspended in the air eventually settle on the ground and join the dust particles [91]. Hence, Factor 3 indicates that the production and utilization of metallic substances should be strictly regulated as they can lead to heavy metal accumulation.
Factor 4 represents Hg with an 82.7% concentration. Anthropogenic activities were the main contributors of Hg than natural sources [89,92]. Agricultural activities are also contributors of Hg, at a much smaller scale, in the form of fertilizers and pesticides due to its volatility [93]. Hence, pesticides or insecticides and fertilizer utilization would impact the farmlands around an urbanized region. Hg can then penetrate into urbanized regions where the spread can be rapid and vast. Pesticides are often utilized for making green spaces in urban areas. The accessible Hg in the pesticides can also contaminate water, soil, and air and then finally become part of the road dust [94]. In the sum of all types and sources, the contributions of Factor 1, Factor 2, Factor 3, and Factor 4 were 14.63%, 35.34%, 36.14%, and 13.87%, respectively.

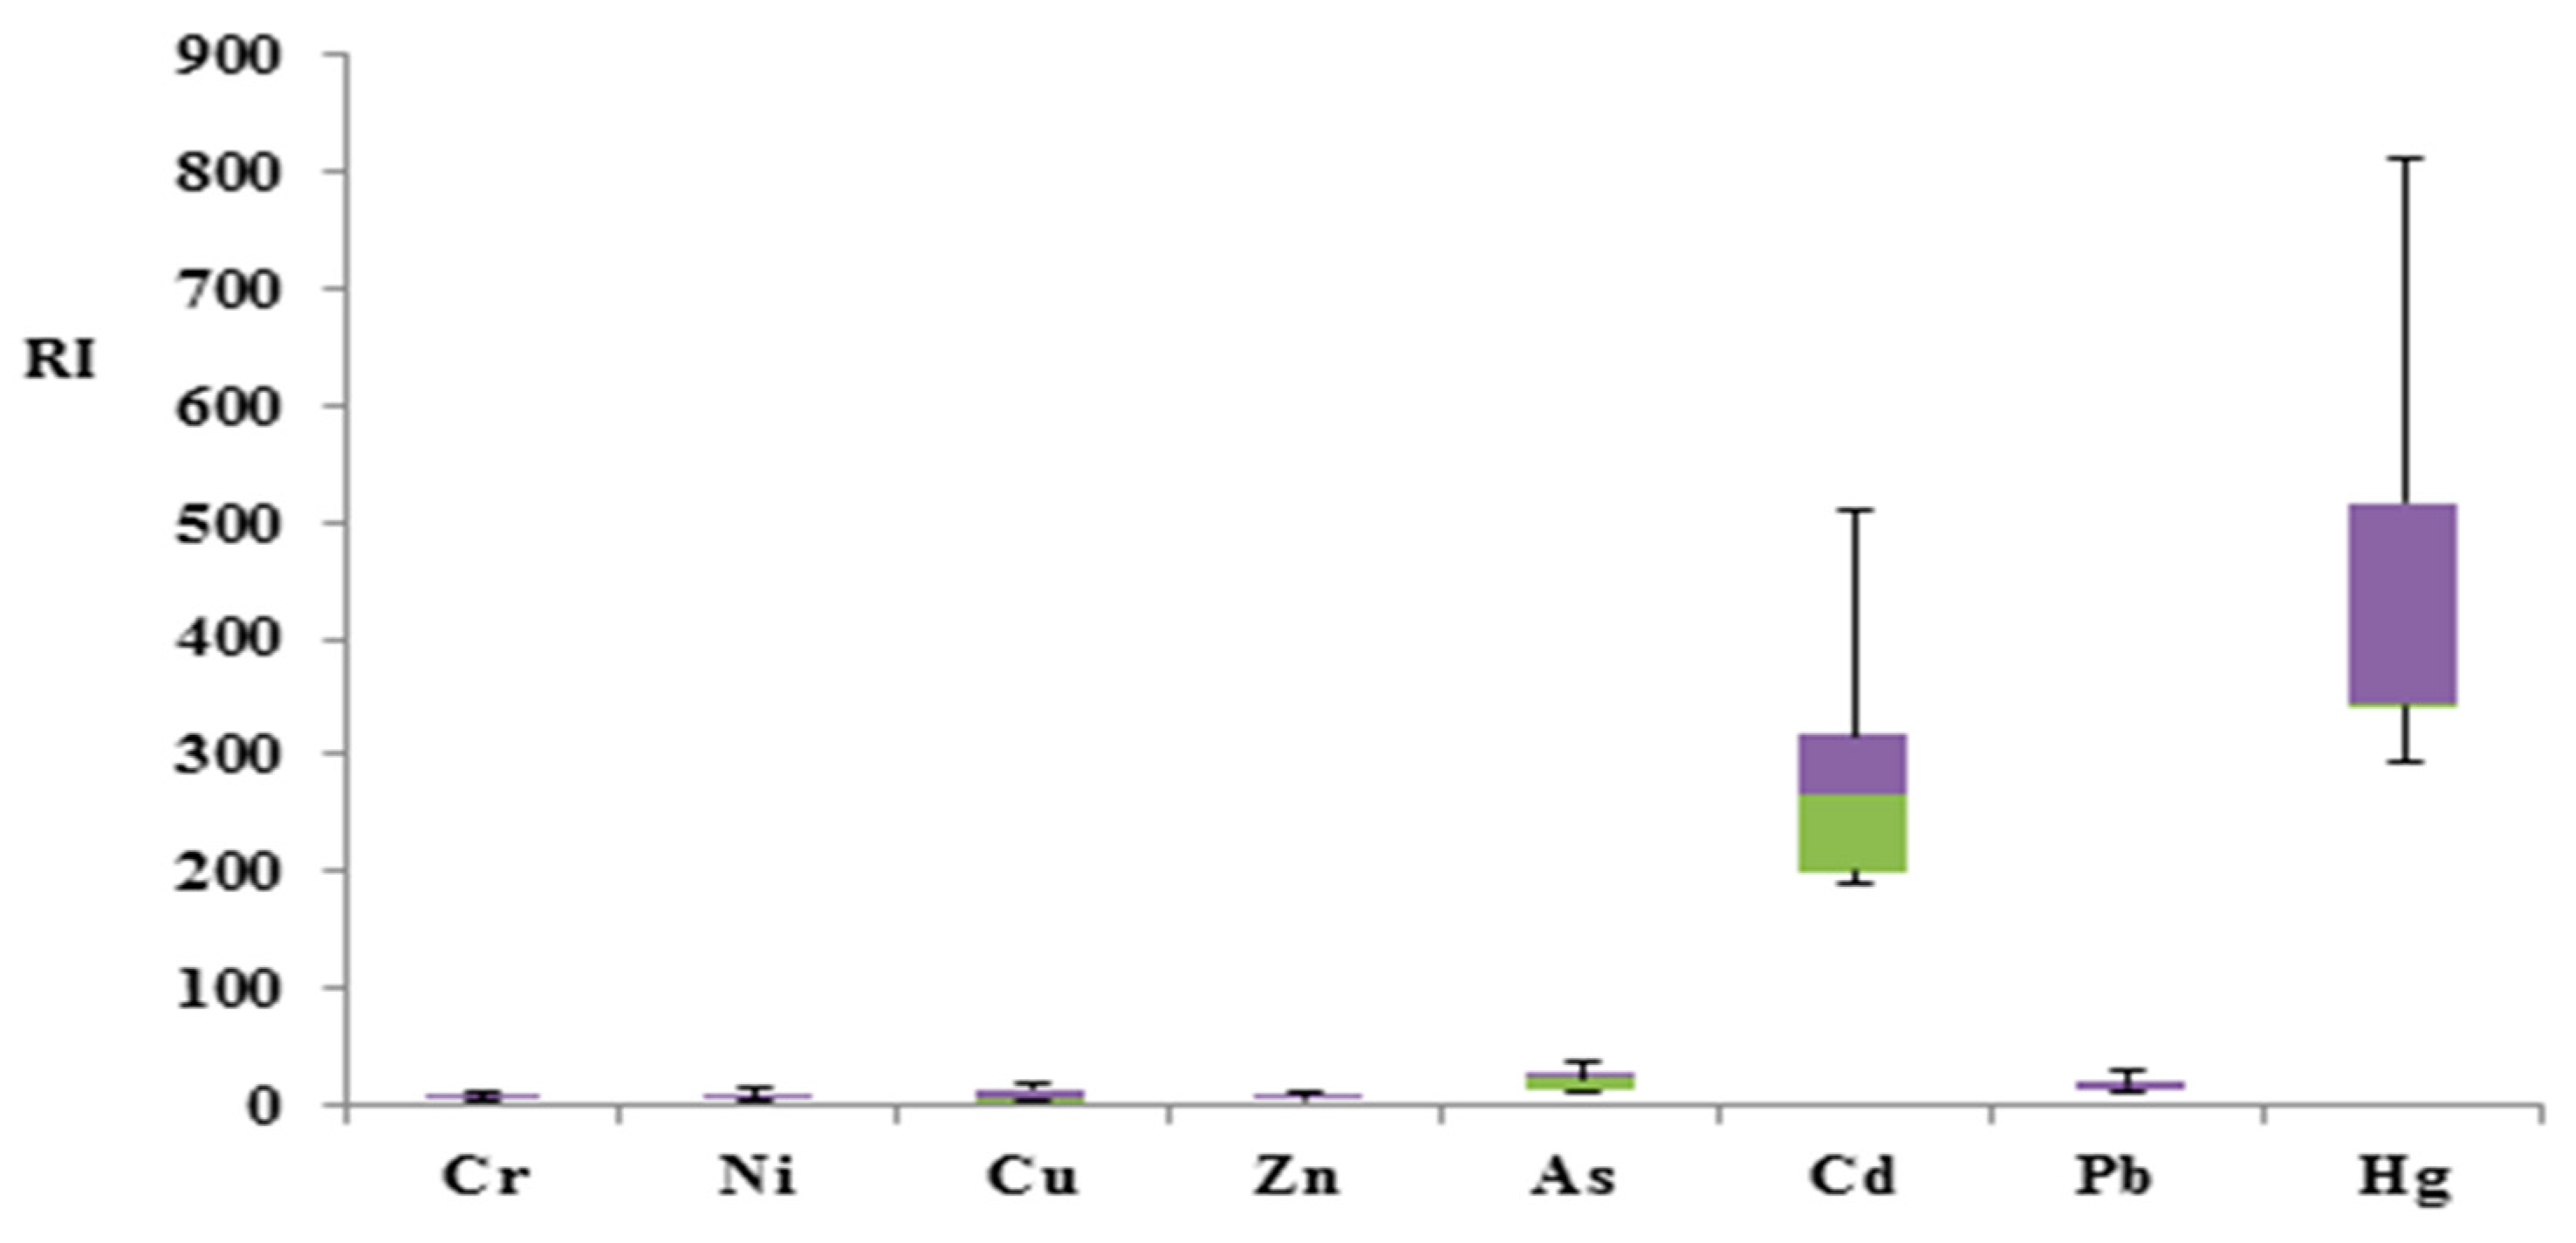
3.4. Risk Assessment of Heavy Metals

The heavy metals’ background enrichment values have been frequently evaluated using the Geo-Accumulation Index (Igeo); formerly, it was generally used for river sediments. The boxplot in Figure 4 represents the results of the risk assessment carried out using the Geo-Accumulation Index (Igeo). The contamination levels of chromium (Cr), nickel (Ni), and arsenic (As) were found negligible and fell in the range of unpolluted according to Igeo categories. Their risk assessment values were below zero, showing no contamination of Cr, Ni, and As in the road dust of Zhengzhou city. The contamination levels of Cu, Zn, and Pb were in the range of unpolluted to moderately polluted. However, the contamination levels due to atmospheric deposition and road particle adsorption were very high in the case of Cd and Hg. The former was found in the range of moderately polluted, while the latter fell in the range of moderate to strong pollution. Igeo values increased in the following order: Ni < Cr < As < Cu < Pb < Zn < Cd < Hg.
The Potential Ecological Risk Assessment (RI) results showed the highest accumulation of Cd and Hg in the atmospheric deposition and the road particles’ adsorption, similar to Igeo, which showed the higher contamination of Cd and Hg in the Zhengzhou road dust. Other metals, i.e., Cr, Ni, Cu, Zn, As, and Pb, were in the range of low risk, indicating the minor presence of these metals in the road dust of this city. Cd was in the high-risk category, whereas Hg fell in the alarming extreme category, as shown by the boxplot in Figure 5. RI values increased in the following order: Cr < Zn < Ni < Cu < Pb < As < Cd < Hg.
The Nemerow Pollution Index (PIN) results showed the highest contamination of Hg and Cd, in line with the other two risk assessment methods. Hg and Cd both fell in the category of serious risk, as they were abundant compared to other metals. PIN values for both these metals were more than three. Zn was found in the moderate risk category, unlike the other two methods. However, the Nemerow Pollution Index showed Zn values in the range of 2–3. Cr and Ni were also in the slight risk category, whereas As and Pb were in the safe zone, as shown by the boxplot in Figure 6. PIN values increased in the following order: As < Pb < Cu < Ni < Cr < Zn < Cd < Hg.
The different results produced by these indices can be attributed to the fact that despite having many similarities, all pollution control indices are different from each other in the way they approach the problem and make their assessments. There exist six widely accepted groups of pollution indices that make calculations for specific purposes. We selected three indices from three different groups. Igeo measures the individual level of pollution, whereas PIN assesses the total scale of pollution in the study area. The Potential Ecological Risk Index works at a different scale and gauges the ecological risk posed by pollution. Due to this difference in conceptual foundations, scales, and coverage, these indicators yielded different results in the case of metals with lower to medium concentrations. However, all these indicators unanimously rank Hg and Cd as the highest. While PIN indicates the significant presence of six heavy metals with lower to medium concentrations, RI attaches relatively little significance to them from an environmental risk standpoint. Igeo assesses the risk at the individual level and does not take into account natural factors, and hence, the results produced by Igeo are different from those of other indices [95].

4. Conclusions

Higher concentrations of heavy metals pose a serious risk to public health, particularly in densely populated urban hubs with huge industrial units, vehicular load, and anthropogenic activities. In this study, 58 samples of road dust, collected from 29 sites of Zhengzhou metropolis of Henan Province, PR China, were analyzed for the presence of 8 heavy metals, their geochemical mapping, drawing their pattern, and identifying their sources using three risk assessment methods and PMF-based analysis. It was found in general that the mean concentrations of all the heavy metals were more than their background values, except in the case of Ni and Cr. The concentrations of Cd and Hg were 7 and 14 times higher than their background values, respectively. Out of three methods of traditional risk assessment used in this study, Igeo showed the risks of contamination in a range from unpolluted (Cr, Ni) to strongly polluted (Hg and Cd) categories. RI came up with the contamination ranges from low (Cr, Ni, Cu, Zn, As, and Pb) to extreme (Cd and Hg) risk. As per the results produced by PIN, the contamination ranged from safe (Cu, As, and Pb) to seriously high (Cd and Hg). The PIN results indicated an extreme risk of Cd and Hg in the city.
The Positive matrix factorization results indicated four prime sources of contamination in Zhengzhou, including coal-fired power generation facilities/vehicular exhaust/tire wear, airborne emissions, metallic substances, and, finally, anthropogenic activities that include the use of fertilizers, pesticides, chemicals, etc. Factor 3 was found dominant among all and slightly above Factor 2. Both these factors collectively contributed more than 70% to total heavy metal contamination. Factor 4 showed the comparatively lowest contribution among all the factors, with a 13.87% share in total heavy metal contents. Mercury, being a highly dangerous element, requires the immediate attention of all stakeholders in the domains of management and future research, as health hazards posed by the mercury are long-lasting and far reaching, and their management at later stages becomes more resource intensive.

Author Contributions

Conceptualization, M.F., Z.W. and H.W.; data curation, M.F.; formal analysis, M.F. and C.S.; funding acquisition, Z.W.; investigation, M.F.; methodology, M.F. and Z.W.; project administration, Z.W. and H.W.; resources, Z.W.; software, W.Z. and H.W.; supervision, Z.W. and H.W.; validation, H.W.; visualization, M.F. and C.S.; writing—original draft preparation, M.F.; writing—review and editing, M.F., Z.W., H.W. and Z.H. All authors have read and agreed to the published version of the manuscript.

Funding

National Natural Science Foundation of China: 51879242 and 51739009.

Data Availability Statement

Laboratory results of this framework are collected from the physical sampling of the study area.

Conflicts of Interest

The authors declare no conflict of interest.

References

  1. Wang, J.; Li, S.; Cui, X.; Li, H.; Qian, X.; Wang, C.; Sun, Y. Bioaccessibility, Sources and Health Risk Assessment of Trace Metals in Urban Park Dust in Nanjing, Southeast China. Ecotoxicol. Environ. Saf. 2016, 128, 161–170. [Google Scholar] [CrossRef]
  2. Selonen, V.; Varjonen, R.; Korpimäki, E. Immediate or Lagged Responses of a Red Squirrel Population to Pulsed Resources. Oecologia 2015, 177, 401–411. [Google Scholar] [CrossRef]
  3. De Silva, S.; Ball, A.S.; Huynh, T.; Reichman, S.M. Metal Accumulation in Roadside Soil in Melbourne, Australia: Effect of Road Age, Traffic Density and Vehicular Speed. Environ. Pollut. 2016, 208, 102–109. [Google Scholar] [CrossRef]
  4. Xu, J.L.; Tang, Z.H.; Shang, J.C.; Zhao, Y.H. Comprehensive Evaluation of Municipal Garbage Disposal in Changchun City by the Strategic Environmental Assessment. Environ. Sci. Pollut. Res. Int. 2010, 17, 1090–1097. [Google Scholar] [CrossRef]
  5. Liu, E.; Wang, X.; Liu, H.; Liang, M.; Zhu, Y.; Li, Z. Chemical Speciation, Pollution and Ecological Risk of Toxic Metals in Readily Washed off Road Dust in a Megacity (Nanjing), China. Ecotoxicol. Environ. Saf. 2019, 173, 381–392. [Google Scholar] [CrossRef]
  6. Manno, E.; Varrica, D.; Dongarrà, G. Metal Distribution in Road Dust Samples Collected in an Urban Area Close to a Petrochemical Plant at Gela, Sicily. Atmos. Environ. 2006, 40, 5929–5941. [Google Scholar] [CrossRef]
  7. Bilos, C.; Colombo, J.C.; Skorupka, C.N.; Rodriguez Presa, M.J. Sources, Distribution and Variability of Airborne Trace Metals in La Plata City Area, Argentina. Environ. Pollut. 2001, 111, 149–158. [Google Scholar] [CrossRef]
  8. Kováčik, J.; Dudáš, M.; Hedbavny, J.; Mártonfi, P. Dandelion Taraxacum Linearisquameum Does Not Reflect Soil Metal Content in Urban Localities. Environ. Pollut. 2016, 218, 160–167. [Google Scholar] [CrossRef]
  9. Joshi, U.M.; Vijayaraghavan, K.; Balasubramanian, R. Elemental Composition of Urban Street Dusts and Their Dissolution Characteristics in Various Aqueous Media. Chemosphere 2009, 77, 526–533. [Google Scholar] [CrossRef] [PubMed]
  10. Zhao, N.; Lu, X.; Chao, S.; Xu, X. Multivariate Statistical Analysis of Heavy Metals in Less than 100 Μm Particles of Street Dust from Xining, China. Environ. Earth Sci. 2014, 73. [Google Scholar] [CrossRef]
  11. Ghanavati, N.; Nazarpour, A.; De Vivo, B. Ecological and Human Health Risk Assessment of Toxic Metals in Street Dusts and Surface Soils in Ahvaz, Iran. Environ. Geochem. Health 2019, 41, 875–891. [Google Scholar] [CrossRef] [PubMed]
  12. Trujillo-González, J.M.; Torres-Mora, M.A.; Keesstra, S.; Brevik, E.C.; Jiménez-Ballesta, R. Heavy Metal Accumulation Related to Population Density in Road Dust Samples Taken from Urban Sites under Different Land Uses. Sci. Total Environ. 2016, 553, 636–642. [Google Scholar] [CrossRef] [PubMed]
  13. Gunawardena, J.; Egodawatta, P.; Ayoko, G.A.; Goonetilleke, A. Atmospheric Deposition as a Source of Heavy Metals in Urban Stormwater. Atmos. Environ. 2013, 68, 235–242. [Google Scholar] [CrossRef] [Green Version]
  14. Zhao, H.; Li, X.; Wang, X.; Tian, D. Grain Size Distribution of Road-Deposited Sediment and Its Contribution to Heavy Metal Pollution in Urban Runoff in Beijing, China. J. Hazard. Mater. 2010, 183, 203–210. [Google Scholar] [CrossRef]
  15. Roy, S.; Gupta, S.K.; Prakash, J.; Habib, G.; Baudh, K.; Nasr, M. Ecological and Human Health Risk Assessment of Heavy Metal Contamination in Road Dust in the National Capital Territory (NCT) of Delhi, India. Environ. Sci. Pollut. Res. 2019, 26, 30413–30425. [Google Scholar] [CrossRef]
  16. Zhang, J.; Hua, P.; Krebs, P. Influences of Land Use and Antecedent Dry-Weather Period on Pollution Level and Ecological Risk of Heavy Metals in Road-Deposited Sediment. Environ. Pollut. 2017, 228, 158–168. [Google Scholar] [CrossRef]
  17. Soltani, N.; Keshavarzi, B.; Moore, F.; Tavakol, T.; Lahijanzadeh, A.R.; Jaafarzadeh, N.; Kermani, M. Ecological and Human Health Hazards of Heavy Metals and Polycyclic Aromatic Hydrocarbons (PAHs) in Road Dust of Isfahan Metropolis, Iran. Sci. Total Environ. 2015, 505, 712–723. [Google Scholar] [CrossRef]
  18. Safiur Rahman, M.; Khan, M.D.H.; Jolly, Y.N.; Kabir, J.; Akter, S.; Salam, A. Assessing Risk to Human Health for Heavy Metal Contamination through Street Dust in the Southeast Asian Megacity: Dhaka, Bangladesh. Sci. Total Environ. 2019, 660, 1610–1622. [Google Scholar] [CrossRef]
  19. Chen, H.; Lu, X.; Li, L.Y. Spatial Distribution and Risk Assessment of Metals in Dust Based on Samples from Nursery and Primary Schools of Xi’an, China. Atmos. Environ. 2014, 88, 172–182. [Google Scholar] [CrossRef]
  20. Li, F.; Zhang, J.; Huang, J.; Huang, D.; Yang, J.; Song, Y.; Zeng, G. Heavy Metals in Road Dust from Xiandao District, Changsha City, China: Characteristics, Health Risk Assessment, and Integrated Source Identification. Environ. Sci. Pollut. Res. Int. 2016, 23, 13100–13113. [Google Scholar] [CrossRef]
  21. Yang, S.; Li, P.; Liu, J.; Bi, X.; Ning, Y.; Wang, S.; Wang, P. Profiles, Source Identification and Health Risks of Potentially Toxic Metals in Pyrotechnic-Related Road Dust during Chinese New Year. Ecotoxicol. Environ. Saf. 2019, 184, 109604. [Google Scholar] [CrossRef]
  22. Cai, K.; Li, C.; Na, S. Spatial Distribution, Pollution Source, and Health Risk Assessment of Heavy Metals in Atmospheric Depositions: A Case Study from the Sustainable City of Shijiazhuang, China. Atmosphere 2019, 10, 222. [Google Scholar] [CrossRef] [Green Version]
  23. Duan, Z.; Wang, J.; Xuan, B.; Cai, X.; Zhang, Y. Spatial Distribution and Health Risk Assessment of Heavy Metals in Urban Road Dust of Guiyang, China. Nat. Environ. Pollut. Technol. 2018, 17, 407–412. [Google Scholar]
  24. Mahowald, N.M.; Scanza, R.; Brahney, J.; Goodale, C.L.; Hess, P.G.; Moore, J.K.; Neff, J. Aerosol Deposition Impacts on Land and Ocean Carbon Cycles. Curr. Clim. Change Rep. 2017, 3, 16–31. [Google Scholar] [CrossRef] [Green Version]
  25. Athanasopoulou, E.; Tombrou, M.; Russell, A.G.; Karanasiou, A.; Eleftheriadis, K.; Dandou, A. Implementation of Road and Soil Dust Emission Parameterizations in the Aerosol Model CAMx: Applications over the Greater Athens Urban Area Affected by Natural Sources. J. Geophys. Res. Atmos. 2010, 115. [Google Scholar] [CrossRef] [Green Version]
  26. Zhao, H.; Li, X. Risk Assessment of Metals in Road-Deposited Sediment along an Urban–Rural Gradient. Environ. Pollut. 2013, 174, 297–304. [Google Scholar] [CrossRef]
  27. Gunawardana, C.; Egodawatta, P.; Goonetilleke, A. Role of Particle Size and Composition in Metal Adsorption by Solids Deposited on Urban Road Surfaces. Environ. Pollut. 2014, 184, 44–53. [Google Scholar] [CrossRef] [PubMed] [Green Version]
  28. Liu, L.; Liu, A.; Li, Y.; Zhang, L.; Zhang, G.; Guan, Y. Polycyclic Aromatic Hydrocarbons Associated with Road Deposited Solid and Their Ecological Risk: Implications for Road Stormwater Reuse. Sci. Total Environ. 2016, 563–564, 190–198. [Google Scholar] [CrossRef]
  29. Gąsiorek, M.; Kowalska, J.; Mazurek, R.; Pająk, M. Comprehensive Assessment of Heavy Metal Pollution in Topsoil of Historical Urban Park on an Example of the Planty Park in Krakow (Poland). Chemosphere 2017, 179, 148–158. [Google Scholar] [CrossRef]
  30. Bergthorson, J.M.; Goroshin, S.; Soo, M.J.; Julien, P.; Palecka, J.; Frost, D.L.; Jarvis, D.J. Direct Combustion of Recyclable Metal Fuels for Zero-Carbon Heat and Power. Appl. Energy 2015, 160, 368–382. [Google Scholar] [CrossRef]
  31. Zhang, Y.; Feng, Q.; Meng, Q.; Lu, P.; Meng, L. Distribution and Bioavailability of Metals in Subsidence Land in a Coal Mine China. Bull. Environ. Contam. Toxicol. 2012, 89, 1225–1230. [Google Scholar] [CrossRef] [PubMed]
  32. Shabanda, I.; Koki, I.B.; Low, K.; Zain, S.M.; Khor, S.M.; Bakar, N.A.A. Daily Exposure to Toxic Metals through Urban Road Dust from Industrial, Commercial, Heavy Traffic, and Residential Areas in Petaling Jaya, Malaysia: A Health Risk Assessment. Environ. Sci. Pollut. Res. 2019. [Google Scholar] [CrossRef] [PubMed]
  33. Wang, J.; Liu, R.; Wang, H.; Yu, W.; Xu, F.; Shen, Z. Identification and Apportionment of Hazardous Elements in the Sediments in the Yangtze River Estuary. Environ. Sci. Pollut. Res. Int. 2015, 22, 20215–20225. [Google Scholar] [CrossRef]
  34. Wang, W.H.; Wong, M.H.; Leharne, S.; Fisher, B. Fractionation and Biotoxicity of Heavy Metals in Urban Dusts Collected from Hong Kong and London. Environ. Geochem. Health 1998, 20, 185–198. [Google Scholar] [CrossRef]
  35. Saba, T.; Su, S. Tracking Polychlorinated Biphenyls (PCBs) Congener Patterns in Newark Bay Surface Sediment Using Principal Component Analysis (PCA) and Positive Matrix Factorization (PMF). J. Hazard. Mater. 2013, 260, 634–643. [Google Scholar] [CrossRef] [PubMed]
  36. Haji Gholizadeh, M.; Melesse, A.M.; Reddi, L. Water Quality Assessment and Apportionment of Pollution Sources Using APCS-MLR and PMF Receptor Modeling Techniques in Three Major Rivers of South Florida. Sci. Total Environ. 2016, 566–567, 1552–1567. [Google Scholar] [CrossRef]
  37. Milic, A.; Miljevic, B.; Alroe, J.; Mallet, M.; Canonaco, F.; Prevot, A.S.H.; Ristovski, Z.D. The Ambient Aerosol Characterization during the Prescribed Bushfire Season in Brisbane 2013. Sci. Total Environ. 2016, 560–561, 225–232. [Google Scholar] [CrossRef]
  38. Li, Y.; Song, N.; Yu, Y.; Yang, Z.; Shen, Z. Characteristics of PAHs in Street Dust of Beijing and the Annual Wash-off Load Using an Improved Load Calculation Method. Sci. Total Environ. 2017, 581–582, 328–336. [Google Scholar] [CrossRef]
  39. Liu, R.; Men, C.; Liu, Y.; Yu, W.; Xu, F.; Shen, Z. Spatial Distribution and Pollution Evaluation of Heavy Metals in Yangtze Estuary Sediment. Mar. Pollut. Bull. 2016, 110, 564–571. [Google Scholar] [CrossRef]
  40. Zheng, N.; Liu, J.; Wang, Q.; Liang, Z. Health Risk Assessment of Heavy Metal Exposure to Street Dust in the Zinc Smelting District, Northeast of China. Sci. Total Environ. 2010, 408, 726–733. [Google Scholar] [CrossRef]
  41. The State Council on the General Planning of Zhengzhou City. Available online: http://www.gov.cn/zwgk/2010-08/23/content_1686432.htm (accessed on 23 October 2010).
  42. Zhengzhou Local History Office. Available online: http://szb.zhengzhou.gov.cn/html/2012/zzgl_1219/57.html (accessed on 11 February 2016).
  43. Zhengzhou Local History Office. Available online: http://szb.zhengzhou.gov.cn/zzgl/1142969.jhtml (accessed on 18 April 2014).
  44. Zhengzhou Statistical Bulletin on National Economic and Social Development. 2019. Available online: http://tjj.zhengzhou.gov.cn/tjgb/3112732.jhtml (accessed on 7 February 2021).
  45. Zhengzhou Municipal Public Bureau. Available online: http://zzga.zhengzhou.gov.cn/jfgg/3460061.jhtml (accessed on 24 June 2020).
  46. The Number of Electric Vehicles in Zhengzhou Has Exceeded 3 Million-China Electric Vehicle Association. Available online: http://www.ceva.org.cn/cn/viewnews/20191015/20191015102917.htm (accessed on 15 October 2019).
  47. Men, C.; Liu, R.; Xu, F.; Wang, Q.; Guo, L.; Shen, Z. Pollution Characteristics, Risk Assessment, and Source Apportionment of Heavy Metals in Road Dust in Beijing, China. Sci. Total Environ. 2018, 612, 138–147. [Google Scholar] [CrossRef]
  48. Wang, Q.; Lu, X.; Pan, H. Analysis of Heavy Metals in the Re-Suspended Road Dusts from Different Functional Areas in Xi’an, China. Environ. Sci. Pollut. Res. 2016, 23, 19838–19846. [Google Scholar] [CrossRef]
  49. Lin, H.; Zhu, X.; Feng, Q.; Guo, J.; Sun, X.; Liang, Y. Pollution, Sources, and Bonding Mechanism of Mercury in Street Dust of a Subtropical City, Southern China. Hum. Ecol. Risk Assess. Int. J. 2019, 25, 393–409. [Google Scholar] [CrossRef]
  50. Kurt-Karakus, P.B. Determination of Heavy Metals in Indoor Dust from Istanbul, Turkey: Estimation of the Health Risk. Environ. Int. 2012, 50, 47–55. [Google Scholar] [CrossRef]
  51. Li, H.; Shi, A.; Zhang, X. Particle Size Distribution and Characteristics of Heavy Metals in Road-Deposited Sediments from Beijing Olympic Park. J. Environ. Sci. 2015, 32, 228–237. [Google Scholar] [CrossRef]
  52. Ma, Z.; Chen, K.; Li, Z.; Bi, J.; Huang, L. Heavy Metals in Soils and Road Dusts in the Mining Areas of Western Suzhou, China: A Preliminary Identification of Contaminated Sites. J. Soils Sediments 2016, 16, 204–214. [Google Scholar] [CrossRef]
  53. Zhao, H.; Zhao, J.; Yin, C.; Li, X. Index Models to Evaluate the Potential Metal Pollution Contribution from Washoff of Road-Deposited Sediment. Water Res. 2014, 59, 71–79. [Google Scholar] [CrossRef]
  54. Kefeni, K.K.; Okonkwo, J.O. Trace Metals, Anions and Polybromodiphenyl Ethers in Settled Indoor Dust and Their Association. Environ. Sci. Pollut. Res. 2013, 20, 4895–4905. [Google Scholar] [CrossRef]
  55. Coufalík, P.; Zvěřina, O.; Mikuška, P.; Komárek, J. Seasonal Variability of Mercury Contents in Street Dust in Brno, Czech Republic. Bull. Environ. Contam. Toxicol. 2014, 93, 503–508. [Google Scholar] [CrossRef]
  56. Solid Waste–Determination of Metals–Inductively Coupled Plasma Mass Spectrometry (ICP-MS) (HJ 766-2015)|EISP. Available online: http://www.caeisp.org.cn/solid-waste%E2%80%93determination-metals%E2%80%93inductively-coupled-plasma-mass-spectrometry-icp-mshj-766-2015 (accessed on 19 January 2021).
  57. HJ 680-2013 PDF. Available online: https://www.chinesestandard.net/PDF/English.aspx/HJ680-2013 (accessed on 19 January 2021).
  58. Soil and Sediment-Determination of Aqua Regia Extracts of 12 Metal Elements-Inductively Coupled Plasma Mass Spectrometry. Available online: http://english.mee.gov.cn/Resources/standards/Soil/Method_Standard4/201607/t20160704_357088.shtml (accessed on 23 February 2021).
  59. Yu, Y.; Ma, J.; Song, N.; Wang, X.; Wei, T.; Yang, Z.; Li, Y. Comparison of Metal Pollution and Health Risks of Urban Dust in Beijing in 2007 and 2012. Environ. Monit. Assess. 2016, 188, 657. [Google Scholar] [CrossRef]
  60. Yu, W.; Liu, R.; Wang, J.; Xu, F.; Shen, Z. Source Apportionment of PAHs in Surface Sediments Using Positive Matrix Factorization Combined with GIS for the Estuarine Area of the Yangtze River, China. Chemosphere 2015, 134, 263–271. [Google Scholar] [CrossRef]
  61. Manousakas, M.-I.; Papaefthymiou, H.; Diapouli, E.; Migliori, A.; Karydas, A.; Radovic, I.; Eleftheriadis, K. Assessment of PM2.5 Sources and Their Corresponding Level of Uncertainty in a Coastal Urban Area Using EPA PMF 5.0 Enhanced Diagnostics. Sci. Total Environ. 2017, 574, 155–164. [Google Scholar] [CrossRef] [Green Version]
  62. Tian, Y.-Z.; Shi, G.-L.; Han, S.-Q.; Zhang, Y.-F.; Feng, Y.-C.; Liu, G.-R.; Gao, L.-J.; Wu, J.-H.; Zhu, T. Vertical Characteristics of Levels and Potential Sources of Water-Soluble Ions in PM10 in a Chinese Megacity. Sci. Total Environ. 2013, 447, 1–9. [Google Scholar] [CrossRef]
  63. Kim, E.; Hopke, P.K. Comparison between Sample-Species Specific Uncertainties and Estimated Uncertainties for the Source Apportionment of the Speciation Trends Network Data. Atmos. Environ. 2007, 41, 567–575. [Google Scholar] [CrossRef]
  64. Chen, H.; Teng, Y.; Li, J.; Wu, J.; Wang, J. Source Apportionment of Trace Metals in River Sediments: A Comparison of Three Methods. Environ. Pollut. 2016, 211, 28–37. [Google Scholar] [CrossRef]
  65. Awadh, S.M. Cd, Ni, and Pb Distribution and Pollution Assessment in Roadside Dust from Baghdad City and Western Iraqi Desert. Arab. J. Geosci. 2015, 8, 315–323. [Google Scholar] [CrossRef]
  66. Han, L.; Gao, B.; Wei, X.; Xu, D.; Gao, L. Spatial Distribution, Health Risk Assessment, and Isotopic Composition of Lead Contamination of Street Dusts in Different Functional Areas of Beijing, China. Environ. Sci. Pollut. Res. Int. 2016, 23, 3247–3255. [Google Scholar] [CrossRef]
  67. Lin, C.; Yu, R.; Hu, G.; Yang, Q.; Wang, X. Contamination and Isotopic Composition of Pb and Sr in Offshore Surface Sediments from Jiulong River, Southeast China. Environ. Pollut. 2016, 218, 644–650. [Google Scholar] [CrossRef]
  68. Zahra, A.; Hashmi, M.Z.; Malik, R.N.; Ahmed, Z. Enrichment and Geo-Accumulation of Heavy Metals and Risk Assessment of Sediments of the Kurang Nallah—Feeding Tributary of the Rawal Lake Reservoir, Pakistan. Sci. Total Environ. 2014, 470–471, 925–933. [Google Scholar] [CrossRef]
  69. Kowalska, J.; Mazurek, R.; Gąsiorek, M.; Setlak, M.; Zaleski, T.; Waroszewski, J. Soil Pollution Indices Conditioned by Medieval Metallurgical Activity—A Case Study from Krakow (Poland). Environ. Pollut. 2016, 218, 1023–1036. [Google Scholar] [CrossRef]
  70. Pathak, A.K.; Kumar, R.; Kumar, P.; Yadav, S. Sources Apportionment and Spatio-Temporal Changes in Metal Pollution in Surface and Sub-Surface Soils of a Mixed Type Industrial Area in India. J. Geochem. Explor. 2015, 159, 169–177. [Google Scholar] [CrossRef]
  71. Chen, T.; Zheng, Y.; Chen, H.; Zheng, G. Background concentrations of soil heavy metals in Beijing. Huan Jing Ke Xue 2004, 25, 117–122. [Google Scholar] [PubMed]
  72. Kusin, F.M.; Rahman, M.S.A.; Madzin, Z.; Jusop, S.; Mohamat-Yusuff, F.; Ariffin, M.; Md, Z.M.S. The Occurrence and Potential Ecological Risk Assessment of Bauxite Mine-Impacted Water and Sediments in Kuantan, Pahang, Malaysia. Environ. Sci. Pollut. Res. 2017, 24, 1306–1321. [Google Scholar] [CrossRef] [PubMed]
  73. Cheng, J.; Shi, Z.; Zhu, Y. Assessment and Mapping of Environmental Quality in Agricultural Soils of Zhejiang Province, China. J. Environ. Sci. 2007, 19, 50–54. [Google Scholar] [CrossRef]
  74. Müller, G. Index of Geo-Accumulation in Sediments of the Rhine River—ScienceOpen. Available online: https://www.scienceopen.com/document?vid=4b875795-5729-4c05-9813-64951e2ca488 (accessed on 1 April 2021).
  75. Buccolieri, A.; Buccolieri, G.; Cardellicchio, N.; Dell’Atti, A.; Di Leo, A.; Maci, A. Heavy Metals in Marine Sediments of Taranto Gulf (Ionian Sea, Southern Italy). Mar. Chem. 2006, 99, 227–235. [Google Scholar] [CrossRef]
  76. Li, R.; Cai, G.; Wang, J.; Ouyang, W.; Cheng, H.; Lin, C. Contents and Chemical Forms of Heavy Metals in School and Roadside Topsoils and Road-Surface Dust of Beijing. J. Soils Sediments 2014, 14, 1806–1817. [Google Scholar] [CrossRef]
  77. Al-Khashman, O.A. Determination of Metal Accumulation in Deposited Street Dusts in Amman, Jordan. Environ. Geochem. Health 2007, 29, 1–10. [Google Scholar] [CrossRef] [PubMed]
  78. Wang, G.; Xia, D.; Liu, X.; Chen, F.; Yu, Y.; Yang, L.; Chen, J.; Zhou, A. Spatial and Temporal Variation in Magnetic Properties of Street Dust in Lanzhou City, China. Chin. Sci. Bull. 2008, 53, 1913–1923. [Google Scholar] [CrossRef] [Green Version]
  79. Christoforidis, A.; Stamatis, N. Heavy Metal Contamination in Street Dust and Roadside Soil along the Major National Road in Kavala’s Region, Greece. Geoderma 2009, 151, 257–263. [Google Scholar] [CrossRef]
  80. Li, H.-H.; Chen, L.-J.; Yu, L.; Guo, Z.-B.; Shan, C.-Q.; Lin, J.-Q.; Gu, Y.-G.; Yang, Z.-B.; Yang, Y.-X.; Shao, J.-R.; et al. Pollution Characteristics and Risk Assessment of Human Exposure to Oral Bioaccessibility of Heavy Metals via Urban Street Dusts from Different Functional Areas in Chengdu, China. Sci. Total Environ. 2017, 586, 1076–1084. [Google Scholar] [CrossRef] [PubMed]
  81. Wang, J.; Chen, Z.; Sun, X.; Shi, G.; Xu, S.; Wang, D.; Wang, L. Quantitative Spatial Characteristics and Environmental Risk of Toxic Heavy Metals in Urban Dusts of Shanghai, China. Environ. Earth Sci. 2009, 59, 645. [Google Scholar] [CrossRef]
  82. Keshavarzi, B.; Tazarvi, Z.; Rajabzadeh, M.A.; Najmeddin, A. Chemical Speciation, Human Health Risk Assessment and Pollution Level of Selected Heavy Metals in Urban Street Dust of Shiraz, Iran. Atmos. Environ. 2015, 119, 1–10. [Google Scholar] [CrossRef]
  83. Škrbić, B.D.; Buljovčić, M.; Jovanović, G.; Antić, I. Seasonal, Spatial Variations and Risk Assessment of Heavy Elements in Street Dust from Novi Sad, Serbia. Chemosphere 2018, 205, 452–462. [Google Scholar] [CrossRef]
  84. Lu, X.; Wang, L.; Li, L.Y.; Lei, K.; Huang, L.; Kang, D. Multivariate Statistical Analysis of Heavy Metals in Street Dust of Baoji, NW China. J. Hazard. Mater. 2010, 173, 744–749. [Google Scholar] [CrossRef]
  85. Hu, X.; Zhang, Y.; Luo, J.; Wang, T.; Lian, H.; Ding, Z. Bioaccessibility and Health Risk of Arsenic, Mercury and Other Metals in Urban Street Dusts from a Mega-City, Nanjing, China. Environ. Pollut. 2011, 159, 1215–1221. [Google Scholar] [CrossRef]
  86. Huang, M.; Wang, W.; Chan, C.Y.; Cheung, K.C.; Man, Y.B.; Wang, X.; Wong, M.H. Contamination and Risk Assessment (Based on Bioaccessibility via Ingestion and Inhalation) of Metal(Loid)s in Outdoor and Indoor Particles from Urban Centers of Guangzhou, China. Sci. Total Environ. 2014, 479–480, 117–124. [Google Scholar] [CrossRef] [PubMed]
  87. Giyasov, B.; Giyasova, I. The Impact of High-Rise Buildings on the Living Environment. E3S Web Conf. 2018, 33, 1045. [Google Scholar] [CrossRef] [Green Version]
  88. Duan, J.; Tan, J. Atmospheric Heavy Metals and Arsenic in China: Situation, Sources and Control Policies. Atmos. Environ. 2013, 74, 93–101. [Google Scholar] [CrossRef]
  89. Zhang, Y.; Cao, S.; Xu, X.; Qiu, J.; Chen, M.; Wang, D.; Guan, D.; Wang, C.; Wang, X.; Dong, B.; et al. Metals Compositions of Indoor PM2.5, Health Risk Assessment, and Birth Outcomes in Lanzhou, China. Environ. Monit. Assess. 2016, 188, 325. [Google Scholar] [CrossRef]
  90. Pardyjak, E.R.; Speckart, S.O.; Yin, F.; Veranth, J.M. Near Source Deposition of Vehicle Generated Fugitive Dust on Vegetation and Buildings: Model Development and Theory. Atmos. Environ. 2008, 42, 6442–6452. [Google Scholar] [CrossRef]
  91. Amato, F.; Pandolfi, M.; Viana, M.; Querol, X.; Alastuey, A.; Moreno, T. Spatial and Chemical Patterns of PM10 in Road Dust Deposited in Urban Environment. Atmos. Environ. 2009, 43, 1650–1659. [Google Scholar] [CrossRef]
  92. Guo, W.; Huo, S.; Ding, W. Historical Record of Human Impact in a Lake of Northern China: Magnetic Susceptibility, Nutrients, Heavy Metals and OCPs. Ecol. Indic. 2015, 57, 74–81. [Google Scholar] [CrossRef]
  93. Dong, H.; Lin, Z.; Wan, X.; Feng, L. Risk Assessment for the Mercury Polluted Site near a Pesticide Plant in Changsha, Hunan, China. Chemosphere 2016, 169, 333–341. [Google Scholar] [CrossRef] [PubMed]
  94. Naderizadeh, Z.; Khademi, H.; Ayoubi, S. Biomonitoring of Atmospheric Heavy Metals Pollution Using Dust Deposited on Date Palm Leaves in Southwestern Iran. Atmósfera 2016, 29, 141–155. [Google Scholar] [CrossRef] [Green Version]
  95. Kowalska, J.B.; Mazurek, R.; Gąsiorek, M.; Zaleski, T. Pollution Indices as Useful Tools for the Comprehensive Evaluation of the Degree of Soil Contamination–A Review. Environ. Geochem. Health 2018, 40, 2395–2420. [Google Scholar] [CrossRef] [Green Version]
Figure 1. Research area.
Atmosphere 12 00614 g001
Figure 2. Geochemical mapping of heavy metal concentrations (mg/kg).
Atmosphere 12 00614 g002
Figure 3. Base factor profiles.
Atmosphere 12 00614 g003
Figure 4. Boxplot of Igeo (Green color= Quartile group 2, 25%), (Purple color= Quartile group 3, 25%).
Atmosphere 12 00614 g004
Figure 5. Boxplot of RI (Green color= Quartile group 2, 25%), (Purple color= Quartile group 3, 25%).
Atmosphere 12 00614 g005
Figure 6. Boxplot of PIN (Green color= Quartile group 2, 25%), (Purple color= Quartile group 3, 25%).
Atmosphere 12 00614 g006
Table 1. Index of classifications.
IndexCategoryDescription
Geo-Accumulation Index (Igeo) [74,75]Igeo < 0Unpolluted
Igeo 0–1Unpolluted/moderately polluted
Igeo 1–2Moderately polluted
Igeo 2–3Moderately/strongly polluted
Igeo 3–4Strongly polluted
Igeo 4–5strongly/extremely polluted
Igeo > 5Extremely polluted
Ecological Risk Index (RI) [47]Er ≤ 40; RI ≤ 150Low
40 < Er ≤ 80; 150 < RI ≤ 300Moderate
80 < Er ≤ 160; 300 < RI ≤ 600Considerable
160 < Er ≤ 320; 600 < RIHigh
Er > 320Extreme
Nemerow Pollution Index (PIN) [73]PIN < 0.7Safe
0.7 ≤ PIN < 1.0Precaution
1 ≤ PIN < 2Slightly Risk
2 ≤ PIN < 3Moderate Risk
PIN > 3Serious Risk
Table 2. Concentrations of heavy metals in the current study and reference areas (mg/kg).
Study AreasComparisonCrNiCuZnAsCdPbHg
Zhengzhou, ChinaBackground6421144280.08180.023
Min19.926.767.9935.528.030.1219.310.03
Max94.7828.2363.251319.2917.483.48160.621.53
Mean46.2912.5625.11152.3811.510.5752.120.33
Median40.9612.3822.08113.4411.100.4443.160.14
Reference AreasBangladesh, Dhaka144.3437.0149.68239.168.0911.6418.99NA *
China, Beijing92.132.4783.12280.654.880.5960.880.16
China, Beijing Park69.3325.9772.13219.2NA *0.64201.82NA *
China, Baoji126.748.8123.2715.319.8NA *433.21.1
China, Chengdu84.324.4100296NA *1.6682.3NA *
China, Guangzhou176.2241.38192.361777.1820.052.14387.530.22
China, Guiyang129.0460.43129.33176.05NA *0.6163.12NA *
China, Nanjing12655.912339413.41.11030.12
China, Shanghai157NA *NA *NA *8.731.242460.16
Greece, Kavala19658124272170.23010.1
India, Delhi57.7024.7099.90200.70NA *NA *164.20NA *
Iran, Ahvaz115.84NA *207.6104.249.336.8202.14NA *
Iran, Isfahan82.1366.63182.26707.1922.152.14393.33NA *
Iran, Shiraz67.1677.52136.34403.466.580.5115.711.05
Srilanka, Kandy10387.6123.61116.9NA *68.8234.4NA *
Serbia, Novi Sad60.128.142.7NA *1.880.5462.5NA *
* NA= Not Available.
Table 3. Concentrations in various types of land use (mg/kg).
Land Use AreasCrNiCuZnAsCdPbHg
Educational (EA)43.27513.958625.322170.67812.72631.0305854.71090.20115
Industrial (IA)41.308210.8518.6487.8010.810.3558.670.28
Park and Leisure (PA)35.21811.8016.4893.3511.630.4334.050.17
Commercial (CA)62.178513.4534.79223.4611.040.5263.120.46
Residential (RA)46.518912.4228.02166.1511.380.5753.840.49
Publisher’s Note: MDPI stays neutral with regard to jurisdictional claims in published maps and institutional affiliations.

