
DFT Simulation of the Water Molecule Interaction with the (00l) Surface of Montmorillonite


Centro di Ricerca Interdisciplinare di Biomineralogia, Cristallografia e Biomateriali, Dipartimento di Scienze Biologiche, Geologiche e Ambientali, Università di Bologna “Alma Mater Studiorum”, 40126 Bologna, Italy
*
Authors to whom correspondence should be addressed.
Minerals 2021, 11(5), 501; https://doi.org/10.3390/min11050501
Submission received: 19 April 2021
/
Revised: 4 May 2021
/
Accepted: 6 May 2021
/
Published: 9 May 2021
(This article belongs to the Section Crystallography and Physical Chemistry of Minerals & Nanominerals)
Abstract
:Montmorillonite is one of the principal mineralogical phases in clay minerals, where its interaction with water and other molecules represents one of the most important aspects and properties for basic science and specific applications. In fact, montmorillonite has many uses in various scientific and technological fields, ranging from environmental remediation to ceramics, food science, and construction/building materials. Several efforts have characterized its structure and physico-chemical properties, especially at the Tetrahedral-Octahedral-Tetrahedral TOT surface. For this purpose, in this work, the authors investigated the structural and electrostatic potential features of the (00l) surface of montmorillonite and the water adsorption process by first principle methods (density functional theory, DFT), considering both static and molecular dynamics approaches. The provided data further extend the knowledge of the modulation of the water molecule adsorption with this important clay mineral.
1. Introduction
Montmorillonite (MMT) is a clay mineral belonging to the smectite class, defining important phyllosilicates with swelling capability, i.e., they can adsorb a large quantity of water in their structural interlayer. As a 2:1 dioctahedral phyllosilicate, smectites are structurally composed of two tetrahedral sheets (T) of SiO4 groups sandwiching an octahedral sheet (O) with mainly trivalent cations. From the compositional point of view, there are several smectite minerals according to the type of isomorphic substitutions in the tetrahedral (e.g., Al3+/Si4+, beidelite) and/or in the octahedral layer (e.g., Mg2+/Al3+ in montmorillonite and Fe2+/Fe3+ in nontronite) [1]. These substitutions usually result in a negatively charged TOT layer whose neutrality is restored by monovalent (Na+, K+, Li+) or divalent (Ca2+, Mg2+, Fe2+) cations. The average charge of the smectite TOT layer is not unitary (−1) per unit formula, but it ranges from −0.6 to −0.2 [1]. This feature, together with the charge distribution, explains the peculiar property of the expandable clays.
The hydration of both the surface and the interlayer of clay minerals is a phenomenon playing a fundamental role in several industrial applications and the production of commodities using this kind of material. To cite some examples, it is important in nuclear waste disposal [2] and mud-rock drilling for petroleum and gas production [3], ceramics, and paper manufacturing [4,5]. Conversely, in the mining industry, clay minerals result in some technical difficulties in ore mineral processing because of their wettability, aggregation, and dispersion properties. For instance, it was reported that the separation of diaspore (valuable mineral) from kaolinite and illite (gangue minerals) during the flotation of bauxite is extremely challenging [6,7].
Clay minerals, in particular montmorillonite, are also important for soil remediation, as pollutants can be adsorbed on their surface and/or intercalated in the interlayer [8,9,10,11]. The remediation process involves the fundamental role of water as a solvent and is usually controlled by the cation exchange capacity (CEC) of montmorillonite, which can be affected by the surface charge of the 2:1 layers [12,13,14].
In the last two decades, smectites and, in general, clay minerals were employed as substrates for different and various fundamental and applied research involving biomolecules. For example, clays are able to condense, organize, and concentrate biomolecules of different kinds and sizes [15,16,17,18,19,20,21], and, if the clay substrates present both Brønsted and Lewis acid sites [22,23], they may also act as catalysts. Notwithstanding the important biotechnological applications of clay minerals, these types of studies are also of utmost interest in the field of prebiotic chemistry, i.e., in all the steps (selection, concentration, synthesis, and protection) that lead from the basic building blocks of life (amino acids, nucleotides, lipids) to functional macromolecules (peptides, RNA/DNA, membranes) and, eventually, to the first cell [24,25]. In fact, the biopolymerization process, being a polycondensation equilibrium reaction, is not favoured in water solution because H2O is a by-product. It was proposed that the reaction occurring at the mineral surface was accompanied by drying and wetting cycles.
For all the considerations and applications described above, it is important to understand both the effect of water and how the molecule interacts with the mineral in the interlayer and at the surface.
There are several studies on the investigation of the dehydration, rehydration, and swelling behaviour of montmorillonites, at both the experimental and theoretical levels [7,26,27,28,29,30]. The latter ones are mainly focused on the swelling of expandable clay minerals at the atomic level, providing a correlation between the observable properties and the crystal structure. Most of them reported simulations on changes in mineral properties at the mesoscale, i.e., they consider a very large number of water molecules interacting with the clay. This approach required force field methods, namely, the solution of the equation of motion of (charged) particles using classical mechanics [31]. Although they are very interesting for applicative purposes, these kinds of studies are not able to discern and describe some of most intimate relationships between the mineral and water that are due to weak, long-range interactions, if the employed force fields are not adequately parametrized.
In this context, ab initio methods may provide solid foundations for the characterization of clay minerals, providing accurate results that could be useful for different and various kinds of applications and to develop/reparametrize force fields for molecular dynamic simulations. This kind of approach was first adopted by Chatterjee and collaborators [27,32] in their pioneering work, where simple cluster models were employed. There have been several theoretical investigations on the hydration of clay minerals with more developed quantum-mechanical methods, such as Density Functional Theory (DFT), considering both static and dynamic conditions [14,28,31,33,34]. However, these studies are mostly devoted to the description of the interlayer hydration, and only a few considered the mineral surfaces and edges [35].
In the present work, two dioctahedral smectites belonging to the montmorillonite subgroup were considered, namely, sodium- (Na-MMT) and calcium-montmorillonite (Ca-MMT), according to the classification proposed by Bailey [36]. The interaction between the (001) surfaces of these minerals with an increasing number of water molecules, from one to three, was characterized in detail from both the structural and the adsorption energy points of view using static (0 K) simulations. Then, ab initio molecular dynamic (AIMD) simulations of the water/clay models with three H2O molecules were conducted to provide a time evolution of the system under room conditions (300 K and 1 bar).
The novelty of the present investigation resides in the combination of static/dynamic ab initio quantum mechanical methods that include the effects of weak van der Waals (long-range) interactions. In fact, the contribution of dispersive forces was usually neglected in past theoretical studies [14,26,37], and here this important physical aspect was considered when dealing with charged layered silicates. Furthermore, a detailed characterization of the adsorption behaviour of water on the (001) surface of Na- and Ca-MMT model systems constitutes fundamental knowledge that could be employed in various fields of application, such as those cited above.
2. Materials and Methods
2.1. Montmorillonite Starting Models
The (001) surface simplified models of Na- and Ca-MMT were both realized starting from a stoichiometric pyrophyllite bulk structure [Al2Si4O10(OH)2, space group ] that was theoretically investigated in previous work [38]. In detail, the required steps can be summarized as follows:
- a (001) slab model of pyrophyllite with a doubled a lattice parameter was “cut” from the bulk of the mineral. This model has lateral dimensions a = 10.335 Å and b = 8.983 Å, with surface area 92.841 Å2 and formula Al8Si16O40(OH)8 (Z = 4);
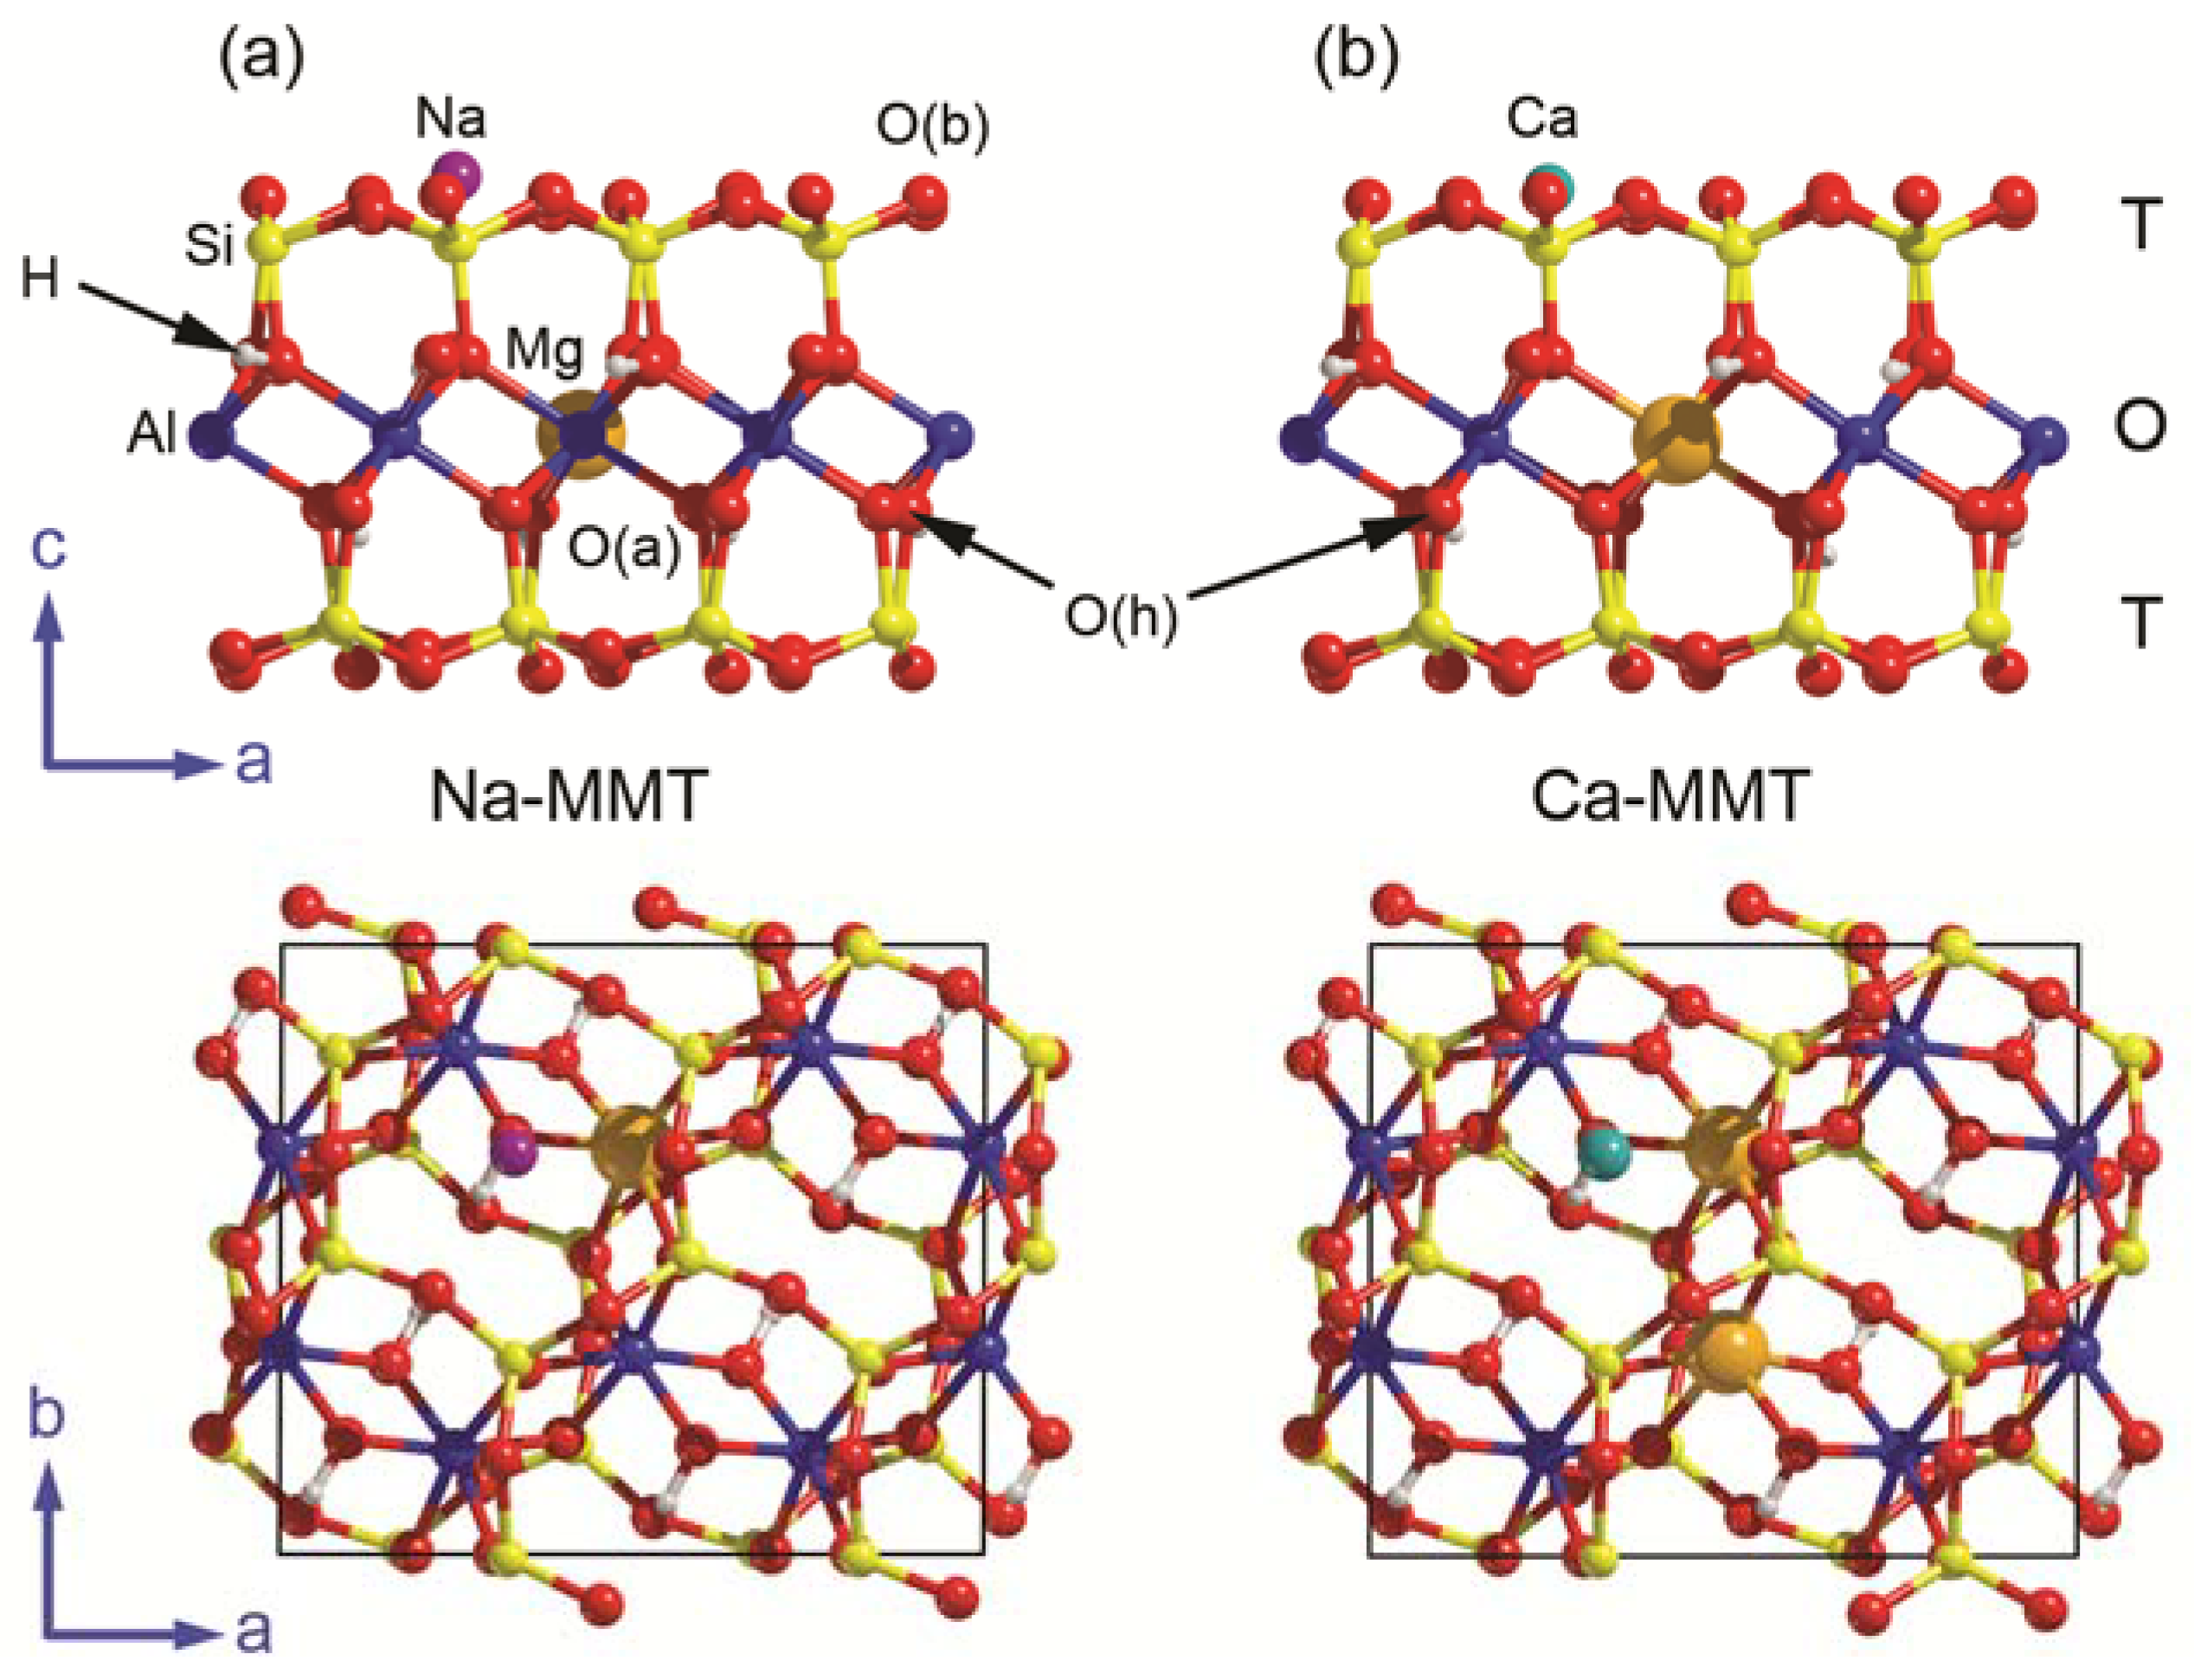
- a single Mg2+/Al3+ substitution in the octahedral sheet was inserted in the PYP model, and the resulting negative charge of the 2:1 layer was balanced by a sodium ion, which was initially placed over the hexagonal siloxane ring and above the ditrigonal holes, according to previous findings [26,27,29]. This model (Na-MMT, Figure 1a) has a chemical formula Na(Al7Mg)Si16O40(OH)8, which is similar to that of a Wyoming-type montmorillonite [Na0.66(Al, Mg)4Si8O20(OH)4] [39];
- finally, two Al3+ ions in the O sheet were substituted by Mg2+ and, to counter-balance the resulting double negative charge, a calcium ion was placed over the layer as in the previous point. This Ca-MMT model (Figure 1b) has a chemical formula Ca(Al6Mg2)Si16O40(OH)8.
The Na-MMT and Ca-MMT models were optimized in terms of both lattice parameters and internal geometry and then employed as substrates for water adsorption. In the following, the basal, apical, and hydroxyl oxygen atoms will be labelled as O(b), O(a), and O(h), respectively.
2.2. Static Simulations
The Density Functional Theory (DFT) is the theoretical framework employed in this work, choosing CRYSTAL17 [40] as the quantum mechanical code to perform all the periodic simulations.
All calculations used as Hamiltonian the well-known hybrid functional B3LYP [41,42], which includes a fraction (20%) of Hartree–Fock (exact) exchange. Since the correlation term of the total energy calculated by B3LYP relies on a standard generalized gradient approximation (GGA) functional, it severely underestimates the effect of long-range interactions (van der Waals, dipole–dipole, and so on). For this reason, the a posteriori correction known as DFT-D2 proposed by Grimme [43] for GGA-type DFT functionals, and adapted to the hybrid B3LYP one by Civalleri and co-workers [44], was also adopted in all the simulations. This approach was labelled by the authors of the cited work as B3LYP-D*, a nomenclature that will be adopted throughout the text of the present paper. The inclusion of long-range interactions in the physical model is of utmost importance for layered minerals such as montmorillonite because, together with electrostatic interactions, they contribute to both holding the 2:1 layers together and influencing the adsorption processes at the surface. The calculation of the exchange and correlation terms of the total energy is the result of a numerical integration of the electron density and its gradient, which is performed on a pruned grid of 75 radial points and 974 angular points obtained from the Gauss–Legendre quadrature and Lebedev schemes [40].
The diagonalization of the Hamiltonian matrix was performed on four k points in the 2D reciprocal space, resulting from a 2 × 2 × 1 Monkhorst–Pack net [45]. The choice is reasonable, as the surface area of the slab model is quite large. The threshold for the total energy accuracy was set to 10−8 Ha, which means that the difference between the calculated energy of two subsequent self-consistent field (SCF) cycles had to be lower than the fixed value to reach convergence.
CRYSTAL employs a linear combination of crystalline orbitals, expanded as Gaussian-type functions (basis sets), to describe the multielectronic function of the system. Here, the atomic basis sets were the same as those used in previous work on both bulk and surface properties of phyllosilicates [19,20,22,38,46,47,48,49,50,51,52,53], where they produced effective results of excellent quality. For the 2:1 layer, silicon, aluminium, oxygen, and hydrogen were described in terms of 88-31G* [54], 8-511d1G [55], 8-411d11G [56], and 3-1p1G [57], respectively. Magnesium, sodium, and calcium atoms were modelled by 8-511d1G [58], 8-511G [59,60], and 86-511d21G [52,56,61,62,63], respectively. For the oxygen and hydrogen atoms of water, the same Gaussian functions used for the clay surfaces were employed.
Both pristine ‘dry’ (001) surfaces of Na-MMT and Ca-MMT and the clay–water interaction models were fully relaxed using a “Quasi-Newton” optimization scheme as proposed by Schlegel [64]. Convergence on lattice parameters and internal geometry was reached when the maximum force, the root-mean square (RMS) force, the maximum atomic displacement, and the RMS atomic displacement on all atoms were all simultaneously lower than 4.5 × 10⁻⁴ au, 3.0 × 10⁻⁴ au, 18 × 10−4 au, and 12 × 10−4 au, respectively [40].
Regarding the adsorption process, there are different ways to define the binding (or adsorption) energy, BE, per water molecule. In the present work, it is expressed as the energy released when the molecule is adsorbed on the mineral substrate, according to the expression:
where the term E(SW//SW) represents the energy of the water/clay mineral system, E(S//S) is the energy of the clay slab model, and the last term, EM(W//W), is the molecular energy of the free (gas-phase) water molecule. It is worth noting that the labels after the double slash indicate the (optimized) geometry at which the energy terms were calculated. According to Equation (1), the binding energy is a negative quantity when the water molecule is bound to the clay surface [19,22,65,66]. Equation (1) may also be rewritten taking into account the terms related to the deformation of the slab (δES) and of the water molecule (δEM):
The BE* term in Equation (3) is the binding energy without any contribution from the deformation of the components. Different from Equation (1), the energy difference considers the energy of the slab and the energy of water molecules, E(S//SW) and E(W//SW), both in the optimized water/slab geometry. It is worth noting that E(W//SW) is related to a periodic water molecule, placed in the bidimensional unit cell of the optimized water/slab system. ΔEW and ΔEL are the deformation energy and the lateral interaction energy of water. The first term is always positive, as is δES for the surface, whereas ΔEL may be either positive (repulsion) or negative (attraction). In Equations (6) and (7) the term EM(W//SW) is the molecular energy of water in the adsorbed geometry.
Since the use of a non-complete set of Gaussian-type functions is associated with the basis set superposition error (BSSE), the adsorption energy is generally overestimated. To account for the BSSE and provide accurate energy values, the well-known counterpoise method proposed by Boys and Bernardi [67] was employed, whose definition is:
In Equation (9), the two terms E(S[W]//SW) and E([S]W//SW) represent the energy of the slab calculated with ghost functions on the water molecules and vice versa. While with a single water molecule, the lateral interaction and the molecular deformation energy terms can be easily calculated as shown in Equations (6) and (7), when there are N water molecules on the surface, these terms must be treated as shown in Equations (10) and (11). In detail, the basis set superposition error affects the lateral interaction energy between the molecules, increasing the binding energy between the surface and the water layer; hence, it has to be considered to avoid this artificial increment. The same treatment was already discussed and successfully employed to describe the interaction between water molecules and apatite surface [66] and glycine molecules on clinochlore [19].
2.3. Molecular Dynamic Simulations
The AIMD simulations were conducted at the DFT level by means of the QuantumATK code (version Q-2019.12) [68,69]. The density functional employed is the standard PBE proposed by Perdew, Burke, and Ernzerhof in 1996 [70], corrected for the long-range interactions with the DFT-D2 scheme [38], whereas a numerical linear combination of atomic orbital (LCAO) basis sets with double-ζ quality plus polarization (DZP) were employed [71]. A 2 × 2 × 1 mesh of k points was employed to sample the First Brillouin Zone. A first equilibration period was carried out for 1 ps (1000 steps of 1 fs) at 300 K using a NVT (canonical ensemble) Nose-Hoover thermostat [72] (time scale of 100 fs). The initial velocities were selected from a Boltzmann distribution at 300 K. Then, a second equilibration of the water/clay system was performed with an NPT Martyna–Tobias–Klein thermo-barostat [73], considering 1 ps (1000 steps of 1 fs) at 300 K and 1 bar (time scales of the thermostat and barostat set to 100 fs and 500 fs, respectively). These two steps are necessary to ensure negligible variations of pressure and temperature during the production simulation. Albeit short if compared to classical (i.e., force field) molecular dynamics, the selected NVT and NPT equilibration times were sufficient to obtain energy, temperature, pressure, and atomic positions that oscillate around stable averages (e.g., the set PT conditions, positional disorder ±0.1 Å). The production simulation was finally conducted for each model within the NPT ensemble at 300 K and 1 bar of pressure for 5 ps (5000 steps of 1 fs). While the present AIMD simulation was carried out on a small time scale, it was enough to describe the mean behaviour of the three water molecules on the different kinds of (001) montmorillonite surface models.
3. Results and Discussion
3.1. Surface Models
The optimized unit cell for the Na- and Ca-montmorillonite (001) slab models are graphically shown in Figure 1, whereas several quantitative results on the internal geometry of the clay minerals are reported in Table 1. Each model was optimized in the P1 space group, and the thicknesses of the TOT layers of Na-MMT and Ca-MMT were 6.9494 Å and 6.7959 Å, respectively.
The lattice parameters a, b, and γ and the internal geometry (bond lengths and angles) of the (001) surface of Na-montmorillonite are in agreement with the previous theoretical works of Hernández-Laguna et al. (a = 10.54 Å, b = 9.12 Å, γ = 90°) [37], Berghout et al. [26] (a = 10.28 Å, b = 9.08 Å, γ = 90°), and Peng and co-workers (a = 10.38 Å, b = 9.01 Å, γ = 89.84°) [30], obtained with different DFT approaches on ‘dry’ bulk mineral phases. Berghout and co-workers [26] reported the Ca-montmorillonite structure, with lattice parameters a = 10.28 Å, b = 9.03 Å, and γ = 90°, whereas Hernández-Laguna et al. [37] calculated a = 10.58 Å, b = 9.11 Å, and γ = 90°. It is worth noting that although Berghout et al. [26], who used the VASP code, projector-augmented wave (PAW) plane wave basis sets, and the Perdew–Wang GGA functional, no correction for dispersive forces was included. The same applies to the simulations performed by Hernández-Laguna et al. [37], who employed the SIESTA code, numerical atomic orbital basis sets, and the PBE functional. More recently, Belzunces and co-workers [74,75] reported the structural parameters of single-layered Ca-montmorillonite calculated at a DFT/PBE-D2 level of theory, which was employed to study the interaction of the mineral with different pesticides (organic molecules). The lattice parameters of the present research well agree with those reported by the cited authors (a = 10.334 Å, b = 8.968 Å, and γ = 89.76°). The present results are in reasonable agreement with the previous ones at the bulk level experimentally determined by Tsipursky and Drits (a = 10.36 Å, b = 8.97–9.01 Å, and γ = 90°) [76], which is an important assessment for the correct physical treatment of the mineral phases under investigation. Further, the internal geometries (bond lengths and angles) of the Na-MMT and Ca-MMT models are consistent with those of the massive mineral, meaning that the surface reconstruction is almost negligible. Hence, as also stated elsewhere by Moro and co-workers [19,20,21,22], a single layer of 2:1 phyllosilicates is sufficient for the treatment and analysis of surface adsorption phenomena.
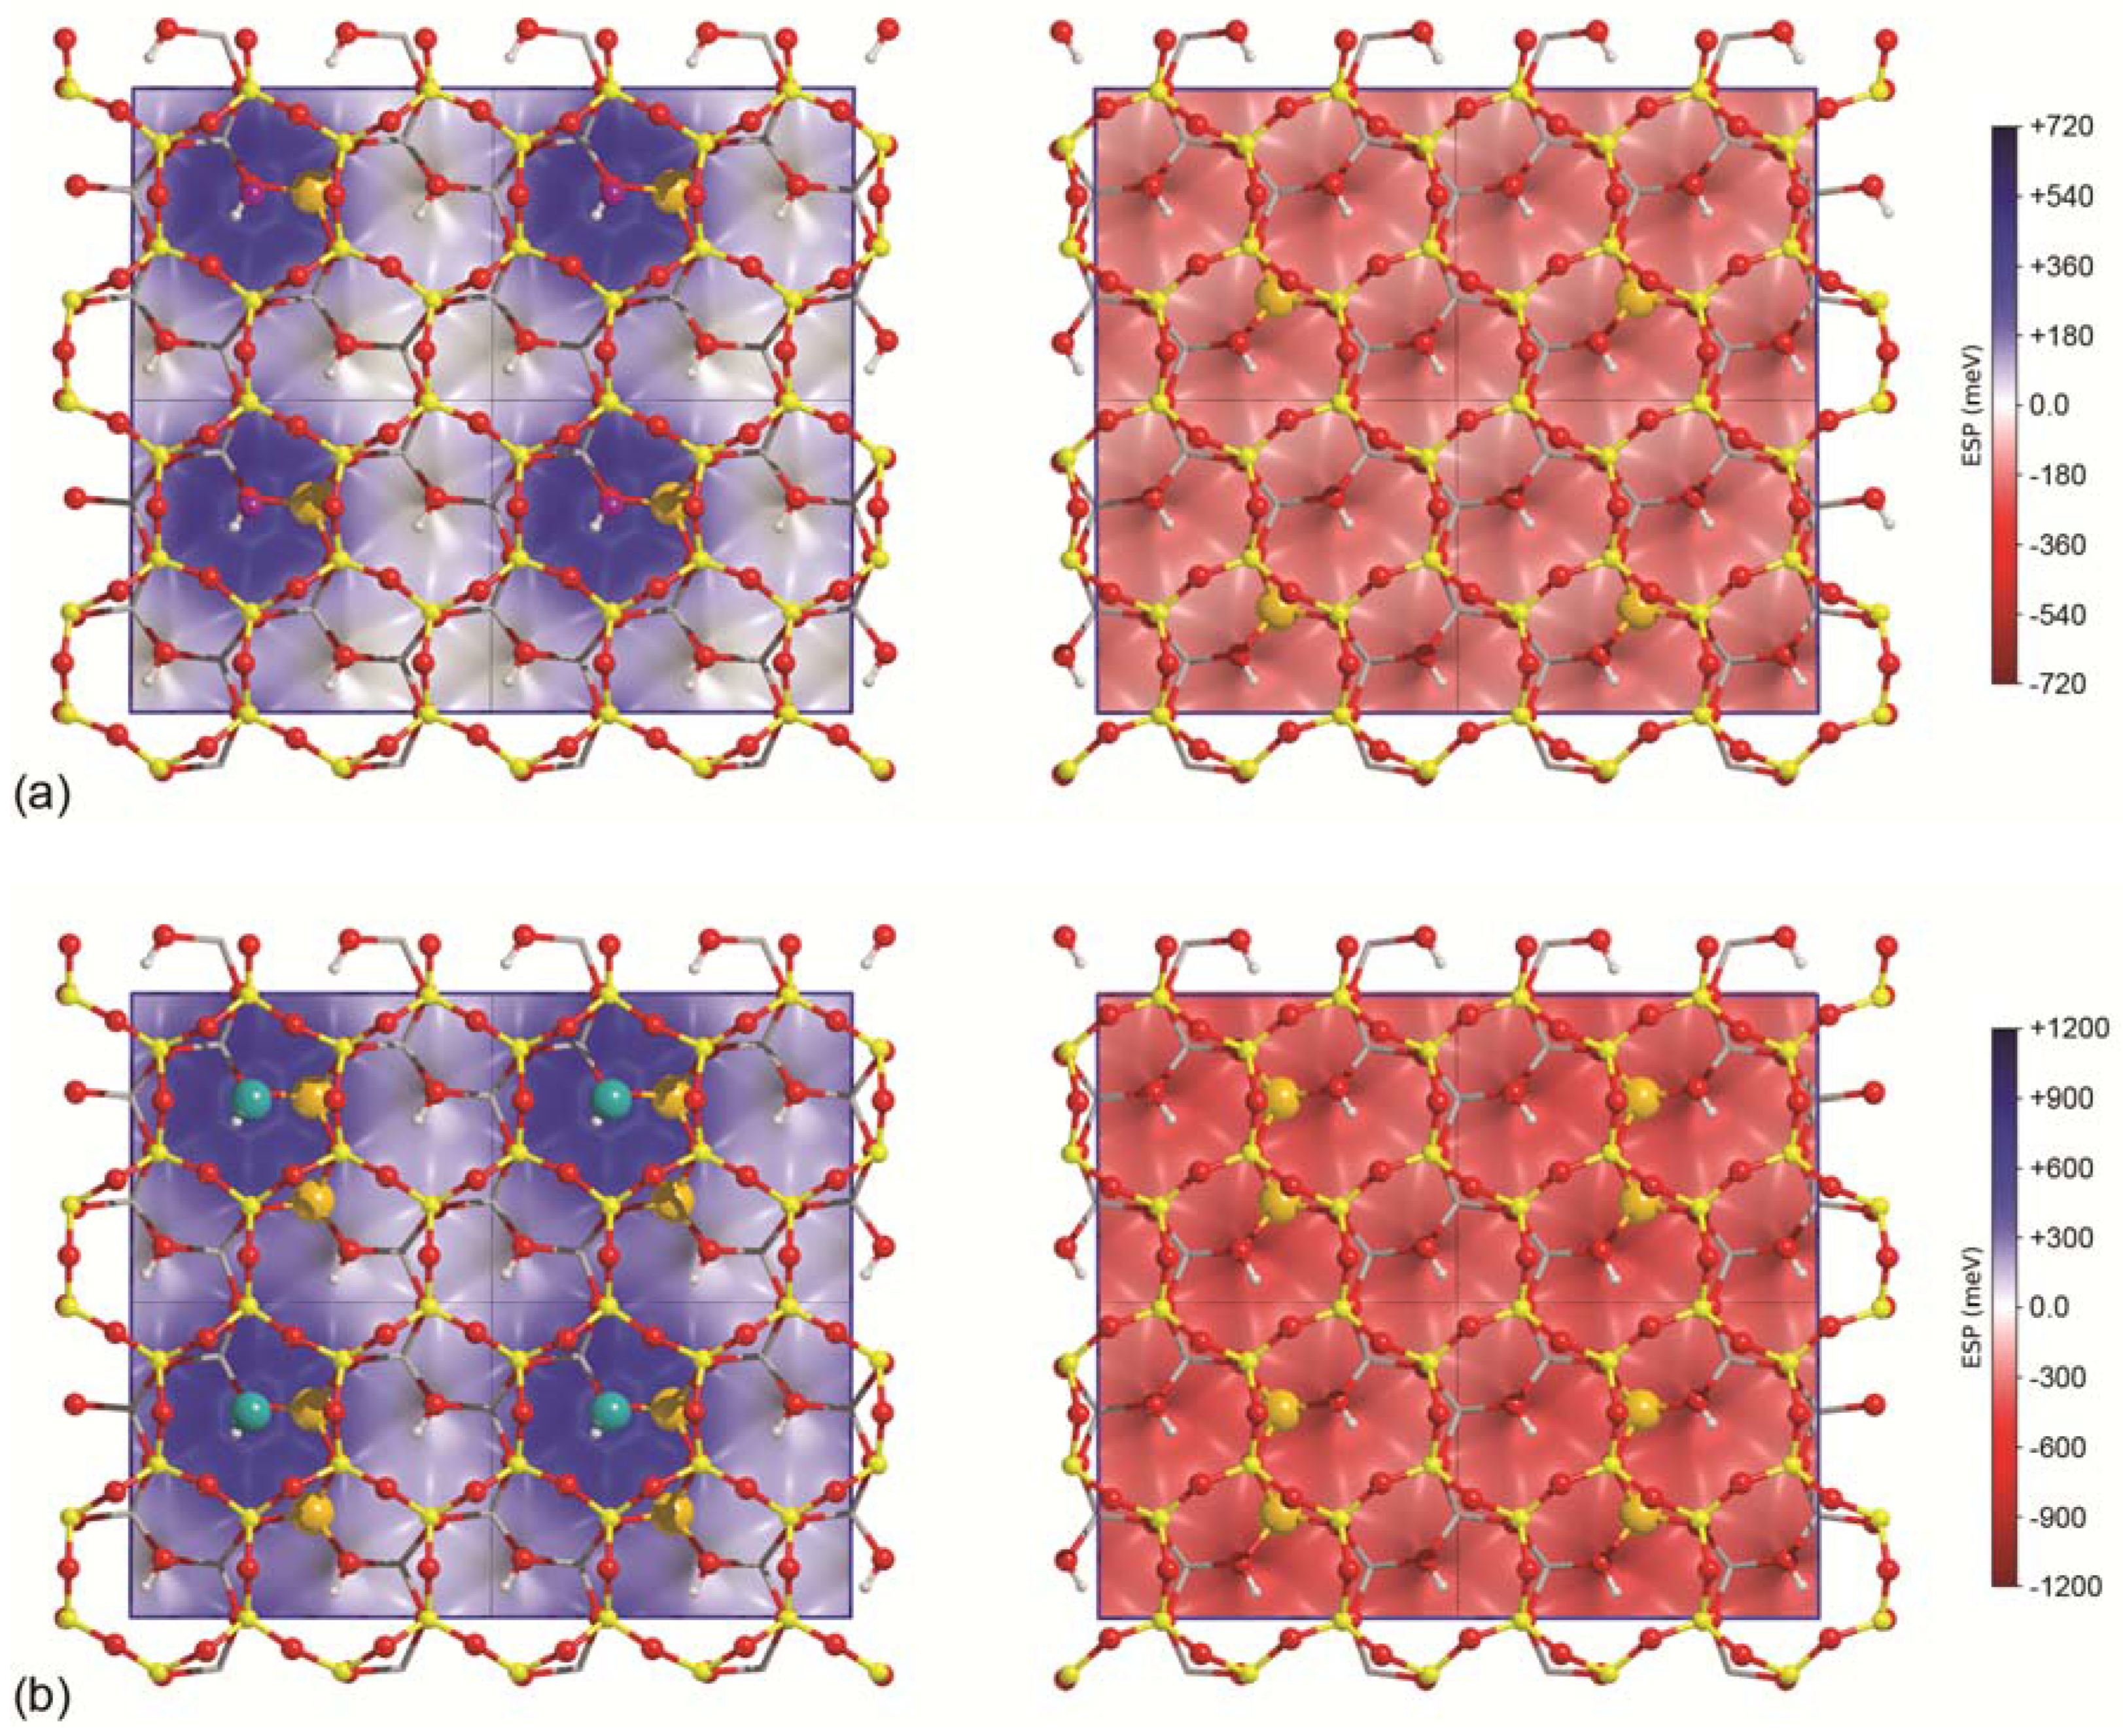
Figure 2 reports the electrostatic surface potential (ESP) of Na- and Ca-montmorillonite, calculated on an iso-surface of charge density (ρ = 10−5 a.u.). The Na-MNT and Ca-MMT ESP features are very different from those of an ideal, neutral 2:1 dioctahedral phyllosilicate (i.e., pyrophyllite [77]). Because of the presence of a cation exposed on one face of the (001) slab, which will be called “top surface” from now on, this side shows a remarkable positive potential, with its maximum of 0.72 eV and 1.20 eV centred on the Na+ and Ca2+ ions, respectively. Conversely, the other side of the slab (the “bottom surface”) has a general negative potential. On either face of the (001) clay mineral slabs, no recognizable electrostatic potential pattern was observed. These observations of the electrostatic surface potential of the Na- and Ca-MMT models are in line with the theoretical findings on defective talc-like surfaces reported in recent work [20,46]. It is interesting that the maximum potential of the talc-like model called TOT(Al) + Na [20], which contains a Al3+/Si4+ substitution and a sodium cation, has a maximum electrostatic surface potential on the Na+ ion of about two times (1.5 eV) that of the Na-montmorillonite (001) surface investigated here. This is due to the negative charge arising from the aluminium substitution in the tetrahedral layer, which is directly exposed on the surface. The negative charge related to the Mg2+/Al3+ substitution in the octahedral layer of montmorillonite is instead “shielded” by the T layers.
The electrostatic potential features of Na-MMT are in line with those reported by Mignon and co-workers [15], who evaluated a potential of 0.5 eV centred on the sodium cation by means of DFT calculations with a plane wave basis set.
The three-dimensional electrostatic surface potential maps of the two (001) slab models previously discussed are useful to identify possible docking sites for water according to the “electrostatic complementarity principle”. In this sense, one should expect the formation of O–H---O(b) (hydrogen) bonds between the hydrogen atoms of the molecule and the basal SiO4 oxygen and/or the interaction between the oxygen of H2O with the Na+ or Ca2+ cation. In the latter case, water behaves like a Lewis acid. Different hydration levels on the Na-MMT and Ca-MMT models were considered, which translates to an increasing number of H2O molecules interacting with the (001) surfaces; the following results are subdivided into two groups to facilitate the specific comprehension and discussion.
3.2. Single Water Molecule Adsorption
A single H2O molecule (W1) was placed on the surface of the montmorillonite models. Further, because the top and bottom faces of the (001) MMT surfaces are different, as shown by the electrostatic surface potential maps, four adsorption models were considered: two for sodium (Na-MMT-W1T and Na-MMT-W1B) and two for calcium montmorillonites (Ca-MMT-W1T and Ca-MMT-W1B). The letters “T” and “B” in the labels of the models indicate the adsorption occurring on the top or on the bottom face of the slab, respectively.
In each model, the water molecule was placed with its plane flat with respect to the surface and at 4 Å from the topmost atom of the slab. Then, the H2O/slab system was fully relaxed without any symmetry constraint. In this way, the adsorbant was able to freely deform, rotate, and translate to find the best adsorption conformation. This is a longer procedure than optimizing the geometry of a model with water already near a possible adsorption site, because it requires more optimization cycles. However, when several adsorption sites could be explored, as depicted by Peng et al. [30], this approach should lead to the lowest configurational minimum.
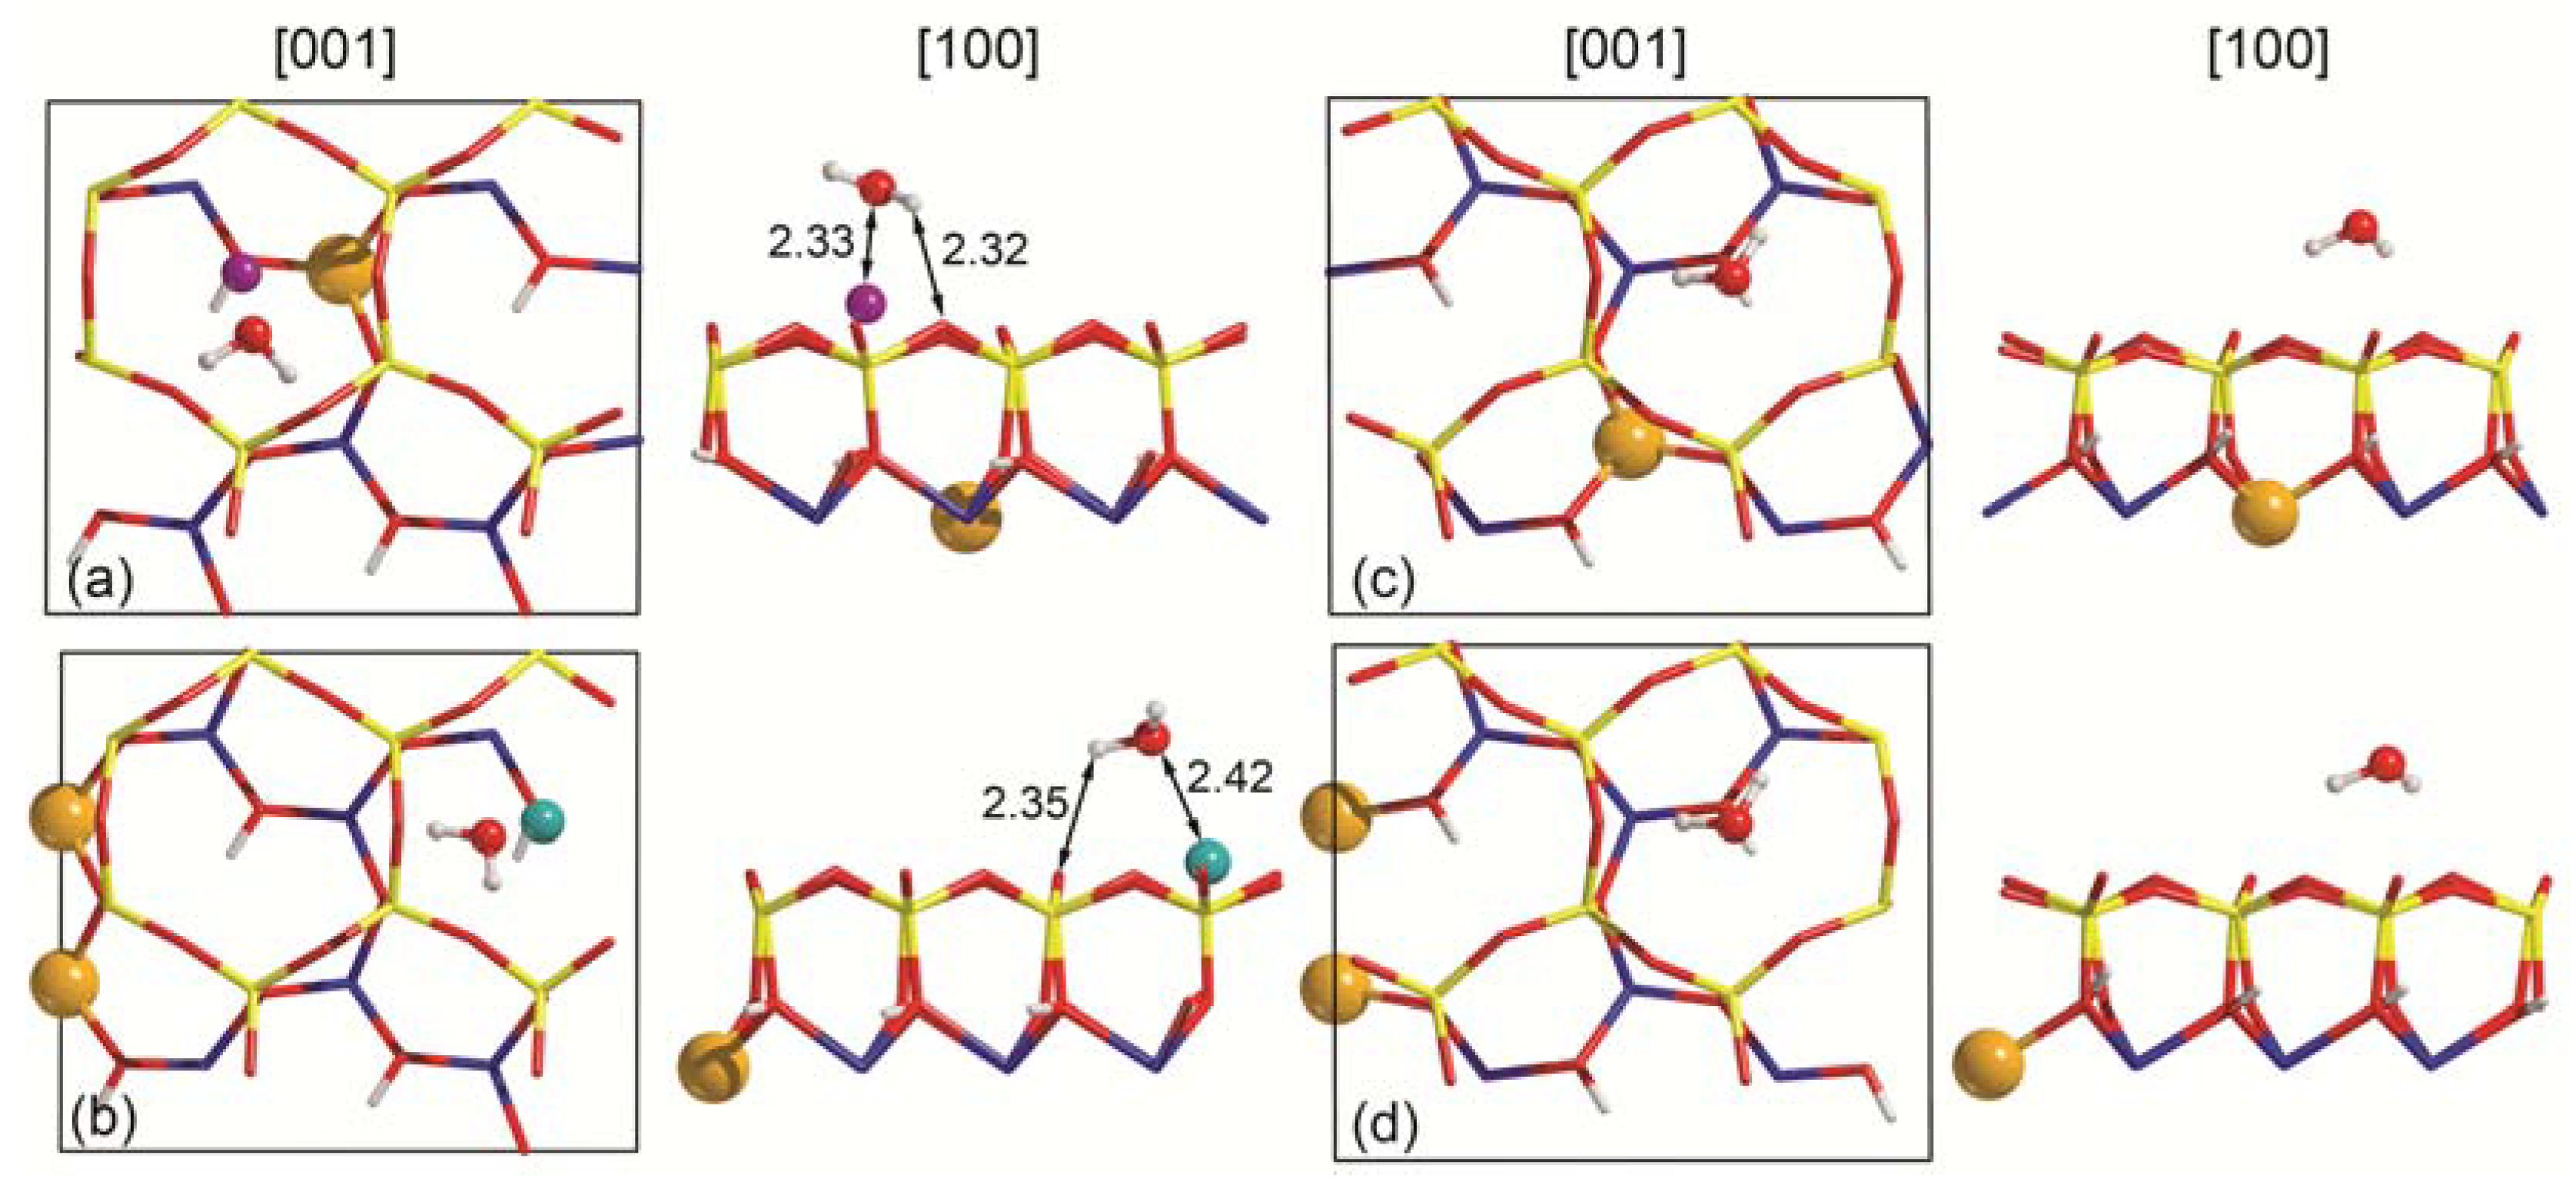
The results for the highest interaction energy of each (001) slab model are shown in Figure 3, whereas the adsorption energies are reported in Table 2. The bottom face of both Na- and Ca-montmorillonite (001) surfaces (not shown in Figure 3) show similar behaviour, as in both models the water molecule interacts with the basal oxygen at a distance greater than 2.1 Å, the typical threshold for hydrogen bond formation (Figure 3a,b). The H2O plane is canted with respect to the surface by about 50°, with the oxygen atom repelled by the negative potential exerted by the underneath O(h) atom of the slab. Overall, the results suggest a very weak interaction between the molecule and the montmorillonite surfaces. As further evidence, both the water and (001) surfaces show a very low deformation energy, ΔEW and δES, respectively. The binding energy values decrease in absolute terms as the negative charge of the surface increases, following the trend Na-MMT-W1B < Ca-MMT-W1B. The purely electronic BEC value is positive, 0.58 kJ mol−1 and 2.46 kJ mol−1 for Na- and Ca-montmorillonite, respectively, meaning that the adsorption process is entirely driven by the dispersive interaction.
Conversely, there is a strong adsorption between water and the top (001) surface of the montmorillonite models, with the BSSE-corrected binding energy values of Na-MNT-W1T and Ca-MMT-W1T being about −61 kJ mol−1 and −84 kJ mol−1. In this case, the contribution of the long-range interaction is lower, about 28% for the sodium-bearing montmorillonite and 14% for the calcic one. As graphically shown in Figure 3, the oxygen atom of H2O points toward the cation of the surface and a single hydrogen atom interacts at long distance (about 2.3 Å) with a basal oxygen, O(b). Even if the adsorption process is favourable, negligible variations in the water molecule geometry were observed; the slab shows some degree of deformation in terms of the z coordinate of the cation, which is slightly moved upwards of about 0.104 Å and 0.050 Å in the Na-MMT-W1T and Ca-MMT-W1T models, respectively.
The adsorption features of the Na-MMT-W1T model are in excellent agreement with the theoretical results reported by Peng and co-workers [30], in particular the model labelled as M(001)W-2 that shows an adsorption configuration similar to the one of the Na-MMT-W1T system. The adsorption energy obtained at the DFT level with the CASTEP code, ultrasoft pseudopotentials, PBE functional and the DFT-D2 scheme [42] is −61.44 kJ mol−1, which is perfectly comparable to the one here reported using GTO basis set. Regarding the adsorption geometry, the distance between water oxygen (OW) and Na+ reported by Peng et al. [30] is close to the present one (2.39 Å and 2.33 Å, respectively). However, there is a small discrepancy in the long-range interactions between water hydrogen (HW) and the basal oxygen atoms O(b). In the present work, only a single H-bond with HW···O(b) distance 2.32 Å. Instead, Peng and collaborators calculated two hydrogen bonds with distances 2.70 Å and 2.78 Å (mean value of 2.74 Å).
Unfortunately, there is not any theoretical or experimental study on the adsorption features of water on the (001) surface of Ca-MMT for a direct comparison.
3.3. Water Adsorption Features at Increasing Coverage
The results on a single molecule level described in the previous paragraph suggested that water molecules would be preferentially adsorbed on the (001) slab surface exposing the cation (Na+ or Ca2+). For this reason, in the following the investigation of the water adsorption process at increasing surface coverage considers only the top surface of the slab models.
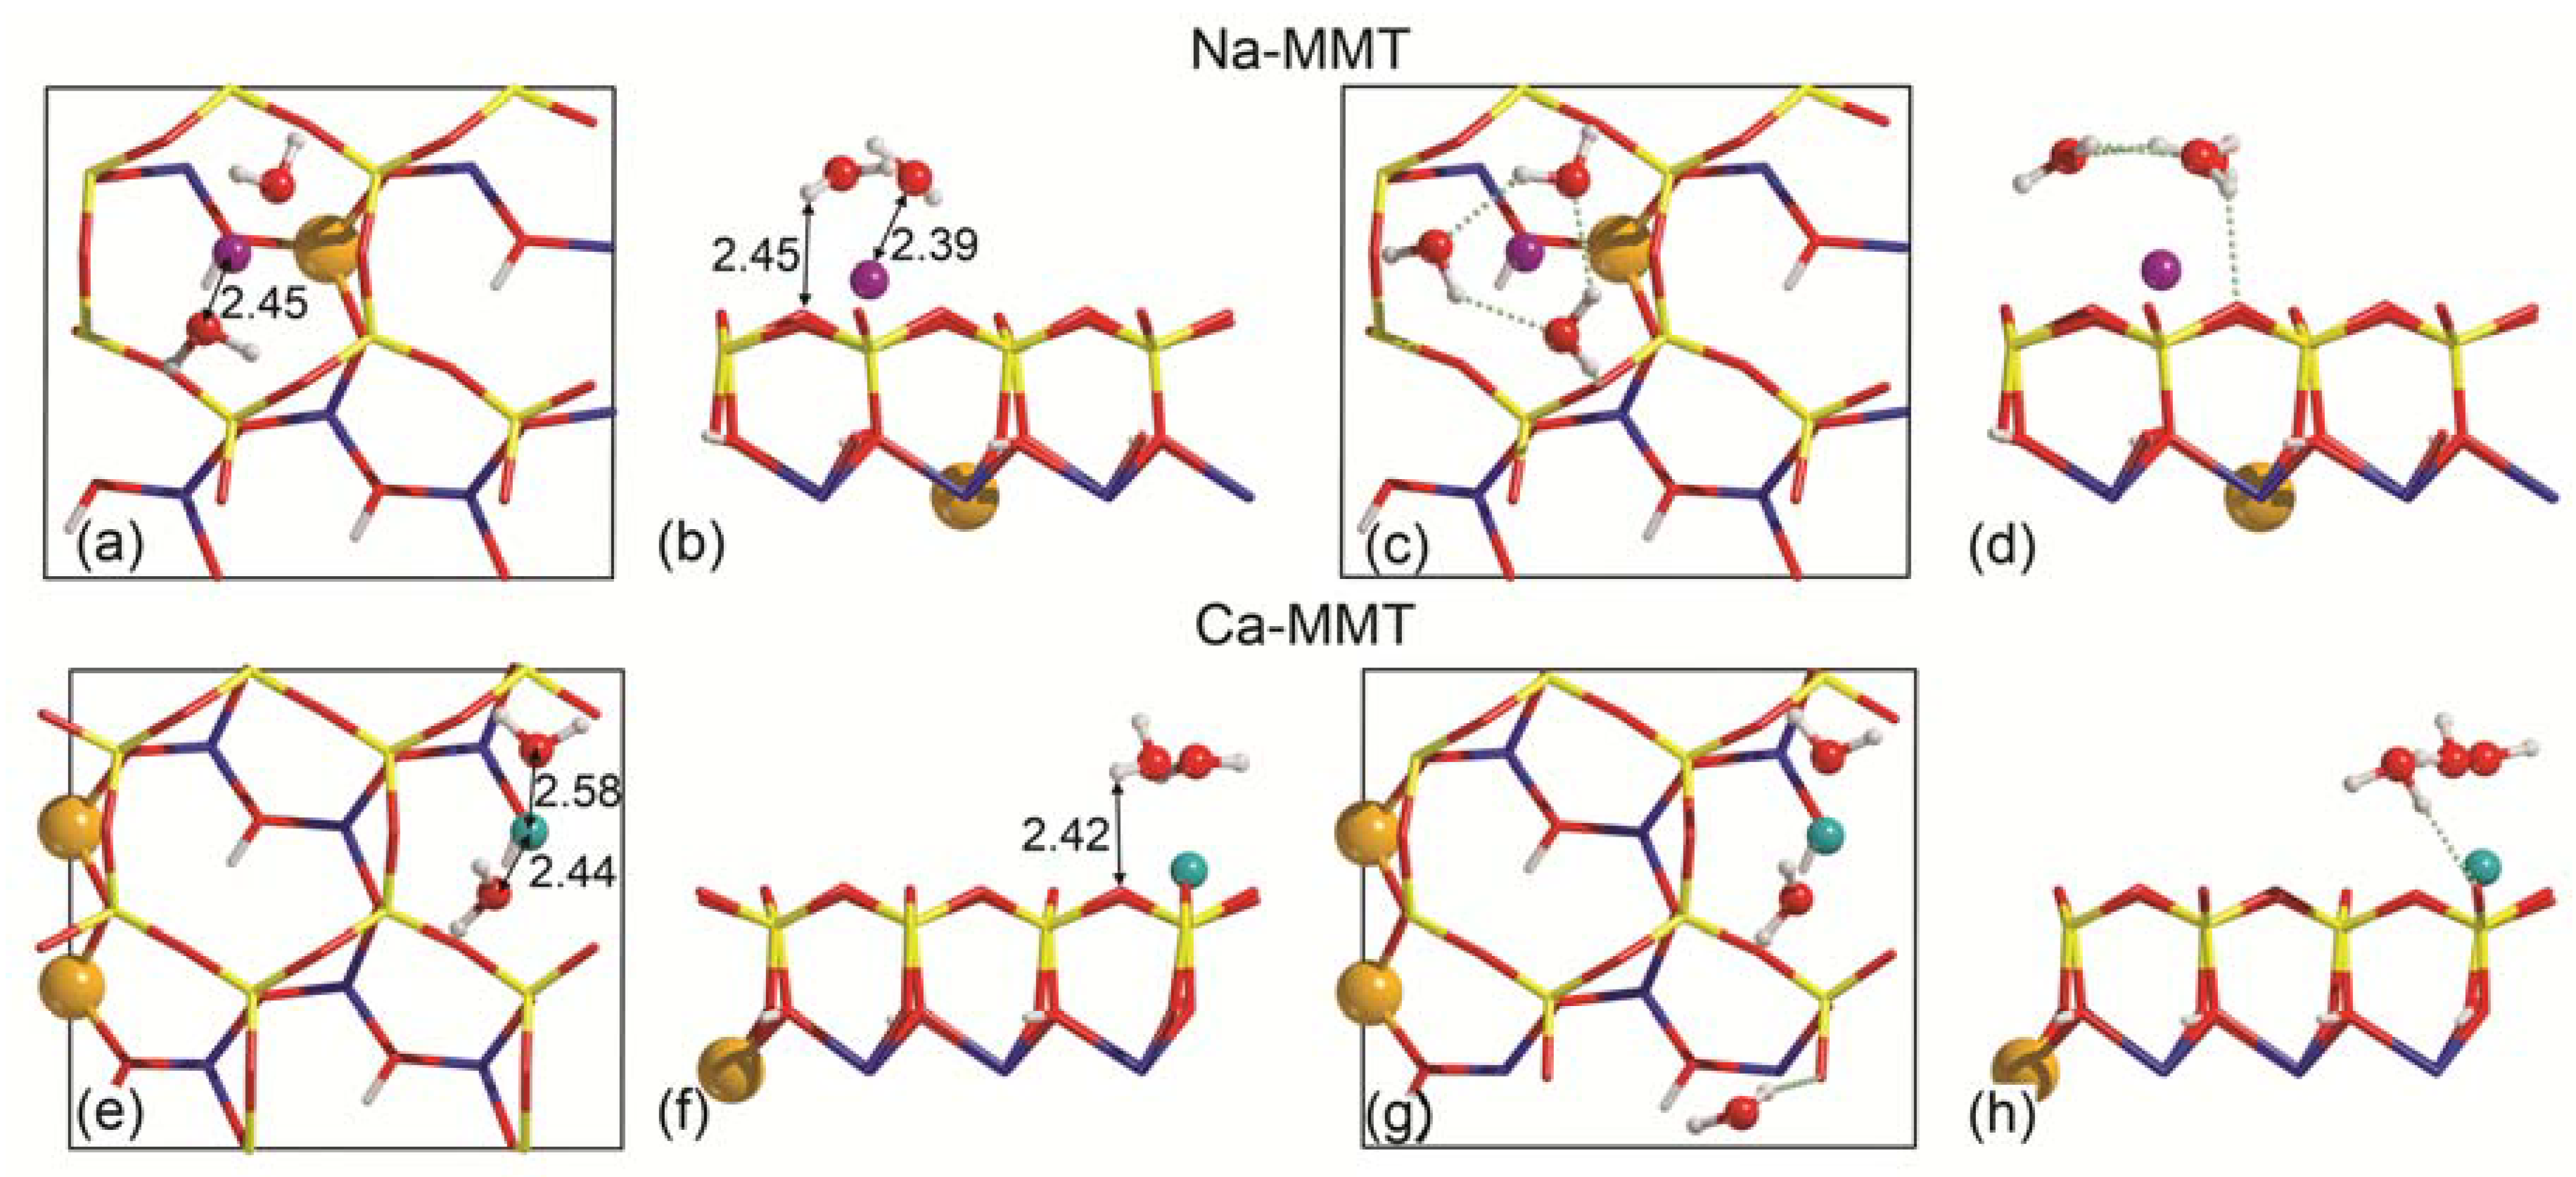
To model the increase of the (001) surface hydration layer, a second water molecule was placed at about 4 Å from the surface of the previous Na-MMT-W1T and Ca-MMT-W1T systems, with the H2O plane parallel to the slab. This should represent the subsequent approach of water on the mineral surfaces and, as for the single molecule case, the starting H2O-to-slab distance is sufficient to establish an interaction between the different components of the system. At the same time, this choice left room for the free translation and/or rotations of all the H2O molecules, including the already adsorbed one. These new models were labelled as Na-MMT-W2 and Ca-MMT -W2, and the geometry optimization result is reported in Figure 4a–h. The normalized binding energy per water molecule is reported in Table 2 for each considered system.
In both optimized MMT-W2 models of adsorption, the two H2O molecules interact with the cation (Na+ or Ca2+) via the oxygen atom at a distance between 2.39 Å and 2.58 Å, and each adsorbant establishes a long-range interplay between a hydrogen atom with the O(b) of the (001) surface. At geometrical level, the first adsorbed molecule was only slightly displaced by the addition of the second one. From the energetical point of view, both molecules are strongly bound to the Na-MMT (Figure 4a,b) and Ca-MMT slabs (Figure 4c,d), with BEC per water molecule equal to −49.9 kJ mol−1 and −69.1 kJ mol−1, respectively.
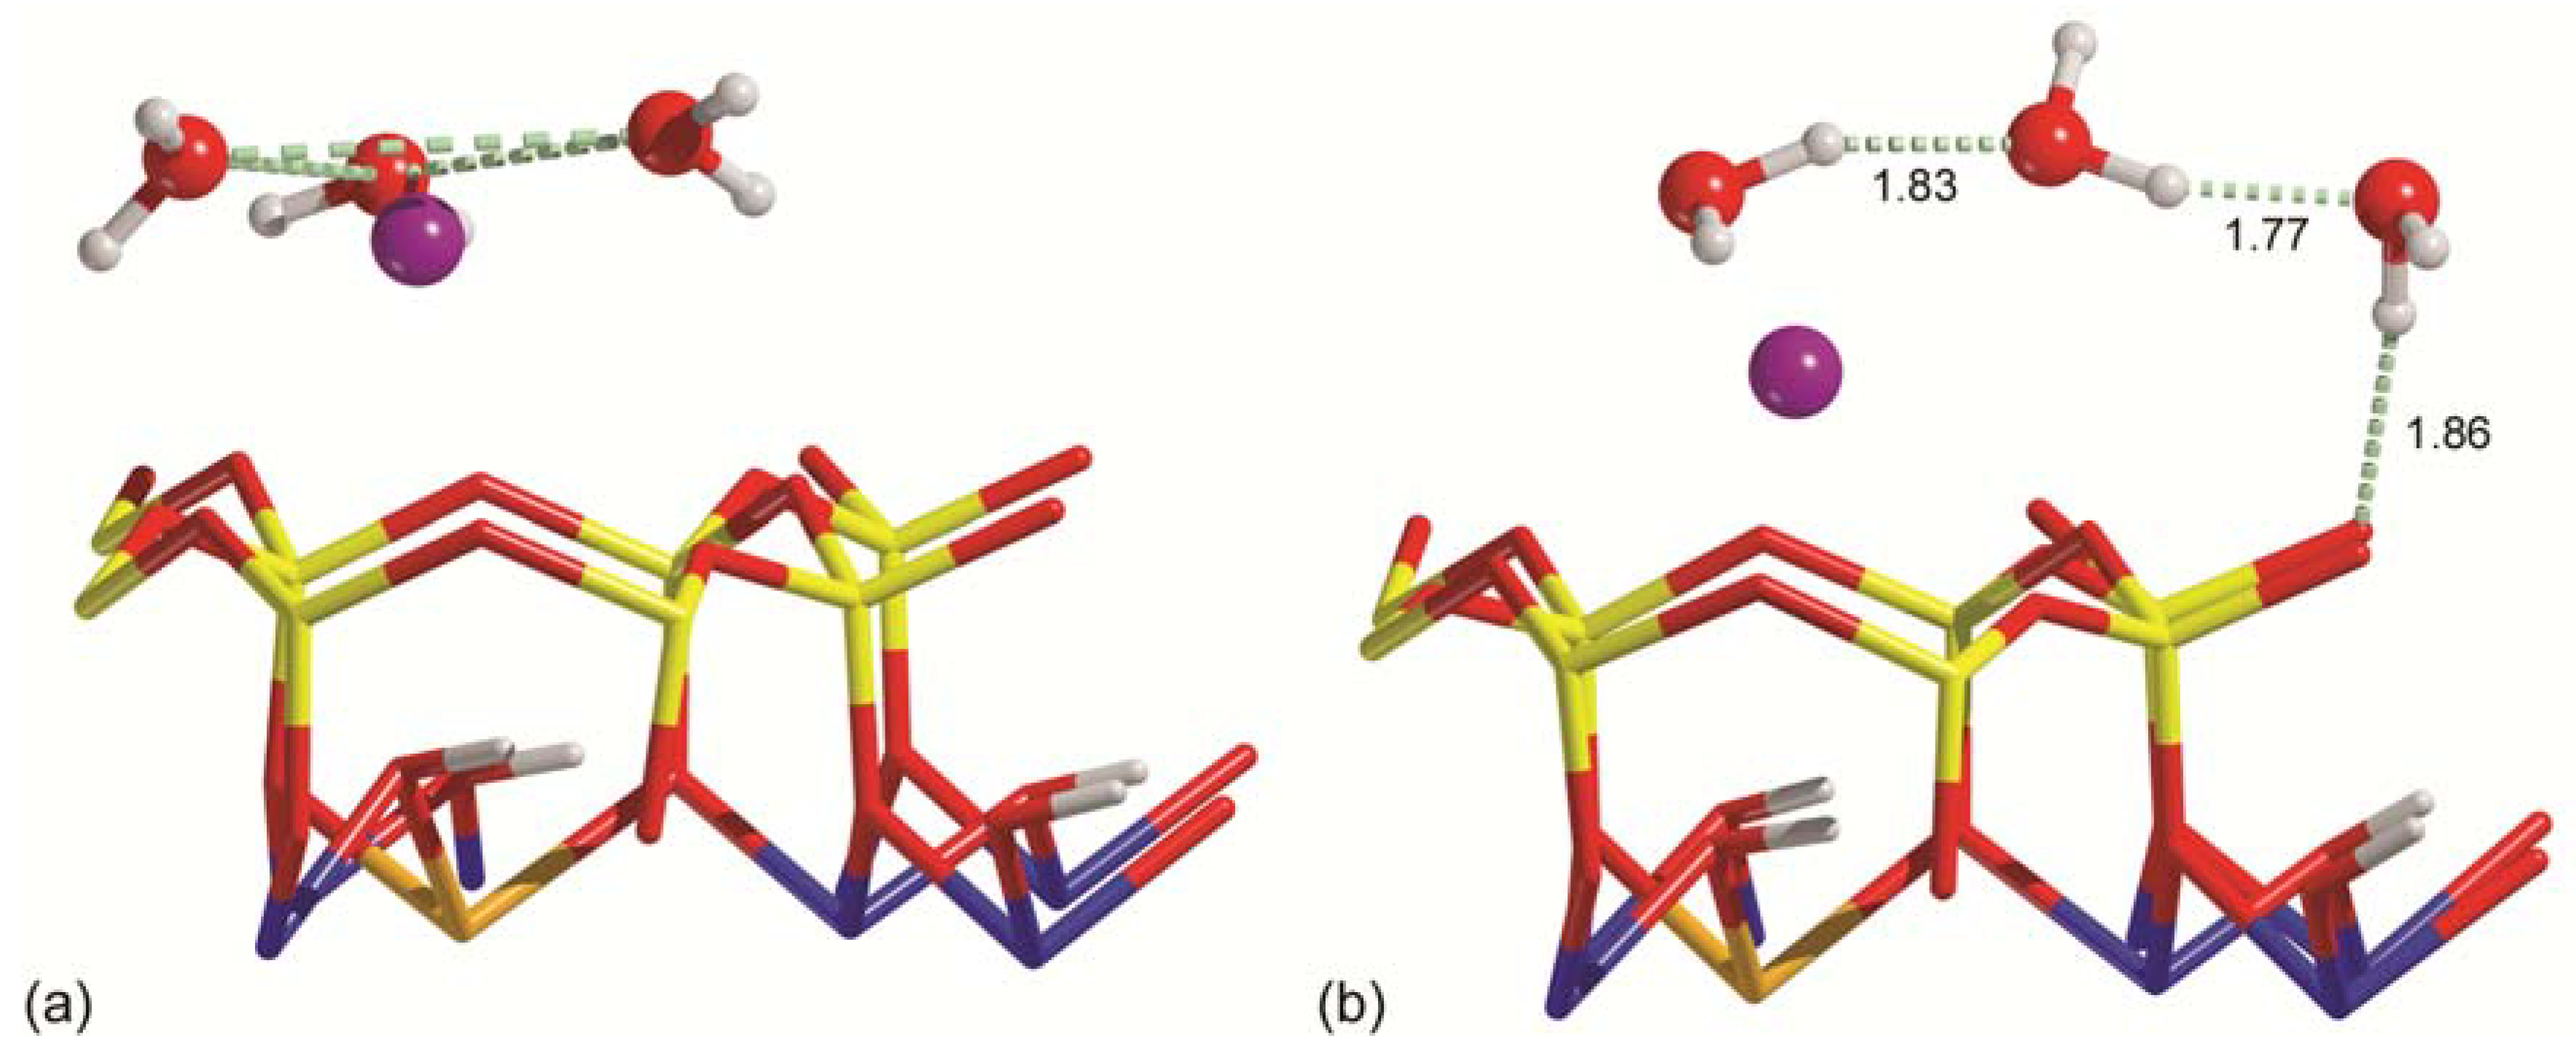
The inclusion of a third water molecule near the same adsorption site resulted in different configurations. On (001) in the Na-MMT-W3 system (Figure 4c,d), the molecules show a sign of self-assembly, preferred over water-to-slab interactions. In detail, the three H2O molecules create an almost triangular cluster, where each side has three atoms (O–H---O), and the hydrogen bonds between the water molecules are long, about 1.918 Å. This triangular cluster has its centre of mass, i.e., the average position of all the HW and OW atoms, weighted according to their masses, above the sodium cation. This cluster interacts with the Wyoming-type montmorillonite by three long-range HW---O(b) hydrogen bonds, with a mean distance of 2.307 Å. Given the observed conformation in the Na-MMT-W3 adsorption model, the binding energy per water molecule is well represented by the BE*C value, −44.60 kJ mol−1.
Regarding the Ca-MMT-W3 model, the most stable conformation of adsorbed water molecules is a chain-like structure that crosses the 2D periodic boundary of the model (a graphical representation is reported in Figure 4g,h). It is interesting that the first two H2O molecules are not significantly displaced by adding the third one, which interacts with a HW---O(b) hydrogen bond with the surface (1.928 Å) and another one with a water molecule OW–HW---OW (1.924 Å). The first two water molecules still display a long-range electrostatic interaction with Ca2+, with a mean distance of 2.483 Å. In this case, the classical definition of binding energy BEC is representative of the adsorption process, which is strongly favoured.
Finally, it can be observed that in the different montmorillonite models, the δES term non-linearly increases with higher water coverage, with the Ca-MMT energy being larger than that of Na-MMT. In this case, the deformation energy is mainly due to the upward movements of the Na+ and Ca2+ cations, whose z position increases with the water coverage. Compared to the dry montmorillonite models, the Na-MMT (Ca-MMT) cation is shifted by +0.104 Å (+0.050 Å), +0.295 Å (+0.199 Å), and +0.325 Å (+0.267 Å) when there are one, two, and three water molecules, respectively.
3.4. Ab Initio Molecular Dynamic Simulations
The starting geometries used to simulate the time evolution dynamic of the water on the clay mineral models are Na-MMT-W3 and Ca-MMT-W3. AIMD simulations were conducted only at the maximum considered coverage (3 × H2O) because of the observed differences in the water arrangements in static simulations, which required further investigation. The models with lower water contents were quite similar in their behaviour; hence, they were not considered at the moment for this kind of analysis. In order to simulate the dynamics of these models with QuantumATK, it was necessary to use a three-dimensional box (unit cell). The a and b lattice parameters were initially set as those calculated with CRYSTAL under static conditions, whereas a large c lattice parameter (20 Å) was chosen to reduce the interaction between the slab and its replicas along this axis. The mean temperatures (pressures) recorded during the 5000 fs production runs were 306.44 K (0.010 kbar) and 301.06 K (−0.018 kbar), respectively.
The dynamics of the adsorption of three water molecules on both the (001) montmorillonite models showed two general configurations of the adsorbates, which are in line with those observed in static conditions. In fact, the first conformation of H2O is the triangular cluster observed for (001) Na-MMT (Figure 5a), whereas the second one is the chain-like structure seen above Ca-MMT (Figure 5b). Thus, this result suggests that there are at least two possible energy minima related to the water conformation above the (001) clay mineral surfaces, in agreement with a previous theoretical suggestion made for the neutral 2:1 dioctahedral phyllosilicate (pyrophyllite) [78].
However, the stability of these two conformations differed depending on the type of cation (here Na+ or Ca2+) at the surface. During the 5 ps molecular dynamic run, the three water molecules on sodium montmorillonite were organized as a cluster for almost 90% of the time, and only for a small fraction of the simulation were they in the chain-like conformation. The opposite behaviour was observed for the Ca-MMT-W3 model, i.e., the water molecules preferred the chain-like conformation over the triangular cluster. These observations are in excellent agreement with the static results at the B3LYP-D* level previously discussed. In both cases, the triangular cluster to chain-like conformation transition, and vice versa, occurred during small fluctuations of temperature of the system; hence, it was driven by thermal energy. This is in line with the simulations performed by Zhang and co-workers [78], where a small energy barrier (about 3–10 kJ mol−1) between the two conformation was calculated by both quantum mechanical and classical mechanical methods for the hydration of the (001) surface of pyrophyllite.
It was also interesting to observe a different behaviour of the surface Mn+ cation: on sodic montmorillonite, during the 5 ps simulation, Na+ moved inside the SiO4 pseudo-hexagonal ring, suggesting that there may be a low energy barrier between different ion positions (local energy minima) inside the siloxane ring. Conversely, the calcium ion did not show these local minima and it was almost fixed above the centre of the cited pseudo-hexagonal SiO4 ring during the simulation. Generally, the sodium position was close to that theoretically described by Chatterjee and co-workers [27,32] under static conditions.
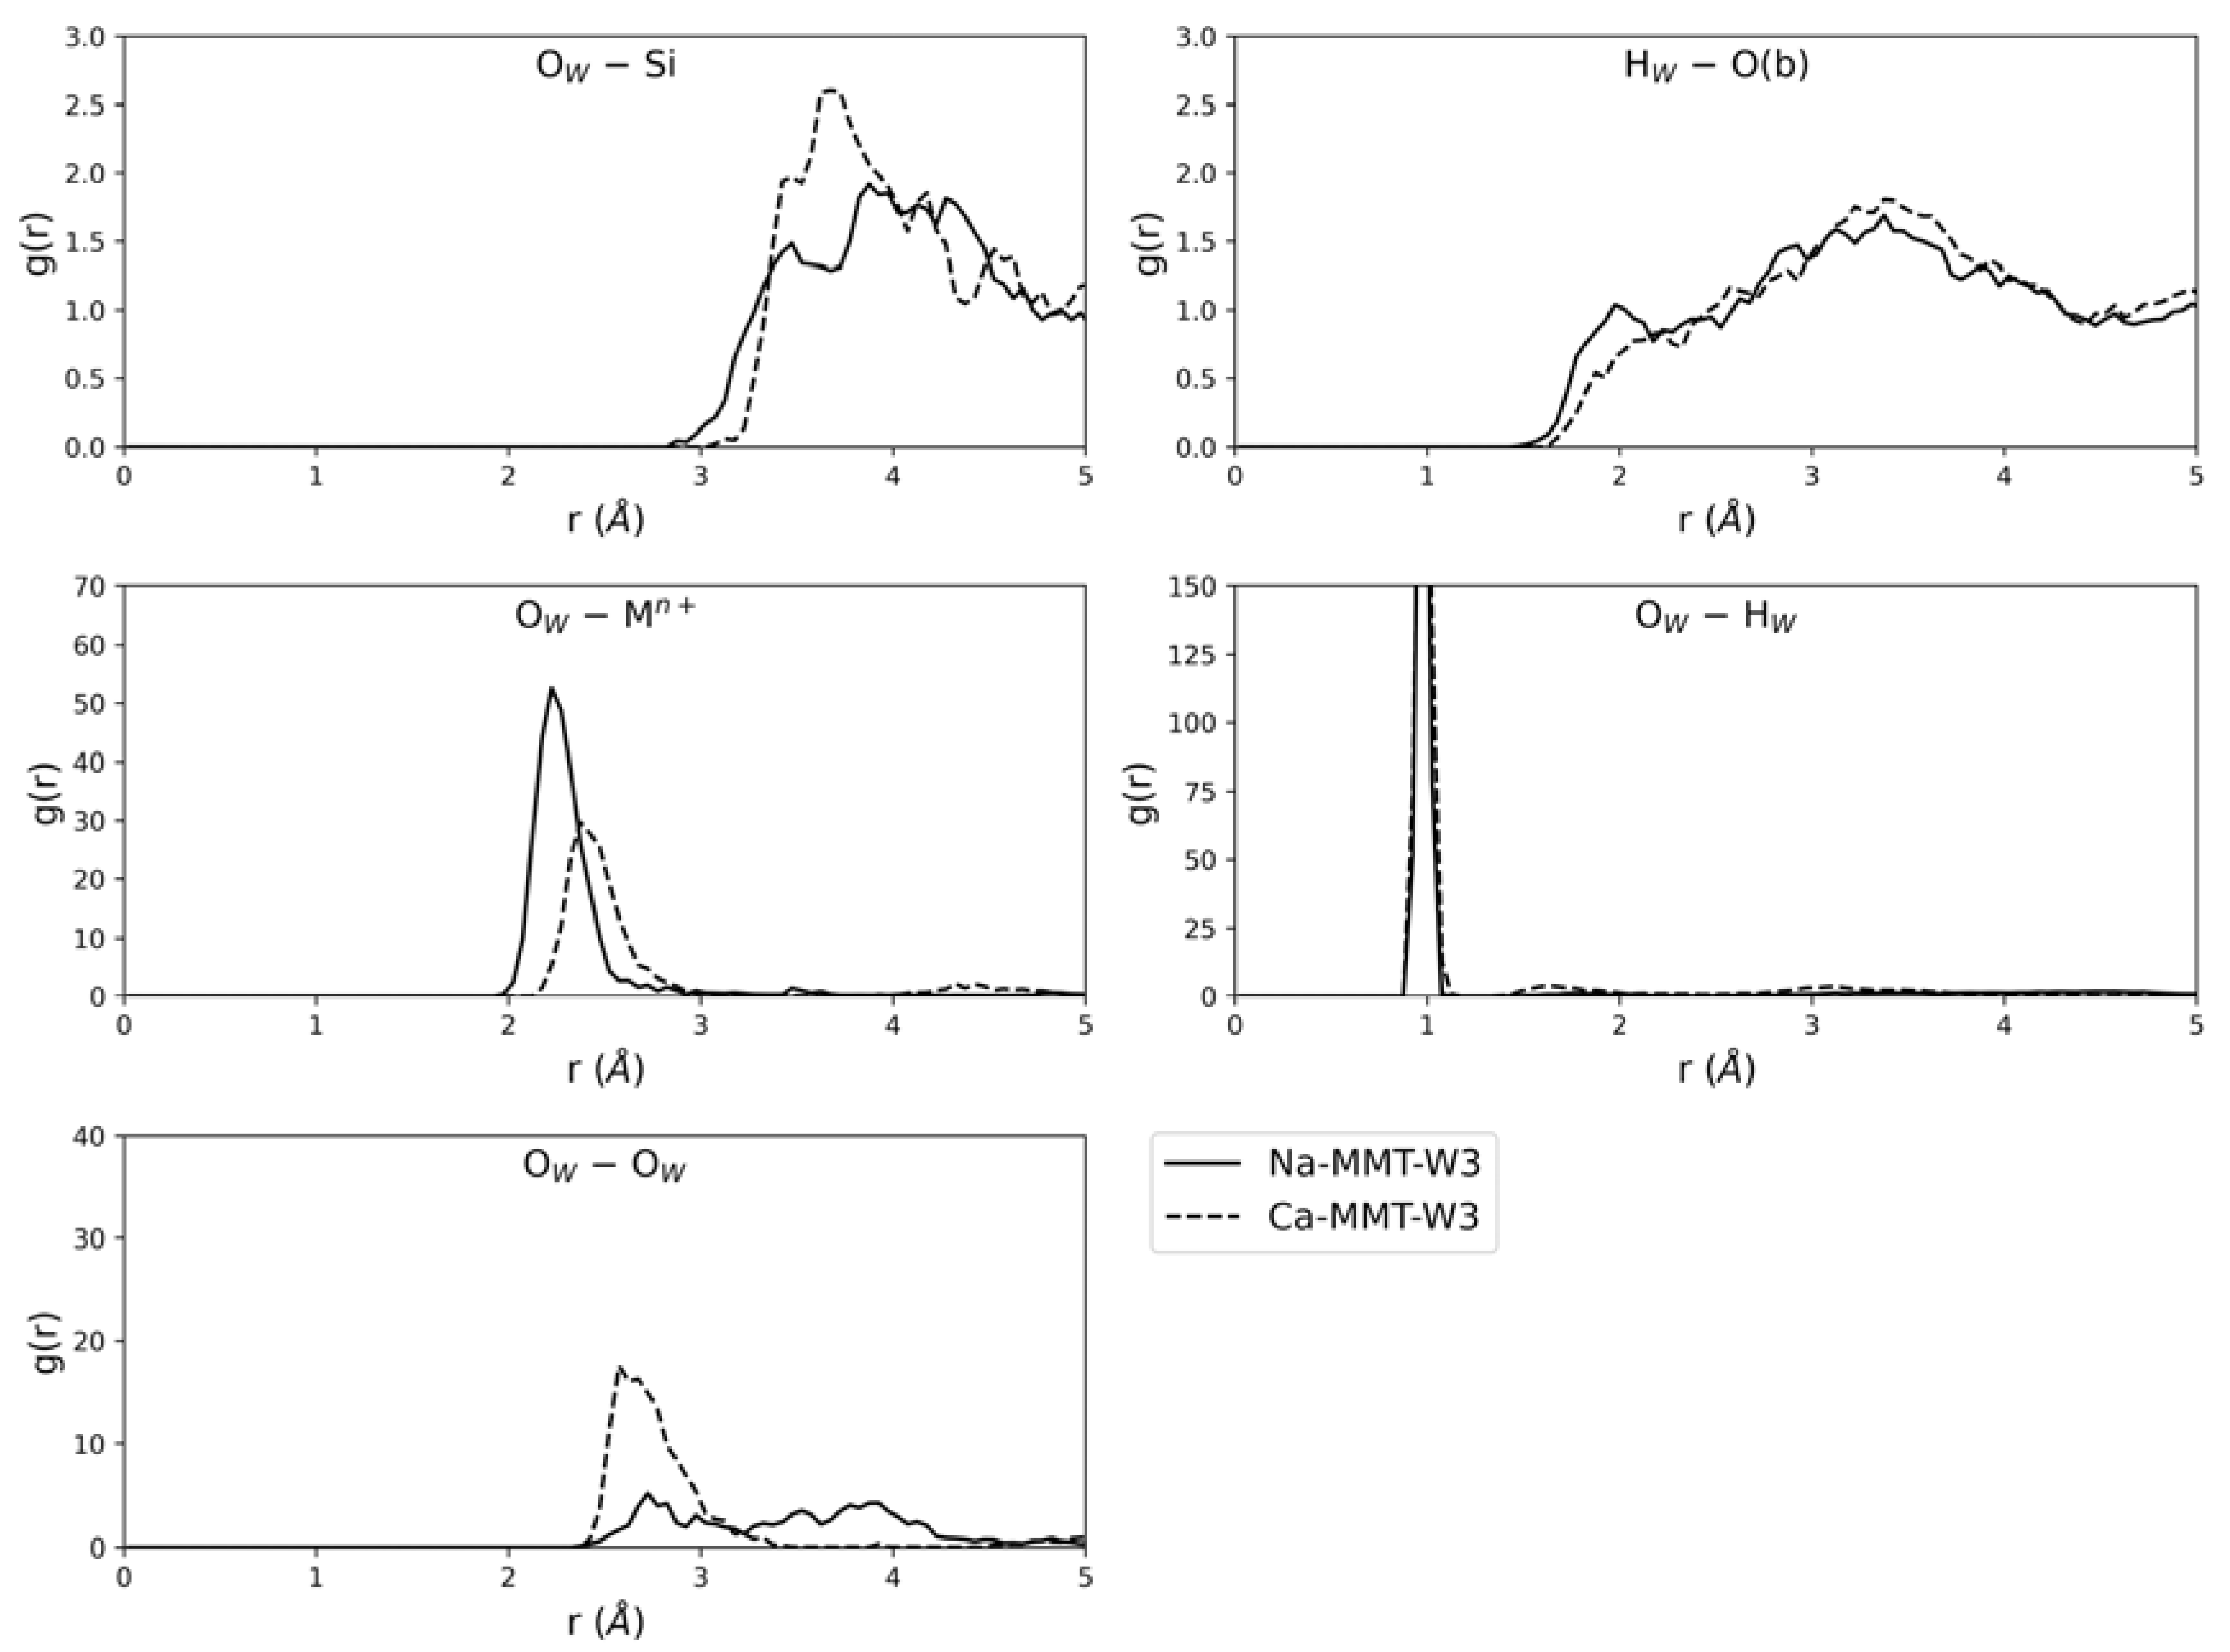
To further investigate the behaviour of water on the two (001) montmorillonite surfaces, the radial distribution functions (RDFs) of different atomic interactions between the adsorbate and the substrate were calculated and are graphically reported in Figure 6. The RDFs were calculated considering a cut-off radius (i.e., the maximum distance sampled from the centre of each atom) of 5.0 Å. No significant OW---Si interaction was established between the oxygen atom of water and the silicon ones of the two (001) montmorillonite models, because this long-range showed the first peak in the RDFs above 3 Å.
Regarding the Mn+ ion interaction with water, the (001) surfaces of sodium and calcium montmorillonites showed similar behaviour as the OW---Mn+ RDF, with a first broad peak at 2.2 Å and 2.4 Å, respectively, and a long tail related to the approach/removal of one water molecule at a time. Obviously, the different peak position is related to the different ionic radii of the cations.
The RDF-related interaction of water through its hydrogen atoms with the surface basal oxygen, HW---O(b), shows a first broad peak at about 2.0 Å for both montmorillonite (001) slab models, in agreement with the typical length of a hydrogen bond.
The OW–HW RDF shows a very sharp and intense peak centred at about 0.97 Å for each surface model, which is related to O–H covalent bonds within water molecules. Then, a second broader peak was centred at 1.81 Å and 1.63 Å for Na-MMT-W3 and Ca-MMT-W3, respectively: in this case, the calculated lengths are in agreement with those of typical hydrogen bonds.
The radial distribution function of the OW–OW interaction is in reasonable agreement with previous theoretical results on the water intercalation in M+-montmorillonites, obtained with both static and dynamic simulations [14,26]. In detail, there was a single significant peak at about 2.72 Å and 2.61 Å for Na-MMT-W3 and Ca-MMT-W3, respectively, a trend that follows the exposed positive charge at the (001) mineral surface.
4. Conclusions
The present work reports the adsorption behaviour of water on the (001) surface of montmorillonite, an important expandable phyllosilicate. In particular, for the first time, the behaviour of various water molecules was studied at the surface of Na- and Ca-montmorillonite, considering both electrostatic and long-range interactions. The results were obtained by ab initio Density Functional Theory simulations conducted under static conditions (0 K) and using molecular dynamics at room temperature (300 K) and a pressure of 1 bar. The hydration of the outer surface of the (001) slab models had a greater adsorption energy for Ca-MMT than for Na-MMT, meaning that the former was the most favoured surface for adsorption. This is related to the cationic charge exposed on the surface, which in turn influenced the computed electrostatic surface potential maps. It is possible to tune the affinity of the surface towards water by considering different isomorphic substitutions in the tetrahedral and/or in the octahedral sheets of dioctahedral clay minerals, which may result in cations with different valences exposed on the surface. The results reported are in good agreement with the ones available in literature and extend the knowledge on the hydration of the external surface of expandable clays at the quantum mechanical level, which could be of great use in applications of these types of minerals.
Finally, the use of quantum mechanical simulations with different approaches allows the investigation of surface phenomena by considering several properties, such as surface charge, electrostatic potential, time, and temperature, providing atomic-scale results that could be employed to predict the behaviour of smectite surfaces with tailored features. In this sense, the present study shows the utmost importance of including the contribution of long-range interactions in the determination of the simulation outcomes.
Author Contributions
Conceptualization, G.U., D.M. and G.V.; methodology, G.U.; validation, G.U., D.M. and G.V.; formal analysis, G.U., D.M. and G.V.; investigation, G.U., D.M. and G.V.; data curation, G.U.; writing—review and editing, G.U., D.M. and G.V.; visualization, G.U.; supervision, G.V. All authors have read and agreed to the published version of the manuscript.
Funding
This research received no external funding.
Data Availability Statement
The data presented in this study are available within the article.
Acknowledgments
The present work was supported by the Regione Emilia Romagna project PA2019-11452/RER to G.V.
Conflicts of Interest
The authors declare no conflict of interest.
References
- Velde, B. Introduction to Clay Minerals; Springer: Dordrecht, The Netherlands, 1992; p. 198. [Google Scholar]
- Madsen, F.T. Clay mineralogical investigations related to nuclear waste disposal. Clay Miner. 1998, 33, 109–129. [Google Scholar] [CrossRef]
- Lauzon, R.V. Colloid science resolves shale, formation-damage problems. Oil Gas J. 1984, 82, 175–179. [Google Scholar]
- Harvey, C.C.; Murray, H.H. Industrial clays in the 21st century: A perspective of exploration, technology and utilization. Appl. Clay Sci. 1997, 11, 285–310. [Google Scholar] [CrossRef]
- Murray, H.H. Traditional and new applications for kaolin, smectite, and palygorskite: A general overview. Appl. Clay Sci. 2000, 17, 207–221. [Google Scholar] [CrossRef]
- Hu, Y.; Jiang, H.; Wang, D. Electrokinetic behavior and flotation of kaolinite in CTAB solution. Miner. Eng. 2003, 16, 1221–1223. [Google Scholar] [CrossRef]
- Yin, X.; Gupta, V.; Du, H.; Wang, X.; Miller, J.D. Surface charge and wetting characteristics of layered silicate minerals. Adv. Colloid Interface Sci. 2012, 179–182, 43–50. [Google Scholar] [CrossRef]
- Di Leo, P.; Pizzigallo, M.D.R.; Ditaranto, N.; Terzano, R. Cadmium decontamination through ball milling using an expandable clay mineral. Appl. Clay Sci. 2019, 182, 105256. [Google Scholar] [CrossRef]
- Qin, C.; Yuan, X.; Xiong, T.; Tan, Y.Z.; Wang, H. Physicochemical properties, metal availability and bacterial community structure in heavy metal-polluted soil remediated by montmorillonite-based amendments. Chemosphere 2020, 261, 128010. [Google Scholar] [CrossRef]
- Wang, L.; Li, X.; Tsang, D.C.W.; Jin, F.; Hou, D. Green remediation of Cd and Hg contaminated soil using humic acid modified montmorillonite: Immobilization performance under accelerated ageing conditions. J. Hazard. Mater. 2020, 387, 122005. [Google Scholar] [CrossRef]
- Zhang, D.; Xu, Y.; Li, X.; Liu, Z.; Wang, L.; Lu, C.; He, X.; Ma, Y.; Zou, D. Immobilization of Cr(Vi) in soil using a montmorillonite-supported carboxymethyl cellulose-stabilized iron sulfide composite: Effectiveness and biotoxicity assessment. Int. J. Environ. Res. Public Health 2020, 17, 6087. [Google Scholar] [CrossRef]
- He, Q.; Zhu, R.; Chen, Q.; Zhu, Y.; Yang, Y.; Du, J.; Zhu, J.; He, H. One-pot synthesis of the reduced-charge montmorillonite via molten salts treatment. Appl. Clay Sci. 2020, 186, 105429. [Google Scholar] [CrossRef]
- Brigatti, M.F.; Mottana, A.; Malferrari, D.; Cibin, G. Crystal structure and chemical composition of Li-, Fe-, and Mn-rich micas. Am. Mineral. 2007, 92, 1395–1400. [Google Scholar] [CrossRef]
- Mignon, P.; Ugliengo, P.; Sodupe, M.; Hernandez, E.R. Ab initio molecular dynamics study of the hydration of Li+, Na+ and K+ in a montmorillonite model. Influence of isomorphic substitution. Phys. Chem. Chem. Phys. 2010, 12, 688–697. [Google Scholar] [CrossRef]
- Mignon, P.; Ugliengo, P.; Sodupe, M. Theoretical Study of the Adsorption of RNA/DNA Bases on the External Surfaces of Na+-Montmorillonite. J. Phys. Chem. C 2009, 113, 13741–13749. [Google Scholar] [CrossRef]
- Valdrè, G.; Antognozzi, M.; Wotherspoon, A.; Miles, M.J. Influence of properties of layered silicate minerals on adsorbed DNA surface affinity, self-assembly and nanopatterning. Phil. Mag. Lett. 2004, 84, 539–545. [Google Scholar] [CrossRef]
- Valdrè, G. Atomic force microscopy observation of agglomerates, ordered structures and filaments after deposition of DNA nucleotides onto layer silicate mineral surfaces. Scanning 2005, 27, 100–101. [Google Scholar]
- Pignataro, M.; Di Rocco, G.; Lancellotti, L.; Bernini, F.; Subramanian, K.; Castellini, E.; Bortolotti, C.A.; Malferrari, D.; Moro, D.; Valdrè, G.; et al. Phosphorylated cofilin-2 is more prone to oxidative modifications on Cys39 and favors amyloid fibril formation. Redox Biol. 2020, 37, 101691. [Google Scholar] [CrossRef]
- Moro, D.; Ulian, G.; Valdrè, G. Single molecule investigation of glycine-chlorite interaction by cross-correlated scanning probe microscopy and quantum mechanics simulations. Langmuir ACS J. Surf. Colloids 2015, 31, 4453–4463. [Google Scholar] [CrossRef]
- Moro, D.; Ulian, G.; Valdrè, G. Nano-atomic scale hydrophobic/philic confinement of peptides on mineral surfaces by cross-correlated SPM and quantum mechanical DFT analysis. J. Microsc. 2020, 280, 204–221. [Google Scholar] [CrossRef]
- Moro, D.; Ulian, G.; Valdrè, G. Nanoscale oligopeptide adsorption behaviour on chlorite as revealed by scanning probe microscopy and density functional simulations. Appl. Clay Sci. 2020, 197, 105777. [Google Scholar] [CrossRef]
- Moro, D.; Ulian, G.; Valdrè, G. Amino acids-clay interaction at the nano-atomic scale: The L-alanine-chlorite system. Appl. Clay Sci. 2019, 172, 28–39. [Google Scholar] [CrossRef]
- Valdrè, G.; Tosoni, S.; Moro, D. Zeolitic-type ‘Bronsted-Lowry sites distribution imaged on clinochlore. Am. Mineral. 2011, 96, 1461–1466. [Google Scholar] [CrossRef]
- Hazen, R.M. Chance, necessity and the origins of life: A physical sciences perspectivea. Philos. T R Soc. A 2017, 375, 20160353. [Google Scholar] [CrossRef] [Green Version]
- Lambert, J.F. Adsorption and polymerization of amino acids on mineral surfaces: A review. Orig. Life Evol. Biosph. 2008, 38, 211–242. [Google Scholar] [CrossRef] [PubMed]
- Berghout, A.; Tunega, D.; Zaoui, A. Density functional theory (dft) study of the hydration steps of Na+/Mg2+/Ca2+/Sr2+/Ba2+-exchanged montmorillonites. Clays Clay Miner. 2010, 58, 174–187. [Google Scholar] [CrossRef]
- Chatterjee, A.; Iwasaki, T.; Ebina, T.; Miyamoto, A. A DFT study on clay-cation-water interaction in montmorillonite and beidellite. Comput. Mater. Sci. 1999, 14, 119–124. [Google Scholar] [CrossRef]
- Churakov, S.V. Mobility of Na and Cs on Montmorillonite Surface under Partially Saturated Conditions. Environ. Sci Technol 2013, 47, 9816–9823. [Google Scholar] [CrossRef]
- Fonseca, C.G.; Vaiss, V.S.; Wypych, F.; Diniz, R.; Leitão, A.A. Structural and thermodynamic investigation of the hydration-dehydration process of Na+-Montmorillonite using DFT calculations. Appl. Clay Sci. 2017, 143, 212–219. [Google Scholar] [CrossRef]
- Peng, C.; Min, F.; Liu, L.; Chen, J. A periodic DFT study of adsorption of water on sodium-montmorillonite (001) basal and (010) edge surface. Appl. Surf. Sci 2016, 387, 308–316. [Google Scholar] [CrossRef]
- Yang, G.; Neretnieks, I.; Holmboe, M. Atomistic simulations of cation hydration in sodium and calcium montmorillonite nanopores. J. Chem. Phys. 2017, 147, 084705. [Google Scholar] [CrossRef]
- Chatterjee, A.; Iwasaki, T.; Ebina, T.; Hayashi, H. Quantum chemical calculation on clay-water interface. Appl. Surf. Sci. 1997, 121–122, 167–170. [Google Scholar] [CrossRef]
- Chatterjee, A. Application of localized reactivity index in combination with periodic DFT calculation to rationalize the swelling mechanism of clay type inorganic material. J. Chem. Sci. 2005, 117, 533–539. [Google Scholar] [CrossRef]
- Pirillo, S.; Luna, C.R.; López-Corral, I.; Juan, A.; Avena, M.J. Geometrical and Electronic Properties of Hydrated Sodium Montmorillonite and Tetracycline Montmorillonite from DFT Calculations. J. Phys. Chem. C 2015, 119, 16082–16088. [Google Scholar] [CrossRef]
- Martins, D.M.S.; Molinari, M.; Gonc¸alves, M.A.; Mirão, J.P.; Parker, S.C. Toward modeling clay mineral nanoparticles: The edge surfaces of pyrophyllite and their interaction with water. J. Phys. Chem. C 2014, 118, 27308–27317. [Google Scholar] [CrossRef]
- Bailey, S.W. Summary of recommendations of AIPEA nomenclature committee. Clay Miner. 1980, 15, 85–93. [Google Scholar] [CrossRef]
- Hernández-Laguna, A.; Escamilla-Roa, E.; Timón, V.; Dove, M.T.; Sainz-Díaz, C.I. DFT study of the cation arrangements in the octahedral and tetrahedral sheets of dioctahedral 2:1 phyllosilicates. Phys. Chem. Miner. 2006, 33, 655–666. [Google Scholar] [CrossRef]
- Ulian, G.; Valdrè, G. Structural, vibrational and thermophysical properties of pyrophyllite by semi-empirical density functional modelling. Phys. Chem. Miner. 2015, 42, 609–627. [Google Scholar] [CrossRef]
- Skipper, N.T.; Chang, F.R.C.; Sposito, G. Monte Carlo simulation of interlayer molecular structure in swelling clay minerals. 1. Methodology. Clays Clay Miner. 1995, 43, 285–293. [Google Scholar] [CrossRef]
- Dovesi, R.; Erba, A.; Orlando, R.; Zicovich-Wilson, C.M.; Civalleri, B.; Maschio, L.; Rerat, M.; Casassa, S.; Baima, J.; Salustro, S.; et al. Quantum-mechanical condensed matter simulations with CRYSTAL. Wires Comput. Mol. Sci. 2018, 8, E1360. [Google Scholar] [CrossRef]
- Becke, A.D. Density-Functional Thermochemistry.3. The Role of Exact Exchange. J. Chem. Phys. 1993, 98, 5648–5652. [Google Scholar] [CrossRef] [Green Version]
- Lee, C.T.; Yang, W.T.; Parr, R.G. Development of the Colle-Salvetti Correlation-Energy Formula into a Functional of the Electron-Density. Phys. Rev. B 1988, 37, 785–789. [Google Scholar] [CrossRef] [PubMed] [Green Version]
- Grimme, S. Semiempirical GGA-type density functional constructed with a long-range dispersion correction. J. Comput. Chem. 2006, 27, 1787–1799. [Google Scholar] [CrossRef] [PubMed]
- Civalleri, B.; Zicovich-Wilson, C.M.; Valenzano, L.; Ugliengo, P. B3LYP augmented with an empirical dispersion term (B3LYP-D*) as applied to molecular crystals. CrystEngComm 2008, 10, 405–410. [Google Scholar] [CrossRef]
- Monkhorst, H.J.; Pack, J.D. Special points for Brillouin-zone integrations. Phys. Rev. B 1976, 8, 5188–5192. [Google Scholar] [CrossRef]
- Moro, D.; Ulian, G.; Valdre, G. 3D meso-nanostructures in cleaved and nanolithographed Mg-Al-hydroxysilicate (clinochlore): Topology, crystal-chemistry, and surface properties. Appl. Clay Sci. 2019, 169, 74–80. [Google Scholar] [CrossRef]
- Ulian, G.; Moro, D.; Valdrè, G. First principle investigation of the mechanical properties of natural layered nanocomposite: Clinochlore as a model system for heterodesmic structures. Compos. Struct. 2018, 202, 551–558. [Google Scholar] [CrossRef]
- Ulian, G.; Tosoni, S.; Valdrè, G. Comparison between Gaussian-type orbitals and plane wave ab initio density functional theory modeling of layer silicates: Talc Mg3Si4O10(OH)2 as model system. J. Chem. Phys. 2013, 139, 204101. [Google Scholar] [CrossRef] [PubMed]
- Ulian, G.; Tosoni, S.; Valdrè, G. The compressional behaviour and the mechanical properties of talc [Mg3Si4O10(OH)2]: A density functional theory investigation. Phys. Chem. Miner. 2014, 41, 639–650. [Google Scholar] [CrossRef]
- Ulian, G.; Valdrè, G. Density functional investigation of the thermo-physical and thermo-chemical properties of 2M(1) muscovite. Am. Mineral. 2015, 100, 935–944. [Google Scholar] [CrossRef]
- Ulian, G.; Valdrè, G. Density functional investigation of the thermophysical and thermochemical properties of talc Mg3Si4O10(OH)2. Phys. Chem. Miner. 2015, 42, 151–162. [Google Scholar] [CrossRef]
- Ulian, G.; Valdrè, G. Equation of state and second-order elastic constants of portlandite Ca(OH)2 and brucite Mg(OH)2. Phys. Chem. Miner. 2019, 46, 101–117. [Google Scholar] [CrossRef]
- Ulian, G.; Moro, D.; Valdrè, G. Infrared and Raman spectroscopic features of clinochlore Mg6Si4O10(OH)8: A density functional theory contribution. Appl. Clay Sci. 2020, 197, 105779. [Google Scholar] [CrossRef]
- Nada, R.; Nicholas, J.B.; McCarthy, M.I.; Hess, A.C. Basis sets for ab initio periodic Hartree-Fock studies of zeolite/adsorbate interactions: He, Ne, and Ar in silica sodalite. Int. J. Quantum Chem. 1996, 60, 809–820. [Google Scholar] [CrossRef]
- Catti, M.; Valerio, G.; Dovesi, R.; Causa, M. Quantum-mechanical calculation of the solid-state equilibrium MgO + alpha-Al2O3 MgAl2O4 (spinel) versus pressure. Phys. Rev. B 1994, 49, 14179–14187. [Google Scholar] [CrossRef] [PubMed]
- Valenzano, L.; Torres, F.J.; Klaus, D.; Pascale, F.; Zicovich-Wilson, C.M.; Dovesi, R. Ab initio study of the vibrational spectrum and related properties of crystalline compounds; the case of CaCO3 calcite. Z Phys. Chem 2006, 220, 893–912. [Google Scholar] [CrossRef]
- Gatti, C.; Saunders, V.R.; Roetti, C. Crystal-field effects on the topological properties of the electron-density in molecular-crystals - the case of urea. J. Chem. Phys. 1994, 101, 10686–10696. [Google Scholar] [CrossRef]
- Valenzano, L.; Noel, Y.; Orlando, R.; Zicovich-Wilson, C.M.; Ferrero, M.; Dovesi, R. Ab initio vibrational spectra and dielectric properties of carbonates: Magnesite, calcite and dolomite. Theor. Chem. Acc. 2007, 117, 991–1000. [Google Scholar] [CrossRef]
- Dovesi, R.; Roetti, C.; Freyria Fava, C.; Prencipe, M.; Saunders, V.R. On the elastic properties of lithium, sodium an potassium oxide. An ab initio study. Chem. Phys. 1991, 156, 11–19. [Google Scholar] [CrossRef]
- Ulian, G.; Moro, D.; Valdrè, G. Probing the interaction of (001) carbonated hydroxylapatite surfaces with water: A density functional investigation. Micro. Nano Lett. 2018, 13, 4–8. [Google Scholar] [CrossRef]
- Ulian, G.; Valdrè, G. Effect of mechanical stress on the Raman and Infrared bands of hydroxylapatite: A quantum mechanical first principle investigation. J. Mech. Behav. Biomed. Mater. 2018, 77, 683–692. [Google Scholar] [CrossRef] [PubMed]
- Ulian, G.; Valdre, G. Equation of state of hexagonal hydroxylapatite (P6(3)) as obtained from density functional theory simulations. Int. J. Quantum Chem. 2018, 118, e25553. [Google Scholar] [CrossRef]
- Ulian, G.; Valdrè, G. First principle investigation of the thermomechanical properties of type A carbonated apatite. Int. J. Quantum Chem. 2019, 120, e26069. [Google Scholar] [CrossRef]
- Schlegel, H.B. Optimization of equilibrium geometries and transition structures. J. Comput. Chem. 1982, 3, 214–218. [Google Scholar] [CrossRef]
- Chiatti, F.; Delle Piane, M.; Ugliengo, P.; Corno, M. Water at hydroxyapatite surfaces: The effect of coverage and surface termination as investigated by all-electron B3LYP-D* simulations. Theor. Chem. Acc. 2016, 135, 54. [Google Scholar] [CrossRef]
- Corno, M.; Busco, C.; Bolis, V.; Tosoni, S.; Ugliengo, P. Water Adsorption on the Stoichiometric (001) and (010) Surfaces of Hydroxyapatite: A Periodic B3LYP Study. Langmuir 2009, 25, 2188–2198. [Google Scholar] [CrossRef] [PubMed]
- Boys, S.F.; Bernardi, F. The calculation of small molecular interactions by the differences of separate total energies. Some procedures with reduced errors. Mol. Phys. 1970, 19, 553–566. [Google Scholar] [CrossRef]
- Smidstrup, S.; Markussen, T.; Vancraeyveld, P.; Wellendorff, J.; Schneider, J.; Gunst, T.; Verstichel, B.; Stradi, D.; Khomyakov, P.A.; Vej-Hansen, U.G.; et al. QuantumATK: An integrated platform of electronic and atomic-scale modelling tools. J. Phys. Condens. Matter 2020, 32, 015901. [Google Scholar] [CrossRef] [PubMed]
- Smidstrup, S.; Stradi, D.; Wellendorff, J.; Khomyakov, P.A.; Vej-Hansen, U.G.; Lee, M.E.; Ghosh, T.; Jonsson, E.; Jonsson, H.; Stokbro, K. First-principles Green’s-function method for surface calculations: A pseudopotential localized basis set approach. Phys. Rev. B 2017, 96, 195309. [Google Scholar] [CrossRef] [Green Version]
- Perdew, J.P.; Burke, K.; Ernzerhof, M. Generalized gradient approximation made simple. Phys. Rev. Lett. 1996, 77, 3865–3868. [Google Scholar] [CrossRef] [Green Version]
- Fuchs, M.; Scheffler, M. Ab initio pseudopotentials for electronic structure calculations of poly-atomic systems using density-functional theory. Comput. Phys. Commun. 1999, 119, 67–98. [Google Scholar] [CrossRef] [Green Version]
- Martyna, G.J.; Klein, M.L.; Tuckerman, M. Nose-Hoover chains: The canonical ensemble via continuous dynamics. J. Chem. Phys. 1992, 97, 2635–2643. [Google Scholar] [CrossRef]
- Martyna, G.J.; Tobias, D.J.; Klein, M.L. Constant-Pressure Molecular-Dynamics Algorithms. J. Chem. Phys. 1994, 101, 4177–4189. [Google Scholar] [CrossRef]
- Belzunces, B.; Hoyau, S.; Benoit, M.; Tarrat, N.; Bessac, F. Theoretical study of the atrazine pesticide interaction with pyrophyllite and Ca2+-montmorillonite clay surfaces. J. Comput. Chem. 2017, 38, 133–143. [Google Scholar] [CrossRef] [PubMed]
- Belzunces, B.; Hoyau, S.; Bessac, F. Interaction of Metamitron and Fenhexamid with Ca 2+-Montmorillonite Clay Surfaces: A Density Functional Theory Molecular Dynamics Study. J. Comput. Chem. 2019, 40, 1449–1462. [Google Scholar] [CrossRef] [PubMed]
- Tsipursky, S.I.; Drits, V.A. The distribution of octahedral cations in the 2:1 layers of dioctahedral smectites studied by oblique-texture electron diffraction. Clay Miner. 1984, 19, 177–193. [Google Scholar] [CrossRef]
- Bruno, M.; Prencipe, M.; Valdrè, G. Ab initio quantum-mechanical modeling of pyrophyllite Al2Si4O10(OH)2 and talc Mg3Si4O10(OH)2 surfaces. Phys. Chem. Miner. 2006, 33, 63–71. [Google Scholar] [CrossRef]
- Zhang, G.; Al-Saidi, W.A.; Myshakin, E.M.; Jordan, K.D. Dispersion-corrected density functional theory and classical force field calculations of water loading on a pyrophyllite(001) surface. J. Phys. Chem. C 2012, 116, 17134–17141. [Google Scholar] [CrossRef]
Figure 1.
Views along the [010] and [001] directions of the different surface models employed in the present work, (a) sodium (Na-MMT) and (b) calcium montmorillonite (Ca-MMT). The bidimensional unit cell of the surface models is represented with black lines. Silicon, aluminium, magnesium, sodium, calcium, oxygen, and hydrogen atoms are coloured in yellow, blue, orange, purple, dark cyan, red, and white, respectively. O(b), O(a), and O(h) are basal, apical, and hydroxyl oxygen atoms, respectively.

Figure 2.
Three-dimensional electrostatic surface potential (ESP) maps (left–top slab surface, right–bottom slab) of (a) Na-MMT and (b) Ca-MMT; a ball-and-stick representation of the surfacial atoms of the slab is also superimposed. For the sake of clarity, a 2 × 2 repetition of the electrostatic surface potential (ESP) is reported. Silicon, magnesium, sodium, calcium, oxygen, and hydrogen atoms are coloured in yellow, orange, purple, dark cyan, red, and white, respectively. Octahedrally-coordinated aluminium atoms are represented as a grey network.

Figure 3.
Unit cell views of the single water molecule adsorption on the top surface of (a) Na-MMT and on (b) Ca-MMT and on the bottom surface of the (c) sodium and (d) calcium montmorillonite models. Specific distances between water and slab atoms are reported in Å. To facilitate the readability of the image, ball-and-stick models were employed for water and slab substituents, whereas the slab surface was represented as wireframe. Silicon, magnesium, sodium, calcium, oxygen and hydrogen atoms are coloured in yellow, orange, purple, dark cyan, red and white.

Figure 4.
Unit cell views of the interaction of water on Na-MMT (top surface) (a–d) and on Ca-MMT (top surface) (e–h), at increasing water coverage. Panels (a,b,e,f) are related to two water molecules on the slab model, whereas panels (c,d,g,h) refer to three water molecule adsorption. The views in panels (a,c,e,g) and (b,d,f,h) are along the [001] and [100] directions, respectively. Specific distances between water and slab atoms are reported in Å. To facilitate the readability of the image, ball-and-stick models were employed for water and slab substituents, whereas the slab surface was represented as a wireframe. Silicon, magnesium, sodium, calcium, oxygen, and hydrogen atoms are coloured in yellow, orange, purple, dark cyan, red, and white, respectively. Light green, dashed lines are hydrogen bonds.

Figure 5.
Snapshots of AIMD simulations for the Na-MMT-W3 system, where triangular cluster (a) and chain-like (b) conformations were observed. In (a) the dashed light green lines are just a guide for the eye to better highlight the triangular cluster formed by the three water molecules. In (b) the same kind of lines are hydrogen bonds with the distances expressed in Å. Silicon, magnesium, sodium, oxygen, and hydrogen atoms are coloured in yellow, orange, purple, red, and white, respectively.

Figure 6.
Radial distribution functions (RDFs) calculated for different atomic interactions: OW–Si, HW–O(b), OW–Mn+, OW–HW and OW–OW.
Figure 6.
Radial distribution functions (RDFs) calculated for different atomic interactions: OW–Si, HW–O(b), OW–Mn+, OW–HW and OW–OW.


Table 1.
Geometrical features of the bidimensional slab models used in the present work: lattice parameters a, b (in Å) and γ (in degrees), surface area (in Å2), mean bond lengths (in Å), and angles (in degrees).
Table 1.
Geometrical features of the bidimensional slab models used in the present work: lattice parameters a, b (in Å) and γ (in degrees), surface area (in Å2), mean bond lengths (in Å), and angles (in degrees).
| Na-MMT | Ca-MMT | |
|---|---|---|
| a | 10.3986 | 10.4428 |
| b | 9.0245 | 9.0596 |
| γ | 90.23 | 90.12 |
| Area | 93.841 | 94.608 |
| Si–O(b) | 1.6261 | 1.6325 |
| Si–O(a) | 1.6403 | 1.6334 |
| Al–O(a) | 1.9362 | 1.9436 |
| Al–O(h) | 1.9000 | 1.9010 |
| Mg–O(a) | 2.0621 | 2.0525 |
| Mg–O(h) | 2.0611 | 2.1123 |
| O(b)–Si–O(b) | 108.53 | 107.80 |
| O(a)–S–O(b) | 109.61 | 110.96 |
| O(a)–Al–O(a) | 79.00 | 79.46 |
| 93.76 | 93.36 | |
| 166.74 | 167.18 | |
| O(a)–Al–O(h) | 94.50 | 94.47 |
| 168.97 | 170.49 | |
| O(h)–Al–O(h) | 78.89 | 80.38 |
| O(a)–Mg–O(a) | 75.44 | 78.99 |
| 95.633 | 94.33 | |
| 165.82 | 169.98 | |
| O(a)–Mg–O(h) | 95.13 | 94.23 |
| 168.50 | 168.10 | |
| O(h)–Mg–O(h) | 76.29 | 75.73 |
Table 2.
Binding energies BEC (in kJ mol−1 per water molecule) calculated at the B3LYP-D* level of theory corrected for the basis set superposition error, together with the different energy contributions as a function of increasing coverage and (001) surface slab model (see Materials and Methods for details).
| δEW | ΔEW | ΔEL | ΔELC | δES | BE* | BE*C | BE | BEC | BSSE | |
|---|---|---|---|---|---|---|---|---|---|---|
| Na-MMT-W1T | −0.71 | 0.05 | −0.76 | −0.76 | 1.87 | −68.83 | −61.74 | −67.67 | −60.58 | 7.09 |
| Na-MMT-W1B | 0.19 | 0.01 | 0.18 | 0.18 | 1.32 | −25.72 | −18.15 | −24.22 | −16.65 | 7.57 |
| Ca-MMT-W1T | −0.31 | 0.19 | −0.50 | −0.50 | 3.31 | −95.50 | −86.97 | −92.50 | −83.97 | 8.52 |
| Ca-MMT-W1B | −0.02 | 0.00 | −0.02 | −0.02 | 1.54 | −24.12 | −16.42 | −22.61 | −14.90 | 7.71 |
| Na-MMT-W2 | 1.67 | 0.10 | 0.91 | 1.57 | 4.79 | −63.67 | −56.71 | −57.86 | −49.90 | 7.96 |
| Ca-MMT-W2 | 0.00 | 0.43 | 1.49 | 2.30 | 8.72 | −90.37 | −81.79 | −79.73 | −69.10 | 10.63 |
| Na-MMT-W3 | −14.02 | 0.50 | −16.41 | −14.52 | 4.43 | −50.65 | −44.60 | −62.13 | −53.94 | 8.19 |
| Ca-MMT-W3 | 0.58 | 1.00 | −9.18 | −0.42 | 10.31 | −81.14 | −74.27 | −79.01 | −71.21 | 7.80 |
Publisher’s Note: MDPI stays neutral with regard to jurisdictional claims in published maps and institutional affiliations. |
© 2021 by the authors. Licensee MDPI, Basel, Switzerland. This article is an open access article distributed under the terms and conditions of the Creative Commons Attribution (CC BY) license (https://creativecommons.org/licenses/by/4.0/).
Share and Cite
MDPI and ACS Style
Ulian, G.; Moro, D.; Valdrè, G. DFT Simulation of the Water Molecule Interaction with the (00l) Surface of Montmorillonite. Minerals 2021, 11, 501. https://doi.org/10.3390/min11050501
AMA Style
Ulian G, Moro D, Valdrè G. DFT Simulation of the Water Molecule Interaction with the (00l) Surface of Montmorillonite. Minerals. 2021; 11(5):501. https://doi.org/10.3390/min11050501
Chicago/Turabian StyleUlian, Gianfranco, Daniele Moro, and Giovanni Valdrè. 2021. "DFT Simulation of the Water Molecule Interaction with the (00l) Surface of Montmorillonite" Minerals 11, no. 5: 501. https://doi.org/10.3390/min11050501
Note that from the first issue of 2016, this journal uses article numbers instead of page numbers. See further details here.