Memory-Efficient Deep Learning for Botnet Attack Detection in IoT Networks
by
 , , and
Segun I. Popoola
1 ,
,
Bamidele Adebisi
1,*,
Ruth Ande
1,
Mohammad Hammoudeh
2 and
and
Aderemi A. Atayero
3 1
Department of Engineering, Manchester Metropolitan University, Manchester M1 5GD, UK
2
Department of Computing and Mathematics, Manchester Metropolitan University, Manchester M1 5GD, UK
3
Department of Electrical and Information Engineering, Covenant University, Ota P.M.B. 1023, Nigeria
*
Author to whom correspondence should be addressed.
Electronics 2021, 10(9), 1104; https://doi.org/10.3390/electronics10091104
Submission received: 1 April 2021
/
Revised: 29 April 2021
/
Accepted: 1 May 2021
/
Published: 8 May 2021
(This article belongs to the Section Networks)
Abstract
:Cyber attackers exploit a network of compromised computing devices, known as a botnet, to attack Internet-of-Things (IoT) networks. Recent research works have recommended the use of Deep Recurrent Neural Network (DRNN) for botnet attack detection in IoT networks. However, for high feature dimensionality in the training data, high network bandwidth and a large memory space will be needed to transmit and store the data, respectively in IoT back-end server or cloud platform for Deep Learning (DL). Furthermore, given highly imbalanced network traffic data, the DRNN model produces low classification performance in minority classes. In this paper, we exploit the joint advantages of Long Short-Term Memory Autoencoder (LAE), Synthetic Minority Oversampling Technique (SMOTE), and DRNN to develop a memory-efficient DL method, named LS-DRNN. The effectiveness of this method is evaluated with the Bot-IoT dataset. Results show that the LAE method reduced the dimensionality of network traffic features in the training set from 37 to 10, and this consequently reduced the memory space required for data storage by . SMOTE method helped the LS-DRNN model to achieve high classification performance in minority classes, and the overall detection rate increased by . Furthermore, the LS-DRNN model outperformed state-of-the-art models.
1. Introduction
The Internet of Things (IoT) and the Industrial IoT (IIoT) are part of the main information and communication technologies of the fourth industrial revolution (Industry 4.0) [1,2,3]. To a large extent, the global coronavirus (COVID-19) pandemic that started in 2020 has restricted human contacts and economic activities in most countries. In view of this, IoT and IIoT technologies will help in connecting people, homes, and businesses to a large-scale of computers, smart devices, sensors, vehicles, and industrial machines in smart cities. Unfortunately, IoT has become the primary target of malicious botnet (A botnet is a network of computing devices that are coordinated by a botmaster to perform specific tasks [4].) operators due to their proliferation and distributed nature. A large number of connected IoT devices are insecure because their default usernames and passwords remain unchanged [5,6]. A malicious botnet poses a serious cybersecurity threat to the Internet of Things (IoT) networks and their applications [7,8,9,10]. IoT devices are vulnerable to various botnet attacks such as Denial of Service (DoS), Distributed DoS (DDoS), Operating System (OS) fingerprinting, service scanning, data exfiltration, and keylogging [11]. Recently, a new IoT Peer-to-Peer (P2P) botnet, named HEH, exploited insecure Telnet services on ports 23 and 232 to wipe out all the data in IoT devices using the brute force method [12]. Therefore, IoT networks must be properly monitored and protected to detect and prevent cyberattacks.
Cybersecurity mechanisms such as encryption, authentication, and access control may not be strong enough to protect IoT networks against botnet attacks [13,14]. Therefore, an efficient Network Intrusion Detection System (NIDS) is needed to complement existing security mechanisms. NIDS will scan and monitor all the network traffic traces generated in IoT networks to detect botnet attacks. Signature-based NIDS can detect known attacks with high accuracy but it cannot identify zero-day (unknown) attacks. On the other hand, anomaly-based NIDS can detect unknown attacks but it has a higher False Positive Rate (FPR) than signature-based NIDS. Machine Learning (ML) method can be used to detect both known and unknown malicious network traffic traces in IoT networks [15,16,17,18,19]. Popular ML methods include Random Forest (RF), Support Vector Machine (SVM), Decision Tree (DT), k-Nearest Neighbour (kNN), Random Tree (RT), and Naive Bayes (NB). However, IoT networks generate massive network traffic data at very high velocity, and shallow neural networks cannot handle such big data because they have a limited number of trainable parameters.
Deep Learning (DL) is an advanced ML method that has more than one hidden layer in its neural network and it learns the feature representation of training data using multiple levels of abstraction [20,21,22]. Common DL architectures include Deep Neural Network (DNN), Convolutional Neural Network(CNN), Recurrent Neural Network (RNN), Deep Belief Network (DBN), Autoencoder (AE) and Restricted Boltzmann Machine (RBM). RNN is a type of neural network in which the connections between the neurons form a directed graph along a temporal sequence. Unlike other DL methods, it considers the temporal dependencies among the features in the training set. Most times, RNN is combined with fully-connected dense layer(s) to improve model’s classification performance. The integrated model architecture is referred to as Deep RNN (DRNN). In fact, DRNN models have been successfully applied to botnet detection in recent literature [11,21,22,23]. Therefore, we select DRNN model architecture because of its ability to model the temporal relationships among the features in network traffic data. However, for high feature dimensionality in the training data, a high network bandwidth and a large memory space will be needed to transmit and store the data, respectively in IoT back-end server or cloud platform for DL. Furthermore, given a highly imbalanced network traffic data, DRNN models will produce poor classification performance in minority classes.
In this paper, we propose a memory-efficient DL method, named LS-DRNN, for botnet attack detection in IoT networks. S-DRNN method employs SMOTE and DRNN algorithms only but LS-DRNN combines Long Short-Term Memory Autoencoder (LAE), SMOTE, and DRNN algorithms to achieve an efficient performance. AE is an unsupervised DL that is particularly suitable for feature representation as well as feature dimensionality reduction. There are different variants of AE including Stacked AE (SAE), Variational AE (AE), Sparse AE (SpAE), Convolutional AE (CAE), Deep AE (DAE), Denoising AE (DeAE), and Long Short-Term Memory AE (LAE). Unlike other variants of AE and similar to RNN, LAE uses Long Short-Term Memory (LSTM) to account for long-term dependencies among features while learning their representation and reducing the dimensionality. So, LAE is a good fit for feature dimensionality reduction in the botnet detection task. The main contributions of this paper are as follows:
- LAE reduces the feature dimensionality of large-scale network traffic data using unsupervised DL method;
- SMOTE generates additional samples for minority classes in low-dimensional network traffic data to achieve class balance;
- DRNN performs multi-class classification of network traffic samples in balanced, low-dimensional data using supervised DL method;
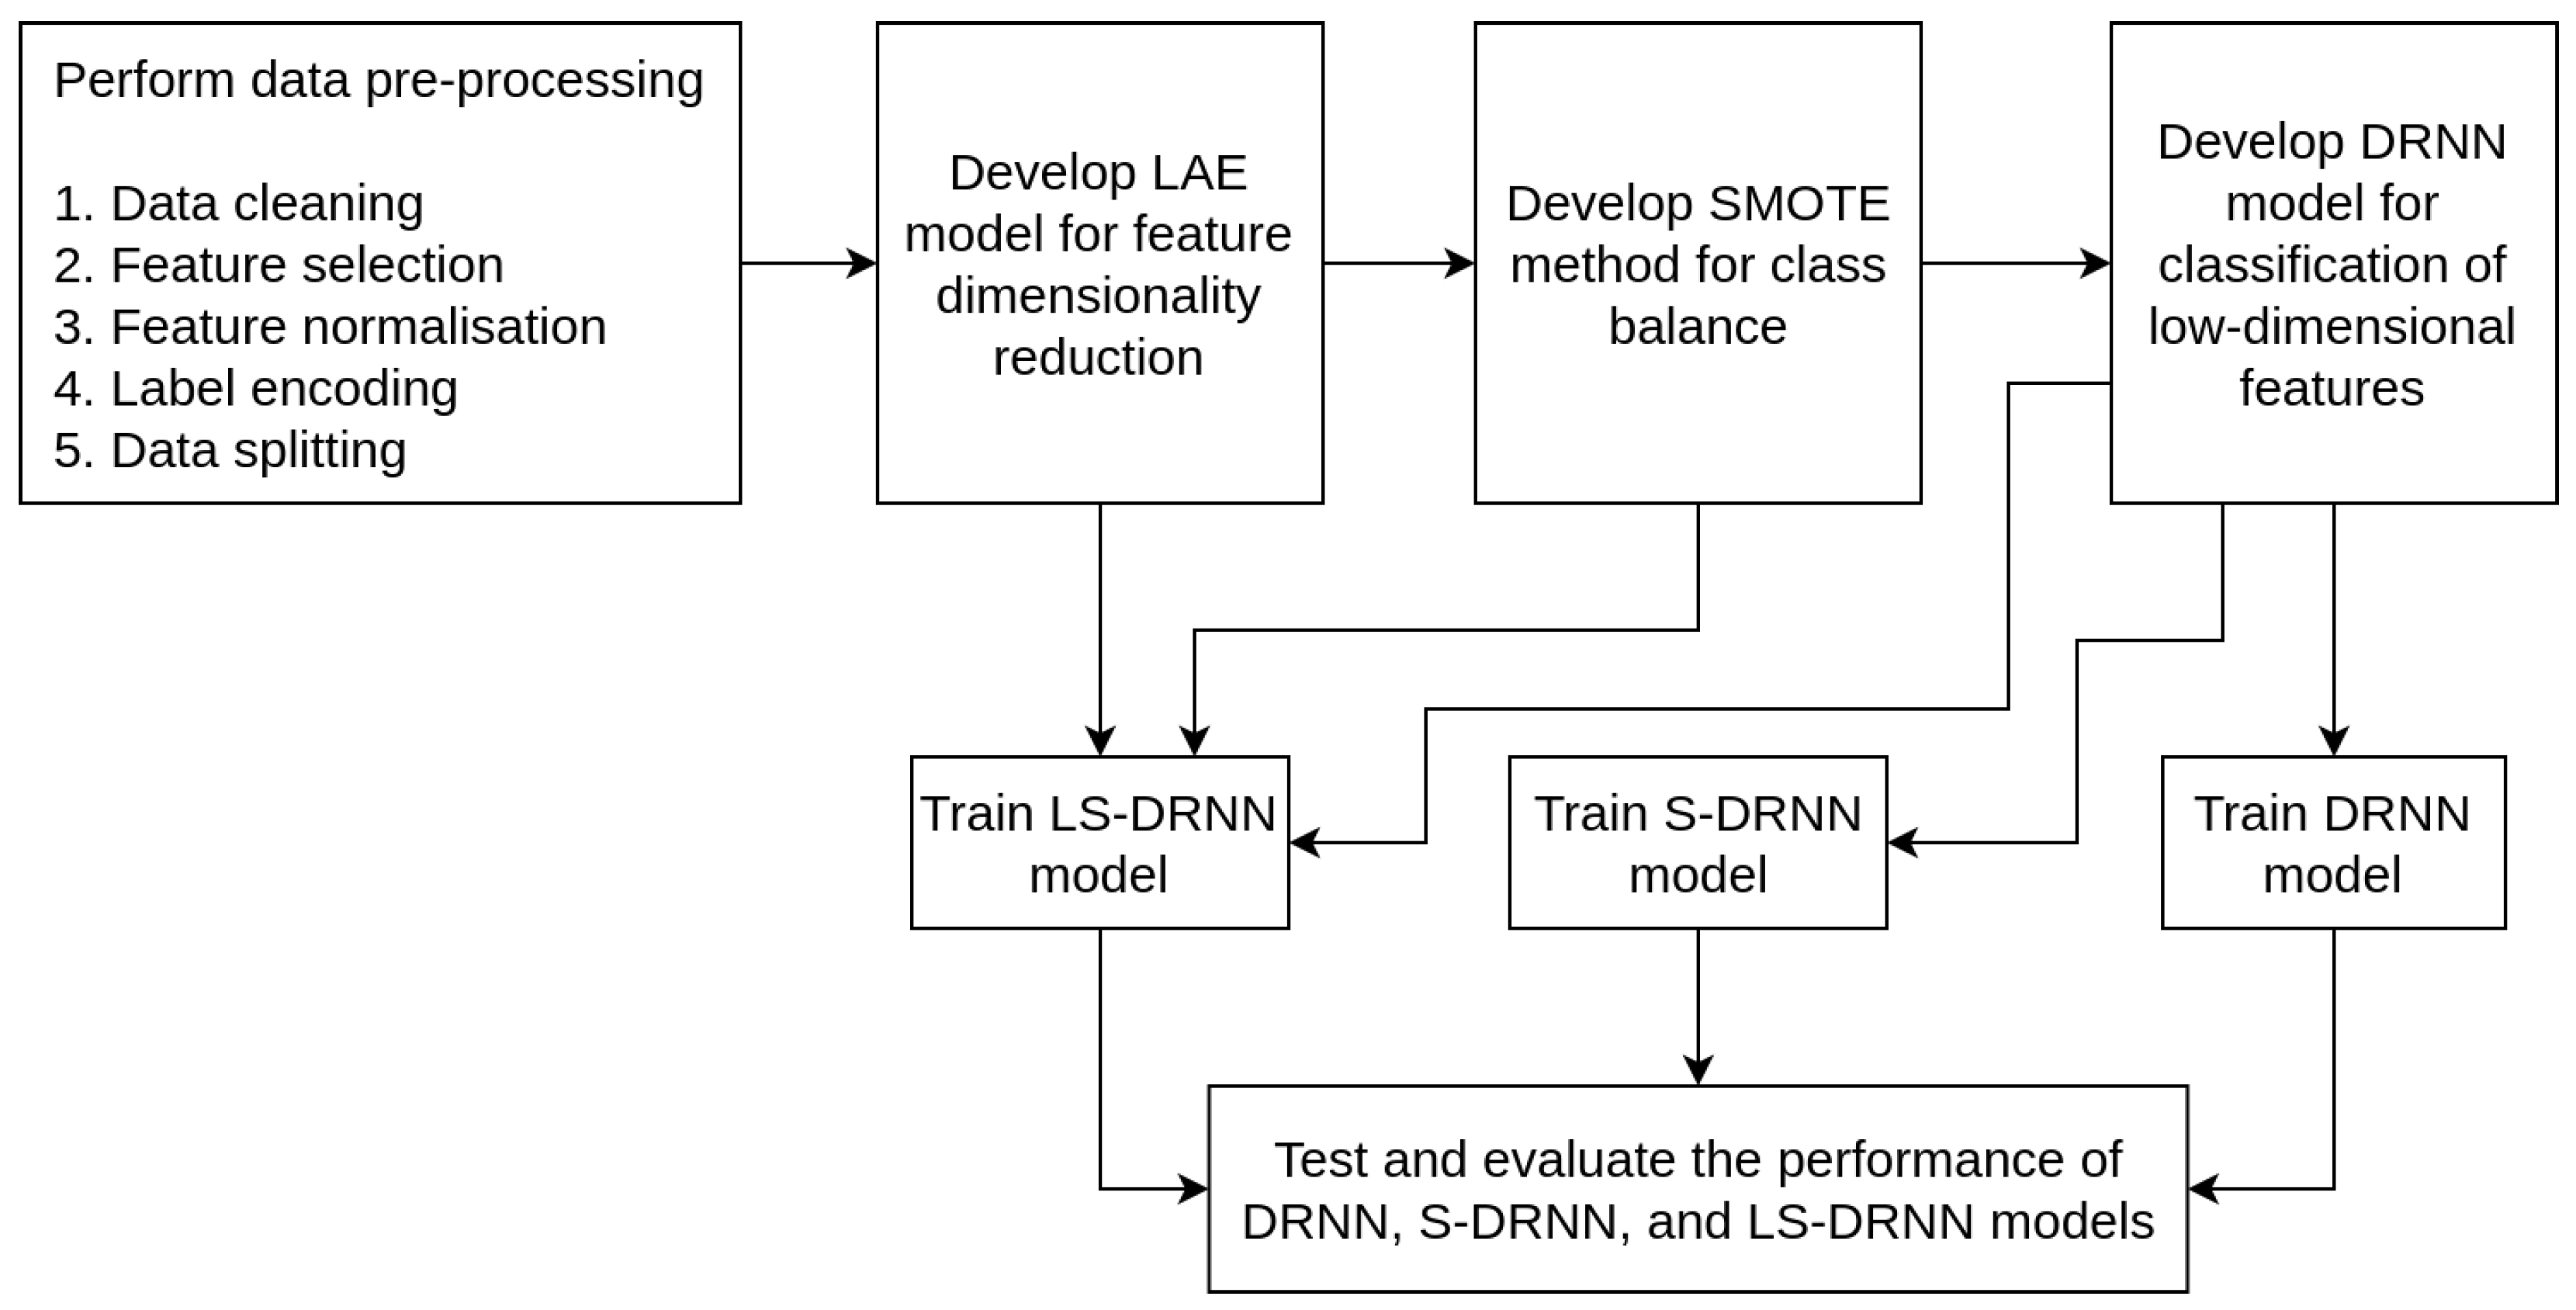
- DRNN, S-DRNN, and LS-DRNN models are trained, validated, and tested with network traffic samples in the Bot-IoT dataset [11], and their classification performance in 11-class classification scenario is evaluated.
2. Review of Related Works
In this section, we review related works to establish the novelty and the main contributions of this paper. Table 1 presents a summary of the state-of-the-art feature dimensionality reduction methods and class balance methods proposed for botnet detection in IoT networks.
Koroniotis et al. [11] used Pearson Correlation Coefficient (PCC) and joint entropy techniques to select the 10 most relevant features. Support Vector Machine (SVM), DRNN, and Long Short-Term Memory (LSTM) models were trained with these features to perform binary classification. The reduction in the number of features shortened the time taken to train the ML and DL models, but the classification performance was lower than when the full features were used for model training. Furthermore, the authors did not evaluate the performance of the feature selection method in a multi-class classification scenario. The same set of features was also used for ML-based intrusion detection in [24,25,26,27,28,29,30].
Kumar et al. [31] proposed a hybrid feature selection method, which combined PCC with Random Forest Mean Decrease Accuracy (RFMDA) and Gain Ratio (GR), to select the 10 most important features. Random Forest (RF), k-Nearest Neighbour (kNN), and Extreme Gradient Boosting (XGBoost) models were trained with these features to perform 5-class classification. Kumar et al. [32] used a mutual information-based feature selection method to select the 10 most relevant features. RF and XGBoost models were trained with these features for the 5-class classification task. Shafiq et al. [33,35] proposed a new feature selection algorithm based on the wrapper technique and Area Under Curve (AUC) metric. Then, C4.5, Naive Bayes (NB), RF, and SVM models were trained for 8-class classification. Koroniotis et al. [34] developed Multilayer Perceptron (MLP) and RNN models using 13 network traffic features. Asadi et al [36] proposed Particle Swarm Optimisation (PSO) algorithm to select 10 outstanding features. These features were used to train ML/DL models for binary classification. Popoola et al. [10] performed feature dimensionality reduction based on the LAE algorithm, while the Bidirectional LSTM (BLSTM) algorithm was used for the 5-class classification task. Other feature dimensionality reduction methods include Principal Component Analysis (PCA) in [37,38,39], and t-distributed Stochastic Neighbour Embedding (t-SNE) in [40].
Khan and Kim [48] proposed a hybrid intelligent model using both anomaly-based and misuse-based NIDS approaches. At the first stage, Logistic Regression (LR) and XGBoost algorithms were used to develop anomaly-based NIDS, while the LAE algorithm was used for misuse-based NIDS in the second stage of the system. The effectiveness of the hybrid model was evaluated with the ISCX-2012 data set. Roopak et al. [49] investigated the effectiveness of Multi-Layer Perceptron (MLP), CNN, LSTM, and CNN-LSTM models for DDoS attack detection in IoT networks. The authors simulated these models with the CICIDS2017 data set. Liaqat et al. [41] used the up-sampling method to increase the number of benign samples in the training data set. In [42,43,44,45], Synthetic Minority Oversampling Technique (SMOTE) method was used to generate additional samples for the minority classes. Mulyanto et al. [46] performed feature selection to reduce dimensionality while focal loss function was used to address class imbalance problem. Similarly, Injadat et al. [47] selected the most relevant features and additional minority samples were generated using SMOTE.
3. LS-DRNN: A Memory-Efficient Deep Learning Method
In this section, we explain how the LS-DRNN method is developed for botnet attack detection in IoT networks. LS-DRNN employs an unsupervised DL method (LAE), a sampling method (SMOTE), and a supervised DL method (DRNN).
3.1. LSTM Autoencoder
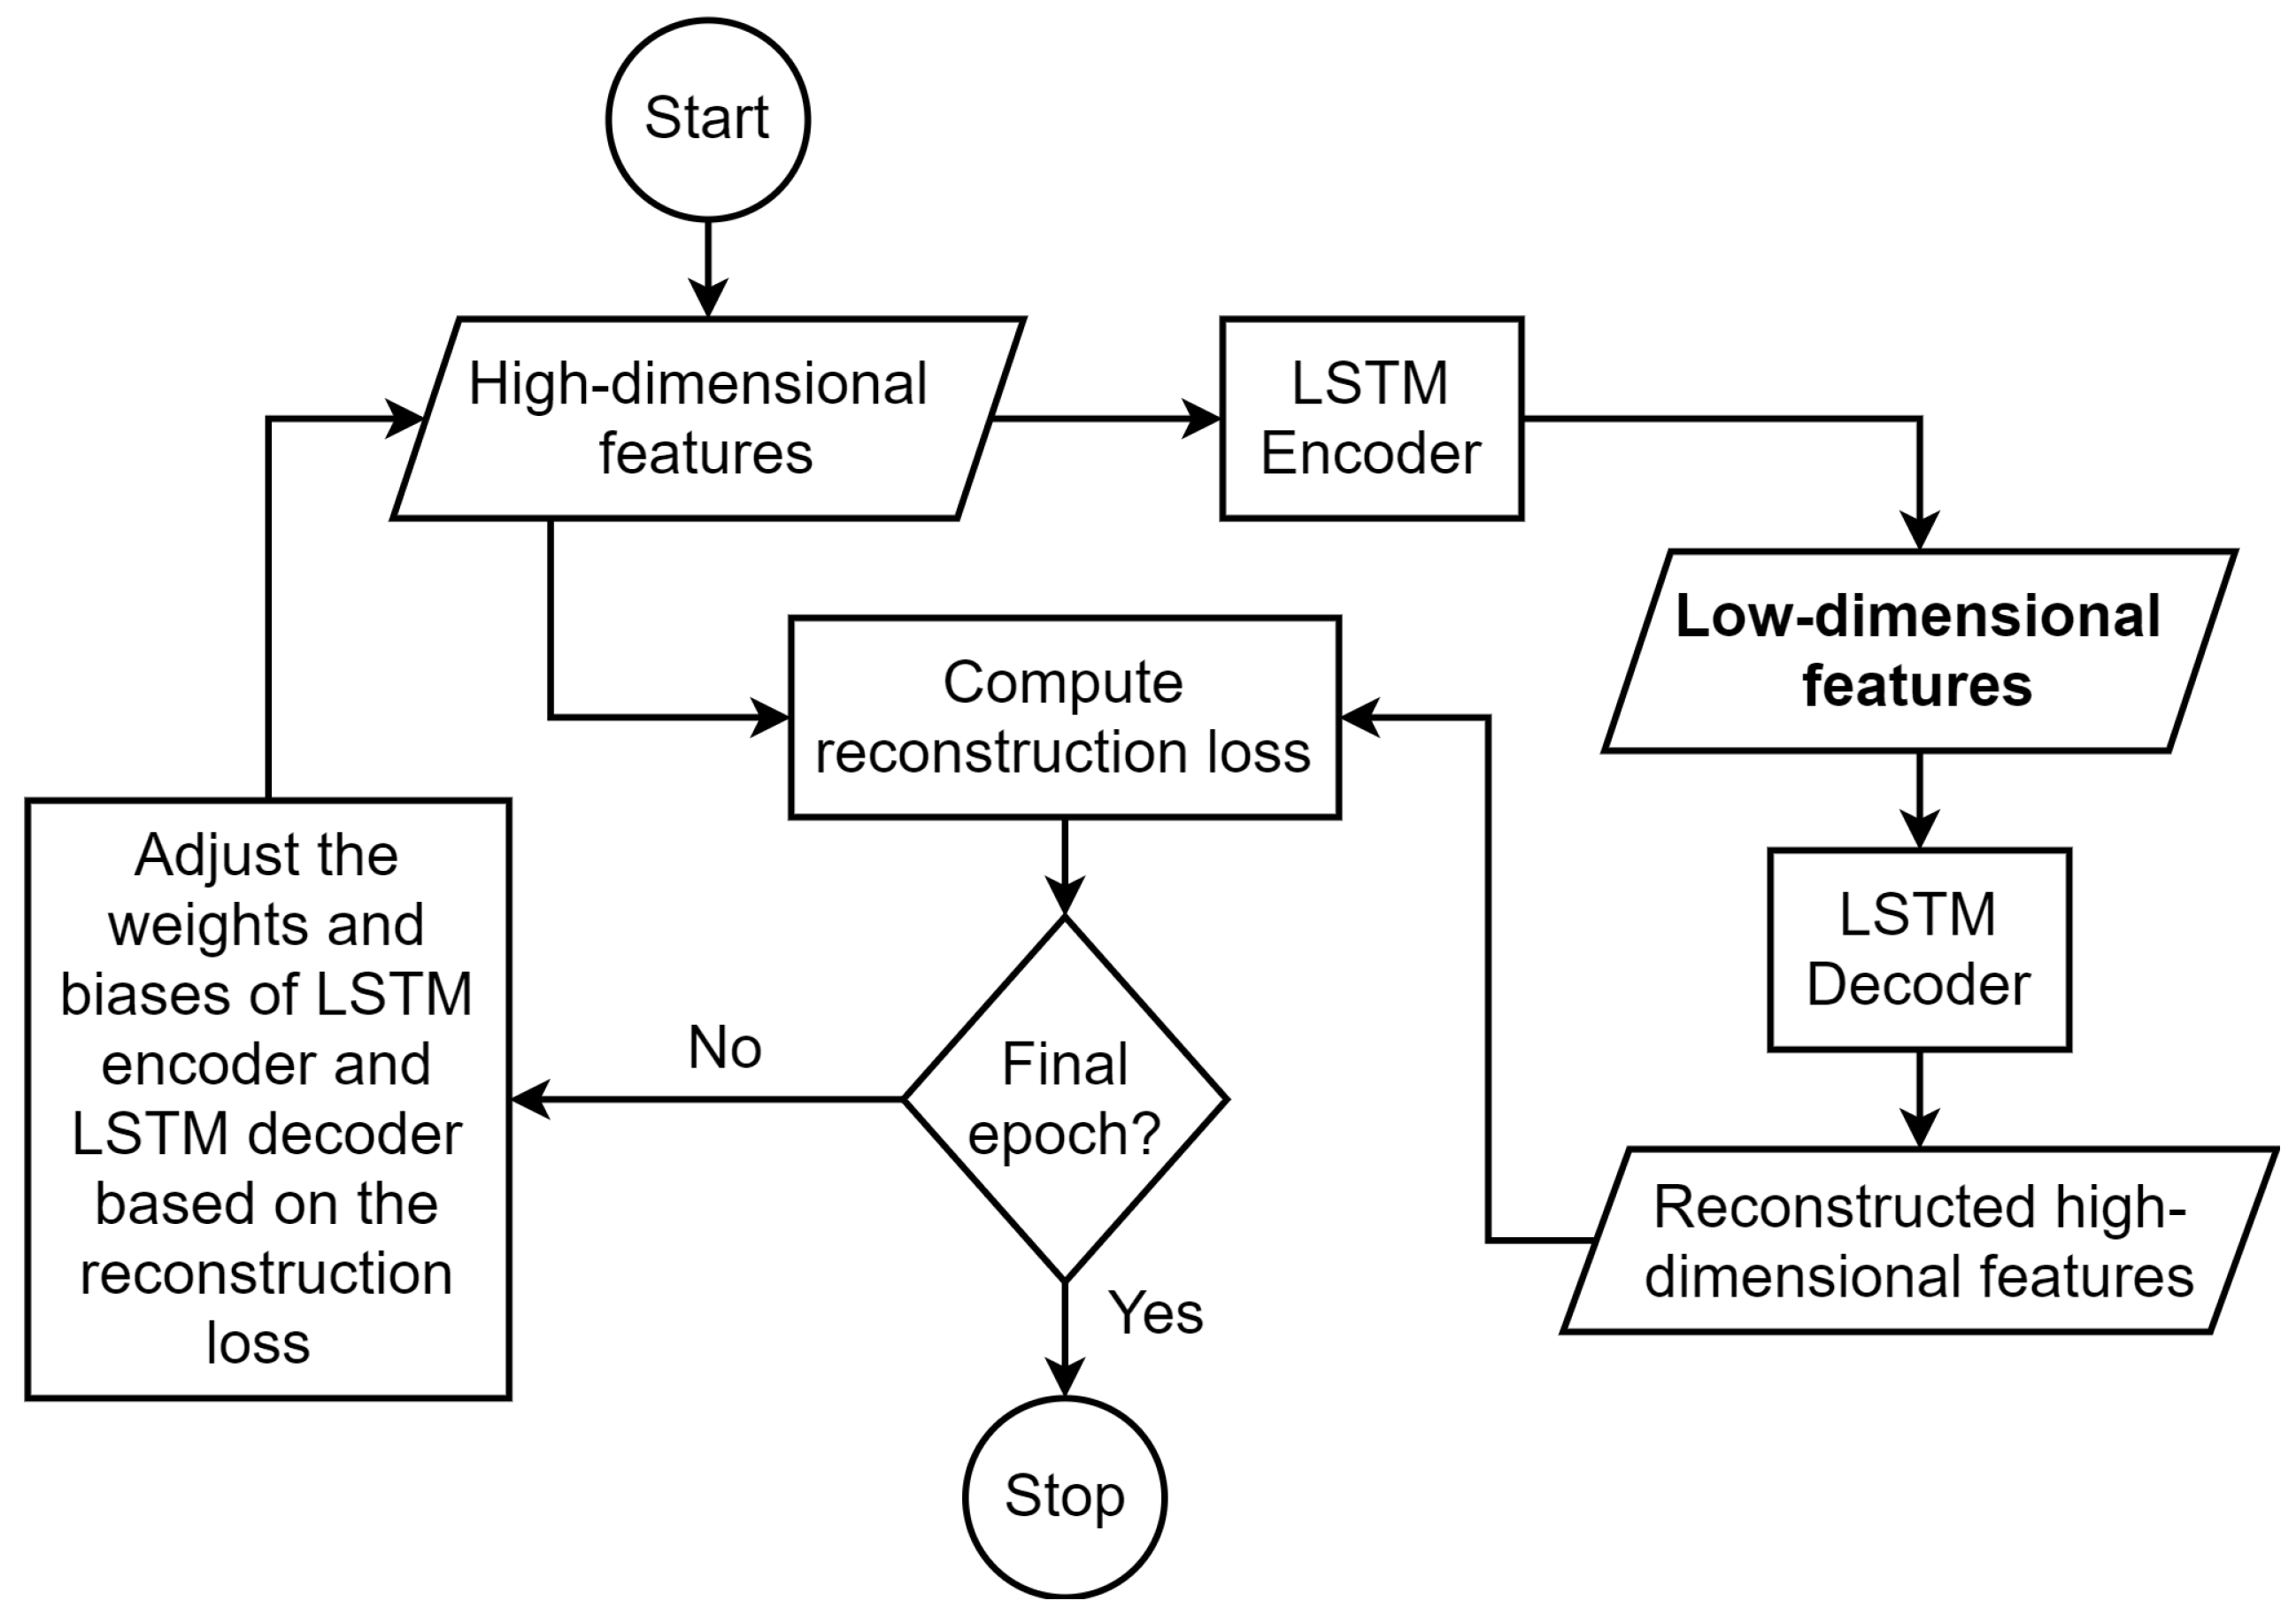
LAE method is an unsupervised DL method and it was used to reduce the dimensionality of network traffic features. Consequently, this process is expected to reduce the amount of memory space that will be required to store training data for DL in IoT back-end server or cloud platform.
A high-dimensional network traffic feature set is represented with , where n is the total number of network traffic samples, and a is the feature dimensionality. This matrix was reshaped to form a sequential 3D tensor, . LSTM is a recurrent neural network which learns latent space representation of network traffic features using input gate, forget gate, memory cell state, output gate, and hidden state. A single LSTM layer was used to reduce the dimensionality of the feature set based on Equations (1)–(6):
where is the input gate vector; is the forget gate vector; is the memory cell state vector; is the output gate vector; is the hidden state vector; are the weight matrices; are the bias vectors; is a sigmoid activation function; and is a Rectified Linear Unit (ReLU). The weight matrices were initialised using He uniform technique [50].
3.2. Synthetic Minority Oversampling Technique
High class imbalance adversely affects the classification performance of ML/DL models. The class imbalance problem is usually handled by either under-sampling or over-sampling the data in the training set to achieve class balance. However, the under-sampling approach is not suitable for cases where the number of samples in one of the minority classes is very small (<10). In our case, there are only four samples in one of the minority classes (more details will be provided later in Section 4). Therefore, we simply ruled out the option of the under-sampling approach.
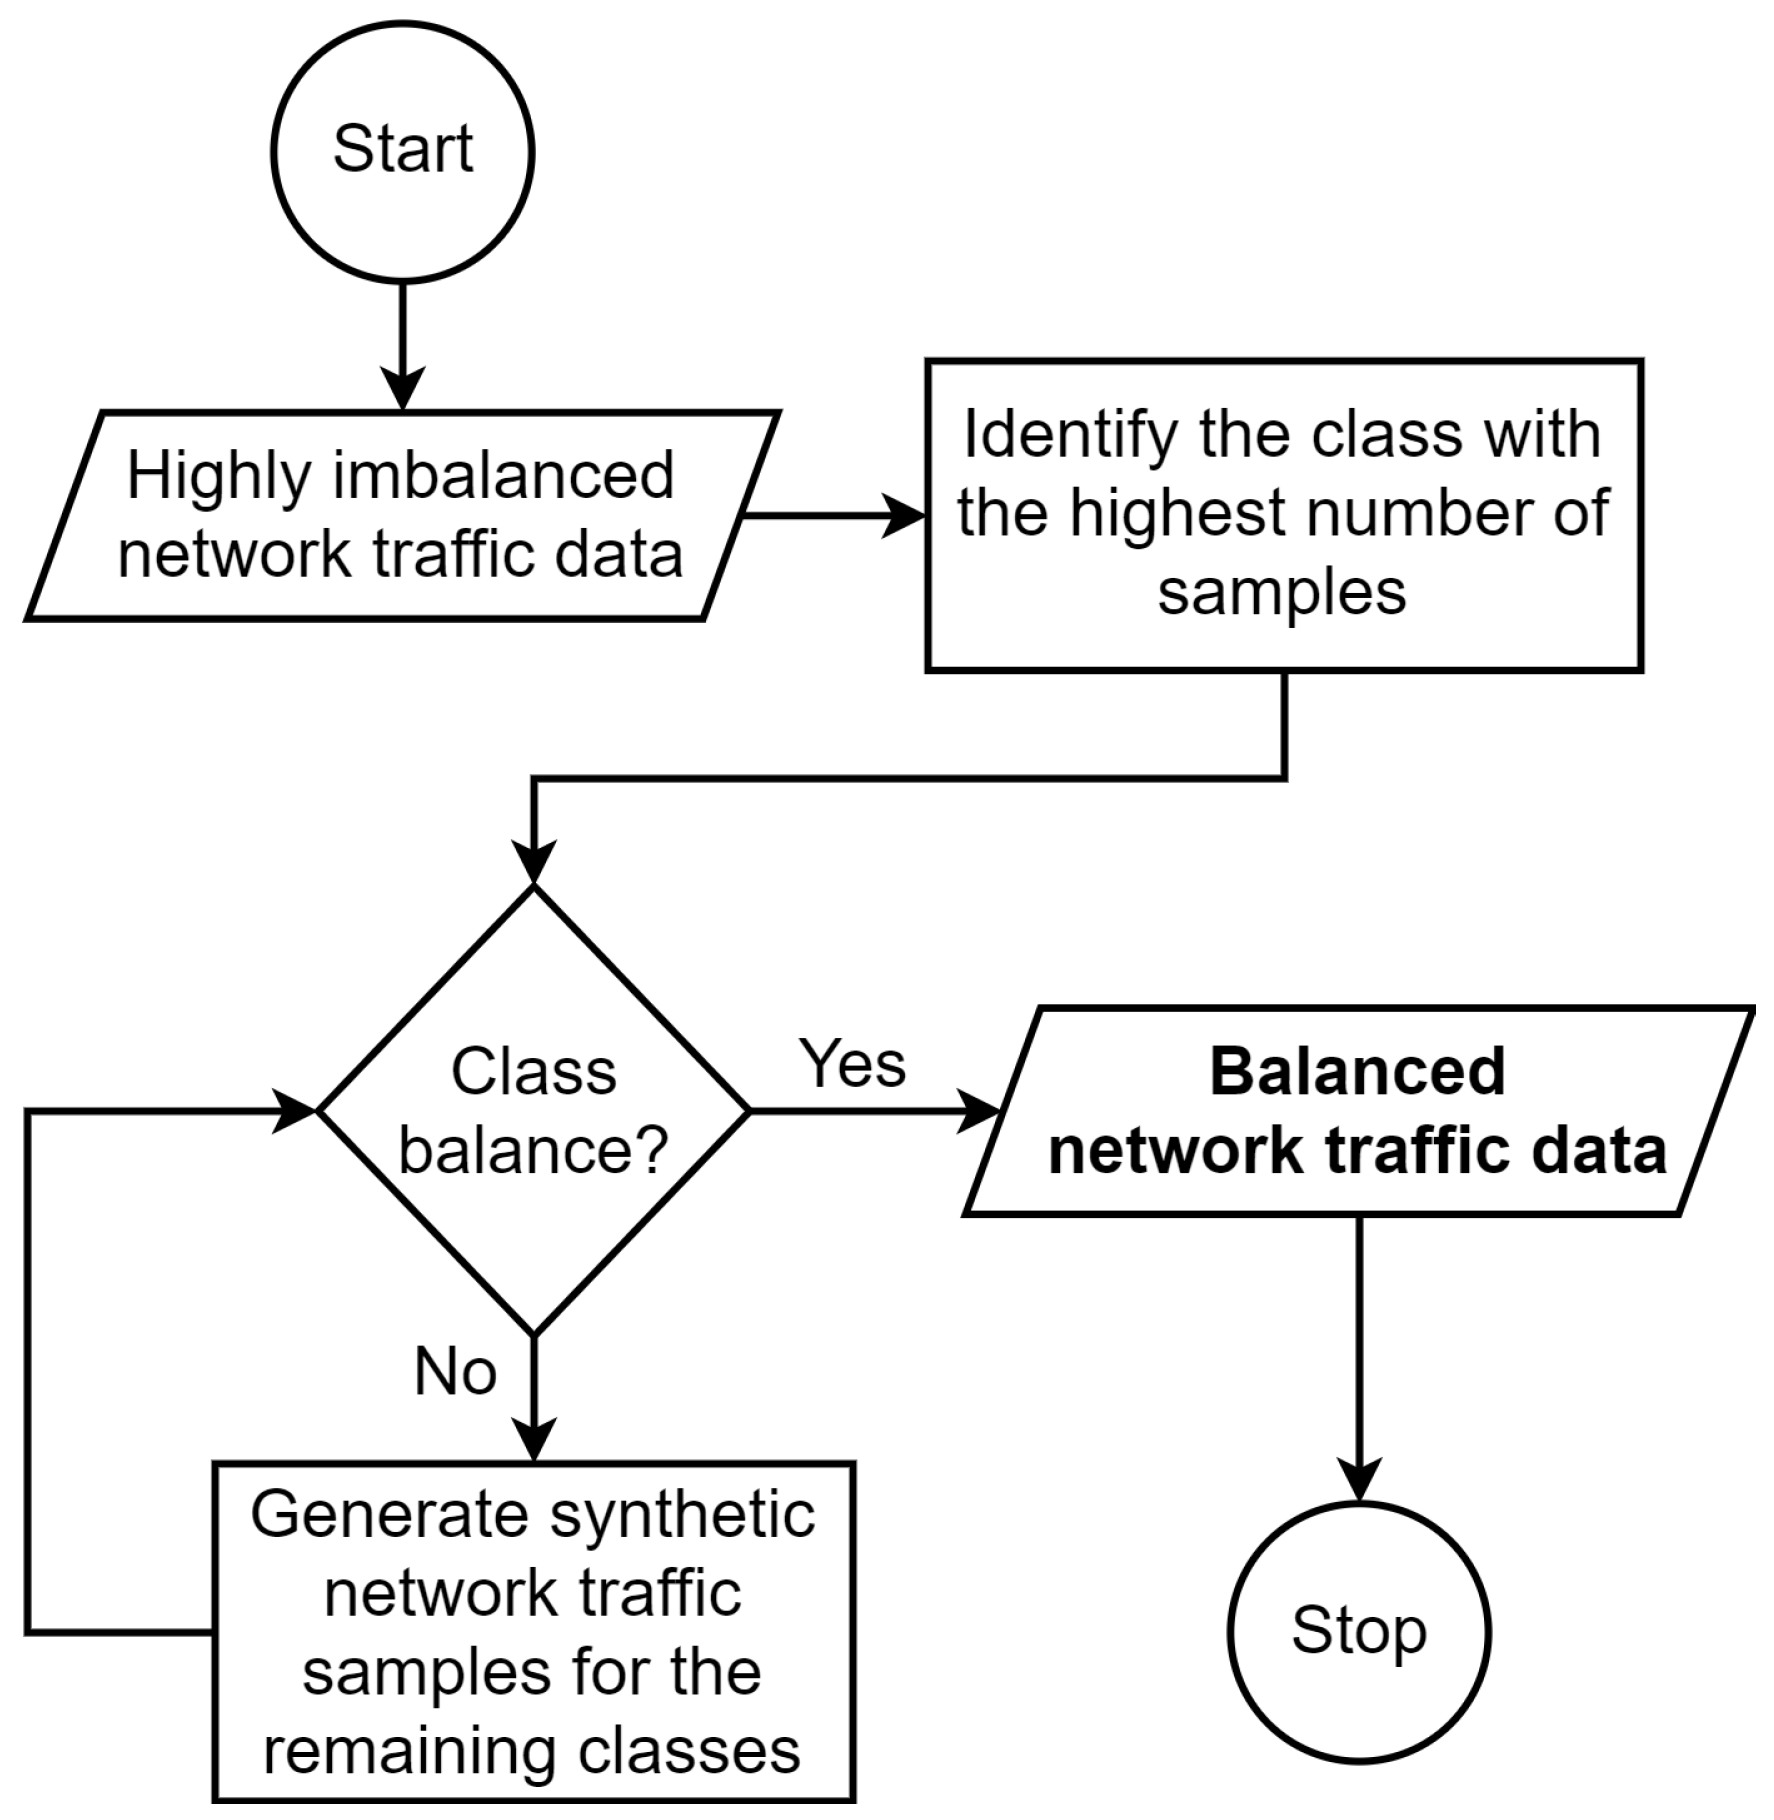
Recent studies recommended SMOTE as an efficient over-sampling method [42,43,44,45,47,51]. Therefore, SMOTE algorithm was proposed to deal with the high class imbalance problem in the training set in an 11-class classification scenario. Unlike the method in [52,53], which over-samples minority classes with replacement, the method employed in this paper generates synthetic examples by using techniques such as rotation and skew in order to achieve class balance [54].
These synthetic network traffic data were generated along the line segments joining any or all of the k nearest neighbours of the minority classes, where k . Therefore, neighbours from the three nearest neighbours were randomly selected. The step-wise process of SMOTE is presented in Algorithm 1. The generation of synthetic samples (S) in the minority classes depends on the number of minority class samples (T), the over-sampling rate (), and the number of nearest neighbours (k). If N is less than , the minority class samples are randomised. We compute k nearest neighbours for each of the minority class only. This is a function of N, the current minority class sample (i), the integral multiples of 100 in N (j), and an array of random numbers (). is an array of original minority class samples; r is the count of a number of synthetic samples generated, and is an array of synthetic samples.
| Algorithm 1: SMOTE Algorithm |
 |
3.3. Deep Recurrent Neural Network
Given a low-dimensional network traffic feature set, , and a corresponding ground truth label vector, , the goal of DRNN is to learn the function that determines the output target whenever the input data sequences are presented. First, a new hidden state vector, , is produced at each time step implementing an activation function on the previous hidden state, , and the current input, .
Unlike Feedforward Neural Network (FNN), RNN has a hidden state which helps to model temporal dynamics of input data. RNN learns the temporal dynamics of a mini-batch of highly imbalanced network traffic features, , by transforming the input data and initial hidden state, , with trainable parameters as stated in Equation (13):
where is the new hidden state when RNN is trained with the mini-batch; and are the weights used for linear transformation of and respectively; and is the bias. RNN layer output is further processed based on Equations (14)–(20) to produce DRNN layer output. Complete information about DRNN is presented in Algorithm 2.
| Algorithm 2: DRNN Algorithm |
 |
The hidden states of the four dense hidden layers are obtained by Equation (14):
where ; is the hidden state of hidden layer; ; is the weight used for linear transformation of previous hidden state, ; is the bias of hidden layer; and is a Rectified Linear Unit (ReLU) activation function given by Equation (15):
If a is a negative value, the function returns 0; but the same a is returned when it is a positive value.
The hidden state of the fourth dense layer, , is transformed by the dense output layer as stated in Equation (16):
where n is the sample size of mini-batch of and ; is the batch size and ; is the weight used for linear transformation of ; is the bias of dense output layer; and is the activation function of dense output layer.
In multi-class classification scenario, is a softmax function given by Equation (17):
where is the number of classes in . while the difference between and is measured by categorical cross-entropy loss function in Equation (18):
The performance of DRNN was validated with a different previously unknown highly imbalanced network traffic data, , and its corresponding ground-truth labels, . Training loss and validation loss are minimized in mini-batches over u epochs using an efficient first-order stochastic gradient descent algorithm named Adam in [55]. Trainable parameters of densely-connected DL model are represented by Equation (19):
For each epoch, Adam optimizer, , updates to minimize L as stated in Equation (20):
where is the new set of trainable parameters; is the learning rate (); and and are the exponential decay rates ( and respectively).
4. Simulation and Performance Evaluation
In this section, we implement and evaluate the effectiveness of DRNN, S-DRNN, and LS-DRNN models with the Bot-IoT data set [11]. The research methodology involves data pre-processing, model development, and model evaluation, as shown in Figure 1.
Bot-IoT data set [11] contains the information about the features of 477 benign network traffic samples that were generated by five IoT scenarios, namely: a weather station, a smart fridge, motion-activated lights, a remote-controlled garage door, and a smart thermostat. Furthermore, the data set contains the features and the corresponding labels of 3,668,045 malicious network traffic samples that represent different botnet attack scenarios including DDoS, DoS, reconnaissance, and data theft. All the network traffic samples in the Bot-IoT dataset were grouped into 10 attack classes and a benign class namely: DDoS-HTTP (DDH), DDoS-TCP (DDT), DDoS-UDP (DDU), DoS-HTTP (DH), DoS-TCP (DT), DoS-UDP (DU), normal, OS Fingerprinting (OSF), Service Scanning (SS), Data Exfiltration (DE), and Key Logging (KL).
Data pre-processing stage involved input feature selection, label encoding, input feature normalization and random data splitting as described in [10]. The sample distribution of the BoT-IoT data set for training, validation and testing in Table 2 shows that the network traffic data is highly imbalanced across the 11 classes. All the 37 network traffic features have continuous values; and these values were scaled to a range of using min-max transformation given by Equation (21):
where and are the minimum and maximum values of X respectively. Data pre-processing operations were implemented using Numpy, Pandas and Scikit-learn libraries developed for Python programming language.
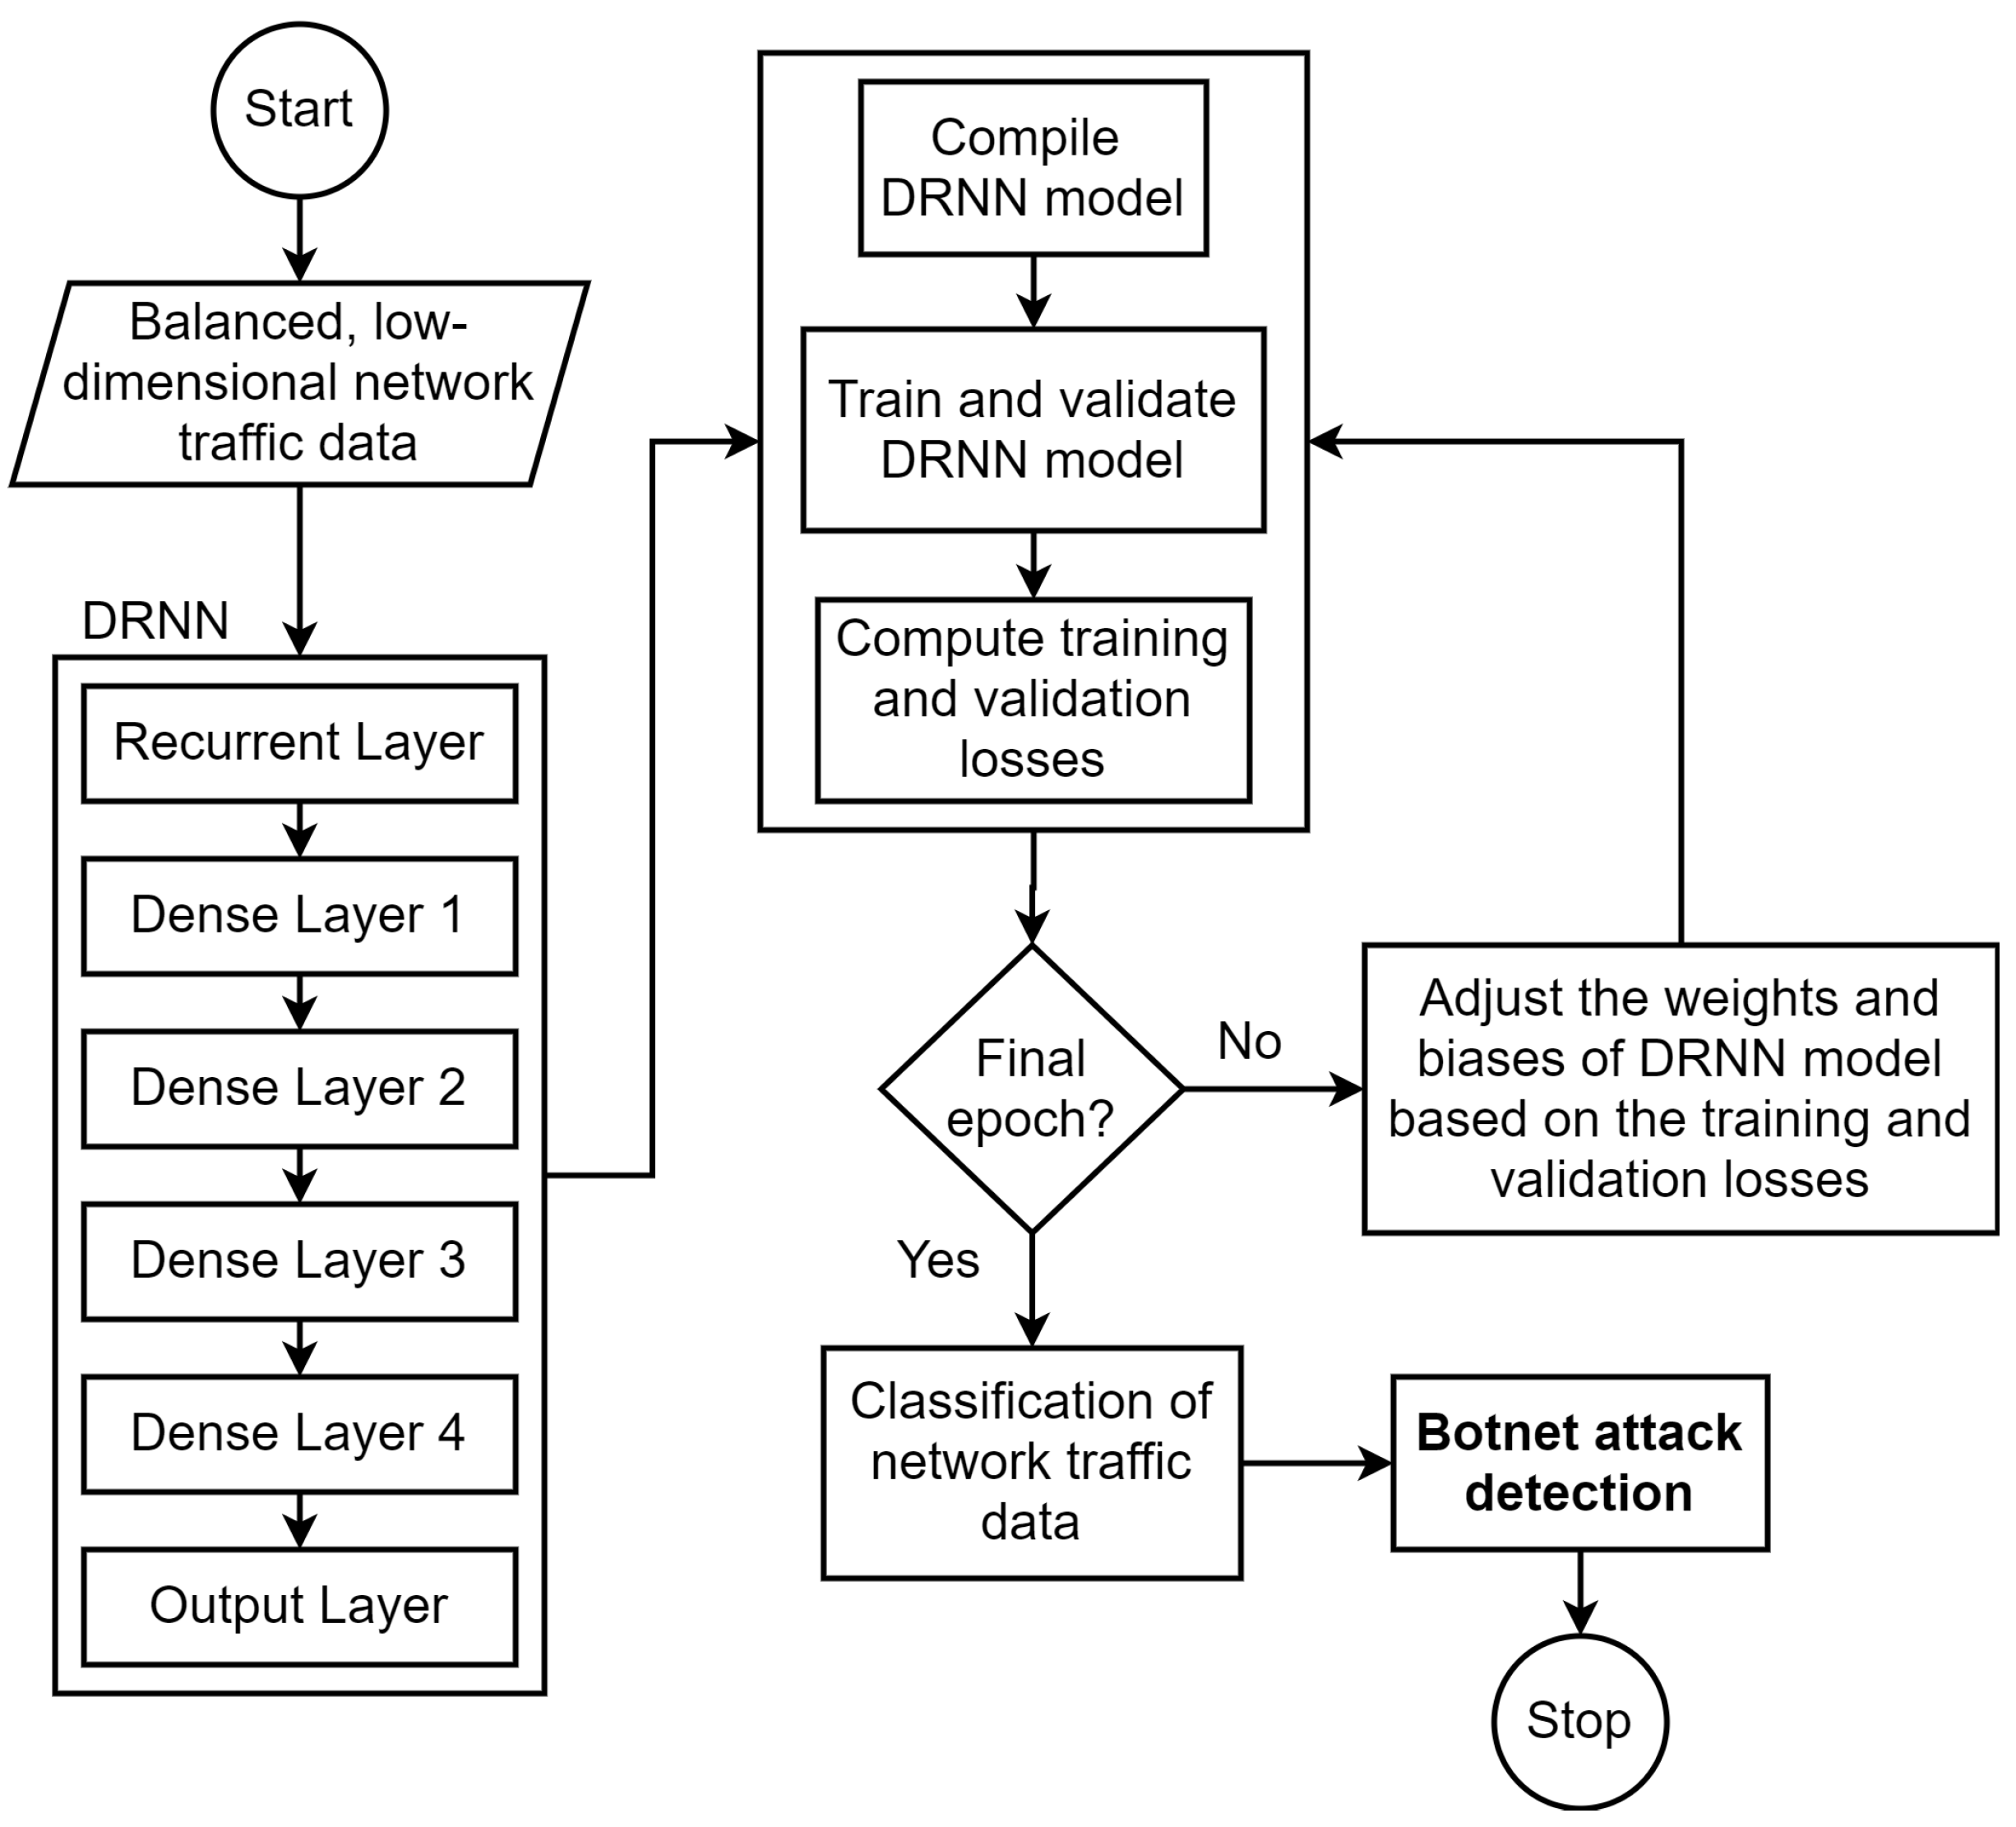
Figure 2, Figure 3 and Figure 4 show the overview of the implementation of LAE, SMOTE, and DRNN methods, respectively. The classification performance of ML/DL model depends on the quality of the training data and the choice of the right network topology. Therefore, we performed extensive experimentation with different recurrent layer, dense layer, activation function, batch size, and epochs to determine the most suitable DRNN architecture. The optimal DRNN structure shown in Figure 4 has a single recurrent layer, four dense layers, and an output layer. There were 100 neurons each in the recurrent layer and the four dense layers. On the other hand, the number of neurons in the output layer depends on the number of classes in the training set. Hence, the number of neurons in the output layer was set to 11. ReLU activation function was used in the recurrent and dense layers, while softmax activation function was employed in the output layer. DRNN, S-DRNN, and LS-DRNN models were trained using mini-batch stochastic gradient descent algorithm [55], and we used a batch size of 64. These models were trained and validated for a period of 20 epochs using categorical cross-entropy loss function. Data processing were performed using open-source frameworks and libraries such as Pandas (https://pandas.pydata.org/), Numpy (https://numpy.org/), Sklearn (https://scikit-learn.org/stable/), and Imblearn (https://pypi.org/project/imblearn/). Model training, validation and testing were implemented using TensorFlow (https://www.tensorflow.org/) and Keras (https://keras.io/) frameworks developed for Python programming running on Ubuntu 16.04 LTS workstation with the following specifications: RAM (32 GB), processor (Intel Core i7-9700K CPU @ 3.60 GHz × 8), Graphics (GeForce RTX 2080 Ti/PXCIe/SSE2) and OS type (64-bit). The data sizes of the features in the training sets are analysed to determine the amount of storage space required for DL in memory-constrained IoT devices. Then, training losses and validation losses are analysed to evaluate the robustness of DL models against under-fitting and over-fitting, respectively. Lastly, the accuracy, precision, recall, F1 score, FPR, Negative Predictive Value (NPV), Balanced accuracy (BACC), Geometric Mean (GM), and Matthews Correlation Coefficient (MCC) of DL models are analysed to evaluate their classification performance. The time required to train DL models with the network traffic samples in the training sets and the time required to test the models with the network traffic samples in the testing sets is analysed to evaluate their training speed and detection speed, respectively.
5. Results and Discussion
In this section, we evaluate and compare the effectiveness of learning the discriminative features of benign network traffic and botnet attack traffic from highly imbalanced data using DRNN, S-DRNN, and LS-DRNN methods.
5.1. Results of DRNN Model
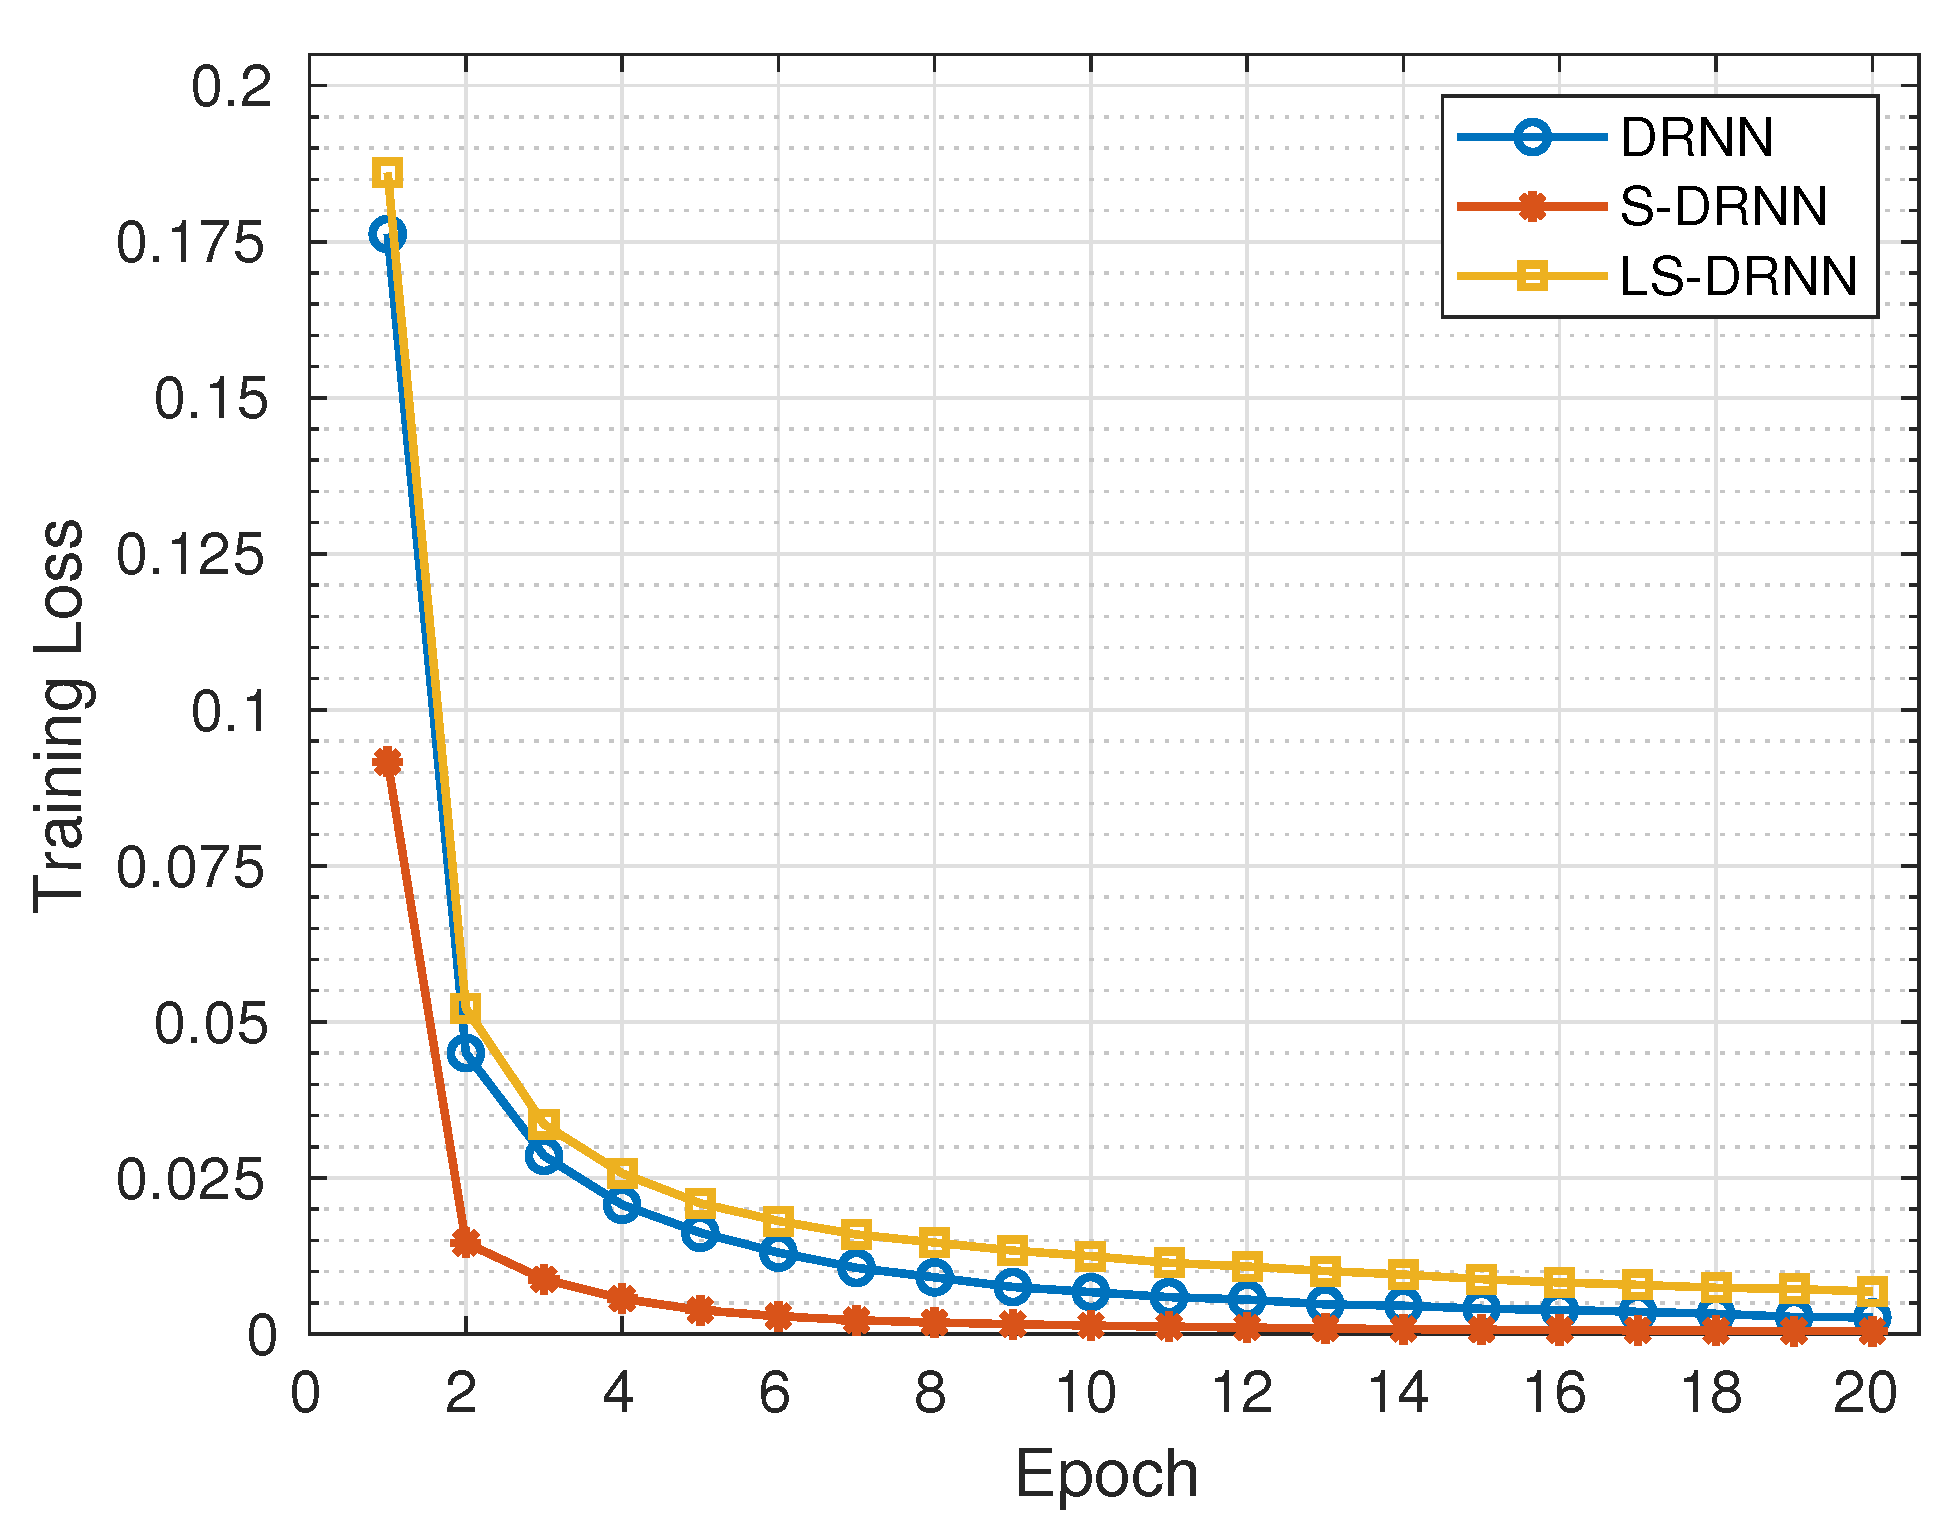
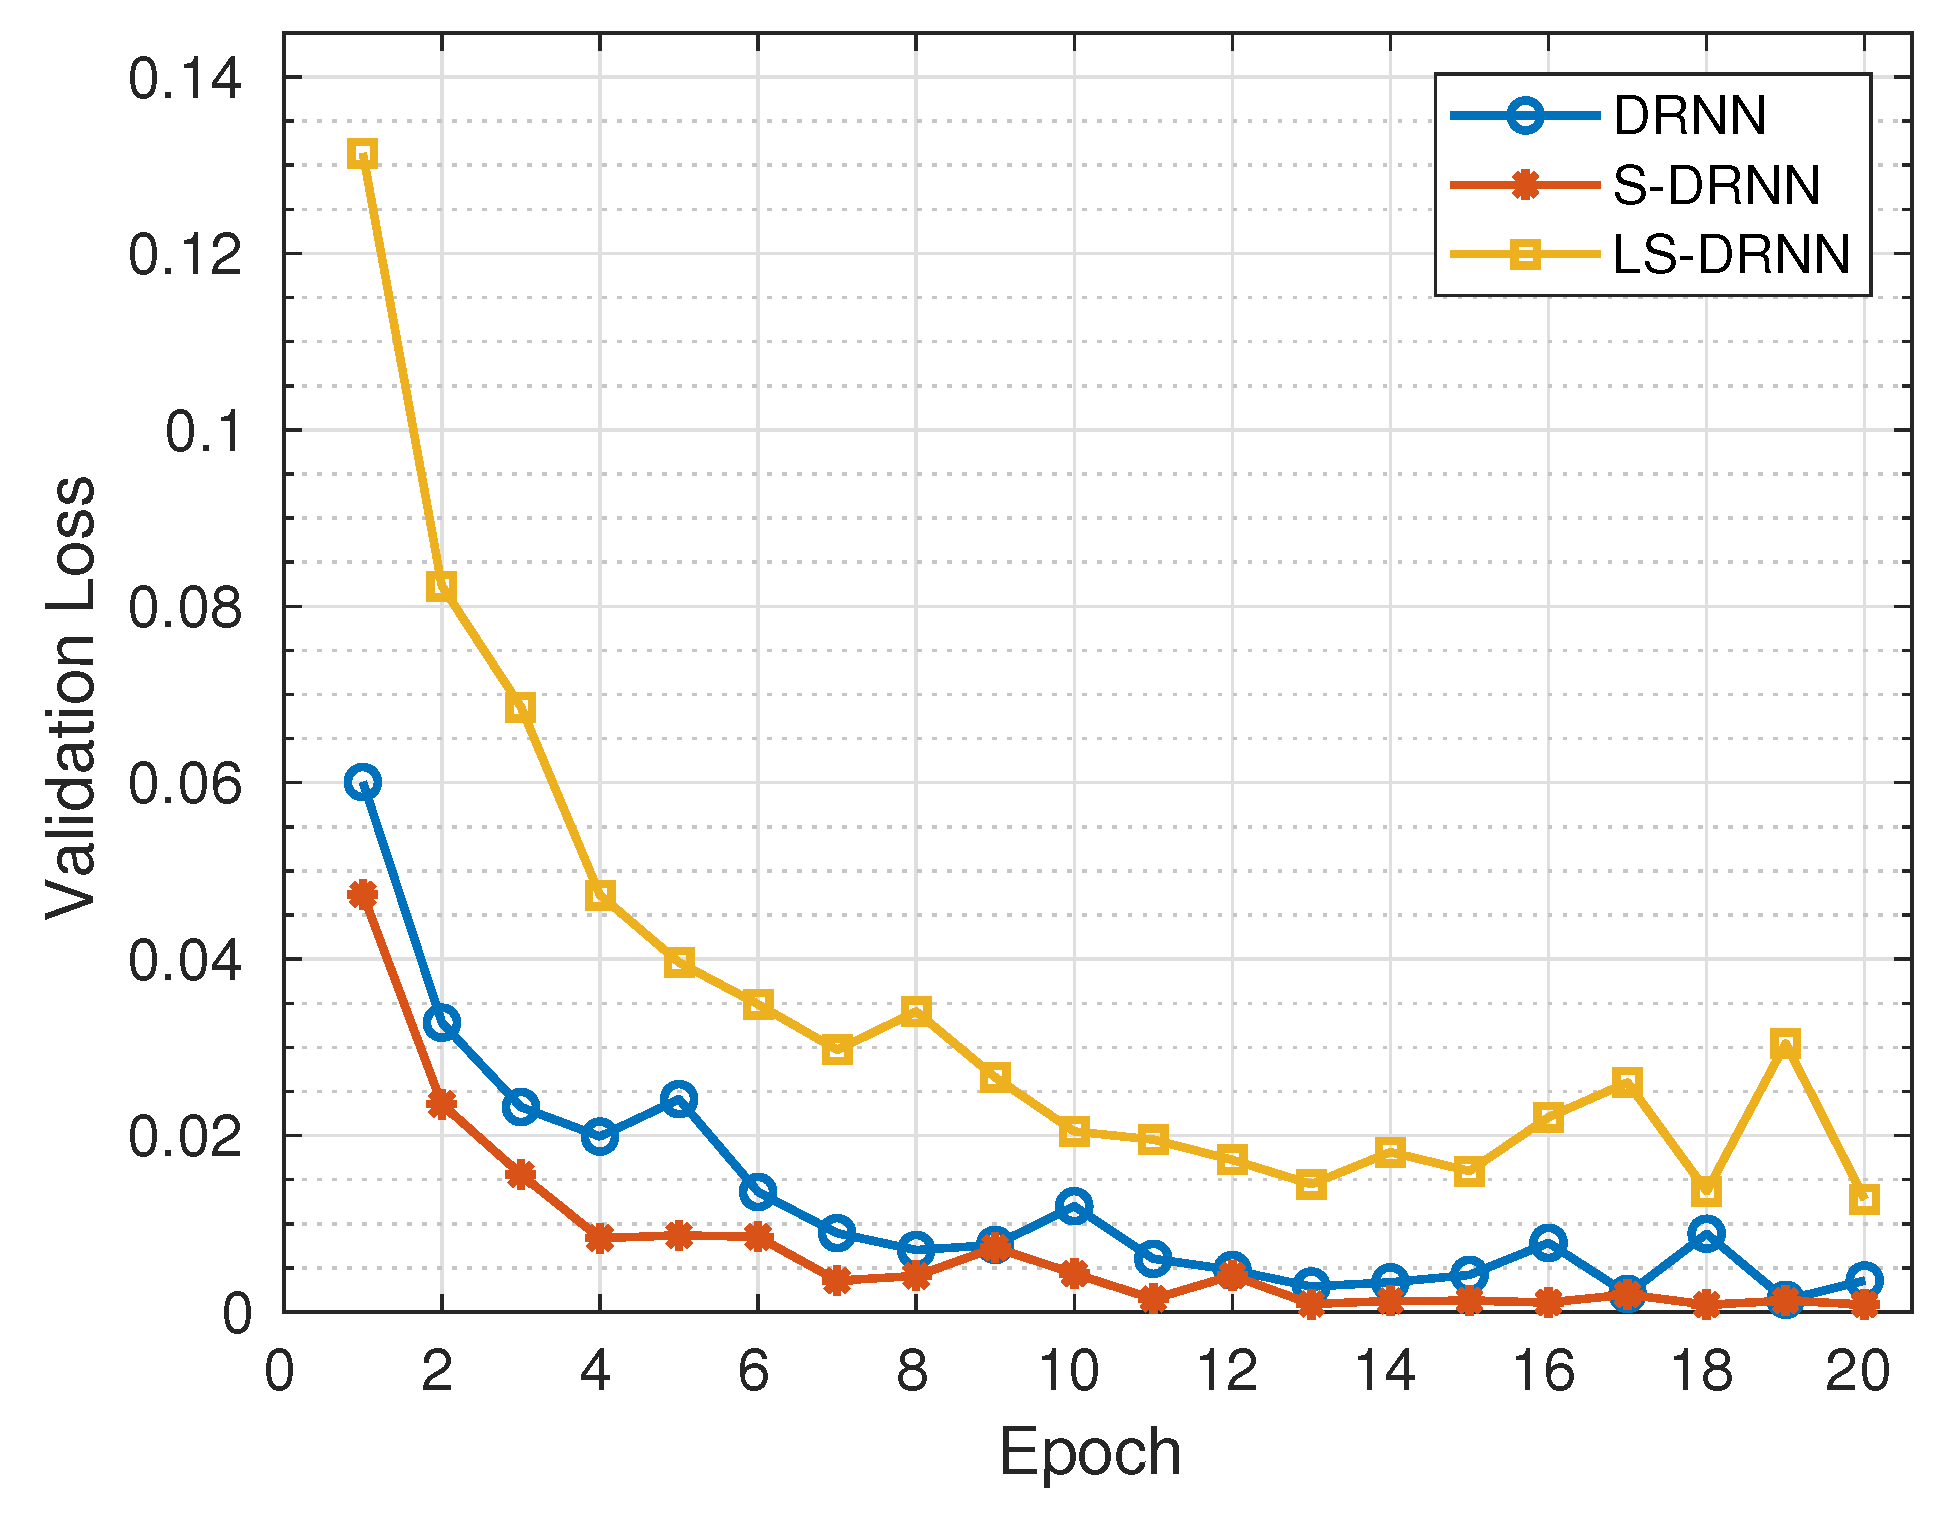
The data size of the feature set used for the training of the DRNN model was MB, as shown in Table 3. This implies that a large memory space (>1 GB) will be required to store training data for DL-based botnet attack detection in IoT back-end server or cloud platform. Figure 5 shows that the training loss of the DRNN model decreased from to as the number of epochs increased from 1 to 20. Similarly, its validation loss decreased from to , as shown in Figure 6. The consistent decrease in training loss and validation loss, as the number of epochs increased, implies that the DRNN model neither under-fit nor over-fit the network traffic data in the training and validation sets, respectively.
Table 4 shows that DRNN model achieved high accuracy (>99%), high NPV (>99%), and low FPR (≈0%) in each of the 11 classes. In addition, the precision, recall, F1 score, BACC, GM, and MCC of the DRNN model were high for the majority classes; however, the values of these performance metrics were relatively low for the minority classes. Consequently, the mean values of precision (), recall (), F1 score (), BACC (), GM (), and MCC () were not very close to as expected. This means that high class imbalance in the training set degraded the ability of the DRNN model to correctly classify the network traffic samples in the minority classes. Furthermore, the time taken to train the DRNN model with 2,201,112 network traffic samples in the training set and the time taken to test the model with 1,467,410 samples in the testing set were s and s, respectively.
5.2. Results of S-DRNN Model
SMOTE method was introduced to mitigate the adverse effect of high class imbalance on the classification performance of the DRNN model as earlier discussed in Section 5.1. This method generated a total of 4,612,442 synthetic network traffic samples in s to achieve class balance across the 11 classes. Table 5 shows the distribution of network traffic samples that were used to train the S-DRNN model. Figure 5 shows that the training loss of the S-DRNN model decreased from to as the number of epochs increased from 1 to 20. Similarly, its validation loss decreased from to . Compared to the DRNN model, the initial training loss of the S-DRNN model reduced by , and its final training loss reduced by . Likewise, the initial validation loss of the S-DRNN model reduced by , and its final validation loss reduced by . Therefore, the S-DRNN model was more robust against under-fitting and over-fitting than the DRNN model. Table 4 and Table 6 shows that the classification performance of the S-DRNN model was better than that of the DRNN model, most especially in minority classes. Specifically, the SMOTE method that was introduced in the training of the S-DRNN model increased the:
- precision by , recall by , F1 score by , BACC by , GM by , and MCC by , for DDH class;
- precision by , recall by , F1 score by , BACC by , GM by , and MCC by , for DH class;
- recall by , F1 score by , BACC by , and MCC by , for Norm class;
- precision by , recall by , F1 score by , BACC by , GM by , and MCC by , for DE class; and
- precision by , F1 score by , GM by , and MCC by , for KL class.
However, Table 3 shows that the increase in the number of network traffic samples increased the data size of the feature set used for the training of the S-DRNN model by , compared to the data size of the feature set used for the training of the DRNN model. The time taken to train the S-DRNN model with 6813554 network traffic samples in its training set was s, and the time taken to test the model with 1,467,410 samples in its testing set was s. Therefore, more time was spent on training the S-DRNN model than the DRNN model.
5.3. Results of LS-DRNN Model
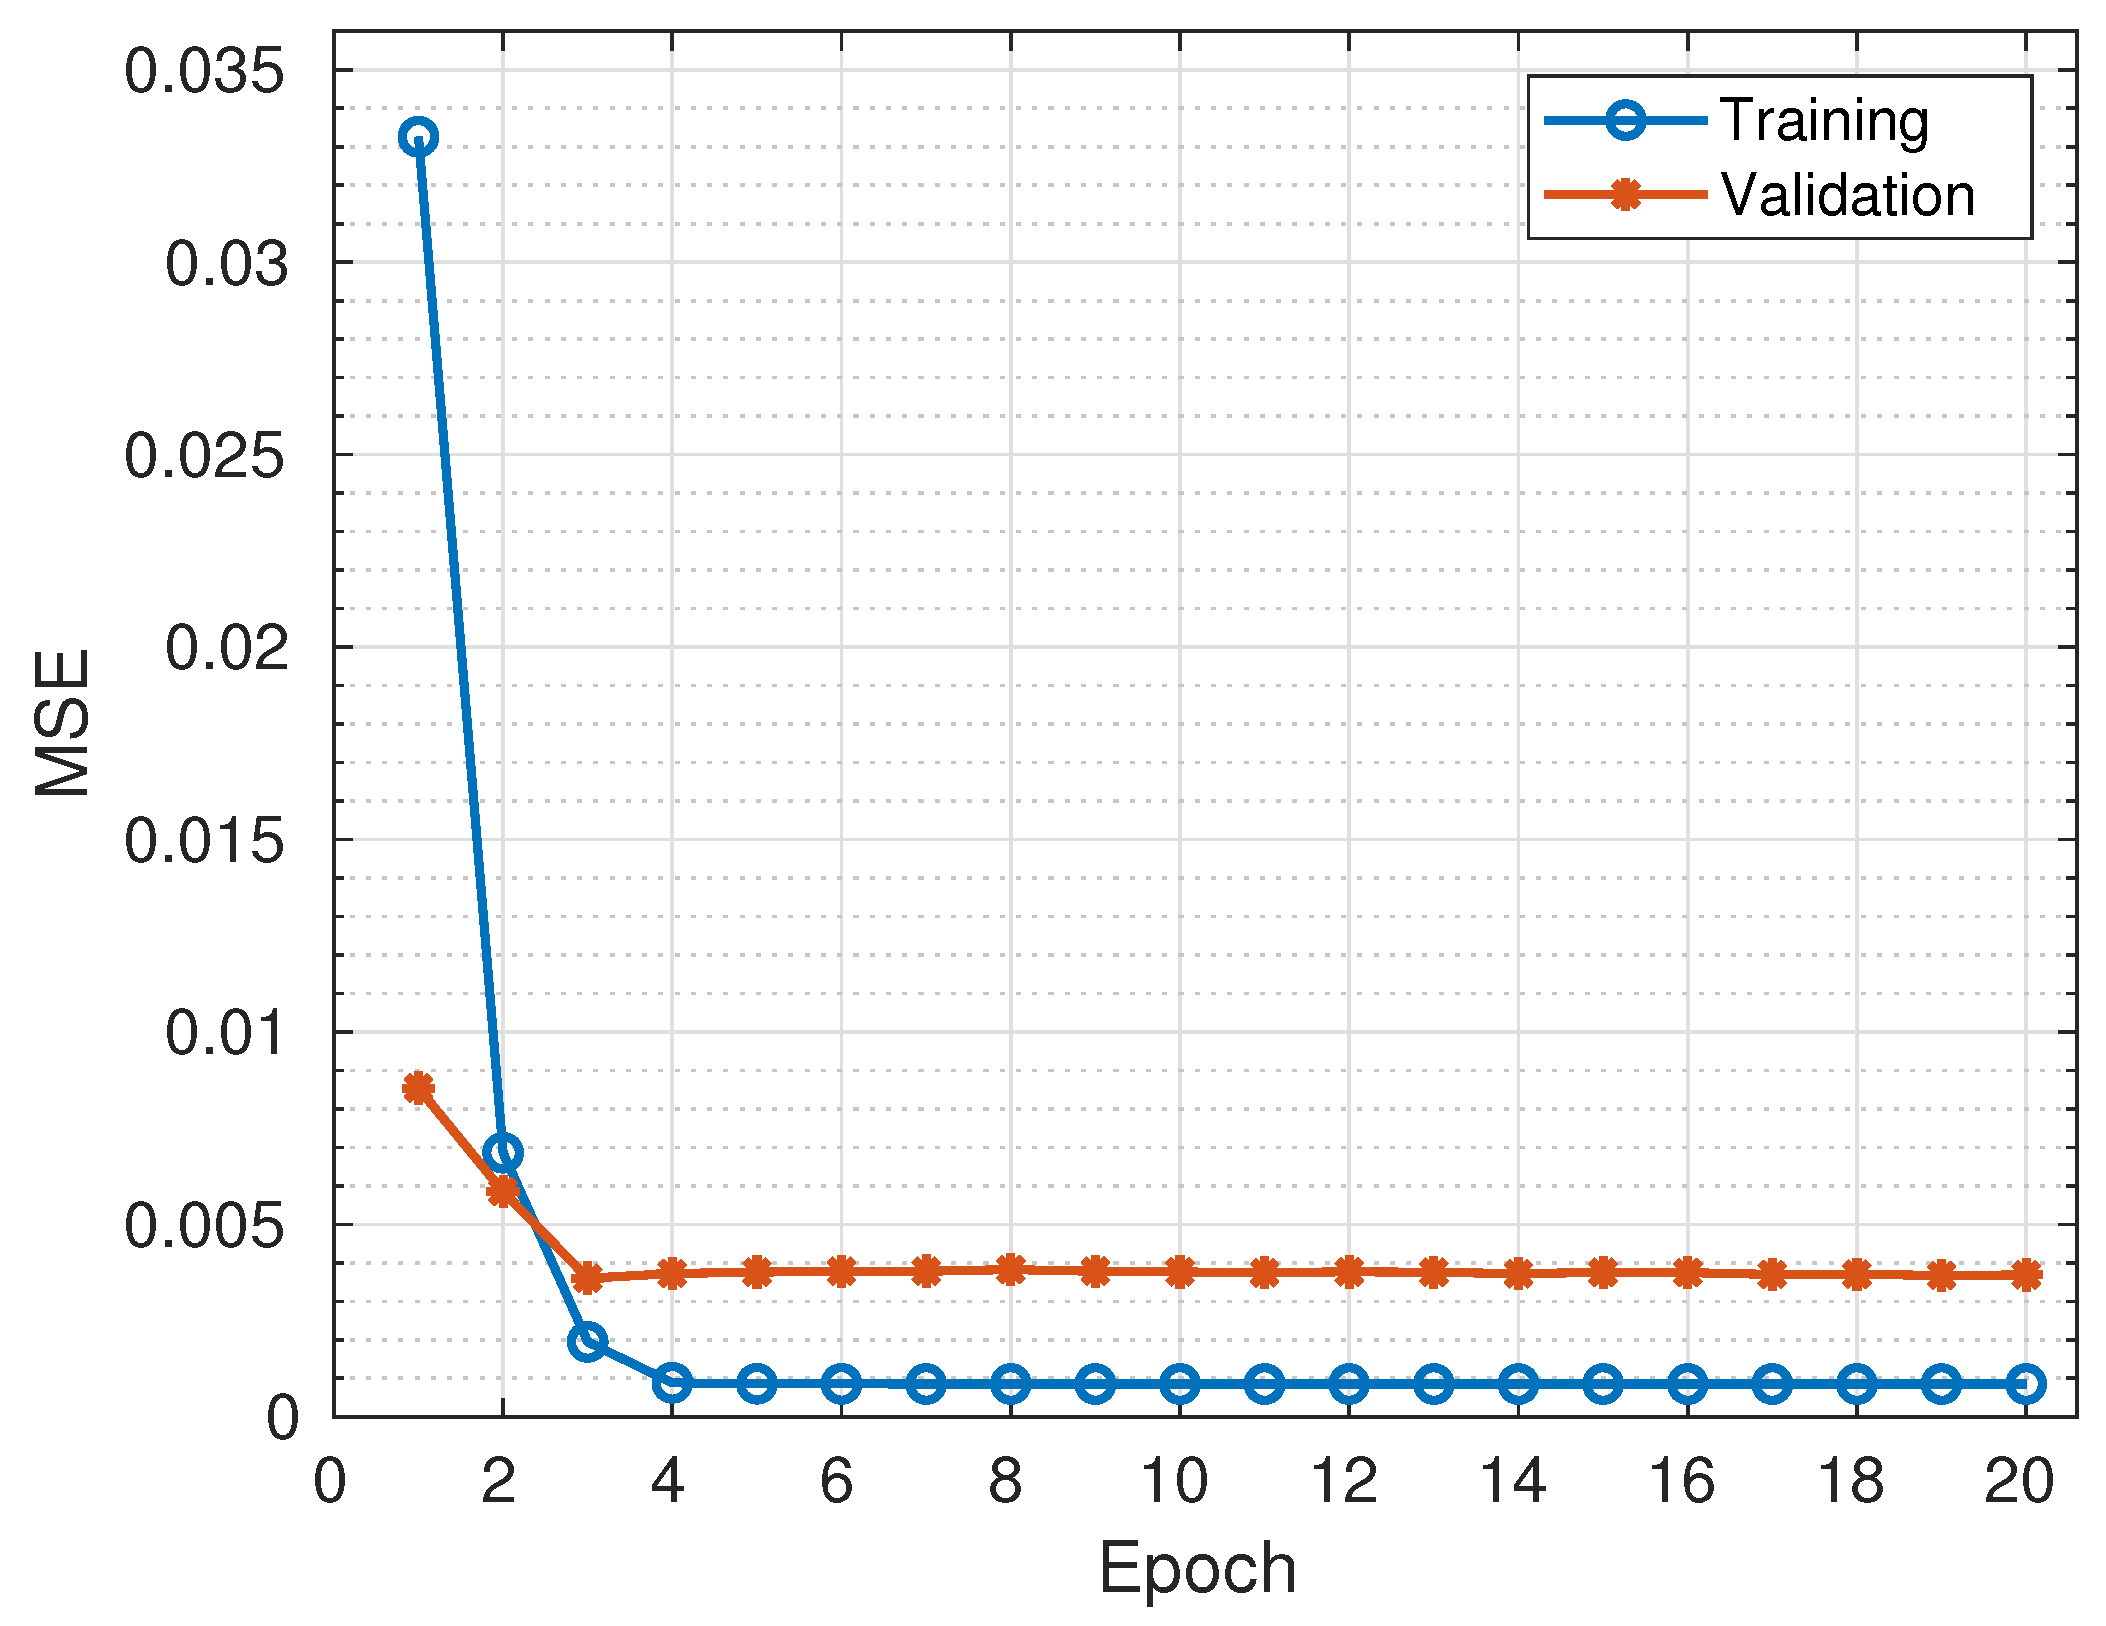
LAE method was introduced to address the challenge of large memory space required for the storage of the network traffic data that was used to train the S-DRNN model, as previously discussed in Section 5.2. This method reduced the feature dimensionality of 3,668,045 network traffic samples in the training set from 37 to 10 in s. Consequently, Table 3 shows that the data size of the feature set of the LS-DRNN model reduced by and , compared to the data size of the feature sets that were used to train DRNN and S-DRNN models, respectively. Figure 7 shows that the reconstruction loss of the LAE method decreased from to as the number of epochs increased from 1 to 20. Similarly, its validation loss decreased from to . Low reconstruction loss implies that the output of LAE (i.e., low-dimensional network traffic features) is similar to the high-dimensional network traffic features without any significant loss of information.
SMOTE method generated a total of 4,612,442 synthetic network traffic samples in s to achieve class balance across the 11 classes. Table 3 shows that the LAE method that was introduced in the LS-DRNN model reduced the sampling time by , compared to the sampling time in the S-DRNN model. Figure 5 shows that the training loss of the LS-DRNN model decreased from to as the number of epochs increased from 1 to 20. Similarly, its validation loss decreased from to . The consistent decrease in training loss and validation loss, as the number of epochs increased, implies that the LS-DRNN model neither under-fit nor over-fit the network traffic data in the training and validation sets, respectively.
Table 4 and Table 7 shows that the classification performance of the LS-DRNN model was better than that of the DRNN model, and it is similar to that of the S-DRNN model. Specifically, the LAE and SMOTE methods that were introduced in the training of the LS-DRNN model increased the:
- recall by , F1 score by , BACC by , and MCC by , for DDH class;
- recall by , and BACC by , for DH class;
- recall by , and BACC by , for Norm class;
- precision by , recall by , F1 score by , BACC by , GM by , and MCC by , for DE class; and
- precision by , F1 score by , GM by , and MCC by , for KL class.
The detail of the detection rates and misclassification rates of the LS-DRNN model in each of the 11 classes is available in Figure 8. Table 8 and Table 9 show that the LS-DRNN model demonstrated better classification performance and faster detection speed than state-of-the-art ML and DL models. The time taken to train the LS-DRNN model with 6,813,554 network traffic samples in its training set was s, and the time taken to test the model with 1,467,410 samples in its testing set was s. Table 3 shows that having the lowest testing time, the LS-DRNN model achieved the fastest detection speed, compared to DRNN and S-DRNN models. In summary, the results of this study show that the LAE method reduced the dimensionality of network traffic features in the training set from 37 to 10, and this consequently reduced the memory space required for data storage by . SMOTE method helped the LS-DRNN model to achieve high classification performance in minority classes, and the overall detection rate increased by .
6. Conclusions
In this paper, we developed a memory-efficient DL method, named LS-DRNN, to detect botnet attacks in IoT networks. This method exploited the combined benefits of an unsupervised DL method (LAE), a sampling method (SMOTE), and a supervised DL method (DRNN) for efficient performance. The effectiveness of the LS-DRNN method was evaluated with the highly imbalanced network traffic features and their corresponding labels in the Bot-IoT dataset. First, the LAE method reduced the dimensionality of the network traffic features to minimise the memory space required for the storage of training data in IoT back-end server or cloud platform. Then, SMOTE method generated a total of 4,612,442 synthetic network traffic samples to achieve class balance across the 11 classes. Lastly, DRNN performed a multi-class classification of balanced, low-dimensional network traffic features to identify botnet attacks in IoT networks.
The results of our experiments showed that the dimensionality of the network traffic features reduced from 37 to 10. Consequently, the memory space required for the storage of training data reduced by . Furthermore, the LS-DRNN model achieved high classification performance in the minority classes. Compared to the DRNN model, the overall precision, recall, F1 score, BACC, GM, and MCC of the LS-DRNN model increased by , , , , , and , respectively. Furthermore, the LS-DRNN model demonstrated better classification performance and faster detection speed than state-of-the-art ML and DL models. Therefore, the findings of this study validate the effectiveness of the LS-DRNN model for efficient botnet attack detection in IoT networks.
Author Contributions
Conceptualization, S.I.P., B.A. and R.A.; methodology, S.I.P., B.A., R.A., M.H., A.A.A.; software, S.I.P.; validation, S.I.P., B.A. and R.A.; formal analysis, S.I.P. and B.A.; investigation, S.I.P.; resources, B.A. and R.A.; data curation, S.I.P.; writing—original draft preparation, S.I.P.; writing—review and editing, B.A., R.A., M.H. and A.A.A.; visualization, S.I.P. and B.A.; supervision, B.A. and M.H.; project administration, B.A., R.A. and M.H.; funding acquisition, B.A. and A.A.A. All authors have read and agreed to the published version of the manuscript.
Funding
This research was funded in part by Cyraatek Ltd UK, the Faculty of Science & Engineering, Manchester Metropolitan University, and in part by ENERGY-IQ project, a UK-Canada Power Forward Smart Grid Demonstrator project funded by The Department for Business, Energy and Industrial Strategy (BEIS) under Grant 7454460; the NICE (Nigerian Intelligent Clean Energy) Marketplace project funded by the Department for International Development (DFID); and Covenant University Centre for Research, Innovation and Discovery (CUCRID).
Data Availability Statement
Bot-IoT data set is available from https://ieee-dataport.org/documents/bot-iot-dataset (accessed on 1 February 2021).
Conflicts of Interest
The authors declare no conflict of interest. The funders had no role in the design of the study; in the collection, analyses, or interpretation of data; in the writing of the manuscript, or in the decision to publish the results.
References
- Aceto, G.; Persico, V.; Pescape, A. A survey on information and communication technologies for Industry 4.0: State-of-the-art, taxonomies, perspectives, and challenges. IEEE Commun. Surv. Tutor. 2019, 21, 3467–3501. [Google Scholar] [CrossRef]
- Williams, J.M.; Khanna, R.; Ruiz-Rosero, J.P.; Pisharody, G.; Qian, Y.; Carlson, C.R.; Liu, H.; Ramirez-Gonzalez, G. Weaving the wireless web: Toward a low-power, dense wireless sensor network for the industrial IoT. IEEE Microw. Mag. 2017, 18, 40–63. [Google Scholar] [CrossRef]
- Darvishi, H.; Ciuonzo, D.; Eide, E.R.; Rossi, P.S. Sensor-Fault Detection, Isolation and Accommodation for Digital Twins via Modular Data-Driven Architecture. IEEE Sens. J. 2020. [Google Scholar] [CrossRef]
- Vormayr, G.; Zseby, T.; Fabini, J. Botnet communication patterns. IEEE Commun. Surv. Tutor. 2017, 19, 2768–2796. [Google Scholar] [CrossRef]
- HaddadPajouh, H.; Dehghantanha, A.; Parizi, R.M.; Aledhari, M.; Karimipour, H. A survey on internet of things security: Requirements, challenges, and solutions. Internet Things 2019, 100129. [Google Scholar] [CrossRef]
- Tange, K.; De Donno, M.; Fafoutis, X.; Dragoni, N. A systematic survey of industrial Internet of Things security: Requirements and fog computing opportunities. IEEE Commun. Surv. Tutor. 2020, 22, 2489–2520. [Google Scholar] [CrossRef]
- Farooq, M.J.; Zhu, Q. Modeling, analysis, and mitigation of dynamic botnet formation in wireless iot networks. IEEE Trans. Inf. Forensics Secur. 2019, 14, 2412–2426. [Google Scholar] [CrossRef] [Green Version]
- Zhao, B.; Ji, S.; Lee, W.H.; Lin, C.; Weng, H.; Wu, J.; Zhou, P.; Fang, L.; Beyah, R. A Large-scale Empirical Study on the Vulnerability of Deployed IoT Devices. IEEE Trans. Dependable Secur. Comput. 2020, 1. [Google Scholar] [CrossRef]
- Yin, L.; Luo, X.; Zhu, C.; Wang, L.; Xu, Z.; Lu, H. ConnSpoiler: Disrupting C&C communication of IoT-based botnet through fast detection of anomalous domain queries. IEEE Trans. Ind. Inform. 2019, 16, 1373–1384. [Google Scholar]
- Popoola, S.I.; Adebisi, B.; Hammoudeh, M.; Gui, G.; Gacanin, H. Hybrid Deep Learning for Botnet Attack Detection in the Internet-of-Things Networks. IEEE Internet Things J. 2021, 8, 4944–4956. [Google Scholar] [CrossRef]
- Koroniotis, N.; Moustafa, N.; Sitnikova, E.; Turnbull, B. Towards the development of realistic botnet dataset in the internet of things for network forensic analytics: Bot-iot dataset. Future Gener. Comput. Syst. 2019, 100, 779–796. [Google Scholar] [CrossRef] [Green Version]
- Yu, J. HEH, a New IoT P2P Botnet Going after Weak Telnet Services, October 2020. Available online: https://blog.netlab.360.com/heh-an-iot-p2p-botnet/ (accessed on 19 November 2020).
- Raza, S.; Wallgren, L.; Voigt, T. SVELTE: Real-time intrusion detection in the Internet of Things. AD Hoc Netw. 2013, 11, 2661–2674. [Google Scholar] [CrossRef]
- Bertino, E.; Islam, N. Botnets and internet of things security. Computer 2017, 50, 76–79. [Google Scholar] [CrossRef]
- Mishra, P.; Varadharajan, V.; Tupakula, U.; Pilli, E.S. A detailed investigation and analysis of using machine learning techniques for intrusion detection. IEEE Commun. Surv. Tutor. 2018, 21, 686–728. [Google Scholar] [CrossRef]
- Buczak, A.L.; Guven, E. A survey of data mining and machine learning methods for cyber security intrusion detection. IEEE Commun. Surv. Tutor. 2015, 18, 1153–1176. [Google Scholar] [CrossRef]
- Xin, Y.; Kong, L.; Liu, Z.; Chen, Y.; Li, Y.; Zhu, H.; Gao, M.; Hou, H.; Wang, C. Machine learning and deep learning methods for cybersecurity. IEEE Access 2018, 6, 35365–35381. [Google Scholar] [CrossRef]
- Gümüşbaş, D.; Yıldırım, T.; Genovese, A.; Scotti, F. A Comprehensive Survey of Databases and Deep Learning Methods for Cybersecurity and Intrusion Detection Systems. IEEE Syst. J. 2020. [Google Scholar] [CrossRef]
- Chaabouni, N.; Mosbah, M.; Zemmari, A.; Sauvignac, C.; Faruki, P. Network intrusion detection for IoT security based on learning techniques. IEEE Commun. Surv. Tutor. 2019, 21, 2671–2701. [Google Scholar] [CrossRef]
- Mahdavifar, S.; Ghorbani, A.A. Application of deep learning to cybersecurity: A survey. Neurocomputing 2019, 347, 149–176. [Google Scholar] [CrossRef]
- Ferrag, M.A.; Maglaras, L. DeepCoin: A Novel Deep Learning and Blockchain-Based Energy Exchange Framework for Smart Grids. IEEE Trans. Eng. Manag. 2019. [Google Scholar] [CrossRef] [Green Version]
- Ferrag, M.A.; Maglaras, L.; Moschoyiannis, S.; Janicke, H. Deep learning for cyber security intrusion detection: Approaches, datasets, and comparative study. J. Inf. Secur. Appl. 2020, 50, 102419. [Google Scholar] [CrossRef]
- Alkadi, O.; Moustafa, N.; Turnbull, B.; Choo, K.K.R. A Deep Blockchain Framework-enabled Collaborative Intrusion Detection for Protecting IoT and Cloud Networks. IEEE Internet Things J. 2020. [Google Scholar] [CrossRef]
- Lee, S.; Abdullah, A.; Jhanjhi, N.; Kok, S. Classification of botnet attacks in IoT smart factory using honeypot combined with machine learning. PeerJ Comput. Sci. 2021, 7, e350. [Google Scholar] [CrossRef] [PubMed]
- Zhang, Y.; Xu, J.; Wang, Z.; Geng, R.; Choo, K.K.R.; Pérez-Díaz, J.A.; Zhu, D. Efficient and Intelligent Attack Detection in Software Defined IoT Networks. In Proceedings of the 2020 IEEE International Conference on Embedded Software and Systems (ICESS), Shanghai, China, 10–11 December 2020; pp. 1–9. [Google Scholar]
- Filus, K.; Domańska, J.; Gelenbe, E. Random Neural Network for Lightweight Attack Detection in the IoT. In Symposium on Modelling, Analysis, and Simulation of Computer and Telecommunication Systems; Springer: Berlin, Germany, 2020; pp. 79–91. [Google Scholar]
- Lawal, M.A.; Shaikh, R.A.; Hassan, S.R. An Anomaly Mitigation Framework for IoT Using Fog Computing. Electronics 2020, 9, 1565. [Google Scholar] [CrossRef]
- Oreški, D.; Andročec, D. Genetic algorithm and artificial neural network for network forensic analytics. In Proceedings of the 2020 43rd International Convention on Information, Communication and Electronic Technology (MIPRO), Opatija, Croatia, 28 September–2 October 2020; pp. 1200–1205. [Google Scholar]
- NG, B.A.; Selvakumar, S. Anomaly detection framework for Internet of things traffic using vector convolutional deep learning approach in fog environment. Future Gener. Comput. Syst. 2020, 113, 255–265. [Google Scholar]
- Ibitoye, O.; Shafiq, O.; Matrawy, A. Analyzing adversarial attacks against deep learning for intrusion detection in IoT networks. arXiv 2019, arXiv:1905.05137. [Google Scholar]
- Kumar, P.; Gupta, G.P.; Tripathi, R. Toward Design of an Intelligent Cyber Attack Detection System using Hybrid Feature Reduced Approach for IoT Networks. Arab. J. Sci. Eng. 2021, 46, 3749–3778. [Google Scholar] [CrossRef]
- Kumar, P.; Kumar, R.; Gupta, G.P.; Tripathi, R. A Distributed framework for detecting DDoS attacks in smart contract-based Blockchain-IoT Systems by leveraging Fog computing. Trans. Emerg. Telecommun. Technol. 2020, e4112. [Google Scholar] [CrossRef]
- Shafiq, M.; Tian, Z.; Bashir, A.K.; Du, X.; Guizani, M. Corrauc: A malicious bot-iot traffic detection method in iot network using machine learning techniques. IEEE Internet Things J. 2020. [Google Scholar] [CrossRef]
- Koroniotis, N.; Moustafa, N.; Sitnikova, E. A new network forensic framework based on deep learning for Internet of Things networks: A particle deep framework. Future Gener. Comput. Syst. 2020, 110, 91–106. [Google Scholar] [CrossRef]
- Shafiq, M.; Tian, Z.; Bashir, A.K.; Du, X.; Guizani, M. IoT malicious traffic identification using wrapper-based feature selection mechanisms. Comput. Secur. 2020, 94, 101863. [Google Scholar] [CrossRef]
- Asadi, M.; Jamali, M.A.J.; Parsa, S.; Majidnezhad, V. Detecting botnet by using particle swarm optimization algorithm based on voting system. Future Gener. Comput. Syst. 2020, 107, 95–111. [Google Scholar] [CrossRef]
- Huong, T.T.; Bac, T.P.; Long, D.M.; Thang, B.D.; Luong, T.D.; Binh, N.T. An Efficient Low Complexity Edge-Cloud Framework for Security in IoT Networks. In Proceedings of the 2020 IEEE Eighth International Conference on Communications and Electronics (ICCE), Phu Quoc Island, Vietnam, 13–15 January 2021; pp. 533–539. [Google Scholar]
- Kumar, P.; Gupta, G.P.; Tripathi, R. TP2SF: A Trustworthy Privacy-Preserving Secured Framework for sustainable smart cities by leveraging blockchain and machine learning. J. Syst. Archit. 2020, 115, 101954. [Google Scholar] [CrossRef]
- Alshamkhany, M.; Alshamkhany, W.; Mansour, M.; Khan, M.; Dhou, S.; Aloul, F. Botnet Attack Detection using Machine Learning. In Proceedings of the 2020 14th International Conference on Innovations in Information Technology (IIT), Al Ain, United Arab Emirates, 17–18 November 2020; pp. 203–208. [Google Scholar]
- Sriram, S.; Vinayakumar, R.; Alazab, M.; Soman, K. Network Flow based IoT Botnet Attack Detection using Deep Learning. In Proceedings of the IEEE INFOCOM 2020-IEEE Conference on Computer Communications Workshops (INFOCOM WKSHPS), Toronto, ON, Canada, 6–9 July 2020; pp. 189–194. [Google Scholar]
- Liaqat, S.; Akhunzada, A.; Shaikh, F.S.; Giannetsos, A.; Jan, M.A. SDN orchestration to combat evolving cyber threats in Internet of Medical Things (IoMT). Comput. Commun. 2020, 160, 697–705. [Google Scholar] [CrossRef]
- Soe, Y.N.; Santosa, P.I.; Hartanto, R. DDoS Attack Detection Based on Simple ANN with SMOTE for IoT Environment. In Proceedings of the 2019 Fourth International Conference on Informatics and Computing (ICIC), Semarang, Indonesia, 16–17 October 2019; pp. 1–5. [Google Scholar] [CrossRef]
- Bagui, S.; Li, K. Resampling imbalanced data for network intrusion detection datasets. J. Big Data 2021, 8, 1–41. [Google Scholar] [CrossRef]
- Derhab, A.; Aldweesh, A.; Emam, A.Z.; Khan, F.A. Intrusion Detection System for Internet of Things Based on Temporal Convolution Neural Network and Efficient Feature Engineering. Wirel. Commun. Mob. Comput. 2020, 2020, 6689134. [Google Scholar] [CrossRef]
- Popoola, S.I.; Adebisi, B.; Ande, R.; Hammoudeh, M.; Anoh, K.; Atayero, A.A. SMOTE-DRNN: A Deep Learning Algorithm for Botnet Detection in the Internet-of-Things Networks. Sensors 2021, 21, 2985. [Google Scholar] [CrossRef]
- Mulyanto, M.; Faisal, M.; Prakosa, S.W.; Leu, J.S. Effectiveness of Focal Loss for Minority Classification in Network Intrusion Detection Systems. Symmetry 2021, 13, 4. [Google Scholar] [CrossRef]
- Injadat, M.; Moubayed, A.; Shami, A. Detecting botnet attacks in IoT environments: An optimized machine learning approach. arXiv 2020, arXiv:2012.11325. [Google Scholar]
- Khan, M.A.; Kim, Y. Deep Learning-Based Hybrid Intelligent Intrusion Detection System. Comput. Mater. Contin. 2021, 68, 671–687. [Google Scholar] [CrossRef]
- Roopak, M.; Yun Tian, G.; Chambers, J. Deep Learning Models for Cyber Security in IoT Networks. In Proceedings of the 2019 IEEE 9th Annual Computing and Communication Workshop and Conference (CCWC), Las Vegas, NV, USA, 7–9 January 2019; pp. 0452–0457. [Google Scholar] [CrossRef]
- He, K.; Zhang, X.; Ren, S.; Sun, J. Delving deep into rectifiers: Surpassing human-level performance on imagenet classification. In Proceedings of the IEEE International Conference on Computer Vision, Santiago, Chile, 7–13 December 2015; pp. 1026–1034. [Google Scholar]
- Ma, X.; Shi, W. AESMOTE: Adversarial Reinforcement Learning with SMOTE for Anomaly Detection. IEEE Trans. Netw. Sci. Eng. 2020. [Google Scholar] [CrossRef]
- Ling, C.X.; Li, C. Data Mining for Direct Marketing: Problems and Solutions; Kdd: Washington, DC, USA, 1998; Volume 98, pp. 73–79. [Google Scholar]
- Japkowicz, N. The class imbalance problem: Significance and strategies. In Proceedings of the International Conference on Artificial Intelligence; Citeseer: University Park, PA, USA, 2000; Volume 56. [Google Scholar]
- Chawla, N.V.; Bowyer, K.W.; Hall, L.O.; Kegelmeyer, W.P. SMOTE: Synthetic minority over-sampling technique. J. Artif. Intell. Res. 2002, 16, 321–357. [Google Scholar] [CrossRef]
- Kingma, D.P.; Ba, J. Adam: A method for stochastic optimization. arXiv 2014, arXiv:1412.6980. [Google Scholar]
- Ferrag, M.A.; Maglaras, L.; Ahmim, A.; Derdour, M.; Janicke, H. RDTIDS: Rules and Decision Tree-Based Intrusion Detection System for Internet-of-Things Networks. Future Internet 2020, 12, 44. [Google Scholar] [CrossRef] [Green Version]
Figure 1.
Block diagram showing the proposed methodology.

Figure 2.
LAE model for feature dimensionality reduction.

Figure 3.
SMOTE method for the generation of synthetic network traffic features.

Figure 4.
DRNN model for multi-class classification.

Figure 5.
Cross-entropy losses during training.

Figure 6.
Cross-entropy losses during validation.

Figure 7.
Reconstruction losses of LAE model.

Figure 8.
Confusion matrix of LS-DRNN model.


Table 1.
Review of related works.
| Dimensionality Reduction Method | Class Balance Method | References |
|---|---|---|
| Feature selection | None | [11,24,25,26,27,28,29,30,31,32,33,34,35,36] |
| PCA | None | [37,38,39] |
| t-SNE | None | [40] |
| LAE | None | [10] |
| None | Up-sampling | [41] |
| None | SMOTE | [42,43,44,45] |
| Feature selection | Focal loss | [46] |
| Feature selection | SMOTE | [47] |
| LAE | SMOTE | This paper |
Table 2.
Network traffic samples in the training, validation, and testing sets.
| Class | Training | Validation | Testing |
|---|---|---|---|
| DDH | 588 | 197 | 204 |
| DDT | 586,393 | 195,713 | 195,274 |
| DDU | 568,760 | 189,407 | 190,088 |
| DH | 906 | 311 | 268 |
| DT | 369,965 | 122,861 | 122,974 |
| DU | 619,414 | 206,772 | 206,789 |
| Norm | 290 | 86 | 101 |
| OSF | 10,795 | 3537 | 3582 |
| SS | 43,949 | 14,806 | 14,413 |
| DE | 4 | 1 | 1 |
| KL | 48 | 14 | 11 |
Table 3.
Data size and computation time.
| Model | Data Size (MB) | Encoding Time (s) | Sampling Time (s) | Train Time (s) | Test Time (s) |
|---|---|---|---|---|---|
| Ferrag et al. [21] | 1085.88 | - | - | - | - |
| Ferrag et al. [22] | 1085.88 | - | - | - | - |
| Ferrag et al. [56] | 1085.88 | - | - | - | - |
| Alkadi et al. [23] | 1085.88 | - | - | - | - |
| DRNN | 1085.88 | - | - | 207.72 | 0.7552 |
| S-DRNN | 2680.24 | - | 548.72 | 603.83 | 0.7558 |
| LS-DRNN | 146.74 | 204.67 | 15.37 | 616.96 | 0.7181 |
Table 4.
Classification performance of DRNN model.
| Metric | DDH | DDT | DDU | DH | DT | DU | Norm | OSF | SS | DE | KL | Overall |
|---|---|---|---|---|---|---|---|---|---|---|---|---|
| Accuracy | 99.99 | 99.94 | 100.00 | 99.99 | 99.95 | 100.00 | 100.00 | 100.00 | 100.00 | 100.00 | 100.00 | 99.99 |
| Precision | 95.04 | 99.79 | 99.99 | 92.09 | 99.99 | 100.00 | 100.00 | 100.00 | 99.98 | 0.00 | 87.50 | 88.58 |
| Recall | 85.35 | 100.00 | 100.00 | 94.29 | 99.68 | 99.99 | 97.65 | 100.00 | 100.00 | 0.00 | 100.00 | 88.81 |
| F1 score | 89.93 | 99.89 | 99.99 | 93.18 | 99.84 | 99.99 | 98.81 | 100.00 | 99.99 | 0.00 | 93.33 | 88.63 |
| FPR | 0.00 | 0.08 | 0.00 | 0.00 | 0.00 | 0.00 | 0.00 | 0.00 | 0.00 | 0.00 | 0.00 | 0.01 |
| NPV | 100.00 | 100.00 | 100.00 | 100.00 | 99.94 | 99.99 | 100.00 | 100.00 | 100.00 | 100.00 | 100.00 | 99.99 |
| BACC | 92.67 | 99.96 | 100.00 | 97.14 | 99.84 | 99.99 | 98.82 | 100.00 | 100.00 | 50.00 | 100.00 | 94.40 |
| GM | 97.48 | 99.89 | 99.99 | 95.96 | 99.96 | 100.00 | 100.00 | 100.00 | 99.99 | 0.00 | 93.54 | 89.71 |
| MCC | 90.06 | 99.86 | 99.99 | 93.18 | 99.80 | 99.99 | 98.82 | 100.00 | 99.99 | 0.00 | 93.54 | 88.66 |
Table 5.
Sample distribution of training set for S-DRNN model.
| Class | Original Data | After Sampling | Generated Samples |
|---|---|---|---|
| DDH | 588 | 619,414 | 618,826 |
| DDT | 586,393 | 619,414 | 33,021 |
| DDU | 568,760 | 619,414 | 50,654 |
| DH | 906 | 619,414 | 618,508 |
| DT | 369,965 | 619,414 | 249,449 |
| DU | 619,414 | 619,414 | 0 |
| Norm | 290 | 619,414 | 619,124 |
| OSF | 10,795 | 619,414 | 608,619 |
| SS | 43,949 | 619,414 | 575,465 |
| DE | 4 | 619,414 | 619,410 |
| KL | 48 | 619,414 | 619,366 |
| Total | 2,201,112 | 6,813,554 | 4,612,442 |
Table 6.
Classification performance of S-DRNN model.
| Metric | DDH | DDT | DDU | DH | DT | DU | Norm | OSF | SS | DE | KL | Overall |
|---|---|---|---|---|---|---|---|---|---|---|---|---|
| Accuracy | 100.00 | 99.99 | 100.00 | 100.00 | 99.99 | 100.00 | 100.00 | 100.00 | 100.00 | 100.00 | 100.00 | 100.00 |
| Precision | 100.00 | 99.99 | 100.00 | 99.52 | 99.94 | 100.00 | 100.00 | 100.00 | 99.99 | 100.00 | 100.00 | 99.95 |
| Recall | 100.00 | 99.97 | 100.00 | 99.52 | 99.99 | 100.00 | 100.00 | 99.96 | 100.00 | 100.00 | 100.00 | 99.95 |
| F1 score | 100.00 | 99.98 | 100.00 | 99.52 | 99.97 | 100.00 | 100.00 | 99.98 | 100.00 | 100.00 | 100.00 | 99.95 |
| FPR | 0.00 | 0.00 | 0.00 | 0.00 | 0.01 | 0.00 | 0.00 | 0.00 | 0.00 | 0.00 | 0.00 | 0.00 |
| NPV | 100.00 | 99.99 | 100.00 | 100.00 | 100.00 | 100.00 | 100.00 | 100.00 | 100.00 | 100.00 | 100.00 | 100.00 |
| BACC | 100.00 | 99.98 | 100.00 | 99.76 | 99.99 | 100.00 | 100.00 | 99.98 | 100.00 | 100.00 | 100.00 | 99.97 |
| GM | 100.00 | 99.99 | 100.00 | 99.76 | 99.97 | 100.00 | 100.00 | 100.00 | 100.00 | 100.00 | 100.00 | 99.97 |
| MCC | 100.00 | 99.97 | 100.00 | 99.52 | 99.96 | 100.00 | 100.00 | 99.98 | 100.00 | 100.00 | 100.00 | 99.95 |
Table 7.
Classification performance of LS-DRNN model.
| Metric | DDH | DDT | DDU | DH | DT | DU | Norm | OSF | SS | DE | KL | Overall |
|---|---|---|---|---|---|---|---|---|---|---|---|---|
| Accuracy | 100.00 | 99.68 | 99.93 | 99.99 | 99.69 | 99.93 | 100.00 | 100.00 | 100.00 | 100.00 | 100.00 | 99.93 |
| Precision | 86.67 | 99.16 | 99.95 | 87.14 | 99.51 | 99.79 | 93.41 | 100.00 | 99.98 | 100.00 | 100.00 | 96.87 |
| Recall | 99.36 | 99.66 | 99.77 | 100.00 | 98.65 | 99.95 | 100.00 | 99.93 | 99.94 | 100.00 | 100.00 | 99.75 |
| F1 score | 92.58 | 99.41 | 99.86 | 93.13 | 99.08 | 99.87 | 96.59 | 99.96 | 99.96 | 100.00 | 100.00 | 98.22 |
| FPR | 0.00 | 0.31 | 0.02 | 0.01 | 0.10 | 0.08 | 0.00 | 0.00 | 0.00 | 0.00 | 0.00 | 0.05 |
| NPV | 100.00 | 99.88 | 99.92 | 100.00 | 99.73 | 99.98 | 100.00 | 100.00 | 100.00 | 100.00 | 100.00 | 99.95 |
| BACC | 99.68 | 99.67 | 99.87 | 100.00 | 99.28 | 99.93 | 100.00 | 99.96 | 99.97 | 100.00 | 100.00 | 99.85 |
| GM | 93.09 | 99.52 | 99.93 | 93.35 | 99.62 | 99.88 | 96.65 | 100.00 | 99.99 | 100.00 | 100.00 | 98.37 |
| MCC | 92.80 | 99.19 | 99.81 | 93.34 | 98.89 | 99.82 | 96.65 | 99.96 | 99.96 | 100.00 | 100.00 | 98.22 |
Table 8.
Recall of ML and DL models across 11 classes.
| Model | DDH | DDT | DDU | DH | DT | DU | Norm | OSF | SS | DE | KL |
|---|---|---|---|---|---|---|---|---|---|---|---|
| RNN [21] | 100.00 | 100.00 | 100.00 | 100.00 | 100.00 | 100.00 | - | 92.22 | 87.91 | 99.75 | 77.91 |
| SVM [21] | 62.24 | 89.56 | 98.14 | 70.14 | 71.26 | 100.00 | - | 70.14 | 72.82 | 89.67 | 65.12 |
| RF [21] | 82.26 | 88.28 | 55.26 | 82.20 | 81.77 | 82.99 | - | 82.20 | 69.82 | 86.55 | 81.56 |
| NB [21] | 50.78 | 78.67 | 78.50 | 68.68 | 65.56 | 100 | - | 68.68 | 65.21 | 66.55 | 65.62 |
| DNN [22] | 96.62 | 96.22 | 96.12 | 96.70 | 96.63 | 96.53 | - | 96.14 | 96.43 | 100.00 | 96.76 |
| RNN [22] | 96.56 | 96.65 | 96.67 | 96.87 | 96.77 | 96.76 | - | 96.76 | 96.87 | 100.00 | 97.00 |
| CNN [22] | 97.01 | 97.00 | 97.01 | 97.51 | 97.11 | 97.11 | - | 97.00 | 97.10 | 100.00 | 98.10 |
| RBM [22] | 96.54 | 96.51 | 96.52 | 96.80 | 96.57 | 96.56 | - | 96.30 | 96.30 | 100.00 | 97.11 |
| DBN [22] | 96.72 | 96.60 | 96.62 | 96.91 | 96.72 | 96.83 | - | 96.61 | 96.60 | 100.00 | 97.66 |
| DBM [22] | 96.21 | 96.08 | 96.11 | 96.99 | 96.33 | 96.65 | - | 96.08 | 96.07 | 100.00 | 98.22 |
| DAE [22] | 97.99 | 97.71 | 97.99 | 98.41 | 98.00 | 98.03 | - | 97.72 | 97.71 | 100.00 | 98.33 |
| RDTIDS [56] | 93.17 | 95.84 | 98.66 | 77.47 | 100.00 | 100.00 | - | 98.16 | 99.47 | 100.00 | 100.00 |
| BLSTM [23] | 99.25 | 99.10 | 99.45 | 99.75 | 99.65 | 99.79 | - | 92.77 | 92.20 | 96.50 | 89.90 |
| LS-DRNN | 99.36 | 99.66 | 99.77 | 100.00 | 98.65 | 99.95 | 100.00 | 99.93 | 99.94 | 100.00 | 100.00 |
Table 9.
Overall classification performance of ML and DL models.
| Model | Accuracy | Precision | Recall | F1 Score | FPR | NPV | AUC | GM | MCC | (s) | (s) |
|---|---|---|---|---|---|---|---|---|---|---|---|
| RNN [21] | 99.91 | - | - | - | 1.28 | - | - | - | - | 201.70 | 44.23 |
| SVM [21] | - | - | - | - | 2.99 | - | - | - | - | - | - |
| RF [21] | - | - | - | - | 4.29 | - | - | - | - | - | - |
| NB [21] | - | - | - | - | 3.24 | - | - | - | - | - | - |
| DNN [22] | 98.22 | - | - | - | 1.14 | - | - | - | - | 991.60 | - |
| RNN [22] | 98.31 | - | - | - | 1.10 | - | - | - | - | 1400.60 | - |
| CNN [22] | 98.37 | - | - | - | 1.00 | - | - | - | - | 1367.20 | - |
| RBM [22] | 98.28 | - | - | - | 1.13 | - | - | - | - | 2111.90 | - |
| DBN [22] | 98.31 | - | - | - | 1.12 | - | - | - | - | 2921.70 | - |
| DBM [22] | 98.38 | - | - | - | 1.11 | - | - | - | - | 2800.10 | - |
| DAE [22] | 98.39 | - | - | - | 1.11 | - | - | - | - | 2816.20 | - |
| RDTIDS [56] | 97.00 | - | - | - | 1.12 | - | - | - | - | 195.50 | 2.27 |
| BLSTM [23] | 98.91 | - | - | - | 1.20 | - | - | - | - | 149.60 | 69.10 |
| LS-DRNN | 99.93 | 96.87 | 99.75 | 98.22 | 0.05 | 99.95 | 99.85 | 99.37 | 98.22 | 616.96 | 0.72 |
Publisher’s Note: MDPI stays neutral with regard to jurisdictional claims in published maps and institutional affiliations. |
© 2021 by the authors. Licensee MDPI, Basel, Switzerland. This article is an open access article distributed under the terms and conditions of the Creative Commons Attribution (CC BY) license (https://creativecommons.org/licenses/by/4.0/).
Share and Cite
MDPI and ACS Style
Popoola, S.I.; Adebisi, B.; Ande, R.; Hammoudeh, M.; Atayero, A.A. Memory-Efficient Deep Learning for Botnet Attack Detection in IoT Networks. Electronics 2021, 10, 1104. https://doi.org/10.3390/electronics10091104
AMA Style
Popoola SI, Adebisi B, Ande R, Hammoudeh M, Atayero AA. Memory-Efficient Deep Learning for Botnet Attack Detection in IoT Networks. Electronics. 2021; 10(9):1104. https://doi.org/10.3390/electronics10091104
Chicago/Turabian StylePopoola, Segun I., Bamidele Adebisi, Ruth Ande, Mohammad Hammoudeh, and Aderemi A. Atayero. 2021. "Memory-Efficient Deep Learning for Botnet Attack Detection in IoT Networks" Electronics 10, no. 9: 1104. https://doi.org/10.3390/electronics10091104
Note that from the first issue of 2016, this journal uses article numbers instead of page numbers. See further details here.