Variable Thrust Rates of the Eastern Qilianshan Mountain Front, Northeastern Margin of the Tibet Plateau and Its Implication to the Topography of the Yongchangnan Shan
 Lei Jinghao
 Li Youli
 Ren Zhikun
 Hu Xiu3
  Xiong Jianguo
 Liu Jinrui
- 1Key Laboratory of Seismic and Volcanic Hazards, China Earthquake Administration, Beijing, China
- 2State Key Laboratory of Earthquake Dynamics, Institute of Geology, China Earthquake Administration, Beijing, China
- 3Key Laboratory of Earth Surface Processes of Ministry of Education, Peking University, Beijing, China
It is commonly assumed a thrust has a constant slip and uplifting rate along strike, however, this simplified model cannot always be consistent with field observations. The along strike slip patterns with variable offsets and rates contain plenty of information about the characteristics of the faulting behavior and its relationship with adjacent faults. The east Qilian Shan, located at the northeastern margin of the Tibetan Plateau, provides us an excellent opportunity to study the faulting behavior in a thrust-bounded range area. Besides the previously reported slip rates of the N-W trending tectonics across the region, we augmented the data by surveying the Fengle fault (FF), one of the north bounding thrusts of the Yongchangnan Shan. Another north bounding fault is the Kangningqiao Fault (KNF), east of the FF. Based on the vertical offsets and rates along the fault, we constructed the slip pattern along strike. The results show the vertical slip rate of the FF ranges from 0.7 ± 0.1 mm/a to 2.8 ± 1.3 mm/a across three surveyed sites. The slip rate decreases from the east to the west. The FF and KNF might be inferred as two segments of a single segmented thrust controlling the uplift of the Yongchangnan Shan. By comparing the uplift onsets in the study region, we discuss the northeastward propagated deformation along the northeastern margin of the Tibet plateau.
Introduction
It is a common way to use deformed geomorphic features to constrain the slip rate of an active fault. However, in most cases, to simplify the model, it is often assumed that a single fault has a constant slip rate along the whole strike. Shortening rate is usually constrained at a single site. However, it is suggested that the slip rate could be nonuniform for a thrust (e.g., Walsh and Watterson, 1987). The vertical slip rates distribution along a thrust fault contains important information about the evolution of the fault (Nicol et al., 2005; Mueller, 2017) and the relationships between fault segments (e.g., Lei et al., 2020). A triangular-shaped displacement-along-strike-distance distribution pattern is often interpreted as a result of lateral propagation (Nicol et al., 2005) or the linkage of the originally isolated segments (Walsh and Watterson, 1987; Dawers et al., 1993; Schlische et al., 1996). If the two segments both have their own triangular-shaped slip rate distributions, just as the case of the Mingle-Damaying fault north of the Qilian Shan, the segments are inferred to be isolated from each other (Lei et al., 2020). The over simplified model of uniformly distributed vertical rate may overlook such above information.
To address this problem, we need to construct the vertical slip rate distribution along the fault strike. The eastern Qilian Shan, in the northeastern margin of the Tibetan Plateau, provides us an excellent opportunity to conduct such study. On undertaking that task, we need to get the slip rate at multiple sites along the strike of the fault. For the Fengle Fault (FF) (Figure 1), deformation markers were dated at a single site by Champagnac et al. (2010), who reports a vertical slip rate of 2.8 ± 1.3 mm/a near the Kangningqiao. We augmented the data by surveying two more sites along the fault. Scarps are found at multiple sites along the FF and we measured the vertical offsets. Variable approaches helped to constrain the ages of the deformation markers. The slip rates at three surveyed sites helped to reveal the vertical slip rate pattern along the FF. Based on the resulting slip pattern, we took an insight into the relationship between the FF and the adjacent Kangningqiao Fault (KNF) (Figure 1). They both bound the northern front of the Yongchangnan Shan. The two bounding faults might be two segments of a single fault or isolated from each other. Slip rate pattern along the fault strike might reveal the relation between the two bounding faults. We took the vertical slip rate of the FF as an approximate for the uplift rate of the Yongchangnan Shan, and estimated its uplift onset based on the topographic relief. The formerly reported onsets of active tectonics along the Hexi corridor are also compiled to discuss the northeastward propagation of the Tibet Plateau.
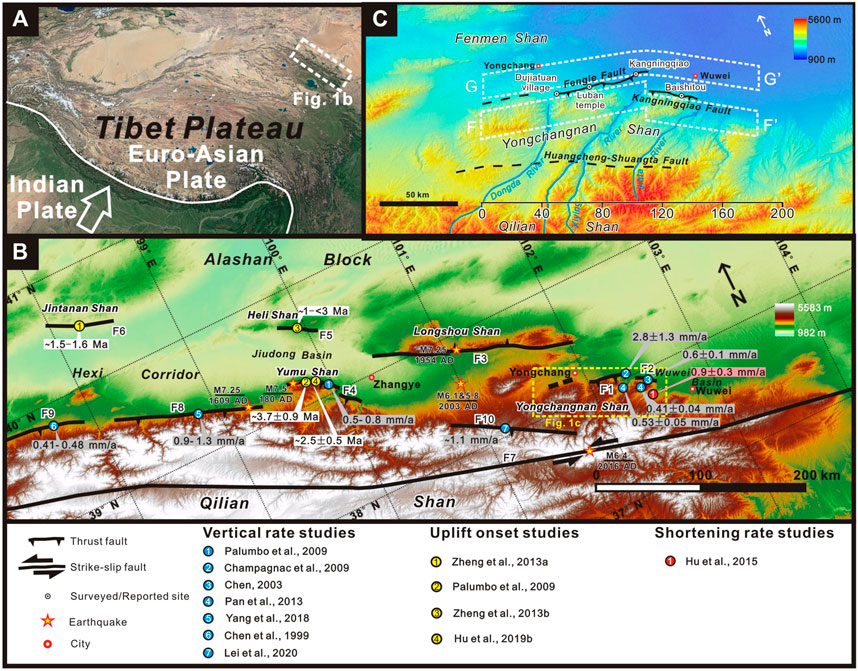
FIGURE 1. (A) Satellite image shows the study area locates at the northeastern margin of the Tibet plateau. (B) The tectonics in the region: F1, Fengle Fault; F2, Kangningqiao Fault; F3, Longshoushan Fault; F4, Yumushan Fault; F5, Helishan Fault; F6, Jintananshan Fault; F7, Haiyuan fault; F8, Fodongmiao-Hongyazi Fault; F9, Yumen Fault; F10, Minle-Damaying fault. Blue circles show locations of previous vertical slip rate studies. Yellow circles show locations of uplift onset studies. Red circle shows the location of crustal shortening study. (C) Fengle Fault. The white circles show the locations of surveyed sites.
Geological Setting
The Qilian Shan is the one of the youngest parts of the Tibet Plateau (Metivier et al., 1998; Meyer et al., 1998; Tapponnier et al., 2001; Pan et al., 2013). Crustal shortening along the north-eastern margin of the Plateau in response to the India-Eurasia collision initiated 50 Ma ago (Geoge et al., 2001; Fang et al., 2005; Bovet et al., 2009; Zheng et al., 2010; Liu et al., 2011; Molnar and Tapponnier, 1975; Tapponnier and Molnar, 1977; Cavalié et al., 2008). This shortening is absorbed by the range uplift (Chen et al., 2002; Hu et al., 2010) via thrusting of the North Qilian Fault (NQF) (Tapponnier et al., 2001; Meyer et al., 1998; Zheng et al., 2010; Zuza et al., 2016), a 700 km long fault bounding the North Qilian Shan and the Hexi Corridor (Li and Yang, 1998; Xiong et al., 2017; Zhang et al., 2017; Su et al., 2019; Zhong et al., 2020). And across the eastern portion of the North Qilian Shan, the crustal shortening rate is reported to be 5.5–7.0 mm/a (Hetzel et al., 2004b; Yuan et al., 2004; Zhang et al., 2004; Palumbo et al., 2009). The shortening absorbing tectonics include the North Qilian shan, the Yongchangnan Shan and their bounding thrusts including the Fengle Fault.
Holocene slip rates of the NQF have been reported by former studies. At the western section of the NQF, Chen et al. (1999) reported a vertical slip rate of 0.41–0.48 mm/a for the Yumen fault (Figure 1B). At the middle section of the NQF, Yang et al. (2018) suggest the vertical slip rate ranges from 0.9 mm/a to 1.3 mm/a for the Fodongmiao-Hongyazi fault. The Yumu Shan fault, located at the eastern section of the NQF, Palumbo et al. (2009) reported a 0.5–0.8 mm/a vertical slip rate. The Minle-Damaying fault, bounding the North Qilian Shan, has a reported vertical slip rate of ∼1.0 mm/a (Lei et al., 2020).
The Fengle fault (Figure 1), located at the eastern section of the NQF, extends from the mouth of the Dongda river in the west to the Xiying River in the east, about 90 km in length. The Yongchangnan Shan, an anticline in front of the North Qilian Shan, is collectively bounded by the FF and a further east KNF (Figure 1C) in the north piedmont. In the south piedmont, the anticline is bounded by the Huangcheng-Shuangta fault (Figure 1C). Further south lays the North Qilian Shan (Figure 1C).
Though no seismic events have been recorded on the FF in recent years, earthquakes are abundant in the region (Figure 1B): The 180 AD Gaotai M7.5 earthquake on the Yumu Shan Fault (Xu et al., 2010), the 1,609 Hongyazi M7.25 earthquake on the Fodongmiao-Hongyazi fault (Xu et al., 2010; Huang, 2021), and the 1954 Shandan Ms7.25 earthquake (Zheng W. J. et al., 2013) on the North Longshou Shan fault. The most recent seismic activities in this region includes the 2003 Minle-Shandan Ms6.1 and Ms5.8 earthquakes near Minle County (Zhang et al., 2004), and the 2016 Menyuan Ms6.4 earthquake (Wang et al., 2017; Liu et al., 2018) on the Haiyuan fault (Figure 1B).
Method
We mapped the fault traces on the remote sensing images from Google earth before field work. Then we detected distinct deformation markers along the fault trace. In the field, we carried out detailed survey of three sites including UAV (Unmanned Aerial Vehicle) survey and collecting dating samples. The three surveyed sites are Kangningqiao, Luban temple and Dujiatuan village sites, from the east to the west (Figure 1C).
Vertical Displacements
In order to acquire a detailed topography at the surveyed sites, we used UAV survey to scan the selected target area with a mounted 4K camera. Digital elevation models (DEM) were generated by Agisoft Photoscan. At least 11 control points positioned by real-time kinematic (RTK) GPS were set evenly across the target area before the UAV survey. These control points have a horizontal precision of 0.02 m and a vertical precision of 0.04 m. Therefore, the DEMs can be rectified for distortion from the UAV-mounted camera, which could be used to measure deformation.
Measurements of vertical displacements are based on the UAV-surveyed DEMs. Each topographic swath profile (Figure 2A) is extracted by three measuring lines normal to the strike of the scarp. On calculation of the vertical displacement, we conduct linear regression on the hangingwall at each surveyed site. A trench excavated on the hangingwall at the Dujiatuan village reveals a loess thickness of ∼0.3 m. At the Luban temple site, the loess cover is less than 0.2 m in thickness. At the Kangningqiao site, no loess cover is observed on the hangingwall (designated as S1 by Champagnac et al., 2010). If the loess cover on the footwall has the same thickness with loess on the hangingwall at each surveyed site, the loess thickness would not seriously affect our measuring result of vertical displacement. Additionally, Comparing with tens of meters of vertical displacements, the loess cover less than 0.5 m thick on the hangingwall will not significantly affect our result. Duo to the burial of the footwall, the topographic profiles of the hangingwall and the footwall are not strictly paralleled with each other. The measured profile north of the fault is interpreted as the sum of the footwall and the covering sediments (e.g., Champagnac et al., 2010). We assume the thickness of sediments burying the footwall decreases exponentially from the fault as a exponential term (Figure 2A) (e.g., Champagnac et al., 2010) and the thickness of the sediments is negligible at the end of the measuring line, where exposed bedload conglomerates can be observed. The height-intercept difference (Figure 2A , In1-In2) of the hangingwall and the footwall is inferred as the vertical displacement (d) (Figure 2A). As the two linear terms have different slopes, the measured d will vary when it goes from the foot to the shoulder of the scarp. The range of the measured d bounds the uncertainty of the vertical throw. Monte Carlo simulations were implemented to calculate the vertical slip rate, hence we need to define the probability distribution function (PDF) of each measured throw. Here, each vertical throw is assumed in a normal distribution and its uncertainty bounds the 95% confidence interval.
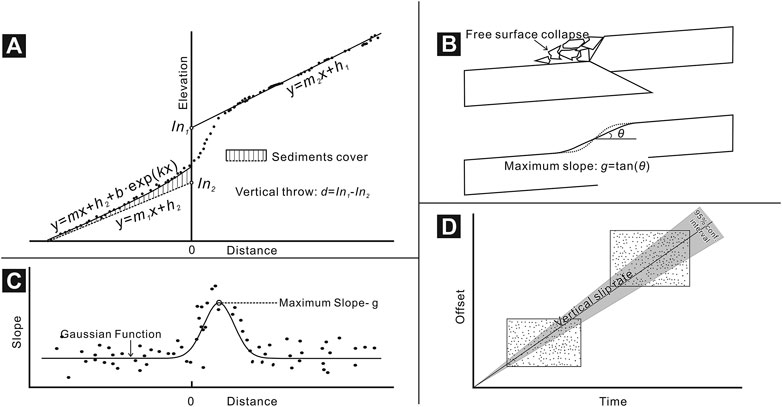
FIGURE 2. Illustration of determining the vertical throw, maximum slope of scarp and vertical slip rate. (A) We assume the hangingwall and footwall (linear term) have the same nature slope. The footwall is buried with sediments whose thickness decrease exponentially from the fault (exponential term) (e.g., Champagnac et al., 2010). (B) Faulting event follows a gravity-driven collapse after which the scarp undergoes a slower degradation phase dominated by raindrop impact and soil creep. (C) Gaussian fitting reveals the maximum slope on the scarp. (D) 1,000 times of Monte Carlo simulation displacement-time (d–t) vectors are projected on a d-t plane, then the slope of the linear regression reveals the vertical slip rate.
Optically Stimulated Luminescence Dating
At the Dujiatuan village site (Figure 1), the conglomerates are covered with fine-grained sediments suitable for optically stimulated luminescence (OSL) dating, therefore, a trench (38°6′35.68″N, 102°2′6.58″E) was excavated for sampling. Samples were collected from both the eolian loess and the fluvial sediments to constrain the upper and lower bound of the abandonment age of the displaced fan surface.
The OSL samples were processed at the Key Laboratory of Crustal Dynamics, Institute of Crustal Dynamics, China Earthquake Administration. The preparation and measurements of the OSL samples followed the standard procedures (Aitken, 1998). The details of OSL dating can be found in the Supplementary Material. Only sample near the center of the steel pipe was used to insure maximal shielding. A small portion of the sample, 20 g, was used to measure the water content. 106 g of each sample was used to measure the environmental dose rate (D). As the materials of the samples are finer than silt, quartz grains 4–11 µm in size were used to measure the equivalent dose (De). To remove the organic materials, samples were treated with 30% hydrogen peroxide (H2O2). 30% hydrochloric acid (HCI) was used to remove carbonates. We obtained grains <90 µm by dry sieving, then grains 4–11 µm in size were extracted by hydrostatic sedimentation. Samples were dried again under temperature of 40°C, then etched with 40% hexafluorosilic acid (H2SiF6) to remove feldspar. The residual fluorides are further dissolved by 10% HCI. To test the purity of the samples, we measured the infrared stimulated luminescence (IRSL) and 110°C thermoluminescence (TL) peak which is an indicator of feldspar.
We determined the equivalent dose (De) of the quartz by the simplified multiple aliquot regenerative-dose (SMAR) procedure (Wang et al., 2006; Lu et al., 2007). Quartz grains 4–11 µm in size were mounted on stainless steel. For each sample, 8–10 aliquots are used to measure the natural OSL signal and another 6–8 aliquots are zeroed under the sunlight for 6 h. Luminescence measurements were performed on Risoe DA-20-CD TL/OSL reader made in Denmark. The 90Sr/90Y beta source with a dose rate of 0.086 Gy/s was used for dosing and blue light emitting diodes (λ = 470 ± 20 nm) and infrared (λ = 830 nm) LED units for stimulation. The background stimulation was subtracted from the initial 0.8 s stimulation then the growth curve (see the growth curves in the Supplementary Material) was constructed and the equivalent dose (De) was obtianed.
Environmental dose rate (D) is a measure of the radiation dose per unit of time absorbed by the mineral, quartz in this study, of interest. The dose rate is calculated from an analysis of radioactive elements. The contents of radioactive isotopes of U, Th and K are measured by the Canberra GC4018 (HPGe) gamma spectrometer. Water content can affect the radiation dose absorbing rate by quartz. However, as our samples are relatively dry, the measured water content cannot represent the actual water content during the burial period. The water content of all the samples are assumed to be 5%. Based on the relation between the dose rate of quartz, water content and contents of U, Th, K (Aiken, 1998), we can determine the environmental dose rate (D). The cosmic ray dose rate was calculated according to Prescott and Hutton (1994).
The dose distributions (see Figure 3 in the Supplementary Material) show that our measured grains were well bleached before burial and the central age model (e.g., Galbraith et al., 1999) yields the ages of the OSL samples (Table 1).
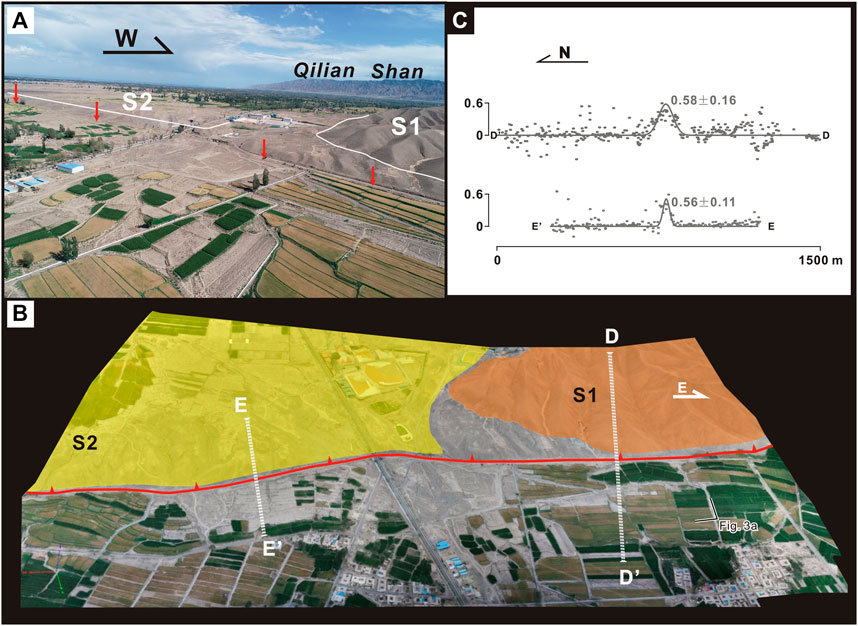
FIGURE 3. (A) Aerial photography of the Kangningqing site. The red line shows the fault track. (B) 3D topography of the surveyed site. The measuring lines are normal to the fault strike. (C) Using the high resolution DEMs generated by drone scanning stereopair, we extract the slope profile of the fault scarp and obtain the maximum slope.
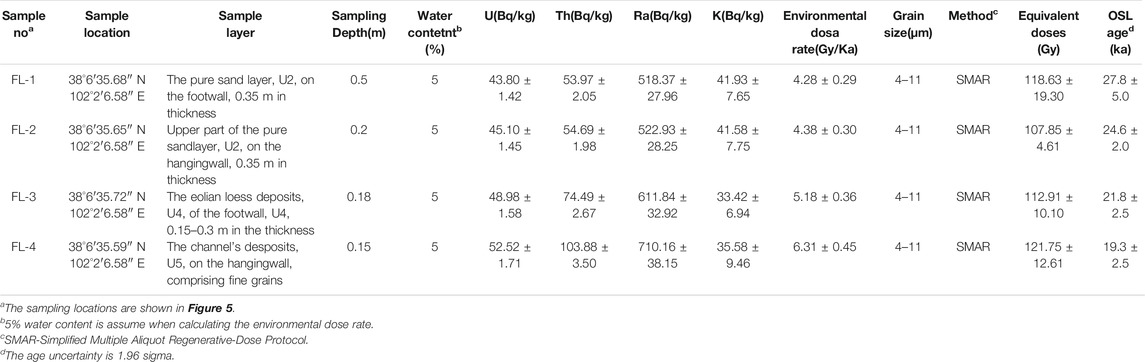
TABLE 1. Calculated values of equivalent doses, annual doses and OSL ages.
Scarp Diffusion Age
Damaging of the grass cover or digging is restricted at some private ranch or farmlands, therefore dating sample is not accessible. In such case, age estimation is based on scarp diffusion model (e.g., Wallace, 1977; Hanks et al., 1984): After a faulting event, the scarp starts as a free surface, and then follows the gravity-driven collapse (Avouac, 1993) (Figure 2B). The duration of collapse is a relatively small fraction of the degradation period (Colman and Watson, 1983; Andrews and Bucknam, 1987), after which the slope of the scarp reaches an angle of repose of the unconsolidated sediments. From this point of time, the scarp undergoes a slower degradation phase dominated by raindrop impact and soil creep. Colman and Watson (1983) applied the diffusion equation for hill slopes to scarp erosion in unconsolidated materials:
g is the maximum slope on the current profile of scarp. We sampled the slope data by random points along the measuring line, scattering them on the slope-distance plane (Figure 2C). Gaussian function is used to make a fitting (Figure 2C). The program Matlab will yield the maximum, with 95% confidence interval, of the fitted Gaussian function, representing the maximum slope-g, with uncertainty. g1 is the surface slope. As the hangingwall and footwall have different slopes, we take the mean as the surface slope. g0 is the slope at the repose of sediments which is supposed to be tan(30°). L = d/2g0 and d is the vertical displacement in m. c is a diffusion constant in m2/ka. t is the scarp age, in ka. We already have dated scarp profiles at the Dujiatuan village and the Luban temple site. By Eq. 1 if we know the value of g, g0, d and t, then the rate constant, c, can be calibrated. Then by the calibrated c, we can estimate the age, t, at the undated site. Here, the age deduced by Eq. 1 is actually the age of sediments repose and it is an approximate of the scarp age duo to the relatively short-period phase of free surface collapse.
Vertical Slip Rate
Slip rate uncertainties arise from both measurement and dating uncertainties. We implemented Monte Carlo simulations to estimate the uncertainties for the vertical slip rate (Figure 2D). In the rectangle envelop bounding the uncertainties of displacement and time (d-t), random points are generated to simulate the d-t vectors. As more simulations will not significantly improve the precision, 1,000 times of simulations were conducted for deformed marker (Figure 2D). As we do not know the position of the present day in a seismic circle, the linear regression of the d-t vectors is forced through the origin (Figure 2D). The slope of the linear regression yields the vertical slip rate, with uncertainty.
Results
Here, we report the vertical displacements and maximum slopes on scarps. We also compiled the dating results of previous study (Champagnac et al., 2010) and report the trench analysis at the Dujiatuan village. We firstly reported the two directly dated sites, hence calculated the regional diffusion constant. Afterward, we estimated the marker’s age at the Luban temple site based on the scarp diffusion model. Due to the absence of lateral offset features, we only obtained the vertical slip rates.
Kangningqiao
Previous researchers have reported vetrtical throws and rates on two deformed surfaces at the Kangningqiao site (Figures 3A,B). The displaced sediments are composed of bedload conglomerates of the Xiying river. By elevation data collected by a total station in the eastern portion of the FF near the Kangningqiao, Champagnac et al. (2010) reported vertical displacements of 96.4 ± 4.4 m and 40.1 ± 2.8 m for the upper and lower surface (designated as S1 and S2, respectively). As high-resolution DEMs are available, we measured the maximum slope of the fault scarp. The Gaussian fittings of the slope profiles (D-D′ and E-E’) yield maximum slopes of 0.58 ± 0.16 for the scarp on S1 and 0.56 ± 0.11 for the scarp on S2 (Figure 3C).
By 10Be exposure dating, Champagnac et al. (2010) reported the upper surface, S1, has an age of 29.9 ± 7.8 ka BP and the lower surface S2 has an age of 16.3 ± 4.4 ka BP, which yields a vertical slip rate of 2.8 ± 1.3 mm/a.
Dujiatuan Village
The FF bifurcates at the Dujiatuan village with two parallel scarps cutting a fluvial fan designated as D1 (Figures 4A,B). Part of the fan has been eroded by a younger gully, whose deposits have either not been offset, or the scarp was erased by later flow. From the outcrop, we can observe that the sediments of the fan comprise of conglomerates and the capping fine-grain deposits. A topographic profile perpendicular to the fault strike shows that the major scarp in the north have a cumulative a height of 14.0 ± 2.0 m (Figure 4C). A smaller scarp, located 300 m to the south, shows a vertical displacement of 1.6 ± 0.1 m. The sum of these two scarps, 15.6 ± 2.0 m, is inferred as the total vertical offset of D1. The greater portion of the vertical displacement is shared by the major scarp in the north, having a maximum slope of 0.29 ± 0.09 (Figure 4C).
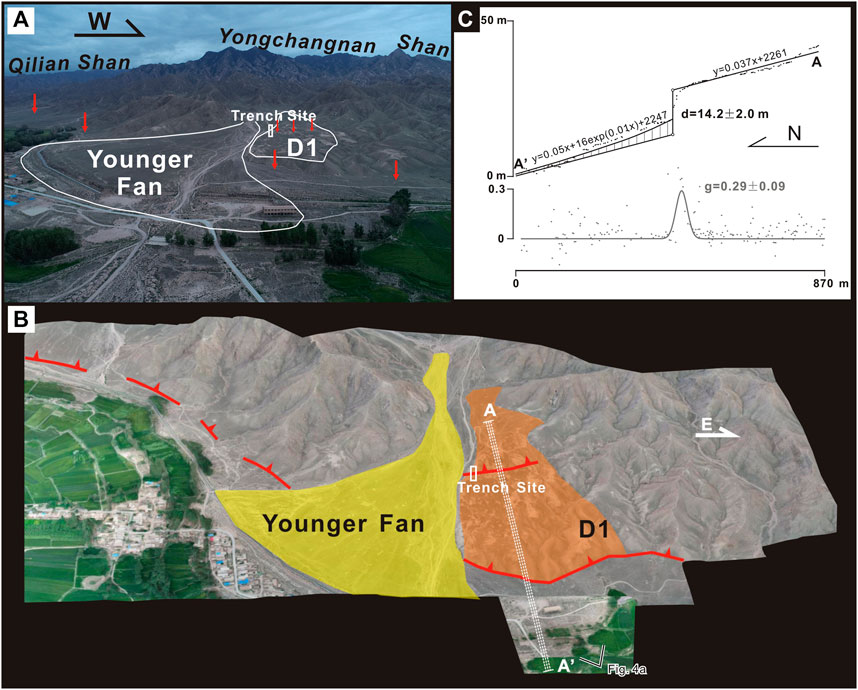
FIGURE 4. (A) Aerial photography of the Dujiatuan village site. The red line shows the fault track. (B) 3D topography of the surveyed site. The measuring lines are normal to the fault strike. (C) The topographic profile reveals the vertical throw and the Gaussian fitting indicates the maximum slope on the scarp.
The OSL samples are collected from the trench (E102°02′6.88”, N38°06′35.83″) (Figure 5) excavated across the 1.6 ± 0.1 m scarp south of the main strand, on D1. The trench is 10 m in length, 1.5 m in width and 2.5 m in depth. The dating results show younger ages for the upper sediments and older ages for the underlying bedloads. We suppose these samples are essential for the estimation of the abandonment age of the offset fan. From the trench exposure, we classified totally six stratigraphic units according to the composition, color, granularity, roundness of sediments (Figure 5). Stratigraphic unites are labeled from the bottom to top as U1- U6 (Figure 5), respectively: U1 is a coarse sand layer, grayish in color, embedded with sub-angular pebbles and cobbles 0.2–0.5 m in diameter. Horizontal bedding is visible in sand. This unit is about 1.2 m in thickness. U2 consists of pure sand, with a brighter color than U1. This unit appears both on the hangingwall and the footwall, and is about 0.35 m in thickness. Two OSL samples, FL-1 in the foot wall and FL-2 in the hanging wall, are collected from this unit, with dating results of 27.8 ± 5.0 ka BP (Table 1) and 24.6 ± 2.0 ka BP (Table 1), respectively. The overlapping ages show a strong consistency of the two results. U3 is a mixture of sand and tiny granules, reddish-brown in color and 0.12 m in thickness. This layer is continuous on the footwall and scattered on the hangingwall. U4 is a fine grain layer, inferred to be loess deposits. The thickness is about 0.3 m on the footwall, decreasing to 0.15 m on the block bounded by faults and absent on the hangingwall. The OSL sample, FL-3, collected in this unit yields an age of 21.8 ± 2.5 ka BP (Table 1). U5 is a channel, capped by the top soil, cutting into U3 and U2, comprising fine grains. One OSL sample is available of this unit, with a dating result of 19.3 ± 2.5 ka BP (Table 1). U6 is the top soil layer, dark in color and about 0.65 m in thickness.
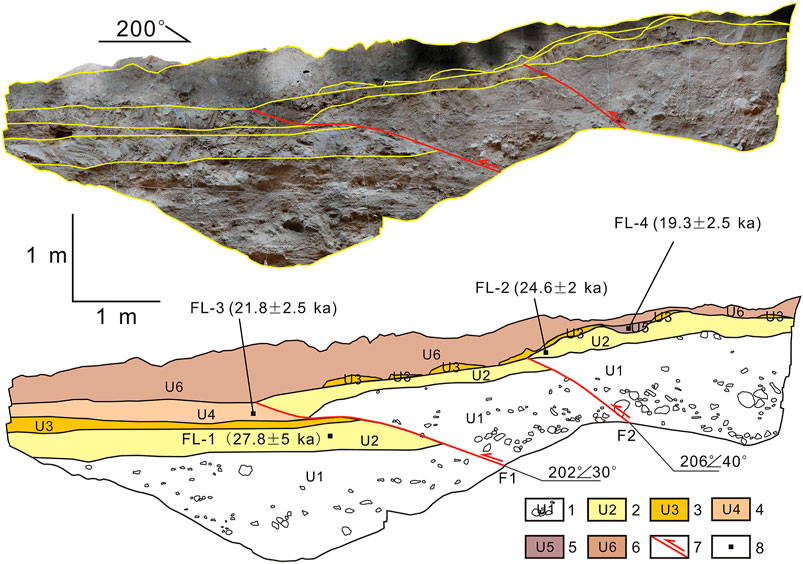
FIGURE 5. The Dujiatuan village trench. This trench is excavated for dating the fluvial fan D1 and two fault splays are discovered, designated as F1 and F2, respectively. The fault F1 terminated upward at the bottom of U6. The fault F2 is capped by U3. Stratigraphic units: U1, coarse sand. U2, pure sand. U3, mixture of sand and tiny granules. U4, loess deposits. U5, channel deposits. U6, top soil. We identified two faulting events in the Late Pleistocene, designated as E1 and E2.
There are two fault planes observed on the trench walls, which are labeled as F1 and F2 (Figure 5). Fault F1 offsets U1, U2, U3 and U4. From Figure 5, the older U2 over thrusts on the younger U4. The absence of U4 might be the result of stronger erosion on the hangingwall and only weathered remains of U3 can be observed. The upper termination of F1 is capped by U6, indicating a seismic event E1 took place prior to the deposition of U6. Another seismic event is identified by the slip of fault F2. E2 is an older event as it is capped by U3 and only offsets U1 and U2. The occurrence time of E2 is between the deposition of U2 and U3.
The samples collected from the latest sediments before the abandonment provides a maximum date for the fan (e.g., Dortz et al., 2009; Walker and Fattahi, 2011), while, the one from the oldest eolian sediments provides a minimum date. The horizontal bedding in the pure sandy unit (Figure 5), U2, indicates sediments deposited prior to the abandonment. As U2 is the youngest dated unit before the abandonment, the younger sample FL-2 (24.6 ± 2.0 ka BP) collected from it, therefore, provides the maximum age of the fan. The loess deposits of U4 (21.8 ± 2.5 ka BP) (Figure 5) provides a minimum age for the fan as deposited on the original fluvial fan surface after the abandonment. As a result, the abandonment time of D1 is estimated to be between 21.8 ± 2.5 ka BP to 24.6 ± 2.0 ka BP. Combining the vertical offset, the vertical slip rate is revealed to be 0.7 ± 0.1 mm/a. We take the mean dip of faults exposed by the Dujiatuan trench as an approximate, 35 ± 2°, for the main strand, the shortening rate across the FF at the Dujiatuan village site is estimated as 1.0 ± 0.1 mm/a. Hu et al. (2015) reported a similar shortening rate of 0.9 ± 0.3 mm/a across the Yongchangnan Shan based on the deformation and OSL dating of terraces in the Jinta river (Figure 1B), near the eastern tip of the adjacent KNF.
Luban Temple
We did not get permission to dig on the private ranch during our field investigation, as a result, no dating sample is available at the Luban temple site. The two deformed surfaces at this site are designated as L1 and L2, respectively (Figures 6A,B). These surfaces are inferred as abandoned fluvial fans with well-preserved planar surfaces. As both surfaces are covered with grass with no natural outcrop, we cannot describe their sedimentary units, here.
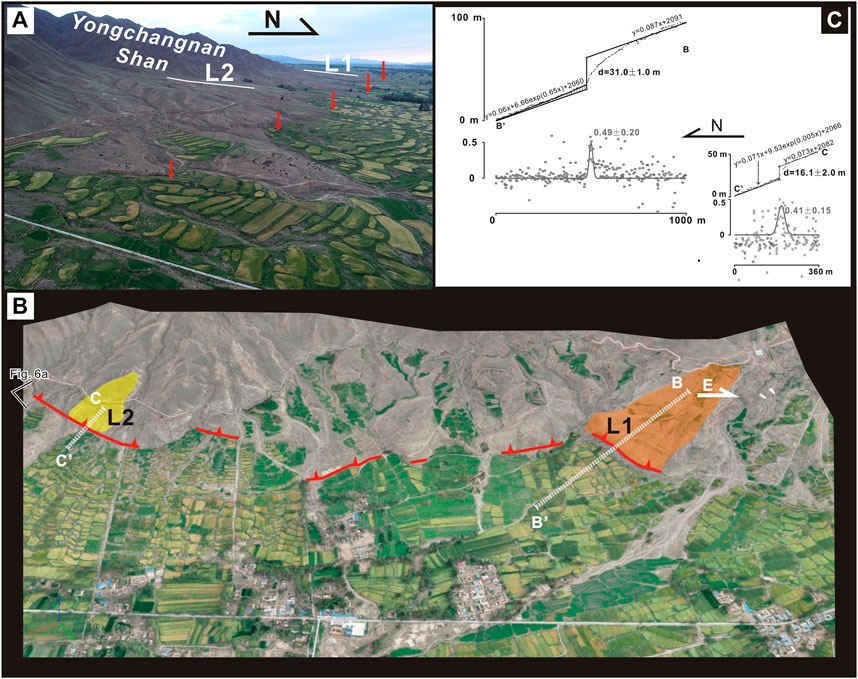
FIGURE 6. (A) Aerial photography of the Luban temple site. The red line shows the fault track. (B) 3D topography of the surveyed site. The derived topographic profiles B-B′ and C-C′ are normal to the fault strike. (C) The topographic profiles show the vertical throws of L1 and L2. The Gaussian functions yield the maximum slopes.
The higher surface L1 has a vertical displacement of 31.0 ± 1.0 m and the scarp height of the lower fan L2 is 16.1 ± 2.0 m (Figure 6C). The Gaussian functions fitted to the slopes along the measuring line yield maximum slopes of 0.49 ± 0.20 for the scarp on L1 and 0.41 ± 0.15 for the scarp on L2 (Figure 6C).
Now we have the vertical displacement and maximum slope of the deformation markers at the Luban temple site. However, by Eq. 1, we need to figure out the value and the PDF of the diffusion constant c before the age calculation. Based on the natural slope g1, maximum slope g, age t and the vertical displacement d of the directly dated markers, we estimated a c value of 8.9 ± 1.0 m2/ka for S1, 7.2 ± 1.0 m2/ka for S2 in the Kangningqiao site and 8.1 ± 2.5 m2/ka for the D1 of the Dujiatuan village. These c values are in consistency with each other, indicating the c value stays constant across the relatively small study area. The average c value is revealed to be 7.9 ± 2.5 m2/ka. Here, we use the averaged c value to calculate the marker ages in the Luban temple site. The ages of L1 and L2 are yielded to be 27.1 ± 5.0 ka and 13.7 ± 5.0 ka, respectively. As a result the vertical slip rate is estimated as 1.1 ± 0.4 mm/a.
Discussion
It seems that the activity level of the fault decreases away the Kangningqiao site. By constructing the slip rate pattern along the strike, we can explore the relation between the FF and the KNF. The estimation of the uplift onset of the Yongchangnan Shan and the compiled previously reported uplift onsets help to understand the northward deformation propagation at the northeastern margin of the Tibet Plateau.
Slip Pattern
As no obvious lateral slip was observed, we constructed the slip rate pattern in terms of vertical slip rate. The linear regression on the vertical slip measured from the three surveyed points reveals a monotonic slip pattern (Figure 7B, blue linear regression), which does not match the model in which the maximum slip locates near the center of the fault and decrease toward the tips (Walsh and Watterson, 1987; Dawers et al., 1993; Schlische et al., 1996). This inconsistency made us wonder whether it has been linked with the KNF further east (Figure 7A), so that they are two segments of a single fault. Another explanation for the inconsistency is that the maximum vertical slip rate of the FF locates at some point between the Kangningqiao and the Luban temple , and in that case, the two faults are independent from each other.
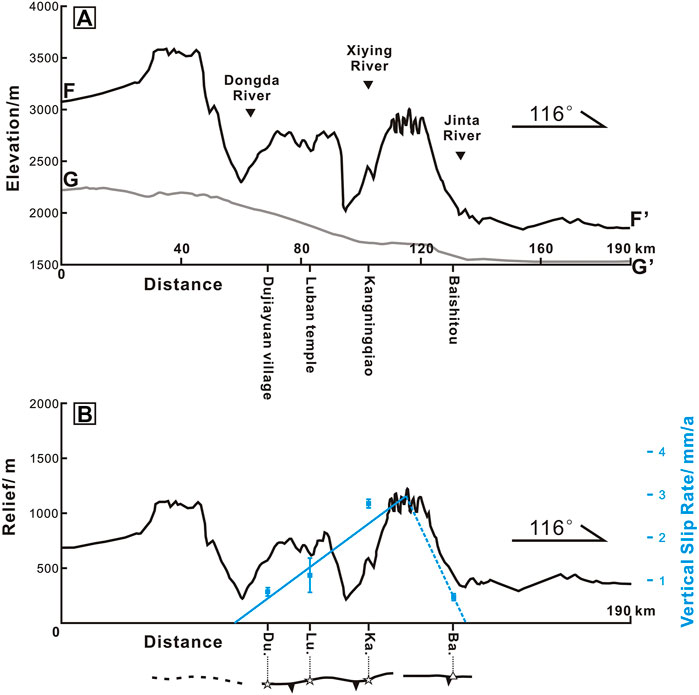
FIGURE 7. (A) In order to obtain the relief profile, we extract both the along crest profile of the Yongchangnan Shan and a paralleled profile along the Hexi Corridor. The indication for swath profiles F-F′ and G-G′ is marked in Figure 1C. For F-F′, maximum elevation is taken for each increment along the swath profile. For the terrain profile of the Hexi Corridor basin G-G′, minimum elevation in each increment is taken. (B) The relief profile is obtained by differencing the crest profile (F-F′) and the terrain profile of the Hexi Corridor (G-G′). We also project the vertical slip rates (blue in color) at each surveyed site on the coordinate system.
To find out the relation between the two north bounding faults, we extract the along-crest relief of the Yongchangnan Shan as is inferred by Hetzel et al. (2004) to be a reflection of thrust fault’s slip distribution. By a 90 m resolution DEM from the Shuttle Radar Topographic Mission data (STRM), we extracted a topographic profile along the crest (Figures 7A,B, swath profile F- F′). We interpreted this profile as the sum of the uplift of Yongchangnan Shan and the natural slope on which the uplift is based. The natural slope is approximated by extracting the topographic profile (Figure 7B, swath profile G- G′) along the Hexi Corridor paralleled to the Yongchangnan Shan (Figure 7A). Subtracting the natural slope G-G′ from the topographic profile F-F′, we get the profile of the tectonic uplift (Figure 7B).
As Figure 7B shows the relief of the Yongchangnan Shan increases from the west tip of the FF and stops the increase at the Xiying river due to river incision. As the thrusting of the fault controls the topographic relief of the range (Hetzel et al., 2004a), we suppose the peak of the Yongchangnan Shan corresponds to the maximum slip point of the fault or a series of faults. As the maximum is in vicinity of the Kangningqiao site, we suppose the monotonic slip pattern fitted by a line is valid for the FF.
On the eastern half of the Yongchangnan Shan, Chen (2003) reported a thermoluminescence (TL) dated scarp on the fan located at the Baishitou gully (Figures 1B, 7) has a height of 2.5 m and an age of 4.4 ± 0.4 ka BP, which yields a vertical slip rate of 0.6 ± 0.1 mm/a on this site of the KNF. The monotonic slip pattern of the FF can be interpreted as the western wing of a triangular-shaped vertical rate distribution along the northern front of the Yongchangnan Shan. We suppose the FF and KNF are two segments of a single segmented thrust controlling the uplift of the Yongchangnan Shan. But that requires the vertical rate distribution of the KNF also has a monotonic pattern, decreasing from the west to the east (Figure 7B, blue dashed line). The sum of the two slip patterns resemble a single thrust with its maximum near the center and decreases toward the tips, a model suggested by Walsh and Watterson (1987), Dawers et al. (1993), Schlische et al. (1996) and Cowie (1998).
Yongchangnan Shan Uplift and Deformation Propagation
As the deep structure of the FF is unknown, we assume it is a deeply rooted fault. In that case, the vertical slip rate of the thrust is inferred to be the uplift rate of the Yongchangnan Shan. The vertical slip rates measured from all three surveyed sites range from 0.7 ± 0.1 mm/a to 2.8 ± 1.3 mm/a at which the FF is uplifting the rock. Pan et al. (2013) reported a river incision rate of 0.53 ± 0.05 mm/a since 76 ka where the Xiying river cutting through the Yongchangnan Shan (Figure 1B), and further east at the Jinta river, Pan et al. (2007) reported a 0.41 ± 0.04 mm/a of rock uplift rate since 73 ka indicated by the river incision rate. And it is also reported (Chen, 2003) a 0.6 ± 0.1 mm/a vertical rate of the adjacent KNF in the east (Figure 1B). These reported rock uplift rates are close to our result. The resulting rock uplift rate of the Yongchangnan Shan is also of the same magnitude with the Yumu Shan, 0.5–0.8 mm/a (Palumbo et al., 2009) and 1.2 ± 0.1 mm/a (Hu et al., 2019b), in the near west (Figure 1B).
Besides the rock uplift rate which increase the relief, we also take into consideration weathering and deposition, which reduce the relief (Burbank et al., 1996; Reiners and Brandon, 2006; Molnar et al., 2007; Champagnac et al., 2012; Wang et al., 2014). Montgomery and Brandon (2002) gave a nonlinear function relating denudation rate and mean slope:
Taking into consideration of the current maximum topography relief (Figure 7B), 1,450 ± 90 m, and assuming the NTR remains constant as the ranges grow, the uplift onset of the Yongchangnan Shan can be estimated to be 1.3 ± 0.5 Ma ago, at late-Pliocene to early Pleistocene. For the Yumu Shan in the near west (Figure 1B), based on vertical slip rate of the Yumu Shan Fault and relief, Palumbo et al. (2009) suggest the range started uplifting by 3.7 ± 0.9 Ma ago. By magnetostratigraphy study, Hu et al. (2019a) suggest an uplift onset of 2.5 ± 0.5 Ma for the Yumu Shan. The reported onsets show that the Yumu Shan is older than the Yongchangnan Shan. By magnetostraitigraphic results of Late Cenozoic sediments from the Yumu Shan, Liu et al. (2011) suggest tectonic episodes at ∼5.89, ∼3.58, ∼2.88–2.58 and ∼0.9–0.8 Ma. In addition, By palaeomagnetic dating and tectonosedimentological measurement of Cenozoic sediments in the Jiudong Basin (Figure 1B), Fang et al. (2013) suggest eight tectonic episodes, 27.8, 24.6, 13.7–13, 9.8–9.6, 5.1–3.6, 2.8–2.6, 0.8 and 0.1 Ma, in the Jiudong basin-Yumu Shan basin-range structure. Both workers reported a ∼1.0 Ma tectonic period in this region. The uplift onset of the Yongchangnan Shan might be correlated with the ∼1.0 Ma period. Of course, the correlation requires the Yongchangnan Shan has a constant uplift rate since the onset. The crustal shortening along the northeastern margin of the Tibet Plateau is absorbed by the uplift of the north Qilian Shan and series thrusting and range uplift across the eastern Heixi Corridor (Xiong et al., 2017). Further north, deformations such as the Jintanan Shan and the Heli Shan (Figure 1B) concentrate on the boundary between two rigid blocks, the Hexi Corridor (Li and Yang, 1998) and the Alashan Block (Tapponnier and Molnar, 1977). Based on vertical slip rate of the bounding thrusts, the onsets of the uplift of the Jintanan Shan and the Heli Shan are estimated to be ∼1.5 to 1.6 Ma and ∼1 to <3 Ma, respectively (Zheng W.-J. et al., 2013; Xiong et al., 2017) (Figure 1B) and their onset are in the same period with the Yongchangnan Shan. The younger uplift onsets north of the Hexi Corridor and the Yongchangnan Shan indicate the deformation not only propagates northward but also eastward. It may be the reflection of the northeastward extension of the Tibet Plateau in response to the ongoing India-Eurasia collision.
Conclusion
Detailed field survey and age estimation of deformation markers yield vertical slip rates of 2.8 ± 1.3 mm/a, 1.1 ± 0.4 mm/a and 0.7 ± 0.1 mm/a at the Kangningqiao, Luban temple and the Dujiatuan village sites. These rates indicate a slip rate pattern of westward decreasing. We suppose the FF and the KNF are two segments of a single thrust, and they jointly control the uplift of the Yongchangnan Shan. The uplift onset of the Yongchannanshan is estimated in the same period with the Yumu Shan, and they are older than the Jintanan Shan and the Heli Shan located north of the Hexi Corridor, indicating the deformation in the northeastern margin of the Tibetan Pleteau propagated from the south to the north. We interpret the deformation propagation as the result of the northeastward expansion of the Tibet Plateau duo to the ongoing India-Eurasia collision.
Data Availability Statement
The original contributions presented in the study are included in the article/Supplementary Material, further inquiries can be directed to the corresponding author.
Author Contributions
LJ is responsible for making the research plan, field work, writing, editing, mathematical modeling. LY is responsible for field work, writing and editing. RZ is responsible for editing and mathematical modeling. HX, XJ and LF are responsible for field work. LJ is responsible for drawing the figures.
Funding
This work was supported jointly by National Nonprofit Fundamental Research Grant of China (IGCEA 1901) and National Nonprofit Fundamental Research Grant of China (IGCEA 1803 and IGCEA 2129).
Conflict of Interest
The authors declare that the research was conducted in the absence of any commercial or financial relationships that could be construed as a potential conflict of interest.
Acknowledgments
The data directly used in this research is available online at http://doi.org/10.5281/zenodo.4147757. Special thank to Professor Michael E. Oskin at the Department of Earth and Planetary Sciences, University of California, Davis for the advice in mathematical modeling. We want to express our thank to the driver Li Xing for driving in the mountainous area.
Supplementary Material
The Supplementary Material for this article can be found online at: https://www.frontiersin.org/articles/10.3389/feart.2021.622568/full#supplementary-material
References
Andrews, D. J., and Bucknam, R. C. (1987). Fitting Degradation of Shoreline Scarps by a Nonlinear Diffusion Model. J. Geophys. Res. 92 (B12), 12857–12867. doi:10.1029/jb092ib12p12857
Avouac, J.-P. (1993). Analysis of Scarp Profiles: Evaluation of Errors in Morphologic Dating. J. Geophys. Res. 98 (B4), 6745–6754. doi:10.1029/92jb01962
Bovet, P. M., Ritts, B. D., Gehrels, G., Abbink, A. O., Darby, B., and Hourigan, J. (2009). Evidence of Miocene Crustal Shortening in the North Qilian Shan from Cenozoic Stratigraphy of the Western Hexi Corridor, Gansu Province, China. Am. J. Sci. 309, 290–329. doi:10.2475/00.4009.02
Burbank, D. W. (2002). Rates of erosion and their implications for exhumation. Mineral. Mag. 66 (1), 25–52. doi:10.1180/0026461026610014
Burbank, D. W., Leland, J., Fielding, E., Anderson, R. S., Brozovic, N., Reid, M. R., et al. (1996). Bedrock Incision, Rock Uplift and Threshold Hillslopes in the Northwestern Himalayas. Nature 379, 505–510. doi:10.1038/379505a0
Cavalié, O., Lasserre, C., Doin, M.-P., Peltzer, G., Sun, J., Xu, X., et al. (2008). Measurement of Interseismic Strain across the Haiyuan Fault (Gansu, China), by InSAR. Earth Planet. Sci. Lett. 275 (3-4), 246–257. doi:10.1016/j.epsl.2008.07.057
Champagnac, J.-D., Yuan, D.-Y., Ge, W.-P., Molnar, P., and Zheng, W.-J. (2010). Slip Rate at the north-eastern Front of the Qilian Shan, China. Terra Nova 22 (3), 180–187. doi:10.1111/j.1365-3121.2010.00932.x
Champagnac, J. D., Molnar, P., Sue, C., and Herman, F. (2012). Tectonics, Climate, and Mountain Topography. J. Geophys. Res. Solid Earth 117 (B2). doi:10.1029/2011jb008348
Chen, W., Liu, B., Xu, X., Dai, H., and Wang, F. (1999). Activity of the Yumen Fault, Western Qilian Shan Mountains, during Late Quaternary and its Implication to Regional Tectonic Movements. Northwest. Seismological J. 21 (4), 389–394.
Chen, W. (2003). “Principal Features of Tectonic Deformation and Their Generation Mechanism in the Hexi Corridor and its Adjacent Regions since Late Quaternary,” (CMKI. Beijing:Institute of Geology, China Earthquake Administration). [dissertation thesis].
Chen, Y., Wu, H., Courtillot, V., and Gilder, S. (2002). Large N-S Convergence at the Northern Edge of the Tibetan Plateau? New Early Cretaceous Paleomagnetic Data from Hexi Corridor, NW China. Earth Planet. Sci. Lett. 201 (2), 293–307. doi:10.1016/s0012-821x(02)00722-7
Colman, S. M., and Watson, K. (1983). Ages Estimated from a Diffusion Equation Model for Scarp Degradation. Science 221 (4607), 263–265. doi:10.1126/science.221.4607.263
Cowie, P. A. (1998). A Healing-Reloading Feedback Control on the Growth Rate of Seismogenic Faults. J. Struct. Geology. 20 (8), 1075–1087. doi:10.1016/S0191-8141(98)00034-0
Dawers, N. H., Anders, M. H., and Scholz, C. H. (1993). Growth of normal Faults: Displacement-Length Scaling. Geol 21, 1107–1110. doi:10.1130/0091-7613(1993)021<1107:gonfdl>2.3.co;2
Dortz, L., and Meyer, B. (2009). Holocene Right-Slip Rate Determined by Cosmogenic and OSL Dating on the Anar Fault, Central Iran. Geophys. J. Int. 179, 700–710. doi:10.1111/j.1365-246X.2009.04383.x
Fang, X., Liu, D., Song, C., Dai, S., and Meng, Q. (2013). Oligocene Slow and Miocene-Quaternary Rapid Deformation and Uplift of the Yumu Shan and North Qilian Shan: Evidence from High-Resolution Magnetostratigraphy and Tectonosedimentology. Geol. Soc. Lond. Spec. Publications 373 (1), 149–171. doi:10.1144/sp373.5
Fang, X., Zhao, Z. J., Li, J. J., Yan, M. D., and Pan, B. T. (2005). Magnetostratigraphy of the Late Cenozoic Laojunmiao Anticline in the Northern Qilian Mountains and its Implications for the Northern Tibetan Plateau Uplift. Sci. China Ser. D 48, 1040–1051. doi:10.1360/03yd0188
Farr, T. G., Rosen, P. A., Caro, E., Crippen, R., Duren, R., Hensley, S., et al. (2007). The Shuttle Radar Topographic mission. Rev. Geophys. 45, 1–33. doi:10.1029/2005rg000183
Galbraith, R. F., Roberts, R. G., Laslett, G. M., Yoshida, H., and Olley, J. M. (1999). Optical Dating of Single and Multiple Grains of Quartz from Jinmium Rock Shelter, Northern Australia: Part I, Experimental Design and Statistical Models. Archaeometry 41 (2), 339–364. doi:10.1111/j.1475-4754.1999.tb00987.x
Geoge, A. D., Marshallsea, S. J., Wyrwoll, K.-H., Chen, J., and Lu, Y. (2001). Miocene Cooling in the Northern Qilian Shan, Northeastern Margin of the Tibetan Plateau, Revealed by Apatite Fission-Track and Vitrinite-Reflectance Analysis. Geology 29, 939–942. doi:10.1130/0091-7613(2001)0290939:
Hanks, T. C., Bucknam, R. C., Lajoie, K. R., and Wallace, R. E. (1984). Modification of Wave-Cut and Faulting-Controlled Landforms. J. Geophys. Res. 89 (B7), 5771–5790. doi:10.1029/jb089ib07p05771
Hetzel, R., Tao, M., Niedermann, S., Strecker, M. R., Ivy-Ochs, S., Kubik, P. W., et al. (2004a). Implications of the Fault Scaling Law for the Growth of Topography: Mountain Ranges in the Broken Foreland of north-east Tibet. Terra Nova 16 (3), 157–162. doi:10.1111/j.1365-3121.2004.00549.x
Hetzel, R., Tao, M., Stokes, S., Niedermann, S., Lvy-Ochs, S., Gao, B., et al. (2004b). Late Pleistocene/Holocene Slip Rate of the Zhangye Thrust (Qilian Shan, China) and Implications for the Active Growth of the Northeastern Tibetan Plateau. Tectonics 23 (6), 159–163. doi:10.1029/2004tc001653
Hu, X., Chen, D., Pan, B., Chen, J., Zhang, J., Gong, C., et al. (2019a). Sedimentary Evolution of the Foreland basin in the NE Tibetan Plateau and the Growth of the Qilian Shan since 7 Ma. Geol. Soc. America Bull. 131, 1744–1760. doi:10.1130/b35106.1
Hu, X., Pan, B., Kirby, E., Gao, H., Hu, Z., Cao, B., et al. (2015). Rates and Kinematics of Active Shortening along the Eastern Qilian Shan, China, Inferred from Deformed Fluvial Terraces. Tectonics 34 (12), 2478–2493. doi:10.1002/2015tc003978
Hu, X., Pan, B., Kirby, E., Li, Q., Geng, H., and Chen, J. (2010). Spatial Differences in Rock Uplift Rates Inferred from Channel Steepness Indices along the Northern Flank of the Qilian Mountain, Northeast Tibetan Plateau. Chin. Sci. Bull. 55 (27), 3205–3214. doi:10.1007/s11434-010-4024-4
Hu, X., Wen, Z., Pan, B., Guo, L., and Cao, X. (2019b). Constraints on Deformation Kinematics across the Yumu Shan, NE Tibetan Plateau, Based on Fluvial Terraces. Glob. Planet. Change 182 (Nov.), 103023–103023.10. doi:10.1016/j.gloplacha.2019.1030231
Huang, X. N. (2021). Re-evaluating the Surface Rupture and Slip Distribution of the AD 1609 M7.25 Hongyapu Earthquake along the Northern Margin of the Qilian Shan, NW China: Implications for Thrust Fault Rupture Segmentation. Front. Earth Sci. 9, 633820.doi:10.3389/feart.2021.633820
Lei, J., Li, Y., Oskin, M. E., Wang, Y., Xiong, J., Xin, W., et al. (2020). Segmented Thrust Faulting: Example from the Northeastern Margin of the Tibetan Plateau. J. Geophys. Res. Solid Earth 125, e2019JB018634. doi:10.1029/2019JB018634
Li, Y., and Yang, J. (1998). Tectonic Geomorphology in the Hexi Corridor, north‐west China. Basin Res. 10 (3), 345–352. doi:10.1046/j.1365-2117.1998.00070.x
Liu, D., Yan, M., Fang, X., Li, H., Song, C., and Dai, S. (2011). Magnetostratigraphy of Sediments from the Yumu Shan, Hexi Corridor and its Implications Regarding the Late Cenozoic Uplift of the NE Tibetan Plateau. Quat. Int. 236 (1-2), 13–20. doi:10.1016/j.quaint.2010.12.007
Liu, Y., Zhang, G., Zhang, Y., and Shan, X. (2018). Source Parameters of the 2016 Menyuan Earthquake in the Northeastern Tibetan Plateau Determined from Regional Seismic Waveforms and InSAR Measurements. J. Asian Earth Sci. 158, 103–111. doi:10.1016/j.jseaes.2018.02.009
Lu, Y. C., Wang, X. L., and Wintle, A. G. (2007). A New OSL Chronology for Dust Accumulation in the Last 130,000 Yr for the Chinese Loess Plateau. Quat. Res. 67, 152–160. doi:10.1016/j.yqres.2006.08.003
Métivier, F., Gaudemer, Y., Tapponnier, P., and Meyer, B. (1998). Northeastward Growth of the Tibet Plateau Deduced from Balanced Reconstruction of Two Depositional Areas: The Qaidam and Hexi Corridor Basins, China. Tectonics 17, 823–842. doi:10.1029/98tc02764
Meyer, B., Tapponnier, P., Bourjot, L., Métivier, F., Gaudemer, Y., Peltzer, G., et al. (1998). Crustal Thickening in Gansu-Qinghai, Lithospheric Mantle Subduction, and Oblique, Strike-Slip Controlled Growth of the Tibet Plateau. Geophys. J. Int. 135, 1–47. doi:10.1046/j.1365-246x.1998.00567.x
Molnar, P., Anderson, R. S., and Anderson, S. P. (2007). Tectonics, Fracturing of Rock, and Erosion. J. Geophys. Research-Earth Surf. 112, F03014. doi:10.1029/2005jf000433
Molnar, P., and Tapponnier, P. (1975). Cenozoic Tectonics of Asia: Effects of a Continental Collision: Features of Recent continental Tectonics in Asia Can Be Interpreted as Results of the India-Eurasia Collision. Science 189 (4201), 419–426. doi:10.1126/science.189.4201.419
Montgomery, D. R., and Brandon, M. T. (2002). Topographic Controls on Erosion Rates in Tectonically Active Mountain Ranges. Earth Planet. Sci. Lett. 201 (3-4), 481–489. doi:10.1016/s0012-821x(02)00725-2
Mueller, K. (2017). Variation in Slip Rates on Active Faults: Natural Growth or Stress Transients?. Geology 45 (3), 287–288. doi:10.1130/focus032017.1
Nicol, A., Walsh, J., Berryman, K., and Nodder, S. (2005). Growth of a normal Fault by the Accumulation of Slip over Millions of Years. J. Struct. Geology. 27 (2), 327–342. doi:10.1016/j.jsg.2004.09.002
Palumbo, L., Hetzel, R., Tao, M., Li, X., and Guo, J. (2009). Deciphering the Rate of Mountain Growth during Topographic Presteady State: An Example from the NE Margin of the Tibetan Plateau. Tectonics 28 (4), a–n. doi:10.1029/2009TC002455
Pan, B., Gao, H., Wu, G., Li, J., Li, B., and Ye, Y. (2007). Dating of Erosion Surface and Terraces in the Eastern Qilian Shan, Northwest China. Earth Surf. Process. Landforms 32, 143–154. doi:10.1002/esp.1390
Pan, B., Hu, X., Gao, H., Hu, Z., Cao, B., Geng, H., et al. (2013). Late Quaternary River Incision Rates and Rock Uplift Pattern of the Eastern Qilian Shan Mountain, China. Geomorphology 184 (430), 84–97. doi:10.1016/j.geomorph.2012.11.020
Prescott, J., and Hutton, J. (1994). Cosmic ray Contributions to Dose Rates for Luminescence and ESR Dating: Large Depths and Long-Term Time Variations. Radiat. Meas. 23 (2-3), 497–500. doi:10.1016/1350-4487(94)90086-8
Reiners, P. W., and Brandon, M. T. (2006). Using Thermochronology to Understand Orogenic Erosion. Annu. Rev. Earth Planet. Sci. 34, 419–466. doi:10.1146/annurev.earth.34.031405.125202
Schlische, R. W., Young, S. S., Ackermann, R. V., and Gupta, A. (1996). Geometry and Scaling Relations of a Population of Very Small Rift-Related normal Faults. Geol 24, 683–686. doi:10.1130/0091-7613(1996)024<0683:gasroa>2.3.co;2
Su, Q., Yuan, D., Zhang, H., Manopkawee, P., Zhan, Y., Zhang, P., et al. (2019). Geomorphic Evidence for Northeastward Expansion of the Eastern Qilian Shan, Northeastern Tibetan Plateau. J. Asian Earth Sci. 177, 314–323. doi:10.1016/j.jseaes.2019.04.003
Tapponnier, P., and Molnar, P. (1977). Active Faulting and Tectonics in China. J. Geophys. Res. 82 (20), 2905–2930. doi:10.1029/jb082i020p02905
Tapponnier, P., Zhiqin, X., Roger, F., Meyer, B., Arnaud, N., Wittlinger, G., et al. (2001). Oblique Stepwise Rise and Growth of the Tibet Plateau. Science 294, 1571–1677. doi:10.1126/science.105978
Walker, R. T., and Fattahi, M. (2011). A Framework of Holocene and Late Pleistocene Environmental Change in Eastern Iran Inferred from the Dating of Periods of Alluvial Fan Abandonment, River Terracing, and lake Deposition. Quat. Sci. Rev. 30 (9-10), 1256–1271. doi:10.1016/j.quascirev.2011.03.004
Wallace, R. E. (1977). Profiles and Ages of Young Fault Scarps, north-central Nevada. Geol. Soc. America Bull. 88 (9), 1267–1281. doi:10.1130/0016-7606(1977)88<1267:paaoyf>2.0.co;2
Walsh, J. J., and Watterson, J. (1987). Distributions of Cumulative Displacement and Seismic Slip on a Single normal Fault Surface. J. Struct. Geology. 9, 1039–1046. doi:10.1016/0191-8141(87)90012-5
Wang, H., Liu-Zeng, J., Ng, A. H.-M., Ge, L., Javed, F., Long, F., et al. (2017). Sentinel-1 Observations of the 2016 Menyuan Earthquake: A Buried Reverse Event Linked to the Left-Lateral Haiyuan Fault. Int. J. Appl. Earth Observation Geoinformation 61, 14–21. doi:10.1016/j.jag.2017.04.011
Wang, X., Lu, Y., and Zhao, H. (2006). On the Performances of the Single-Aliquot Regenerative-Dose (SAR) Protocol for Chinese Loess: fine Quartz and Polymineral Grains. Radiat. Measurements 41 (1), 1–8. doi:10.1016/j.radmeas.2005.02.010
Willett, S. D., and Brandon, M. T. (2002). On steady states in mountain belts. Geology 30 (2), 175–178. doi:10.1130/0091-7613(2002)0302.0.CO;2
Wang, Y. Z., Zhang, H. P., Zheng, D. W., Zheng, W. J., Zhang, Z. Q., Wang, W. T., et al. (2014). Controls on Decadal Erosion Rates in Qilian Shan: Re-evaluation and New Insights into Landscape Evolution in north-east Tibet. Geomorphology 223, 117–128. doi:10.1016/j.geomorph.2014.07.002
Xiong, J., Li, Y., Zhong, Y., Lu, H., Lei, J., Xin, W., et al. (2017). Latest Pleistocene to Holocene Thrusting Recorded by a Flight of Strath Terraces in the Eastern Qilian Shan, NE Tibetan Plateau. Tectonics 36 (12), 2973–2986. doi:10.1002/2017tc004648
Xu, X., Yeats, R. S., and Yu, G. (2010). Five Short Historical Earthquake Surface Ruptures Near the Silk Road, Gansu Province, China. Bull. Seismological Soc. America 100 (2), 541–561. doi:10.1785/0120080282
Yang, H., Yang, X., Huang, X., Li, A., Huang, W., and Zhang, L. (2018). New Constraints on Slip Rates of the Fodongmiao-Hongyazi Fault in the Northern Qilian Shan, NE Tibet, from the 10Be Exposure Dating of Offset Terraces. J. Asian Earth Sci. 151, 131–147. doi:10.1016/j.jseaes.2017.10.034
Yuan, D. Y., Zhang, P,Z., Liu, B. C., Gan, W. J., Mao, F. Y., Wang, Z. C., et al. (2004). Geometrical Imagery and Tectonic Transformation of Late Quaternary Active Tectonics in Northeastern Margin of Qinghai-Xizang Plateau. ActaGeologicaSinica 78 (2), 278–287.
Zhang, H., Zhang, P., Prush, V., Zheng, D., Zheng, W., Wang, W., et al. (2017). Tectonic Geomorphology of the Qilian Shan in the Northeastern Tibetan Plateau: Insights into the Plateau Formation Processes. Tectonophysics 706-707, 103–115. doi:10.1016/j.tecto.2017.04.016
Zhang, P.-Z., Shen, Z., Wang, M., Gan, W., Bürgmann, R., Molnar, P., et al. (2004). Continuous Deformation of the Tibetan Plateau from Global Positioning System Data. Geol 32 (9), 809–812. doi:10.1130/g20554.1
Zheng, D., Clark, M. K., Zhang, P., Zheng, W., and Farley, K. A. (2010). Erosion, Fault Initiation and Topographic Growth of the North Qilian Shan (Northern Tibetan Plateau). Geosphere 6, 937–941. doi:10.1130/ges00523.1
Zheng, W.-J., Zhang, P.-Z., Ge, W.-P., Molnar, P., Zhang, H.-P., Yuan, D.-Y., et al. (2013b). Late Quaternary Slip Rate of the South Heli Shan Fault (Northern Hexi Corridor, NW China) and its Implications for Northeastward Growth of the Tibetan Plateau. Tectonics 32, 271–293. doi:10.1002/tect.20022
Zheng, W. J., Zhang, Z. Q., Zhang, P. Z., Liu, X. W., Guo, X., Pang, J. Z., et al. (2013a). Seismogenic Structure and Mechanism of the 1954 M 7 (1/4) Shandan Earthquake, Gansu Province, Western China. Chin. J. Geophys. 56 (3), 916–928. (In Chinese with English abstract). doi:10.6038/cjg20130320
Zhong, Y., Xiong, J., Li, Y., Zheng, W., Zhang, P., Lu, H., et al. (2020). Constraining Late Quaternary Crustal Shortening in the Eastern Qilian Shan from Deformed River Terraces. J. Geophys. Research-Solid Earth 125 (9), e2020JB020631. doi:10.1029/2020jb020631
Keywords: thrusting, uplifting, slip rate, slip pattern, relation between faults, deformation propagation
Citation: Jinghao L, Youli L, Zhikun R, Xiu H, Jianguo X, Fei L and Jinrui L (2021) Variable Thrust Rates of the Eastern Qilianshan Mountain Front, Northeastern Margin of the Tibet Plateau and Its Implication to the Topography of the Yongchangnan Shan. Front. Earth Sci. 9:622568. doi: 10.3389/feart.2021.622568
Received: 28 October 2020; Accepted: 07 May 2021;
Published: 26 May 2021.
Edited by:
Maryline Le Béon, National Central University, TaiwanReviewed by:
Xiaofei Hu, Lanzhou University, ChinaJean-Daniel Champagnac, University of Lausanne, Switzerland
Copyright © 2021 Jinghao, Youli, Zhikun, Xiu, Jianguo, Fei and Jinrui. This is an open-access article distributed under the terms of the Creative Commons Attribution License (CC BY). The use, distribution or reproduction in other forums is permitted, provided the original author(s) and the copyright owner(s) are credited and that the original publication in this journal is cited, in accordance with accepted academic practice. No use, distribution or reproduction is permitted which does not comply with these terms.
*Correspondence: Ren Zhikun, rzk@ies.ac.cn